Embed Size (px)
Citation preview

Value of modeling in the Transmission Dynamics of Arbovirus
Diana Patricia Rojas, MD PhD
8th International Conference on Global Health
Miami, May 23rd 2018

• The study of contagion
• Who gets infected, by whom, at what rates? What are the impacts of control measures?
• Interested in temporal progression (dynamics)
What is Infectious Disease Dynamics?
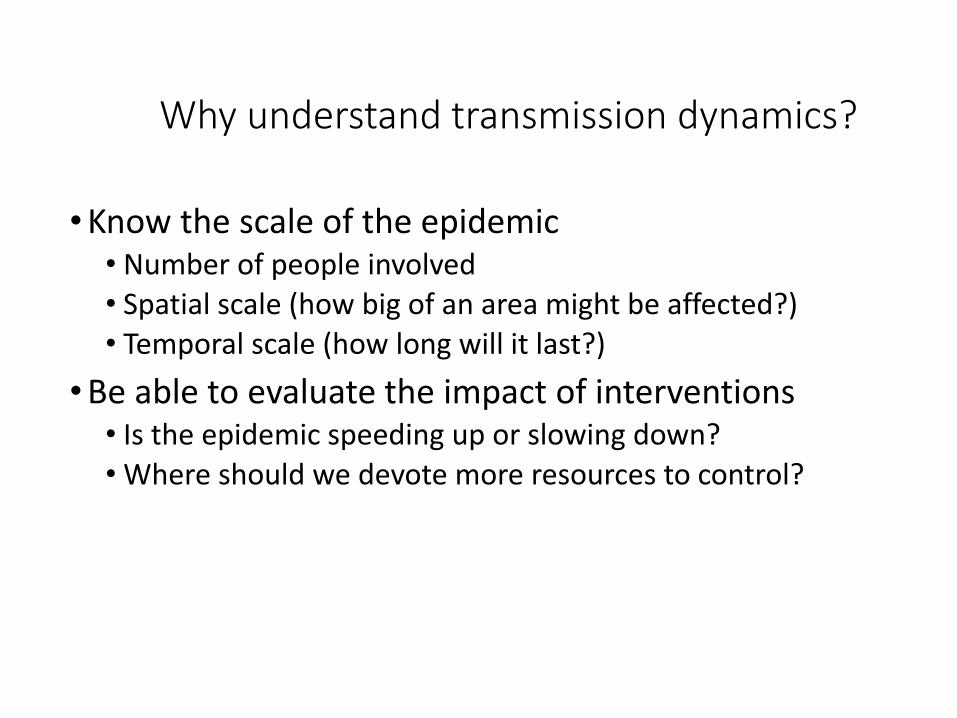
Why understand transmission dynamics?
•Know the scale of the epidemic• Number of people involved• Spatial scale (how big of an area might be affected?)• Temporal scale (how long will it last?)
•Be able to evaluate the impact of interventions• Is the epidemic speeding up or slowing down?• Where should we devote more resources to control?

COMPORTAMIENTO DENGUE – CHIK – ZIKA,
años 2008-2017*
* A semana epidemiológica 37 de 2017
Fuente: Sivigila 2017. Instituto Nacional de Salud, equipo ETV Zoonosis.Presentacion PAHO Octubre 2017.
Why do the cases increase to a certain speed?
Why did the outbreak stop?
What would happen if an intervention is
implemented?
TRENDS OF ARBOVIRAL DISEASES, COLOMBIA 2008-2017*

Asymptomatic infections or unapparent illness
Symptomatic casesSevere cases
Episurveillance
Iceberg of Arboviral infections

Applications of transmission dynamics in arbovirus

ART OF MODELING
Dana MaloneyFernando BoteroLeonardo da Vinci


Healthy
Infected
Immune
Modified from Ralph Frerichs, UCLA (http://www.ph.ucla.edu/epi/200/epi200_01.html)
Transmission of infectious diseases

1 2 3 4 5 6 7 Weeks
If the infected child gets in contact with others,
How many will get infected? Sick?How long would it take?
Modified from Ralph Frerichs, UCLA (http://www.ph.ucla.edu/epi/200/epi200_01.html)
If the transmission occurs, which factors of the
transmission process are more important determining the
speed of spread?

At least two things affect the speed of the
spread of an outbreak?
1. The number of people infected by
each infected individual
2. The time that it takes between one
person gets infected and when it is able
to infect others.
What does determine the incidence rate of an
infectious disease?

R0 estimations of different pathogens
Sarampion – 12
Tosferina – 15
Varicela – 9
Difteria – 4
Parotiditis – 10
Rubeola – 8
Anderson and May, 1991
Polio – 6
Viruela – 6
Influenza – 2
HIV – 5
Dengue – 4
R0 is specific for each pathogen and each setting (depends on the population density, social factors)

R and epidemic curve

Which is the R0 in this case?

The vector gets infected
Latent Infectious
Incubation Disease
Latent Infectious
Serial interval
Patient 1
Patient 2
Infection
Latent Infectious
Incubation Disease
Vector

Compartmental models

Spread of Zika virus in the Americas
Zhang, Q., Sun, K., Chinazzi, M., y Piontti, A. P., Dean, N. E., Rojas, D. P.,
... & Bray, M. (2017). Spread of Zika virus in the Americas. Proceedings of
the National Academy of Sciences, 114(22), E4334-E4343.


Exploratory analysis
Did the introduction of ZIKV impact DENV transmission in the Americas?

0
2000
4000
6000
8000
10000
12000
14000
16000
18000
20000
0
20000
40000
60000
80000
100000
120000
ZIK
V a
nd
CH
KV
ca
ses
DEN
V c
ase
s
Confirmed cases - DENV, CHKV, ZIKV in Brazil
DENV
CHKV
ZIKV

shared effect
Roraima
Amapá
Pará
Amazonas
Acre
Tocantins
Rondônia
Maranhão
Rio Grande do Norte
Ceará
Paraíba
Piauí
Pernambuco
Alagoas
Sergipe
Bahia
Minas Gerais
Espírito Santo
Rio de Janeiro
São Paulo
Mato Grosso
Distrito Federal
Goiás
Mato Grosso do Sul
Paraná
Santa Catarina
Rio Grande do Sul
−0.2 0.0 0.2 0.4Zika coefficient
−0.25 0.00 0.25chikungunya coefficient
ZIKV-CHIKV coefficients-Brazil

COMPORTAMIENTO DENGUE – CHIK – ZIKA,
años 2008-2017*
* A semana epidemiológica 37 de 2017
Fuente: Sivigila 2017. Instituto Nacional de Salud, equipo ETV Zoonosis.Presentacion PAHO Octubre 2017.
Trends of arboviral diseases, Colombia2008-2017*

shared effectArchipiélago de San Andrés
La GuajiraAtlántico
MagdalenaCesarSucre
BolívarCórdoba
ChocóNorte de Santander
AntioquiaSantander
BoyacáRisaralda
CaldasCundinamarca
QuindioTolima
Valle del CaucaCauca
HuilaNariñoArauca
CasanareVichada
MetaGuainía
GuaviareCaquetá
PutumayoAmazonas
−0.1 0.0 0.1 0.2 0.3Zika coefficient
0.0 0.1 0.2chikungunya coefficient
ZIKV-CHIKV coefficients-Colombia

Future steps
Development and validation of models to explore:
• Characterize historical and recent transmission of arbovirus analyzing the time-series data that will allow to model possible future transmission scenarios.
• Establish if the emergence of Zika in Brazil might be related to recent changes in dengue dynamics (Cross-protection and/or enhancement).
• Test hypothesis about the possible relationship of yellow fever vaccine coverage and Zika severe outcomes so, if we can have access to YF vaccine coverage, we might also be able to test this.
• Other hypothesis

Projected Impact of Indoor
Residual Spraying in Yucatán,
Mexico
Hladish, T. J., Rojas, D. P., & Longini, I. M. (In Press) in Plos Neglected Tropical Diseases.

Epidemic and synthetic population model structures.
Hladish TJ, Pearson CAB, Chao DL, Rojas DP, Recchia GL, et al. (2016) Projected Impact of Dengue Vaccination in Yucatán, Mexico. PLOS Neglected Tropical Diseases 10(5): e0004661. https://doi.org/10.1371/journal.pntd.0004661http://journals.plos.org/plosntds/article?id=10.1371/journal.pntd.0004661

Mosquito movement
1km censored Delaunay
triangulation
Hladish et al. PLOS NTDs (2016)

Reconstruct the past,forecast the future
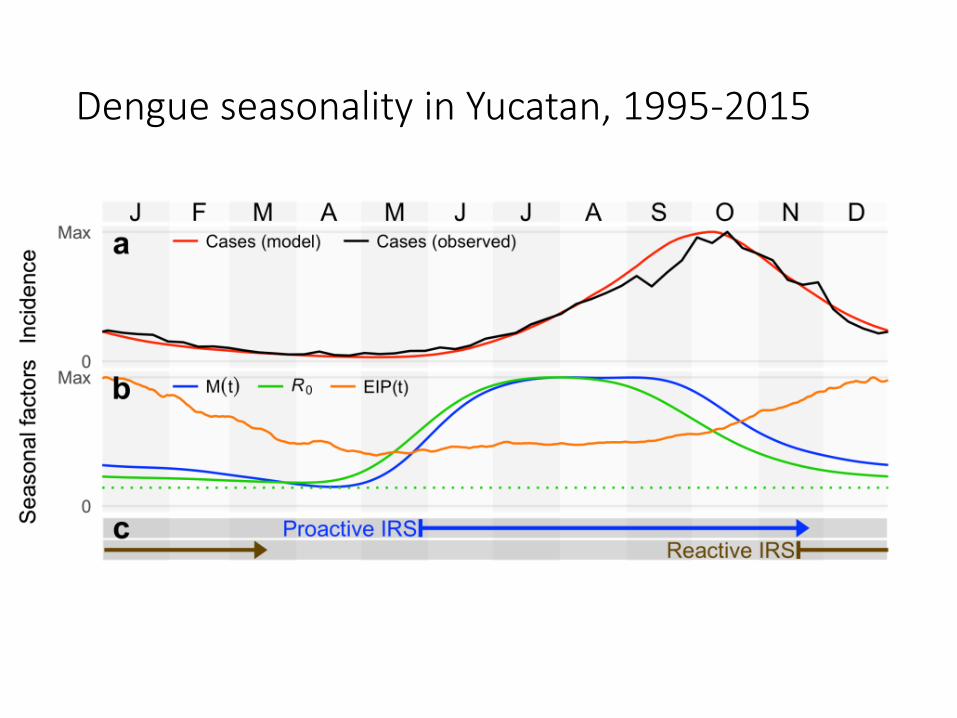
Dengue seasonality in Yucatan, 1995-2015

Indoor residual spraying*
• Coverage: Treat 25/50/75% of houses per year
• Efficacy: 80% reduction in equilibrium pop size in treated houses• Corresponds to 13% daily mortality due to IRS
• Treatment lasts 90 days
Campaigns last 1/90/365 days
52 different start dates (1 and 90 day campaigns)
*Efficacy & durability based on Vazquez-Prokopec et al, Science Advances (2017)

Simulated impact of IRS (90-day campaign, 90-day durability, late May start)

Population immunity drives long-term IRS effectiveness

Effectiveness decreases for 15 years, then levels out. Why?
(90-day campaign, 90-day durability, optimal timing: late May start)
Greatestpractical
importance
Important forunderstanding dynamics

Other applications of modeling on transmission dynamics of Arbovirus
Design cluster randomized trials for new technologies for vector control with epidemiological measures:
• Wolbachia
• Irradiated mosquitoes
• Dispersing stations of Pyriproxyfen
• Sterile mosquitoes to reduce the density of Aedes aegypti

Fred Hutchinson Cancer Research Center - UW
• M. Elizabeth Halloran
University of Florida
• Ira M. Longini
• Tom Hladish
• Natalie Dean
Emory University
• Gonzalo Vasquez-Prokopec
Northeastern University
• Alex Vespigniani ‘s group
Funding: NIGMS MIDAS U54, NIAID R01’s and R37Fulbright-Colciencias scholarship
Acknowledgments

THANK [email protected]