Embed Size (px)
DESCRIPTION
Operations, VSM
Citation preview
Value Stream Mapping
Introduction
• See the flow / stream for yourself
• Design future state value stream

What is Value Stream
• Graphic
representation of the trial of activities that occur from the moment a request is made until the moment that the request is
satisfied
• Allow better understanding & evaluation of the processes of daily work
• Objectively visualizing
what adds and what does not adds value by providing elemental information obtained by direct observation
• As you eliminate wastes, you create capacity, decrease worker frustration, and most importantly, develop a means for quicker, safer delivery of the care a patient request

Ideal State in Healthcare
Goals you consider unachievable
100% of the time?
Ideal State in Healthcare
1.
Defect free delivery• exactly what the patient needs• Defect free is not a norm in service industry (To Err is Human)
2.
No wastes in the system• Anything that does not add value to the patient or the process
3.
Individual attention to each patient• Without focus, rework are more likely to complicate or delay the
delivery of care• Design standardized processes that support he flexibility of
professional care
4.
Immediate response to problems• Defining what is expected of a system allows workers to
recognize errors and trigger and immediate response to that failure
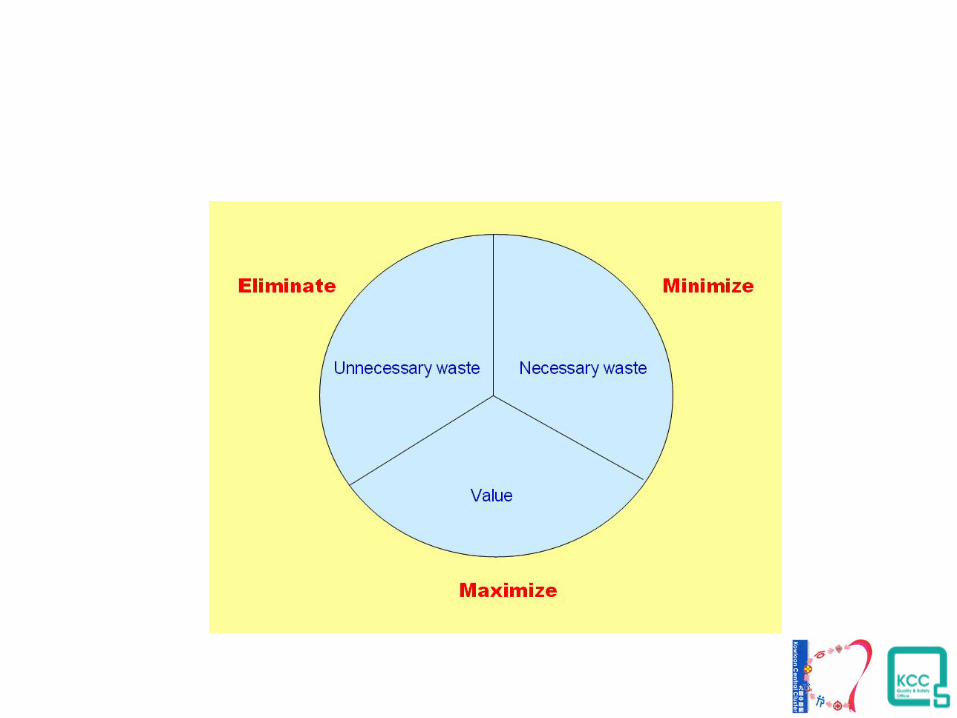
Wastes• The elements that add no value
but wastes
costs and time
Remember:
Waste is only a symptom, not the root
cause
Wastes points to problems within a
system
Need to find and address causes of wastes
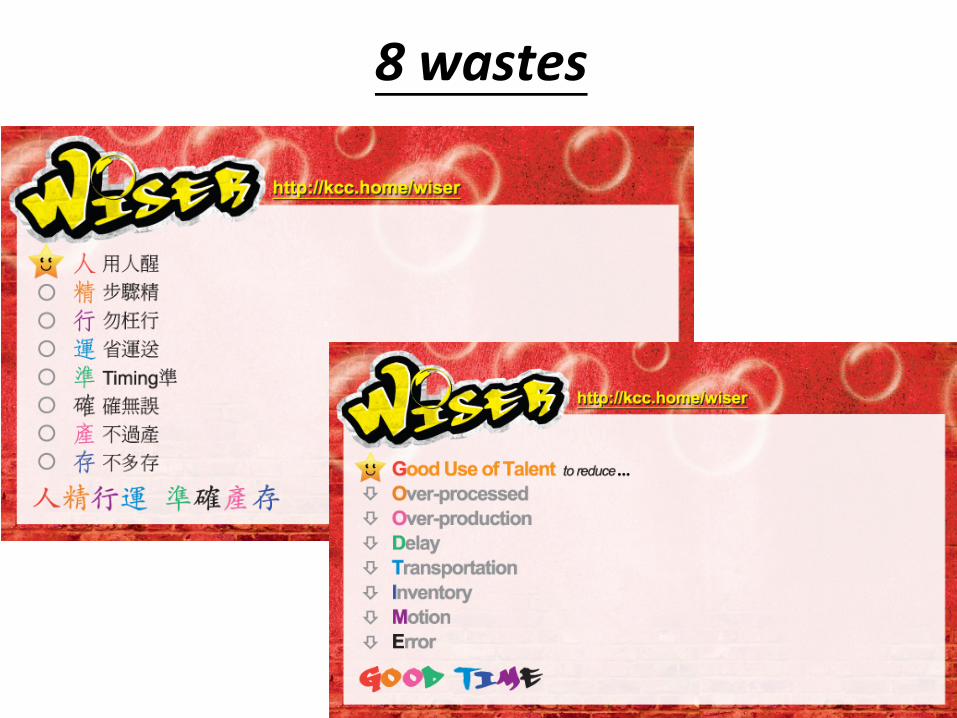
8 wastes

4 rules for healthcare processes
1.
Clearly specify all activities of work
2.
All steps in a request are simple and direct
3.
The flow of steps required to deliver a request is simple and direct
4.
All problems are addressed directly and in a timely way, under the guidance of a coach

Rule 1
• the activities of work within a process should be clearly defined as to what should happen, in what order
they should occur, and how long
the activities should take to complete.
• It also states that the outcome or goal of the work must be absolutely clear to the people doing the work.
Rule 2
• This rule points to the complexity and variety of ways that a service or product can be
requested.
• The goal is that the request process be simple (i.e., with as few steps as possible) and direct (i.e., the requestor gets as close as possible to the person who can offer the service or
deliver the product).

Rule 3
• The goal is to use as few steps and as few people as possible to produce the highest possible quality
• Is this activity necessary to produce an ideal outcome?
Rule 4
• no error, once identified, will be allowed to be repeated
• In order for this rule to be used to its maximum effect, you must have a way to look
at process failures that will quickly and objectively expose where the failure occurred.
Anatomy of VSM
• Unlike conventional flowchart, wherein you might map how work is intended to happen
• With VSM you chart every step as it really happens
and each way that it may be
communicated
• Looks at (1) People, (2) material & (3)information flow
Anatomy of VSM
• The upper third is occupied by the requestor and the steps that comprise the request.
• The center section is for the process steps in answering the request.
• The bottom third is for the compilation of related data.
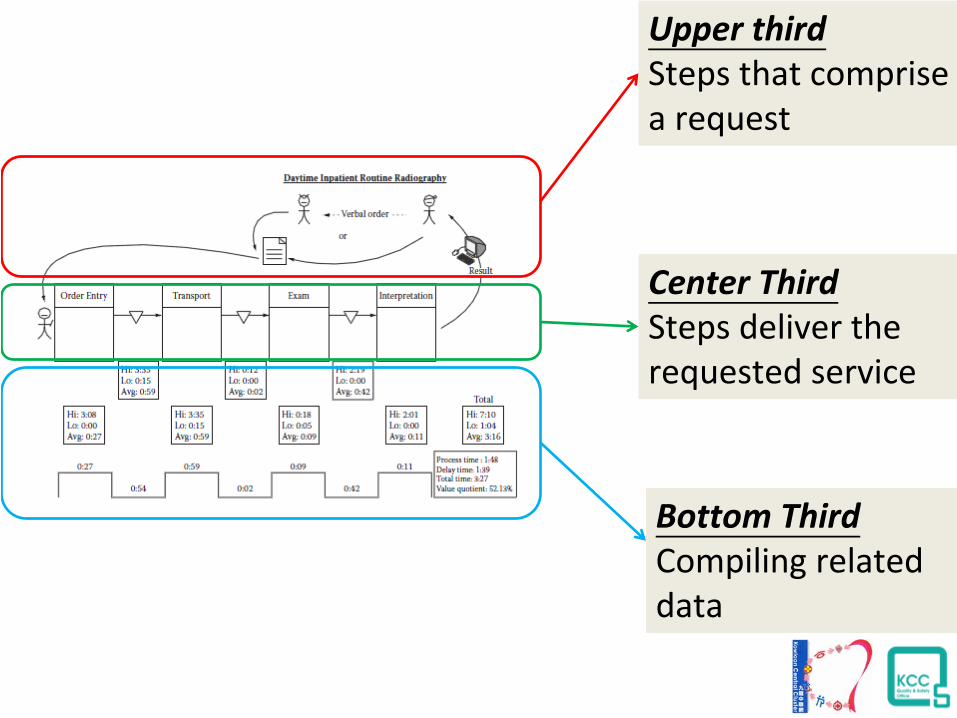
Upper thirdSteps that comprise
a request
Center ThirdSteps deliver the
requested service
Bottom ThirdCompiling related
data

Upper Third Steps That Comprise the Request
• The top third of the value stream map will reveal the often complicated and redundant
steps involved with initiating the delivery of a product or service
• Flow from right to left
Center Third Steps deliver the requested service
• Flow from left to right
• process boxes
‐
are drawn as vertical rectangles, with titles on the top of each box
• There are likely many activities that occur inside each process box to create that step,
• Preferably, write the activities in each box in the order in which they occur.
• Think of the boxes as having doors. Ask yourself, what is the first activity that opens the door to this process box and what
is the last activity that closes the door on that step?
Bottom Third Compiling related data
• Data are collated on the bottom third of a value stream map to add another layer of understanding beyond what you see initially
related to the flow of work activities.
• Although this data compilation does not have to be lengthy, it adds objectivity and emphasis to the assumptions you would develop by
looking at flow alone.
Current State Map
The rules for creating a current state map are simple, but creating it demands some rigor:
• The map can be finalized only when the entire process has been directly observed
• must be validated by the people who do the work, both for accuracy and to generate buy‐ in for upcoming improvements

Who to Involve
“start everywhere and include everybody!”
Frontline
• define frontline work as the work done day by day to accomplish the expectations of each
job
Preparing Everyone Involved
• They must know that this observation is not a criticizing or punitive event
• that the observer is looking at the process with an eye on improvement
• will ultimately improve the work environment
• workers being observed need to be actively engaged in the observation, not to interrupt their work, but
for them to be mindful of and signal to the observer small interruptions or variations in the process as the observation progresses.
Good Team
• Local management is informed about the process and expectations and eager to think outside the box
and try something new.
• Staffing is reasonably stable.• have physician support, if this is a clinical area or
process
• have a stable environment, meaning no other large initiatives are being introduced simultaneous to the improvement work
• Someone from the administrative team will “own” the efforts
Identify Problems
• Is this process necessary? What is its purpose and could it be done a better way?
• Are all the steps in the process necessary? Are they adding value? Are they done consistently? Do they involve the
fewest number of people? Are they generating and distributing complete information?
• Are all the activities within the process boxes happening in the same order? Are they happening in the best order
Identify Problems
• Are there redundant activities in some steps that could be eliminated? Can some of the activities in one box be done better in another box?
• Are the process boxes themselves in the best order? Is each one essential to the process? Can one or more be eliminated?
Can they be combined and streamlined without sacrificing quality for the patient?
• Is the information flow direct and simple? Is the information in each box original (not redundant) and can it be shared or
eliminated?
Adding Data to Current State Map
• Process engineering principles indicate that for process evaluation, 30 measurements
should be adequate to establish statistical significance.
• You want to observe something 30 times before assigning an average number to it.
Future State
• Defining the “future”
involves some thought. It is easy to confuse the future state with ideal.
• Remember that ideal is the gold standard for perfection toward which you are always
striving, but it may not be achievable in the current fiscal and technological state of your organization.
Future State Map
(1) be achievable
(2) move you closer to the ideal state

Being Realistic
Creating a map that reflects changes that can be realistically achieved on a defined timeline includes consideration of the
following:
1.
You have the human resources to make the changes happen
2.
You have leadership support of the improvement. (Where does this work fall in the strategic plan of the organization or
department? Who “owns”
it on the administrative team?)
3.
You have a realistic date for experimenting with new ideas and reflecting on changes.
4.
You are realistic in your consideration of constraints, such as cost and other initiatives scheduled on the unit.

Future State
four main techniques to design your future state. Just remember ECSS!
• Eliminate
• Combine
• Simplify
• Sequence
Future State
• Where possible, try to eliminate any process steps.
• If it isn’t possible to eliminate any steps, look to combine steps.
• After combining, consider where the system can be simplified.
• Once steps in the system have been have been eliminated, combined and simplified, review the
sequence of events to promote efficiency.
Future State
• The aim is to produce a service where each process step links seamlessly to the next, in the shortest
amount of time at the highest quality and safety by a group of staff with a high morale.
• Once the future state Value Stream Map is completed, it is then essential to review measures,
analyse
the gap between current and future state and then agree an action plan of PDCA cycles to trial
the changes. • Be clear about the purpose before designing the
process – then, organize the people!
Standard work to produce high quality every time
• Standard work is about establishing out of all the possible ways, the best work method of conducting
a task and then ensuring that everyone always works to this gold standard.
• The gold standard should have the least amount of waste, with the highest quality and safety. These
standard procedures create stability and consistency in the system to produce high performance results
every time.
three key elements to standardised work
• Takt time – how fast we should be working
• Work sequence – the order that work should be done
• Work in progress –
defining the working inventory to make abnormalities obvious.

• It is important to understand that standard work is not static. Standards are actually the basis for subsequent improvements. Once a better method is found, the team should
agree on the new standard, update the processes, procedures and visual
management and then ensure that it is adopted by all.
Standardised work:
• Ensures safety and maintains high quality and efficiency • Ensures process stability and therefore repeatability • Allows us to assess if we are in control, ahead or behind
schedule • Preserves the organisational expertise • Allows us to identify and rectify problems • Provides a gauge by which we can error proof for the future • Gives us a baseline from which to measure improvement and
continually strive for a better way • Provides a basis for employee training.

Understanding takt time
• Takt time is simply the rate at which we need to work to keep up with demand.
The calculation for takt time is:
(available_work_time)/(demand) = Takt Time
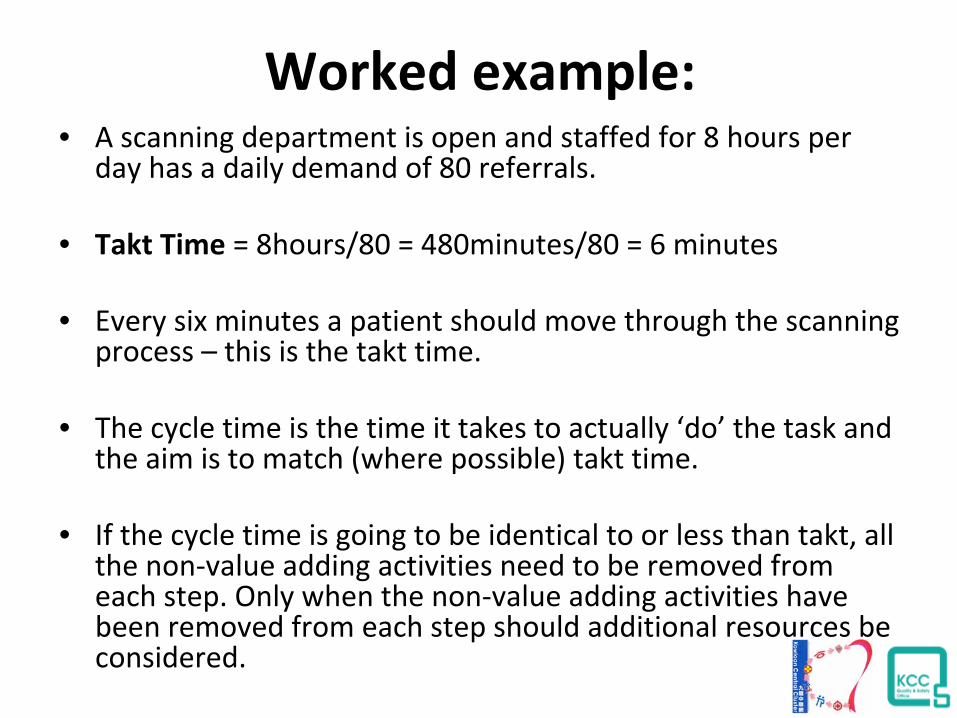
Worked example:• A scanning department is open and staffed for 8 hours per
day has a daily demand of 80 referrals.
• Takt Time
= 8hours/80 = 480minutes/80 = 6 minutes
• Every six minutes a patient should move through the scanning process – this is the takt time.
• The cycle time is the time it takes to actually ‘do’
the task and the aim is to match (where possible) takt time.
• If the cycle time is going to be identical to or less than takt,
all the non‐value adding activities need to be removed from
each step. Only when the non‐value adding activities have been removed from each step should additional resources be
considered.