Embed Size (px)
DESCRIPTION
What is Value Stream Mapping?
Citation preview
Value Stream Value Stream Value Stream Value Stream MappingMappingMappingMapping
2
Value Steam Mapping
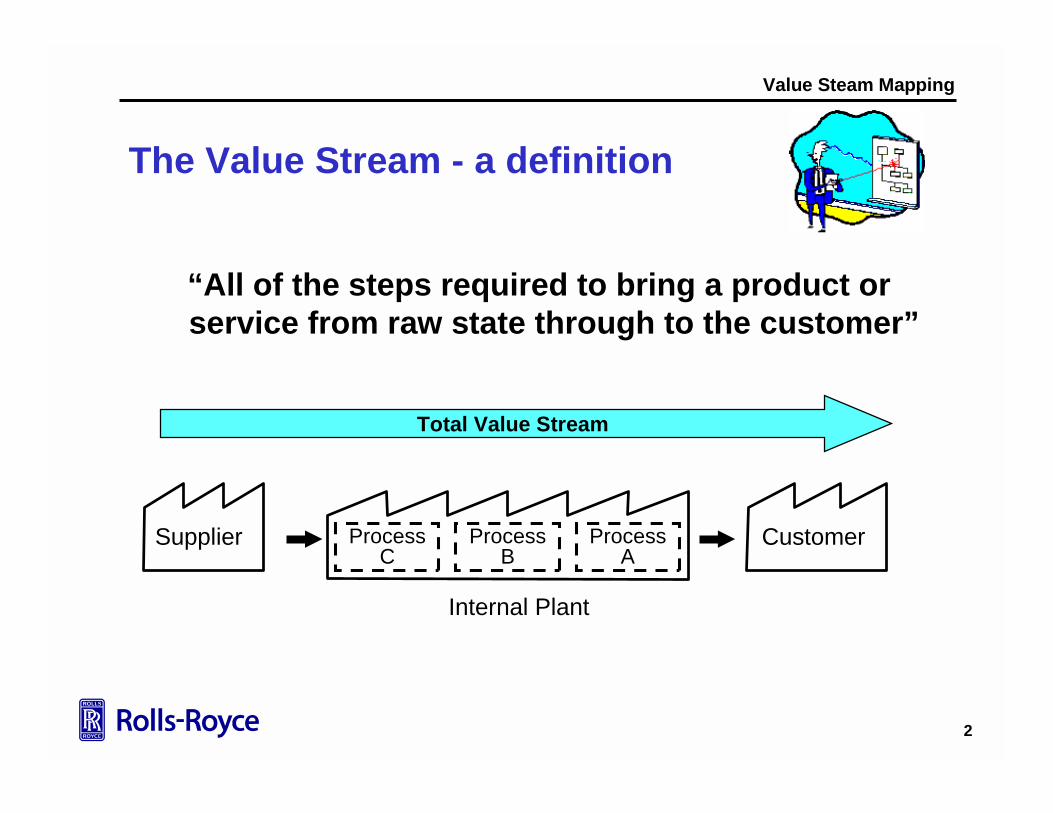
The Value Stream - a definition
“All of the steps required to bring a product or service from raw state through to the customer”
Total Value Stream
CustomerSupplier Process A
Process B
Process C
Internal Plant
3
Value Steam Mapping
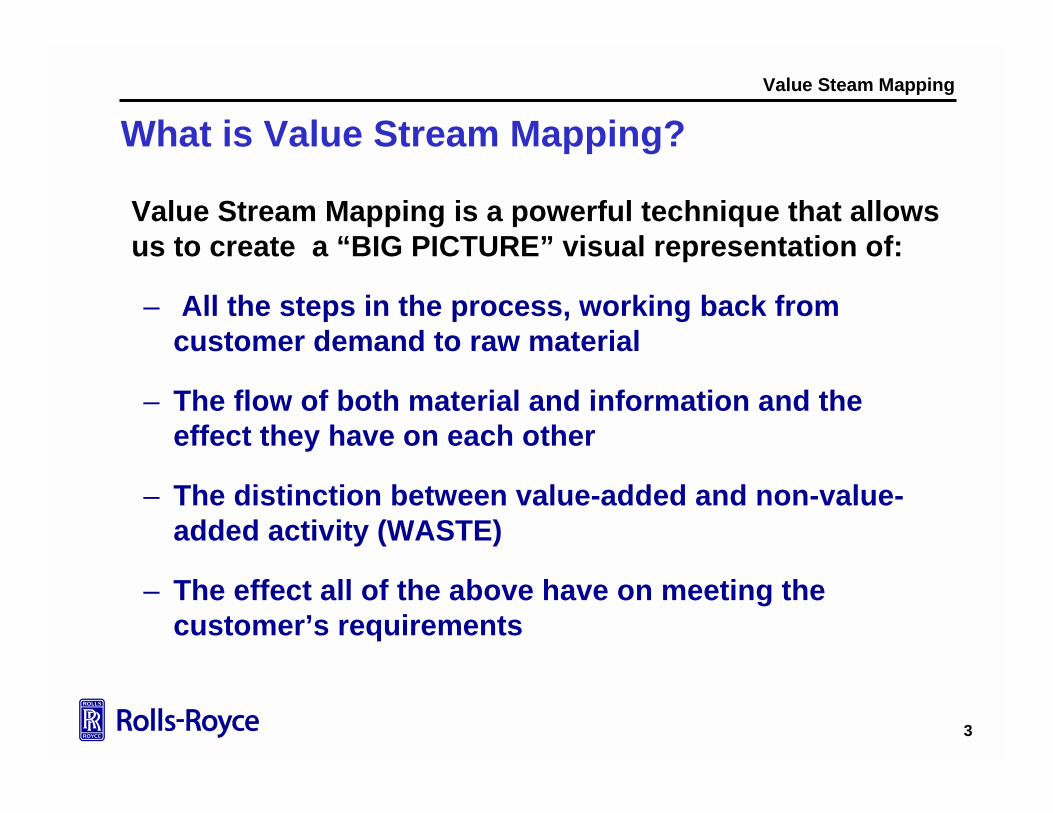
What is Value Stream Mapping?
Value Stream Mapping is a powerful technique that allows us to create a “BIG PICTURE” visual representation of:
– All the steps in the process, working back from customer demand to raw material
– The flow of both material and information and the effect they have on each other
– The distinction between value-added and non-value-added activity (WASTE)
– The effect all of the above have on meeting the customer’s requirements
4
Value Steam Mapping
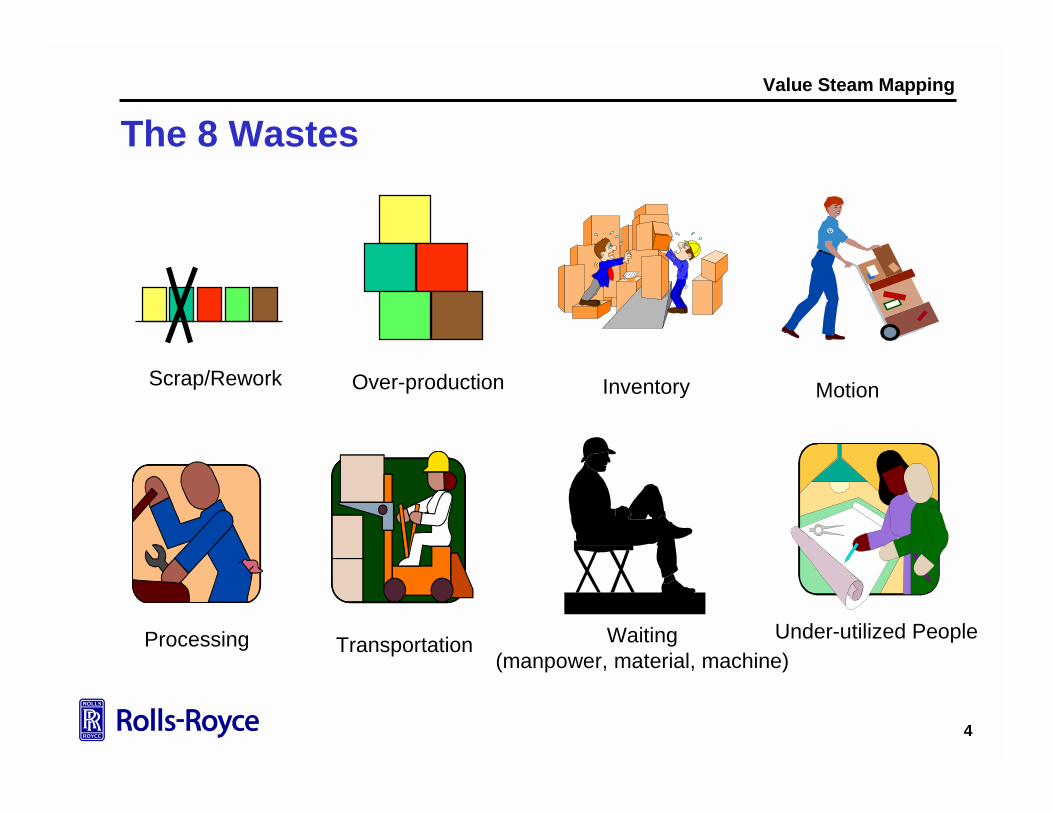
Under-utilized People
Over-production
Waiting(manpower, material, machine)
Transportation
InventoryScrap/Rework Motion
Processing
The 8 Wastes
5
Value Steam Mapping
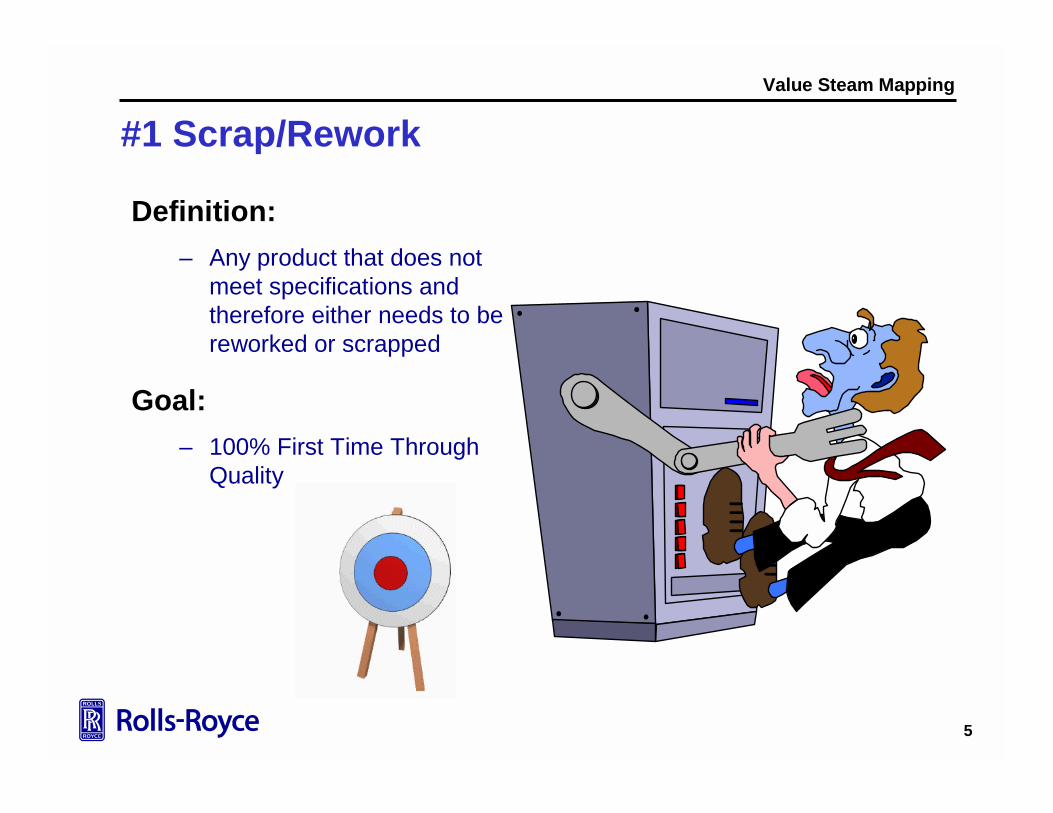
#1 Scrap/Rework
Definition:– Any product that does not
meet specifications and therefore either needs to be reworked or scrapped
Goal:– 100% First Time Through
Quality
6
Value Steam Mapping
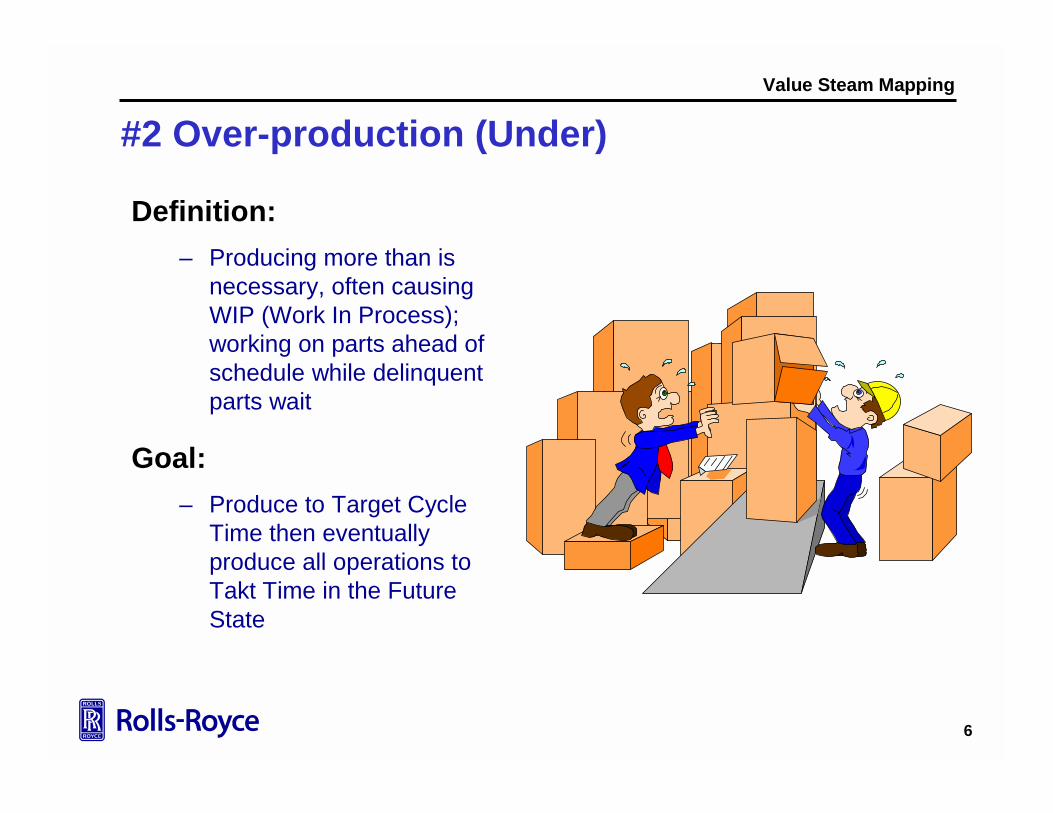
#2 Over-production (Under)
Definition:– Producing more than is
necessary, often causing WIP (Work In Process); working on parts ahead of schedule while delinquent parts wait
Goal:– Produce to Target Cycle
Time then eventually produce all operations to Takt Time in the Future State
7
Value Steam Mapping
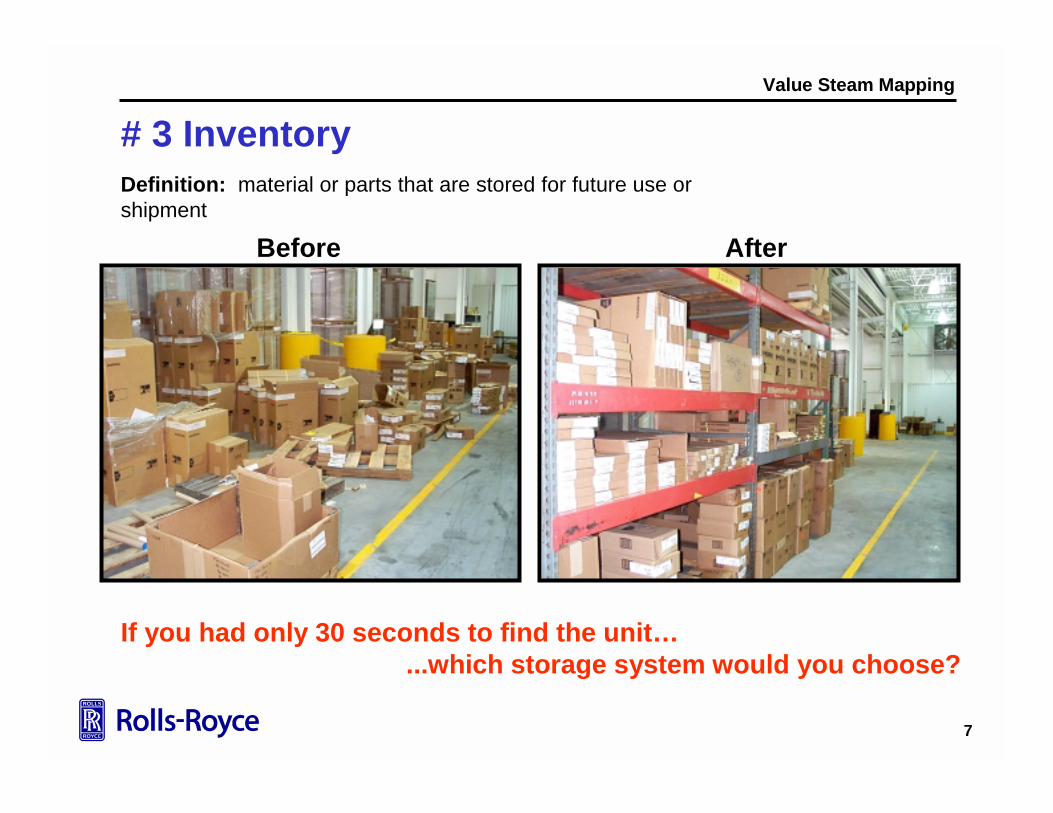
# 3 Inventory
Before After
If you had only 30 seconds to find the unit…...which storage system would you choose?
Definition: material or parts that are stored for future use or shipment
8
Value Steam Mapping
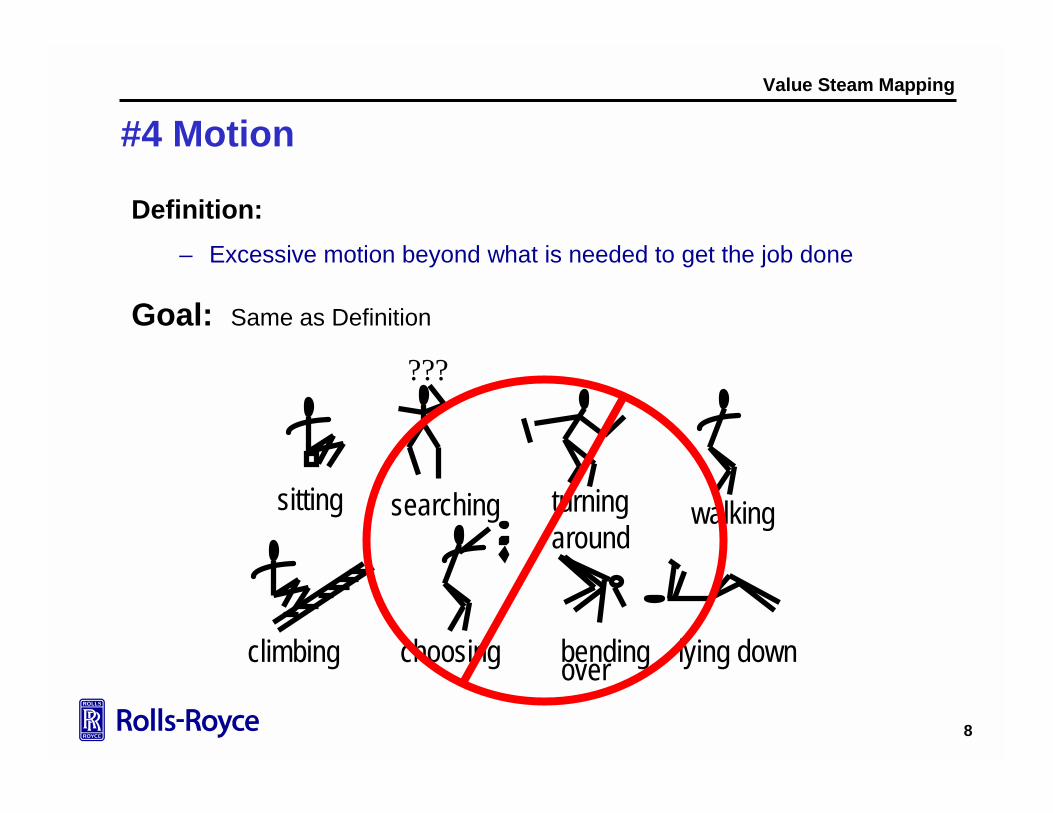
#4 Motion
Definition:– Excessive motion beyond what is needed to get the job done
Goal: Same as Definition
???
sitting walkingturning around
searching
climbing choosing bending lying downover
9
Value Steam Mapping
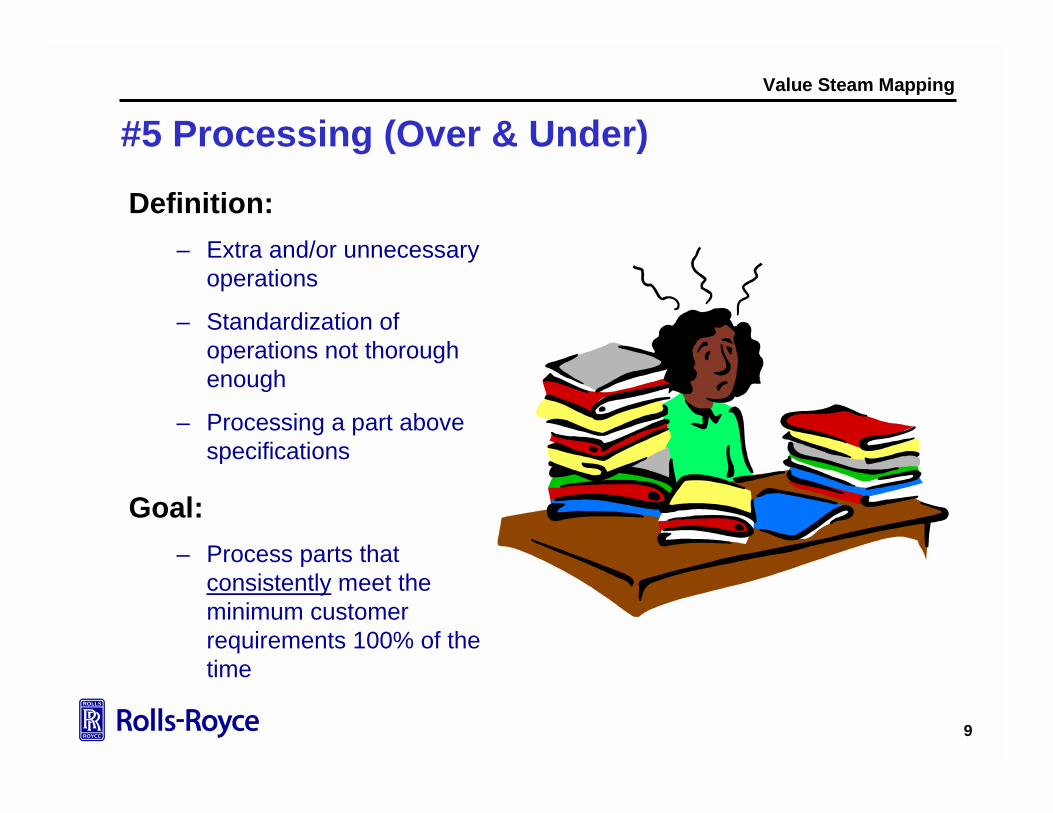
#5 Processing (Over & Under)
Definition:– Extra and/or unnecessary
operations
– Standardization of operations not thorough enough
– Processing a part above specifications
Goal:– Process parts that
consistently meet the minimum customer requirements 100% of the time
10
Value Steam Mapping
#6 Transportation
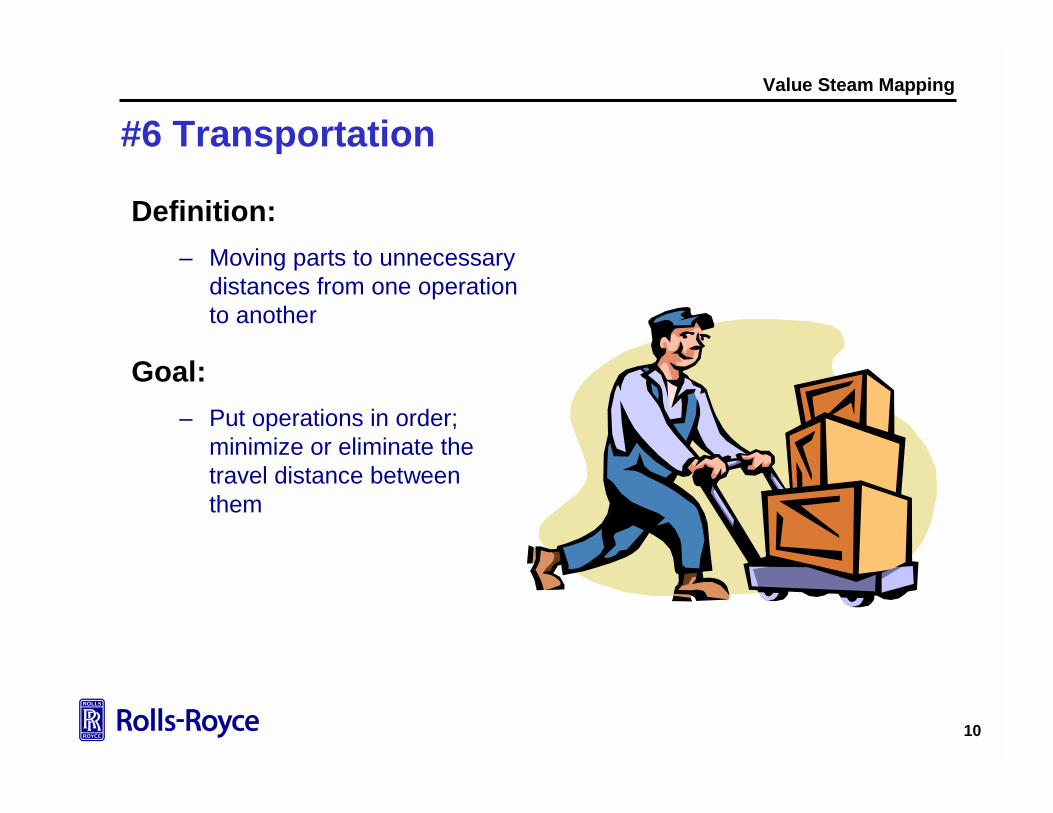
Definition:– Moving parts to unnecessary
distances from one operation to another
Goal:– Put operations in order;
minimize or eliminate the travel distance between them
11
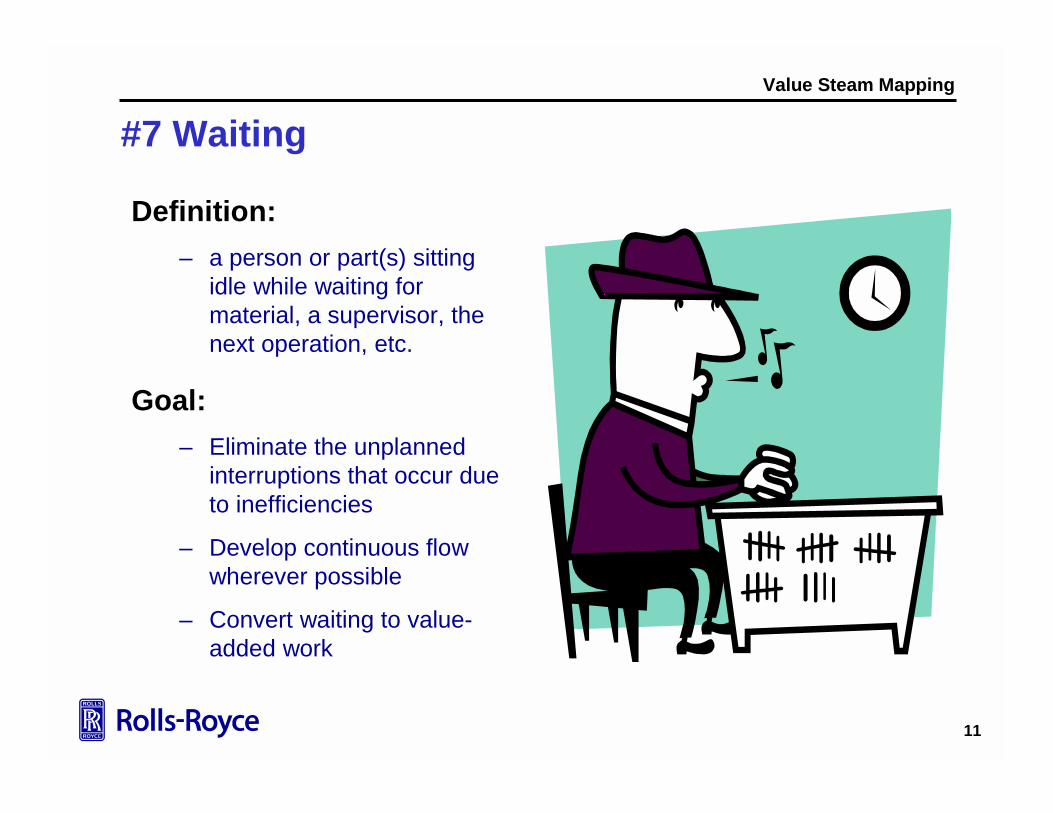
Value Steam Mapping
#7 Waiting
Definition:– a person or part(s) sitting
idle while waiting for material, a supervisor, the next operation, etc.
Goal:– Eliminate the unplanned
interruptions that occur due to inefficiencies
– Develop continuous flow wherever possible
– Convert waiting to value-added work
12
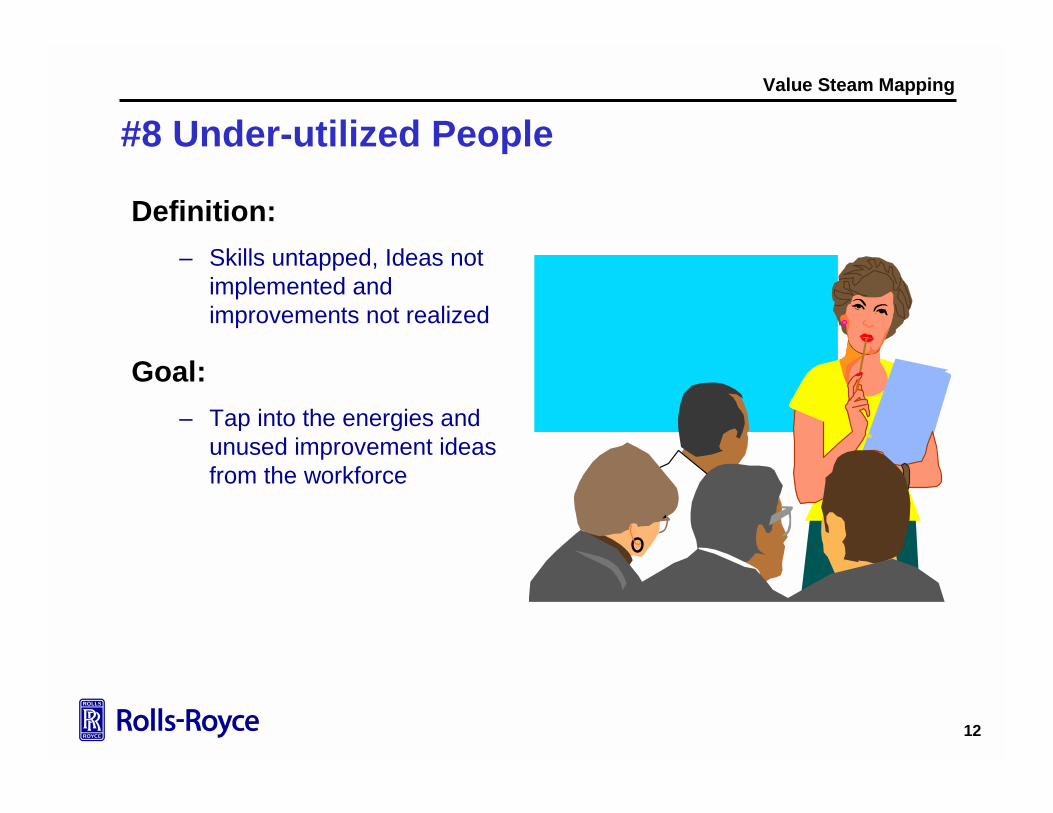
Value Steam Mapping
#8 Under-utilized People
Definition:– Skills untapped, Ideas not
implemented and improvements not realized
Goal:– Tap into the energies and
unused improvement ideas from the workforce
13
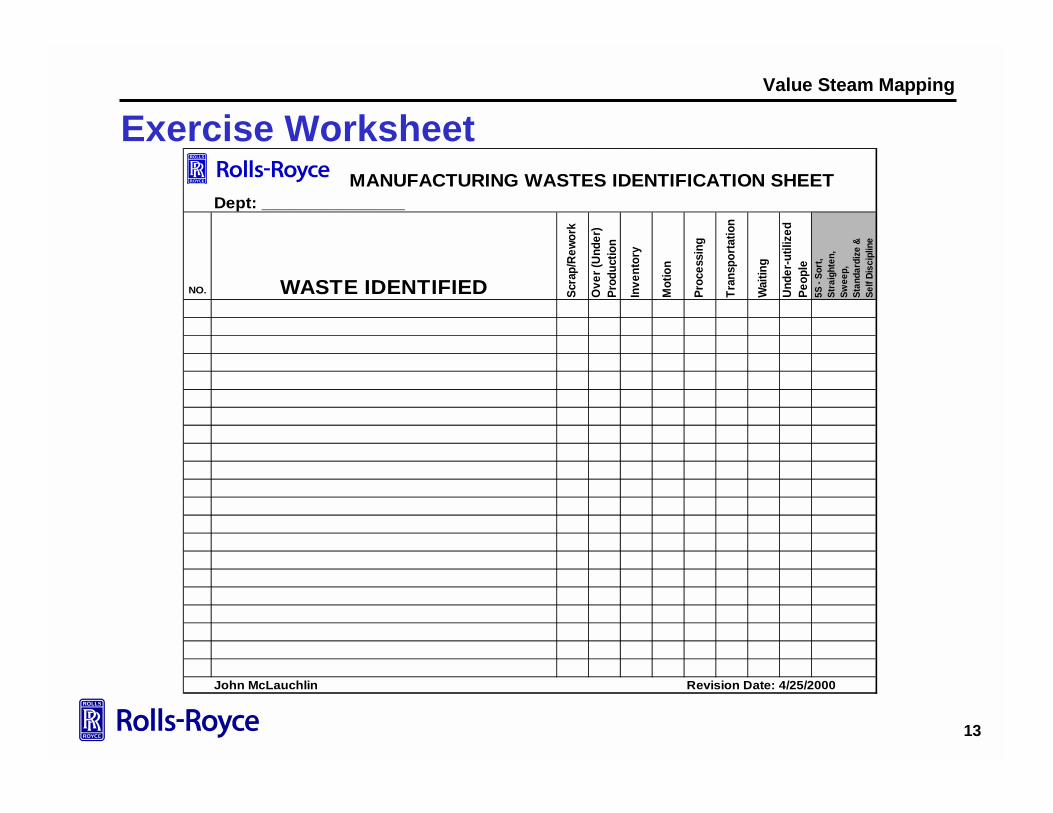
Value Steam Mapping
Exercise Worksheet
MANUFACTURING WASTES IDENTIFICATION SHEETDept: _______________
NO. WASTE IDENTIFIED Scra
p/Re
work
Ove
r (Un
der)
Prod
uctio
n
Inve
ntor
y
Mot
ion
Proc
essi
ng
Tran
spor
tatio
n
Wai
ting
Unde
r-util
ized
Pe
ople
5S -
Sort,
St
raig
hten
,
Swee
p,
Stan
dard
ize &
Self
Disc
iplin
e
John McLauchlin Revision Date: 4/25/2000
14
Value Steam Mapping
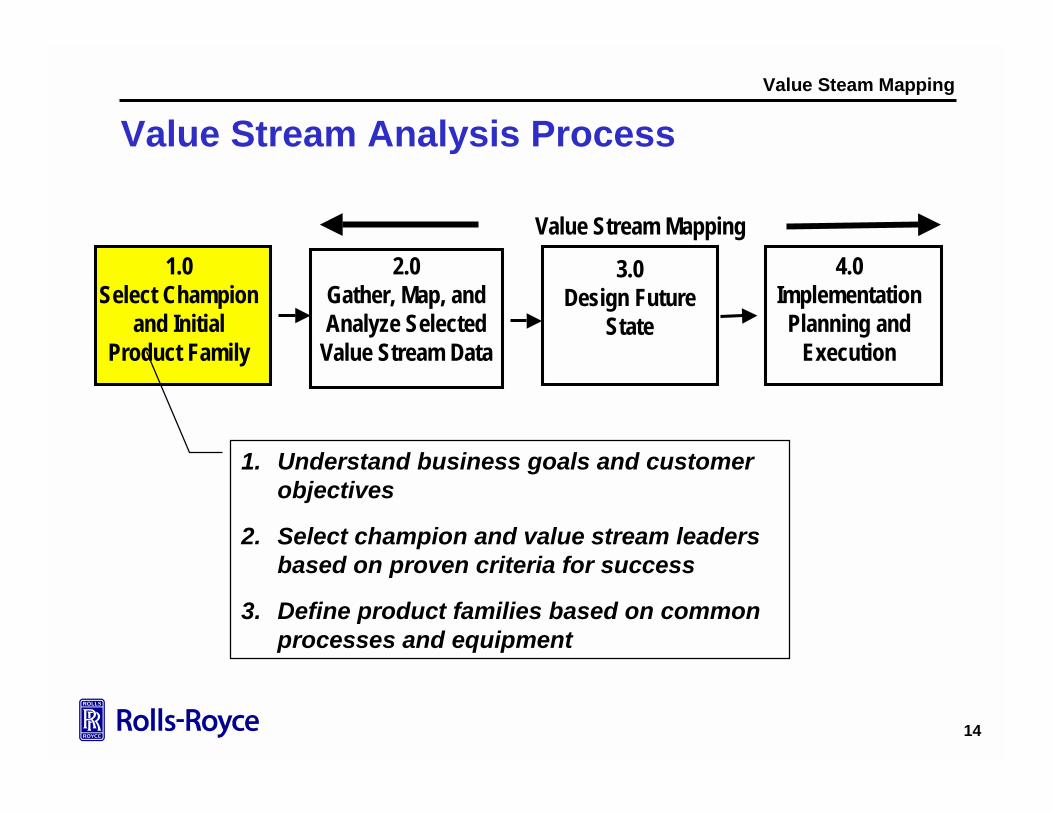
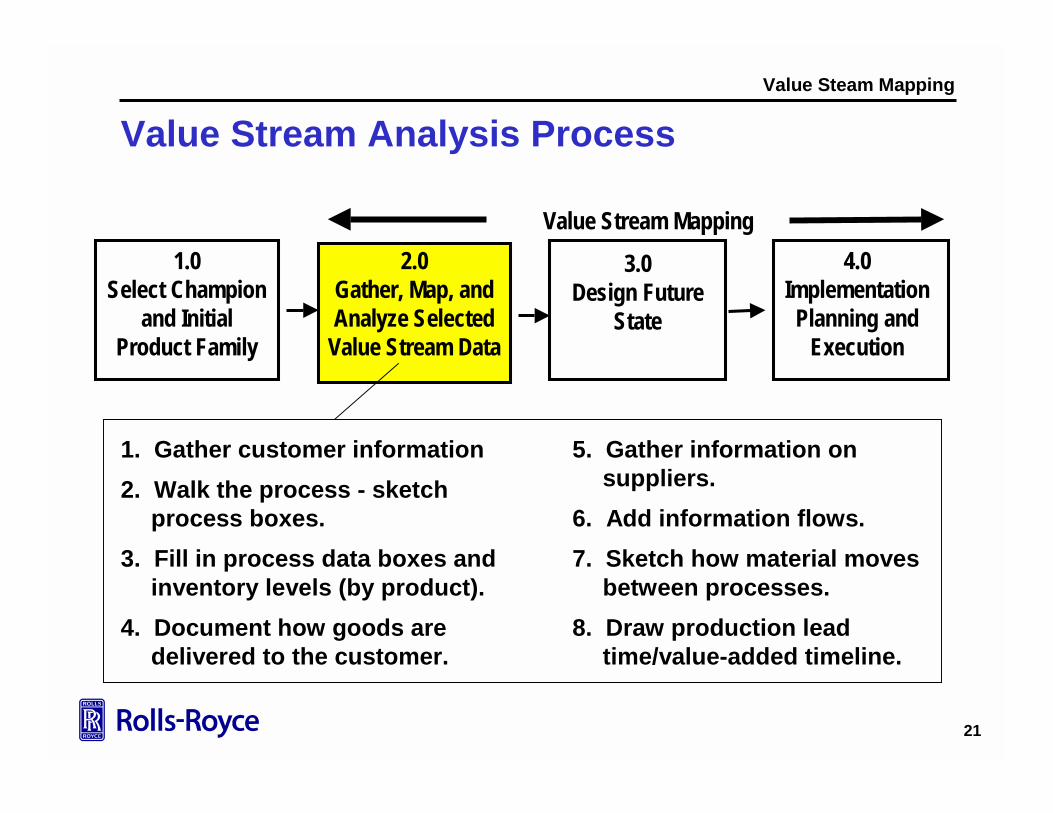
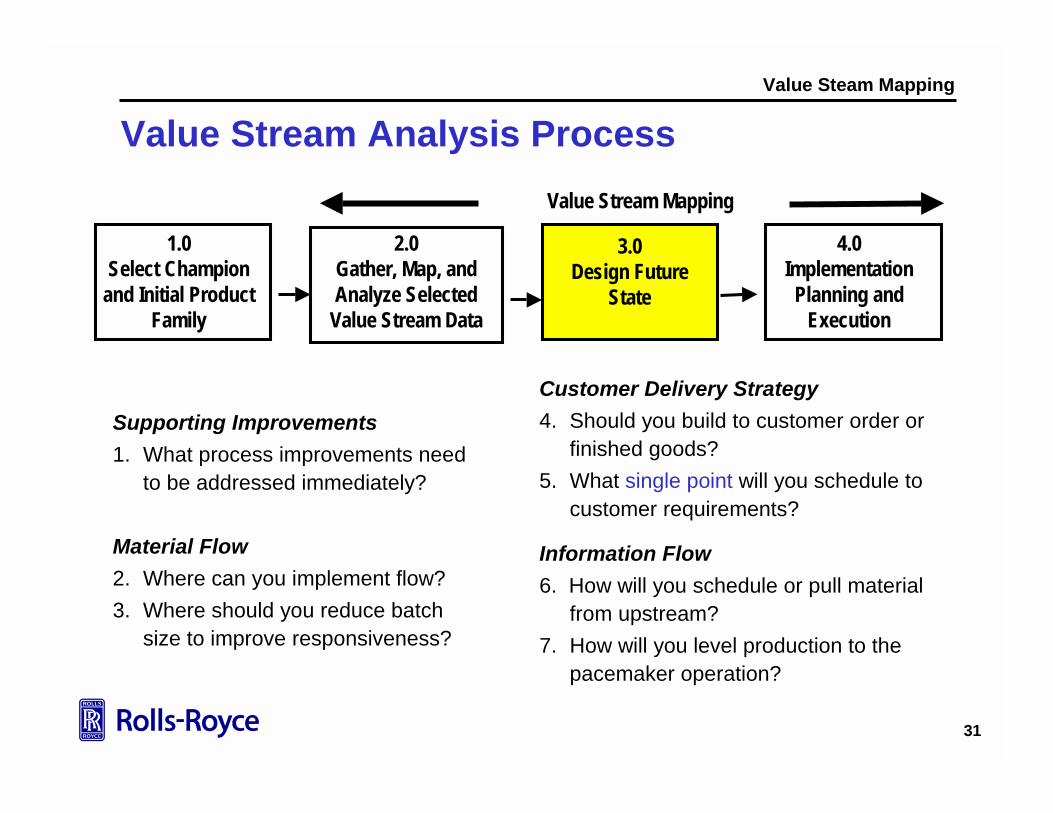
Value Stream Analysis Process
1.0 Select Champion
and Initial Product Family
4.0Implementation Planning and
Execution
3.0Design Future
State
2.0Gather, Map, and Analyze Selected
Value Stream Data
Value Stream Mapping
1. Understand business goals and customer objectives
2. Select champion and value stream leaders based on proven criteria for success
3. Define product families based on common processes and equipment
15
Value Steam Mapping
Observations
– A common factor in all observed successful lean implementations is one or more empowered Champions.
– Champions are usually high-level leaders who take on a pro-active role shaping and supporting the lean initiatives, and ensuring that system barriers are identified and addressed.
– To start your lean journey, you need a leader or set of leaders to:• Develop a strategic direction• Agree to and communicate the strategic direction• Make available the needed resources • Provide continued, visible support
– Without the support of a champion, you should not attempt to implement lean practices and principles -- it is a recipe for disaster
Lean Aerospace Initiative
Leadership and Champions
16
Value Steam Mapping
Small Group Activity
• Identify who in your organization will fill these critical roles to support lean implementation
– Executive Champion– Implementation Leader– Operations Manager– Technical Support– Other Key Roles?
• Briefly describe the role each person will have in supporting lean
• What can you do to get these people to successfully support your efforts
• Executive Champion
• Implementation Leader
• Operational Mgr
17
Value Steam Mapping
Define Product Families
• Analyze Product-Volume Chart to separate high runners from low runners
• Analyze Product-Process Matrix to identify similar processing steps and common equipment
• Analyze Routings to identify common sequences focusing on:
– Operations that can potentially be dedicated to the product family
– Operations that are neither monuments nor batch cycles
– Downstream processes most visible to the customer
18
Value Steam Mapping
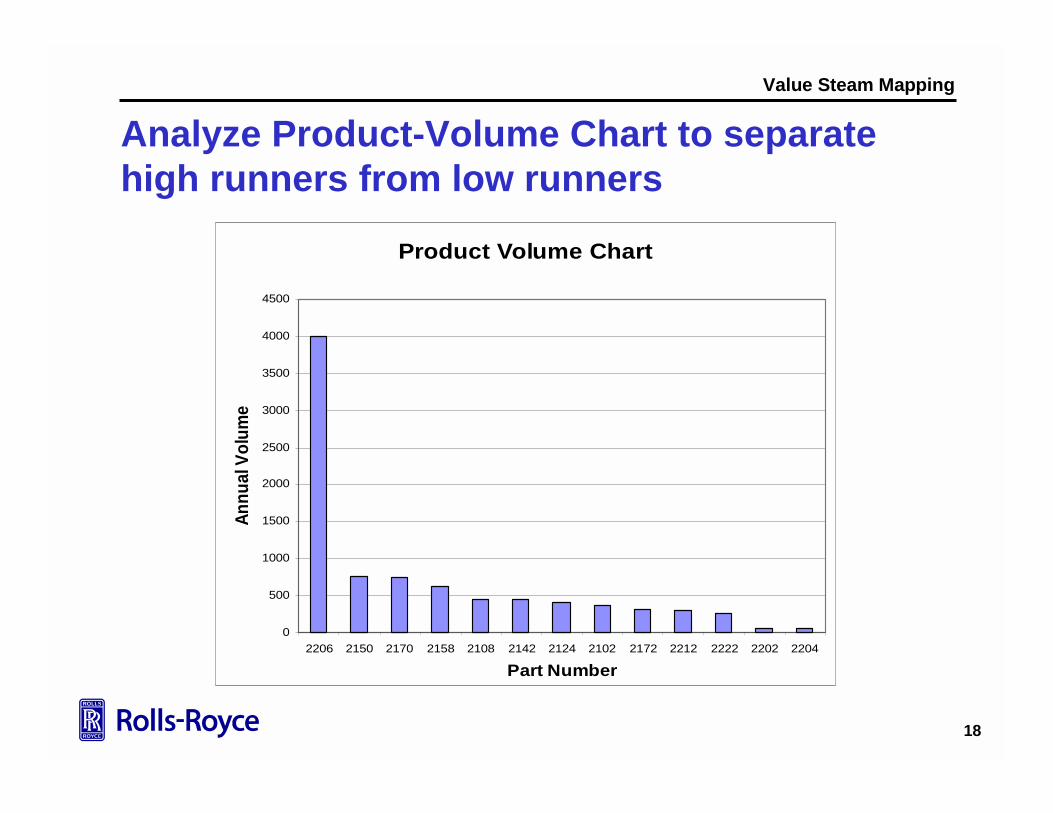
Analyze Product-Volume Chart to separate high runners from low runners
Product Volume Chart
0
500
1000
1500
2000
2500
3000
3500
4000
4500
2206 2150 2170 2158 2108 2142 2124 2102 2172 2212 2222 2202 2204
Part Number
Annu
al V
olum
e
19
Value Steam Mapping
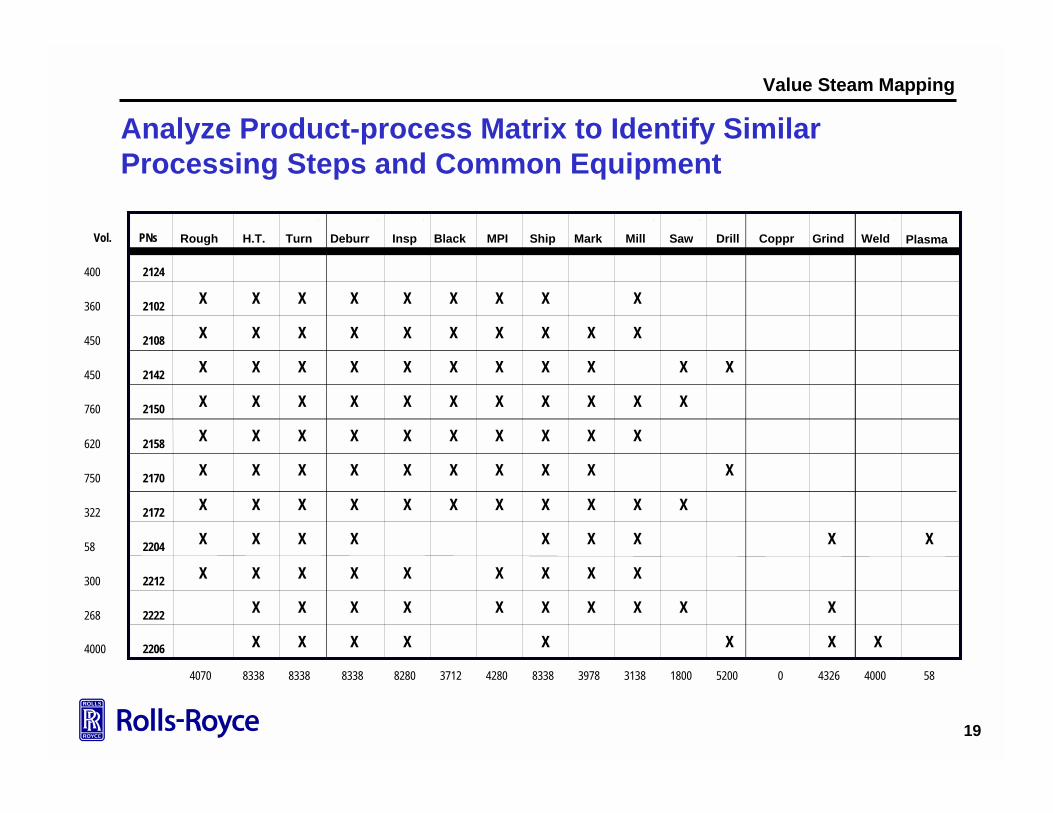
Analyze Product-process Matrix to Identify Similar Processing Steps and Common Equipment
Vol. PNs Rough H.T. Turn Deburr Insp Black MPI Ship Mark Mill Saw Drill Coppr Grind Weld Plasma
400 2124
360 2102 X X X X X X X X X
450 2108 X X X X X X X X X X
450 2142 X X X X X X X X X X X
760 2150 X X X X X X X X X X X
620 2158 X X X X X X X X X X
750 2170 X X X X X X X X X X
322 2172 X X X X X X X X X X X
58 2204 X X X X X X X X X
300 2212 X X X X X X X X X
268 2222 X X X X X X X X X X
4000 2206 X X X X X X X X
4070 8338 8338 8338 8280 3712 4280 8338 3978 3138 1800 5200 0 4326 4000 58
20
Value Steam Mapping
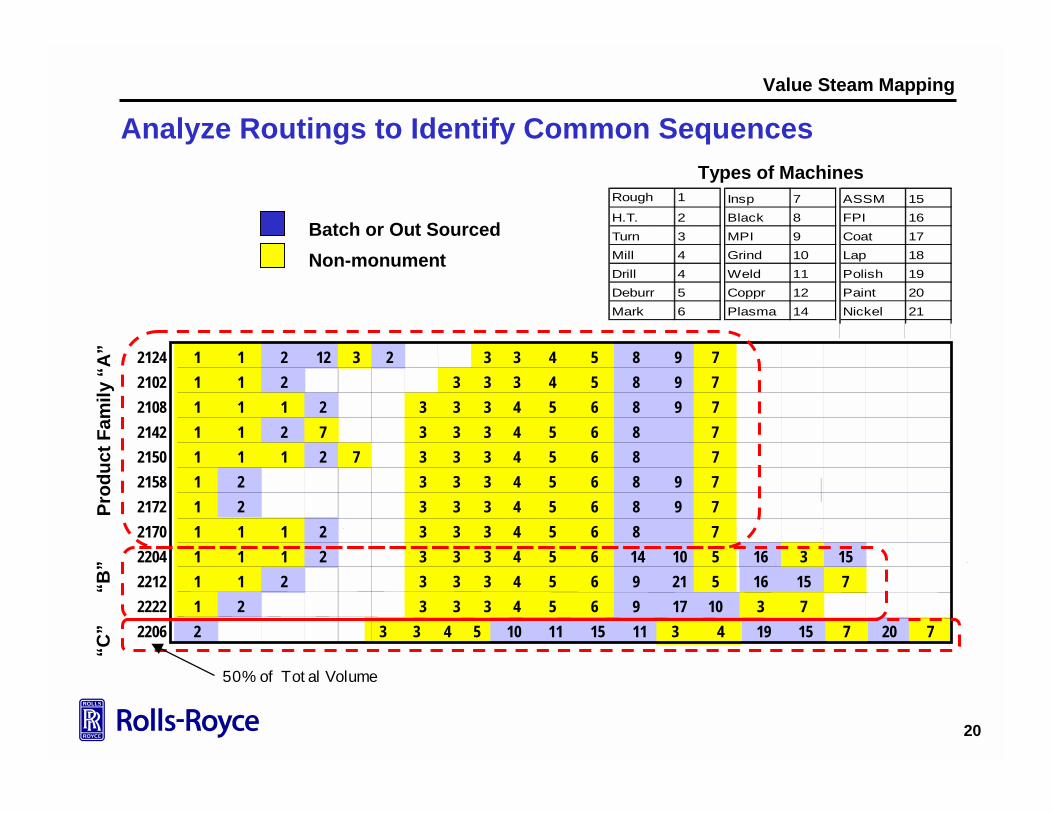
Analyze Routings to Identify Common Sequences
2124 1 1 2 12 3 2 3 3 4 5 8 9 72102 1 1 2 3 3 3 4 5 8 9 72108 1 1 1 2 3 3 3 4 5 6 8 9 72142 1 1 2 7 3 3 3 4 5 6 8 72150 1 1 1 2 7 3 3 3 4 5 6 8 72158 1 2 3 3 3 4 5 6 8 9 72172 1 2 3 3 3 4 5 6 8 9 72170 1 1 1 2 3 3 3 4 5 6 8 72204 1 1 1 2 3 3 3 4 5 6 14 10 5 16 3 152212 1 1 2 3 3 3 4 5 6 9 21 5 16 15 72222 1 2 3 3 3 4 5 6 9 17 10 3 72206 2 3 3 4 5 10 11 15 11 3 4 19 15 7 20 7
50% of Total Volume
Rough 1
H.T. 2Turn 3Mill 4Drill 4Deburr 5Mark 6
Insp 7Black 8MPI 9Grind 10Weld 11Coppr 12Plasma 14
ASSM 15FPI 16Coat 17Lap 18Polish 19Paint 20Nickel 21
Non-monumentBatch or Out Sourced
Prod
uct F
amily
“A”
“B”
“C”
Types of Machines
21
Value Steam Mapping
Value Stream Analysis Process
1. Gather customer information2. Walk the process - sketch
process boxes.3. Fill in process data boxes and
inventory levels (by product).4. Document how goods are
delivered to the customer.
5. Gather information on suppliers.
6. Add information flows.7. Sketch how material moves
between processes.8. Draw production lead
time/value-added timeline.
1.0 Select Champion
and Initial Product Family
4.0Implementation Planning and
Execution
3.0Design Future
State
Value Stream Mapping2.0
Gather, Map, and Analyze Selected
Value Stream Data
22
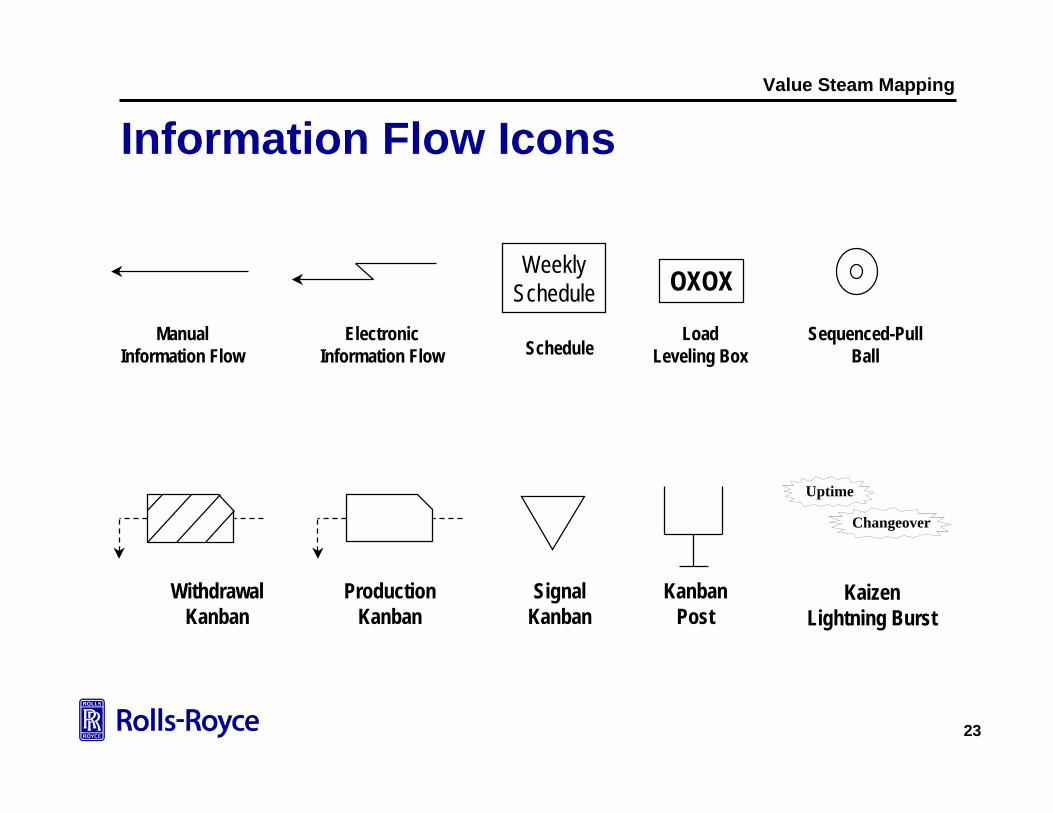
Value Steam Mapping
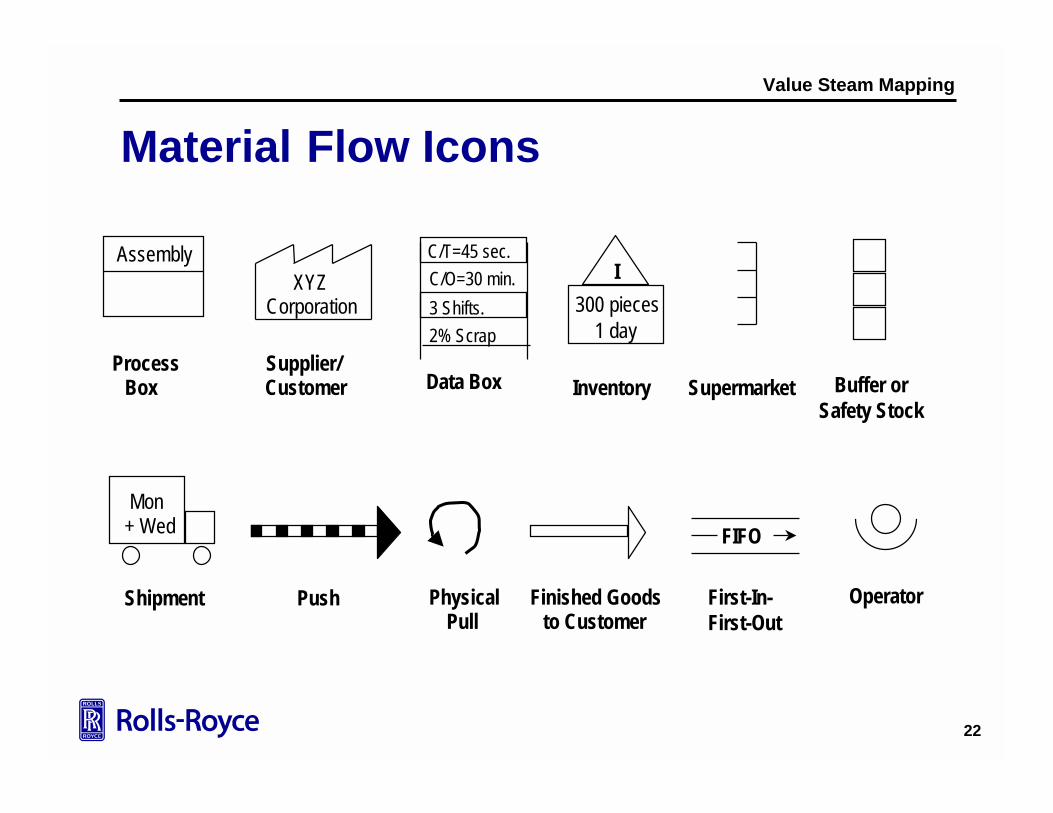
Material Flow Icons
AssemblyXYZ
Corporation
Data Box
I300 pieces
1 day
Inventory Supermarket
Shipment Push Finished Goodsto Customer
Physical
FIFO
First-In-First-Out
ProcessBox
Supplier/Customer
Mon + Wed
Pull
C/O=30 min.C/T=45 sec.
3 Shifts.2% Scrap
Buffer orSafety Stock
Operator
23
Value Steam Mapping
ManualInformation Flow
ElectronicInformation Flow
WeeklySchedule
Schedule
OXOX
LoadLeveling Box
Sequenced-PullBall
WithdrawalKanban
ProductionKanban
SignalKanban
KanbanPost
Information Flow Icons
Uptime
Changeover
KaizenLightning Burst
24
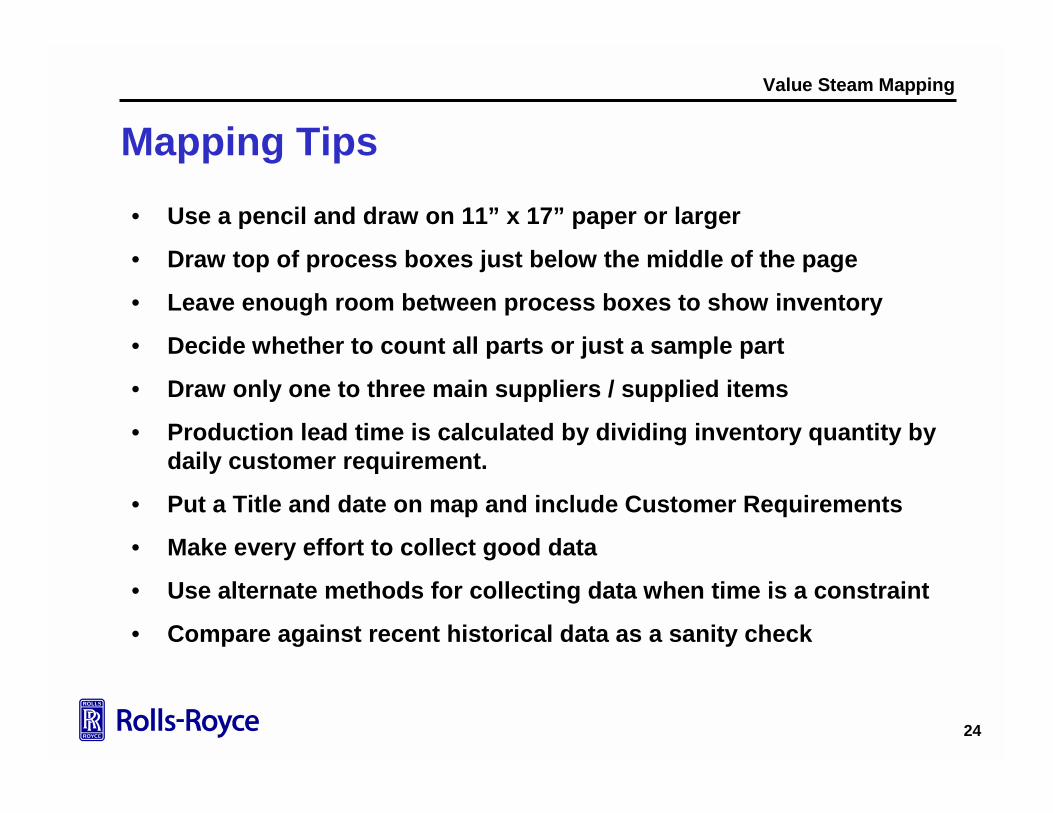
Value Steam Mapping
Mapping Tips• Use a pencil and draw on 11” x 17” paper or larger
• Draw top of process boxes just below the middle of the page
• Leave enough room between process boxes to show inventory
• Decide whether to count all parts or just a sample part
• Draw only one to three main suppliers / supplied items
• Production lead time is calculated by dividing inventory quantity by daily customer requirement.
• Put a Title and date on map and include Customer Requirements
• Make every effort to collect good data
• Use alternate methods for collecting data when time is a constraint
• Compare against recent historical data as a sanity check
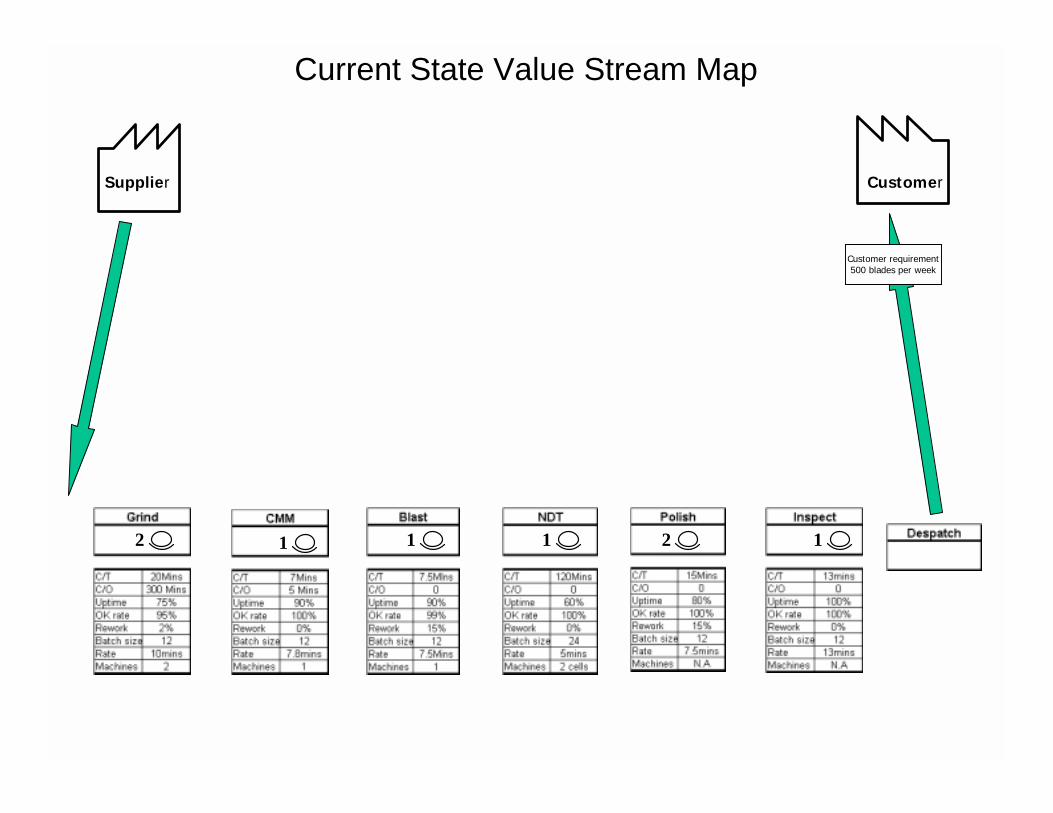
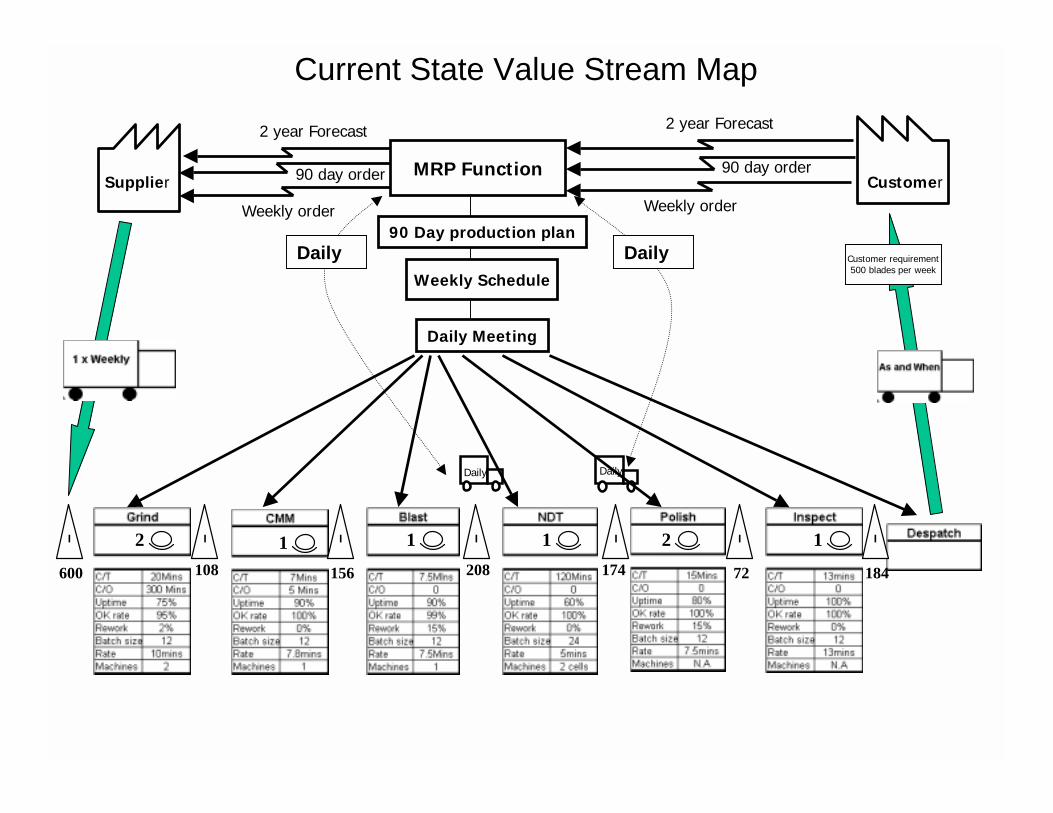
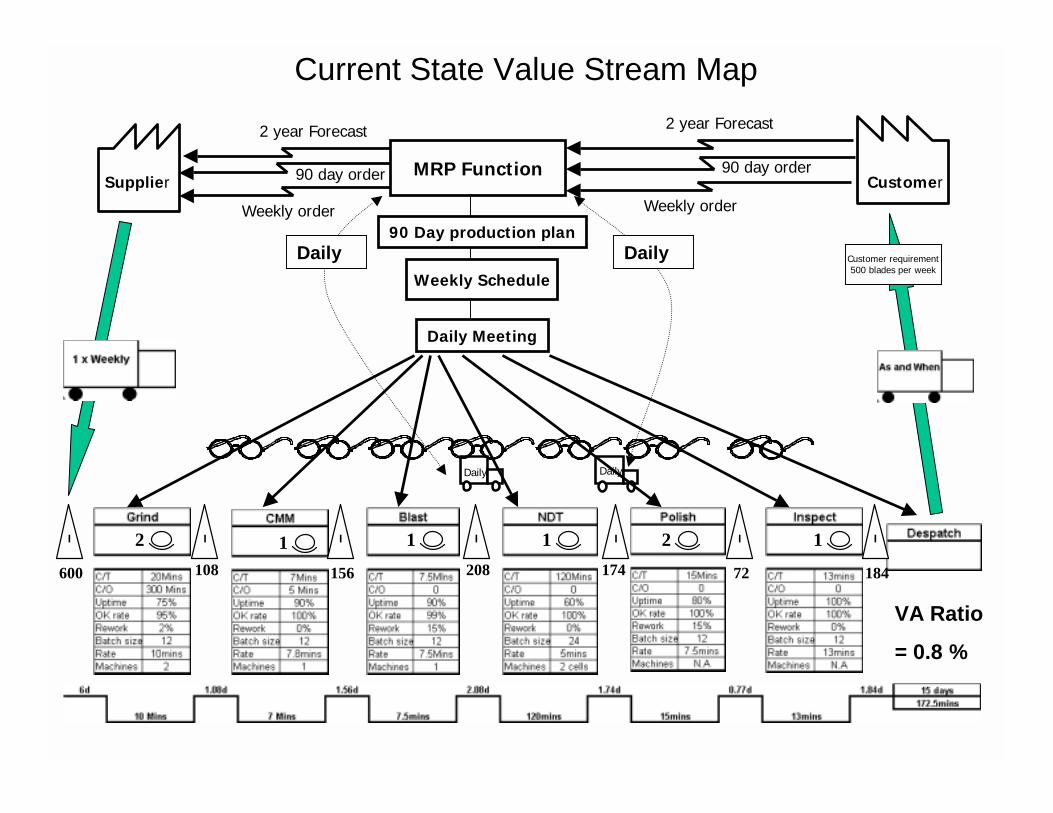
Current State Value Stream Map
Customer
Customer requirement500 blades per week
211 1 1 21 1 22
Supplier
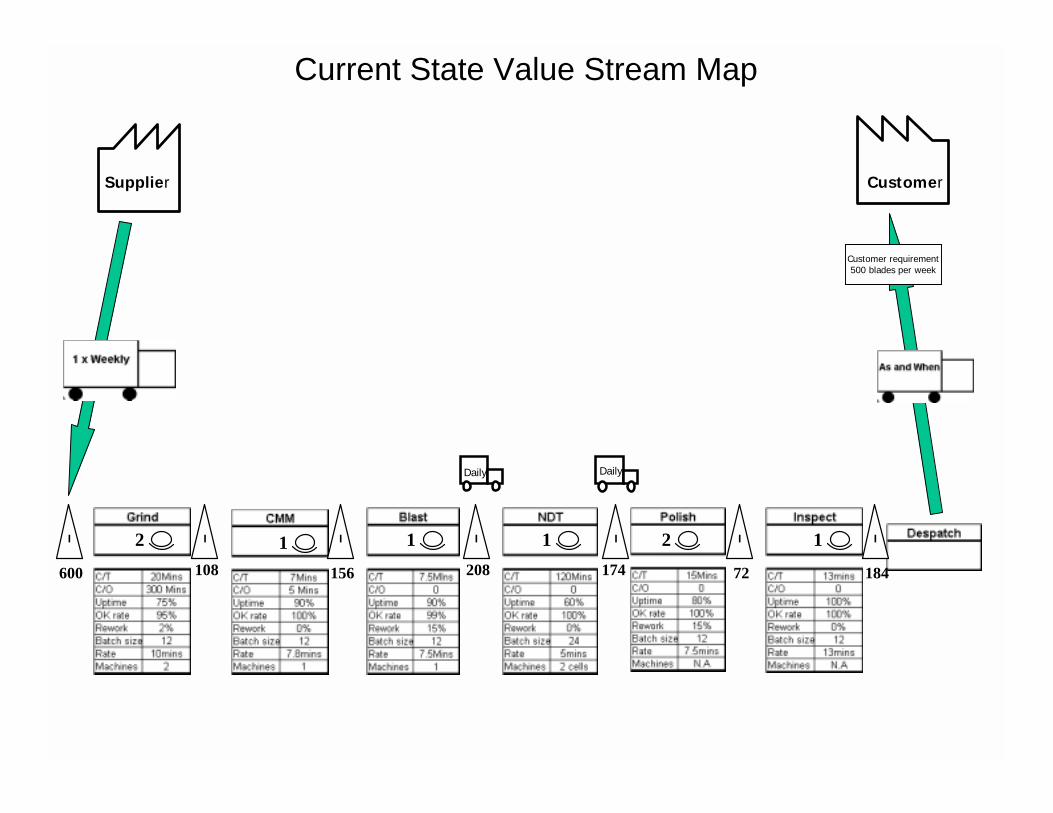
Current State Value Stream Map
Customer
Customer requirement500 blades per week
211 1 1 21 1 22 I
108
I
156
I
208
I
600
I
174
I
72
I
184
Daily Daily
Supplier
Current State Value Stream Map
Customer
Customer requirement500 blades per week
211 1 1 21 1 22 I
108
I
156
I
208
I
600
I
174
I
72
I
184
Daily Daily
Supplier
2 year Forecast
Weekly order
90 day order
90 Day production plan
Weekly Schedule
Daily Meeting
Weekly order
2 year Forecast
90 day order MRP Function
DailyDaily
VA Ratio
= 0.8 %
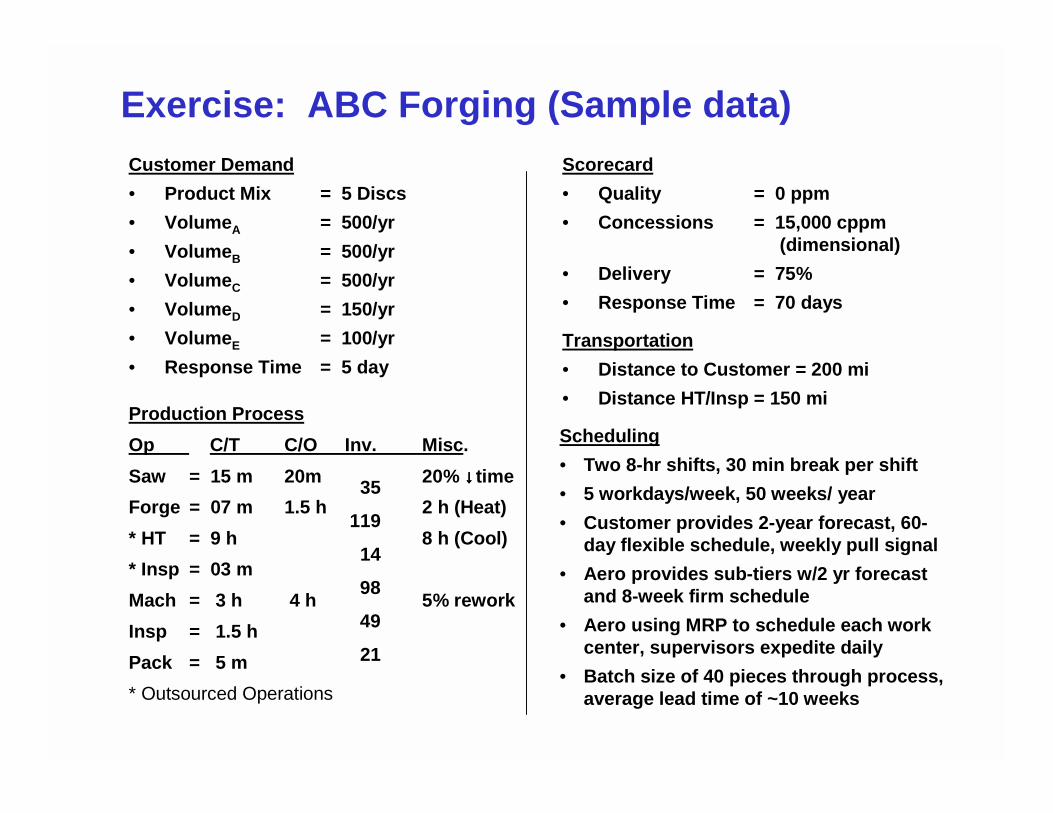
Exercise: ABC Forging (Sample data)Customer Demand• Product Mix = 5 Discs • VolumeA = 500/yr• VolumeB = 500/yr• VolumeC = 500/yr• VolumeD = 150/yr• VolumeE = 100/yr• Response Time = 5 day
Scorecard• Quality = 0 ppm • Concessions = 15,000 cppm
(dimensional)• Delivery = 75%• Response Time = 70 days
Transportation• Distance to Customer = 200 mi• Distance HT/Insp = 150 mi
Production ProcessOp C/T C/O Inv. Misc.Saw = 15 m 20m 20% ↓↓↓↓ timeForge = 07 m 1.5 h 2 h (Heat)* HT = 9 h 8 h (Cool)* Insp = 03 mMach = 3 h 4 h 5% reworkInsp = 1.5 h Pack = 5 m* Outsourced Operations
Scheduling• Two 8-hr shifts, 30 min break per shift• 5 workdays/week, 50 weeks/ year• Customer provides 2-year forecast, 60-
day flexible schedule, weekly pull signal • Aero provides sub-tiers w/2 yr forecast
and 8-week firm schedule• Aero using MRP to schedule each work
center, supervisors expedite daily• Batch size of 40 pieces through process,
average lead time of ~10 weeks
35
119
14
98
49
21
30
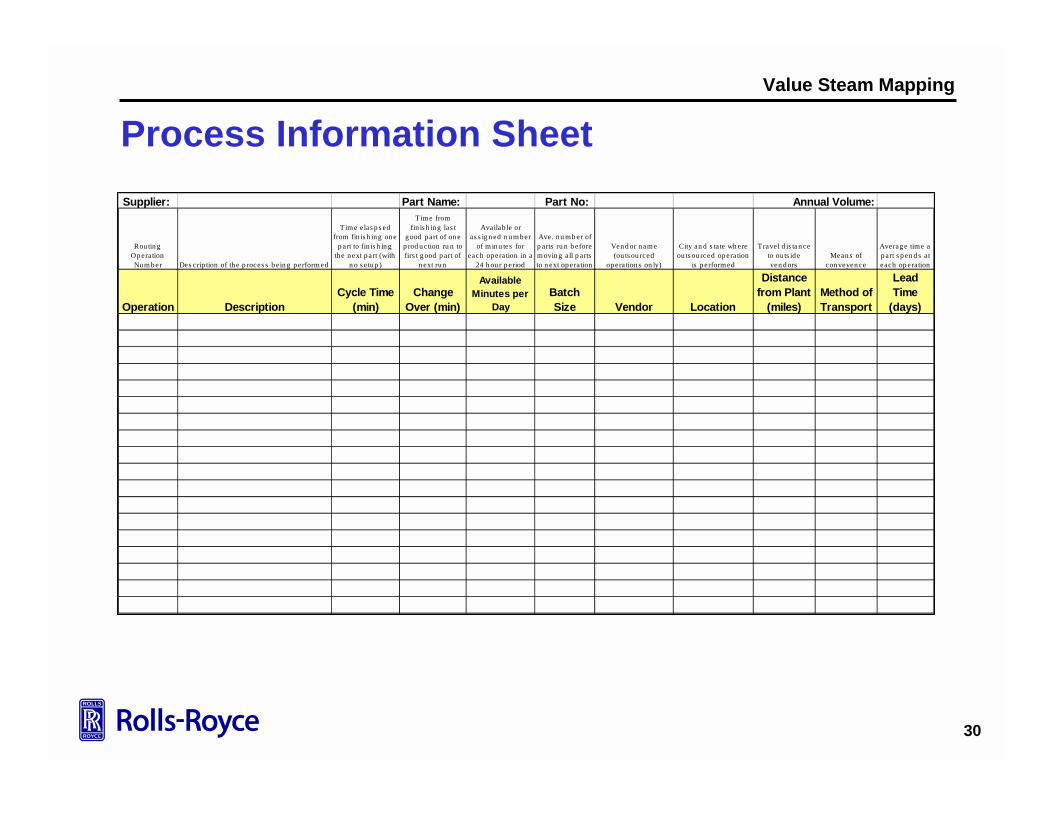
Value Steam Mapping
Process Information SheetSupplier: Part Name: Part No: Annual Volume:
Rou tin g Op eration Nu m b er Des crip tion of th e p roces s b ein g p erform ed
Tim e elas p s ed from fin is h in g on e
p art to fin is h in g th e n ext p art (with
n o s etu p )
Time from fin is h in g las t
g ood p art of on e p rod u ction ru n to firs t g ood p art of
n ext ru n
Availab le or as s ig n ed n u m b er
of m in u tes for each op eration in a
24 h ou r p eriod
Ave. n u mb er of p arts ru n b efore m ovin g all p arts to n ext op eration
Ven d or n am e (ou ts ou rced
op era tion s on ly)
City an d s ta te wh ere ou ts ou rced op eration
is p erform ed
Travel d is tan ce to ou ts id e ven d ors
Mean s of con veyen ce
Averag e time a p art s p en d s at each op eration
Operation DescriptionCycle Time
(min)Change
Over (min)
Available Minutes per
DayBatch Size Vendor Location
Distance from Plant
(miles)Method of Transport
Lead Time
(days)
31
Value Steam Mapping
1.0 Select Champion
and Initial Product Family
4.0Implementation
Planning and Execution
3.0Design Future
State
2.0Gather, Map, and Analyze Selected
Value Stream Data
Value Stream Mapping
Value Stream Analysis Process
Supporting Improvements1. What process improvements need
to be addressed immediately?
Material Flow2. Where can you implement flow?3. Where should you reduce batch
size to improve responsiveness?
Customer Delivery Strategy4. Should you build to customer order or
finished goods?5. What single point will you schedule to
customer requirements?
Information Flow6. How will you schedule or pull material
from upstream?7. How will you level production to the
pacemaker operation?
Exercise: ABC Forging (Sample Data)Brainstorm Future State
Rolls-Royce
Sub-Tier
ProductionControl
2-yr forecast
60-DaySchedule
8-Week Order to Deliver
Cycle Time = 24 hrsTransport = 6 hrsIdle = 48 days
Volume = 1750/yrMix 5/5/5/1.5/1Delivery = 75%Quality = 15k cppmResponse = 5 days
ReleaseMaterial Daily Priority Lists Release
Weekly
SAP
200 miWeekly
C/T = 1.5 h
4 weeks
Forge
C/T=7 mC/O=1.5 hHeat=2 h
C/T=15 mC/O= 20 mBatch= 40
C/T = 9 hCool= 8 h
Machine
C/T = 3 hC/O = 2 h
Insp Pack
C/T= 5 m
2 weeks
150 miC/T=3 m
InspSaw HeatTreat
150 mi
2-yr forecast
20% ↓↓↓↓ 5% Rework
0:15 2:10 17:00 0:03 3:00 2:00 0:055 Days 17 Days 2 Days 14 Days 7 Days 3 Days