Embed Size (px)
Citation preview
Value Stream Mapping as a Lean Tool for
Construction Projects
Murat Gunduz Department of Civil and Architecture Engineering, Qatar University, Doha, Qatar
Email: [email protected]
Ayman Naser Department of Industrial Engineering, Qatar University, Doha, Qatar
Email: [email protected]
Abstract — Based on lean thinking which developed from
the Toyota industry, seek to wastes elimination, increase the
value added to the product from customer point of view and
reduce lead time are the main contributes in manufacturing
industrial environment. Some adaptations have been
applied in construction industry by using a Value Stream
Mapping as a lean construction tool. VSM was adapted to
reduce the high percentage of non-value-added activities
and time wastes during each construction stage. Moreover,
a cost estimation model was developed during current state
and future state to calculate the cost of underground
pipeline construction. Therefore, this paper aims to propose
improvements in the construction industry process using
Value Stream Mapping. Therefore, the research
methodology adopted was the illustrative case study. The
results suggest that the construction of underground
pipelines process lead time could be potentially reduced by
30.7 % and cost reduction of 20.8 % between current and
future states.
Index Terms—Value Stream Mapping (VSM), Line of
Balance (LOB), Lean Construction, underground pipeline
project, Cost of Value Stream Mapping
I. INTRODUCTION
The construction industry is increasingly moving
towards the adoption of sustainable strategies and
increased efficiency targets ([1], [2], [3], [4], [5], [6], [7],
[8]).
Value Stream Mapping has been utilized in many
businesses that to maintain their competitiveness in a
booming worldwide market. Value Stream Mapping is
designed to eliminate all activities that do not add value
throughout the production process [2], [3], [4], [5], [6],
[7]). Basically, it is a new phrase that originates from
Toyota’s material and information flow diagrams and
was designed to help Toyota’s suppliers learn the Toyota
Production System [2]. The main concept of Value
Stream Mapping has been utilized globally in services,
manufacturing, healthcare and construction.
Despite the efforts for sustainability studies in building
and infrastructure construction, the sustainability issues
Manuscript received July 6, 2018; revised October 21, 2018.
in industrial construction remain understudied ([6], [7],
[8]). The application of VSM in real construction
industry has not received enough attention by researchers
due to the difficulty in implementation of VSM in a real
construction activity.
This paper aims to propose improvements in
construction execution process especially for
construction of pipelines using VSM to identify wastes
and elaborate a future state. This paper’s main
contribution is the reduction of wastes and cost in the
process flow, establishing an optimum situation in a
setting where the integration of VSM and cost methods
was used together to develop a systematic framework in
Lean Construction for the application in others projects.
The scope of this paper is restricted to the construction
of underground pipelines process which attempts to
integrate the VSM, LOB and cost calculation based on
VSM in construction environment. Consequently, a
future map with proposed improvements is developed, as
well as the working plans, used to monitor the
implementation project [8].
II. RESEARCH SCOPE AND OBJECTIVES
The main purpose of this project is to recognize the
importance of application of value stream mapping in the
construction industry by applying the concept on a real
construction project. Moreover, it introduces and
evaluates the implementation of a cost based VSM in the
construction industry. Evaluate the effectiveness for the
integration of VSM, LOB and cost based VSM as a tool
to improve the value added and reduce the time wastes in
construction activities in comparison to the entire lead
process time. In this direction, this paper seeks to validate
and suggest future state mapping based on the improved
results for future standardization by answering the
following question: “How can costing of VSM improve
the process construction of underground pipelines?”
III. RESEARCH METHODOLOGY
An explanatory case study of construction of
underground pipelines was utilized as the research
69
International Journal of Structural and Civil Engineering Research Vol. 8, No. 1, February 2019
© 2019 Int. J. Struct. Civ. Eng. Res.doi: 10.18178/ijscer.8.1.69-74
strategy, because it is the most relevant activity in the
schedule and budget of the project and, therefore, the
proposed improvements would develop a vital impact.
The collected data included from different resources:
interviews with construction manager and foremen,
administrative documents and direct observation. The
analysis concentrated on the identification of wastes and
problems faced in the process in order to propose
improvements.
Construct validity was addressed by comparing the
data collected with principles reported in Lean
Construction’s literature. Rother and Shook proposed
five steps to implement Lean Thinking through VSM;
select a family of products, map the current state, analyze
the current state, map the future state and elaborate the
work and implementation plan (2003). In this study, the
stages of productive process for construction were
selected instead of selecting a family of products to
initiate VSM. Work plan and required manpower was set
according to feedback from current state to optimize the
process and ensure wastes are minimized in combination
with line of balance technique (LOB).
In this research and in line with the concept of value
stream mapping, the approach of cost based VSM in
construction is identified and established. The cost based
of value stream mapping is computed on weekly basis
and it takes into consideration all costs related to value
stream mapping activities.
The cost calculation was done for current and future
states and then comparison between them has been
evaluated for estimation and bidding purpose for similar
future projects.
IV. CASE STUDY
Construction industry is suffering from delay and cost
overrun worldwide. The delays in construction are time
wastes oriented, caused by unproductive work, idle
manpower and equipment time. Construction industry
produces huge amounts of time wastes that negatively
affect the economy. A large number of studies related to
delay in construction projects have been conducted
shows that lean management tools has been used to
overcome and minimize the delays. Past studies did not
apply VSM and cost together. In this study, the cost
based VSM technique was utilized on a real construction
project.
The construction of underground pipelines is one of
the construction types that produce a huge amount of
time wastes which lead to delay in the project completion
dates. For this study, construction of underground
pipelines was selected as a case due to the repetitiveness
of the construction activities and easy to understand in
the entire construction. As per project contract, the scope
of work was construction of pipeline (36-inch diameter)
network of 36.5 km. The first step in the value stream
mapping technique is developing a process flow diagram
to provide a clear picture about every stage for the
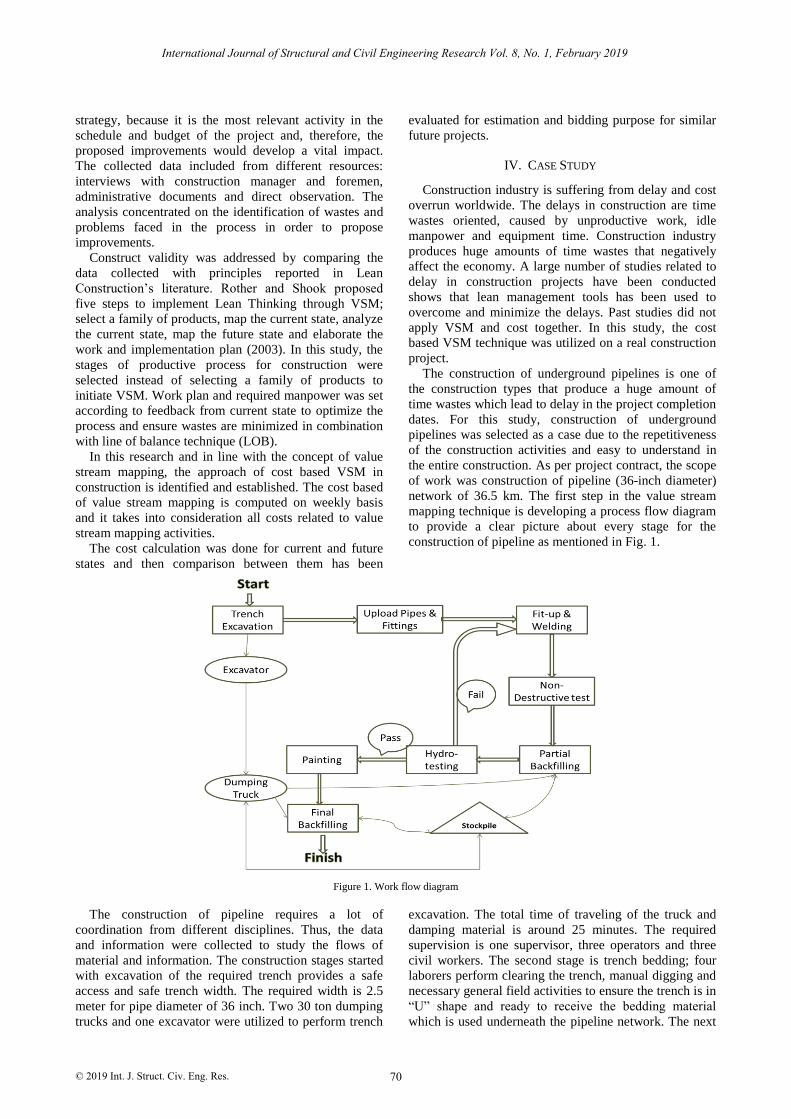
construction of pipeline as mentioned in Fig. 1.
Figure 1. Work flow diagram
The construction of pipeline requires a lot of
coordination from different disciplines. Thus, the data
and information were collected to study the flows of
material and information. The construction stages started
with excavation of the required trench provides a safe
access and safe trench width. The required width is 2.5
meter for pipe diameter of 36 inch. Two 30 ton dumping
trucks and one excavator were utilized to perform trench
excavation. The total time of traveling of the truck and
damping material is around 25 minutes. The required
supervision is one supervisor, three operators and three
civil workers. The second stage is trench bedding; four
laborers perform clearing the trench, manual digging and
necessary general field activities to ensure the trench is in
“U” shape and ready to receive the bedding material
which is used underneath the pipeline network. The next
70
International Journal of Structural and Civil Engineering Research Vol. 8, No. 1, February 2019
© 2019 Int. J. Struct. Civ. Eng. Res.
stage is pipe laying; after the inspection of the trench, the
pipes and fittings were shifted by crane and trailer with
assistance of two operators, one supervisor and two pipe
fitters. The required time for shifting the material to site
construction is 60 minutes. After that Pipes and fittings
fit-up: The fit-up crew (three pipe fitters and one
supervisor) is responsible for stringing and aligning the
pipe inside the pipeline corridor. The pipe and fitting
ends are subject to surface preparation (leveling) prior to
commence with first layer of welding. Welding crew
consists of two welders and one helper using two fuel
operated welding machines mounted on wheels. The
welding crew started with route; pass and last with cap
welding. Every welder who made a joint has a unique
identifying number. The numbers are marked on the area
adjacent to the pipe, so complete records of the welding
are maintained. On the average, the required duration to
complete the welding of each joint is 20 hrs working
continuously. After welding, the joint will be ready for
non-destructive test (NDT). Normally, the two
technicians are hired from Third Party Company to
perform the test. The test duration is 80 minutes and the
result will be available after 3 hours. Prior to commence
with hydro-test of the pipeline, the partial backfilling of
the pipeline network shall be completed with assist of
three helpers, one supervisor and two operators. The
joints shall be exposed to observe the existing of the leak.
Next is hydro-testing according to project specification,
the test duration is 24 hours and two hours for test
preparation. One supervisor and three pipe fitters are
required to perform the test. After the test, three painters
applied paint for exposed joints prior to proceed with
final backfilling. The total required duration to apply
paint and curing is 24 hours. The last stage is final
backfilling of pipeline network which was carried out in
layers and each layer has to be well compacted to ensure
the soil and material is uniformly distribution.
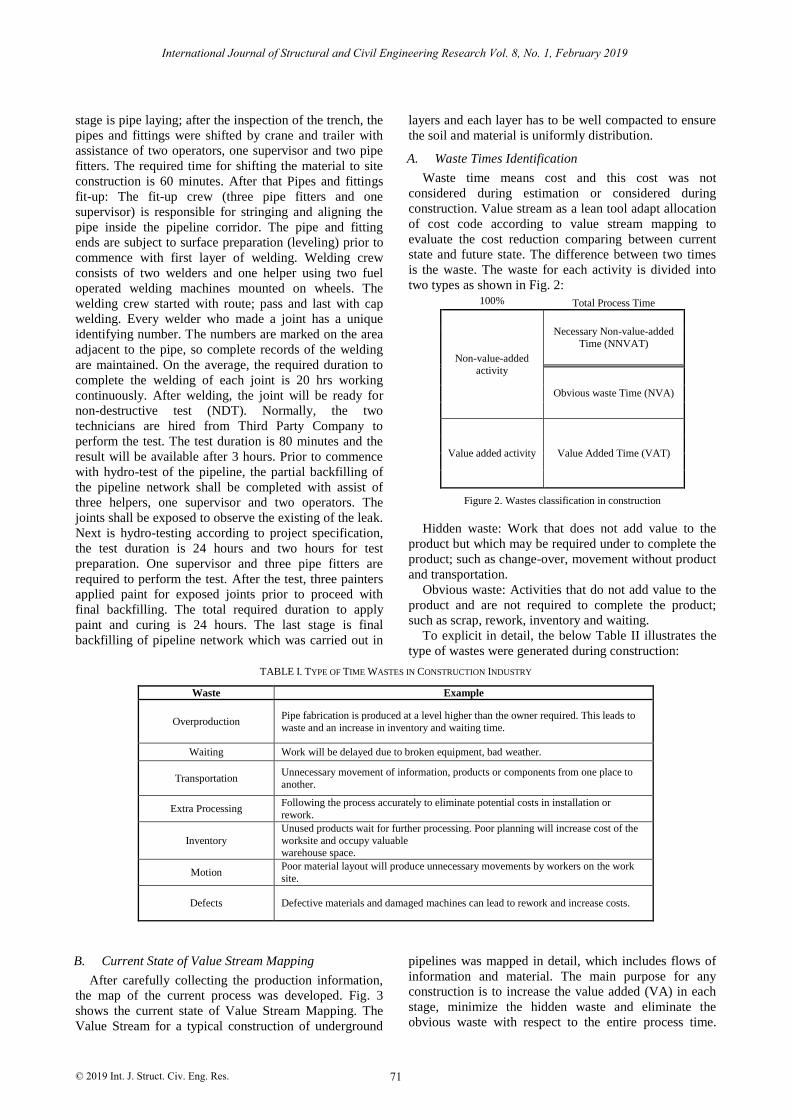
A. Waste Times Identification
Waste time means cost and this cost was not
considered during estimation or considered during
construction. Value stream as a lean tool adapt allocation
of cost code according to value stream mapping to
evaluate the cost reduction comparing between current
state and future state. The difference between two times
is the waste. The waste for each activity is divided into
two types as shown in Fig. 2: 100% Total Process Time
Non-value-added activity
Necessary Non-value-added
Time (NNVAT)
Obvious waste Time (NVA)
Value added activity Value Added Time (VAT)
Figure 2. Wastes classification in construction
Hidden waste: Work that does not add value to the
product but which may be required under to complete the
product; such as change-over, movement without product
and transportation.
Obvious waste: Activities that do not add value to the
product and are not required to complete the product;
such as scrap, rework, inventory and waiting.
To explicit in detail, the below Table II illustrates the
type of wastes were generated during construction:
TABLE I. TYPE OF TIME WASTES IN CONSTRUCTION INDUSTRY
Waste Example
Overproduction Pipe fabrication is produced at a level higher than the owner required. This leads to
waste and an increase in inventory and waiting time.
Waiting Work will be delayed due to broken equipment, bad weather.
Transportation Unnecessary movement of information, products or components from one place to
another.
Extra Processing Following the process accurately to eliminate potential costs in installation or
rework.
Inventory
Unused products wait for further processing. Poor planning will increase cost of the
worksite and occupy valuable warehouse space.
Motion Poor material layout will produce unnecessary movements by workers on the work
site.
Defects Defective materials and damaged machines can lead to rework and increase costs.
B. Current State of Value Stream Mapping
After carefully collecting the production information,
the map of the current process was developed. Fig. 3
shows the current state of Value Stream Mapping. The
Value Stream for a typical construction of underground
pipelines was mapped in detail, which includes flows of
information and material. The main purpose for any
construction is to increase the value added (VA) in each
stage, minimize the hidden waste and eliminate the
obvious waste with respect to the entire process time.
71
International Journal of Structural and Civil Engineering Research Vol. 8, No. 1, February 2019
© 2019 Int. J. Struct. Civ. Eng. Res.
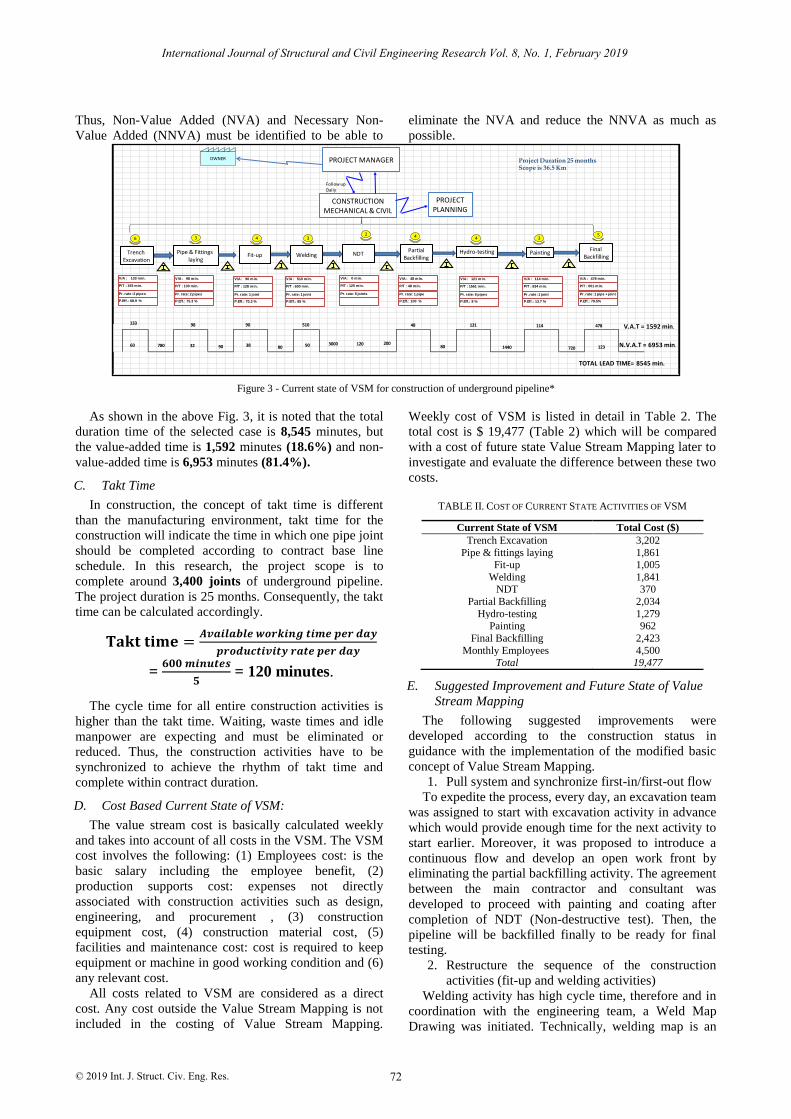
Thus, Non-Value Added (NVA) and Necessary Non-
Value Added (NNVA) must be identified to be able to
eliminate the NVA and reduce the NNVA as much as
possible.
Figure 3 - Current state of VSM for construction of underground pipeline*
As shown in the above Fig. 3, it is noted that the total
duration time of the selected case is 8,545 minutes, but
the value-added time is 1,592 minutes (18.6%) and non-
value-added time is 6,953 minutes (81.4%).
C. Takt Time
In construction, the concept of takt time is different
than the manufacturing environment, takt time for the
construction will indicate the time in which one pipe joint
should be completed according to contract base line
schedule. In this research, the project scope is to
complete around 3,400 joints of underground pipeline.
The project duration is 25 months. Consequently, the takt
time can be calculated accordingly.
𝐓𝐚𝐤𝐭 𝐭𝐢𝐦𝐞 =𝑨𝒗𝒂𝒊𝒍𝒂𝒃𝒍𝒆 𝒘𝒐𝒓𝒌𝒊𝒏𝒈 𝒕𝒊𝒎𝒆 𝒑𝒆𝒓 𝒅𝒂𝒚
𝒑𝒓𝒐𝒅𝒖𝒄𝒕𝒊𝒗𝒊𝒕𝒚 𝒓𝒂𝒕𝒆 𝒑𝒆𝒓 𝒅𝒂𝒚
= 𝟔𝟎𝟎 𝒎𝒊𝒏𝒖𝒕𝒆𝒔
𝟓 = 120 minutes.
The cycle time for all entire construction activities is
higher than the takt time. Waiting, waste times and idle
manpower are expecting and must be eliminated or
reduced. Thus, the construction activities have to be
synchronized to achieve the rhythm of takt time and
complete within contract duration.
D. Cost Based Current State of VSM:
The value stream cost is basically calculated weekly
and takes into account of all costs in the VSM. The VSM
cost involves the following: (1) Employees cost: is the
basic salary including the employee benefit, (2)
production supports cost: expenses not directly
associated with construction activities such as design,
engineering, and procurement , (3) construction
equipment cost, (4) construction material cost, (5)
facilities and maintenance cost: cost is required to keep
equipment or machine in good working condition and (6)
any relevant cost.
All costs related to VSM are considered as a direct
cost. Any cost outside the Value Stream Mapping is not
included in the costing of Value Stream Mapping.
Weekly cost of VSM is listed in detail in Table 2. The
total cost is $ 19,477 (Table 2) which will be compared
with a cost of future state Value Stream Mapping later to
investigate and evaluate the difference between these two
costs.
TABLE II. COST OF CURRENT STATE ACTIVITIES OF VSM
Current State of VSM Total Cost ($)
Trench Excavation 3,202
Pipe & fittings laying 1,861 Fit-up 1,005
Welding 1,841
NDT 370
Partial Backfilling 2,034
Hydro-testing 1,279 Painting 962
Final Backfilling 2,423
Monthly Employees 4,500 Total 19,477
E. Suggested Improvement and Future State of Value
Stream Mapping
The following suggested improvements were
developed according to the construction status in
guidance with the implementation of the modified basic
concept of Value Stream Mapping.
1. Pull system and synchronize first-in/first-out flow
To expedite the process, every day, an excavation team
was assigned to start with excavation activity in advance
which would provide enough time for the next activity to
start earlier. Moreover, it was proposed to introduce a
continuous flow and develop an open work front by
eliminating the partial backfilling activity. The agreement
between the main contractor and consultant was
developed to proceed with painting and coating after
completion of NDT (Non-destructive test). Then, the
pipeline will be backfilled finally to be ready for final
testing.
2. Restructure the sequence of the construction
activities (fit-up and welding activities)
Welding activity has high cycle time, therefore and in
coordination with the engineering team, a Weld Map
Drawing was initiated. Technically, welding map is an
OWNER PROJECT MANAGER
Pipe & Fittings laying
Welding
Follow upDaily
FinalBackfilling
Trench Excavation
V/A : 133 min.
P/T : 193 min.
Pr. rate: 2 pipes
P.Eff.: 68.9 %
V/A : 98 min.
P/T : 130 min.
Pr. rate: 2 pipes
P.Eff.: 75.3 %
6 3
V/A : 90 min.
P/T : 128 min.
Pr. rate: 1 joint
P.Eff.: 70.3 %
Fit-up
V/A : 510 min.
P/T : 600 min.
Pr. rate: 1 joint
P.Eff.: 85 %
NDT
V/A : 0 min.
P/T : 120 min.
Pr. rate: 5 joints
PartialBackfilling
Hydro-testing Painting
V/A : 48 min.
P/T : 48 min.
Pr. rate: 1 pipe
P.Eff.: 100 %
V/A : 121 min.
P/T : 1561 min.
Pr. rate: 6 pipes
P.Eff.: 8 %
V/A : 114 min.
P/T : 834 min.
Pr. rate: 1 joint
P.Eff.: 13.7 %
V/A : 478 min.
P/T : 601 min.
Pr. rate: 1 pipe + joint
P.Eff.: 79.5%
CONSTRUCTION MECHANICAL & CIVIL
4 3 4 4 35
PROJECT PLANNING
133
780
98
90
90
80
510
120
48 121 114 478 V.A.T = 1592 min.
7201440802003000 N.V.A.T = 6953 min.
TOTAL LEAD TIME= 8545 min.
Project Duration 25 monthsScope is 36.5 Km
2
60 32 38 90 123
72
International Journal of Structural and Civil Engineering Research Vol. 8, No. 1, February 2019
© 2019 Int. J. Struct. Civ. Eng. Res.
isometric drawing that shows the location for all pipe
joints in the project. Fig. 4 shows the sample of welded
spools in the fabrication shop.
Figure 4. Sample of welded spools
The field engineering department in coordination with
construction field would study and investigate thoroughly
in detail each joint and specify the joint status with
respect to field weld or manufacturer joint weld named as
spools.
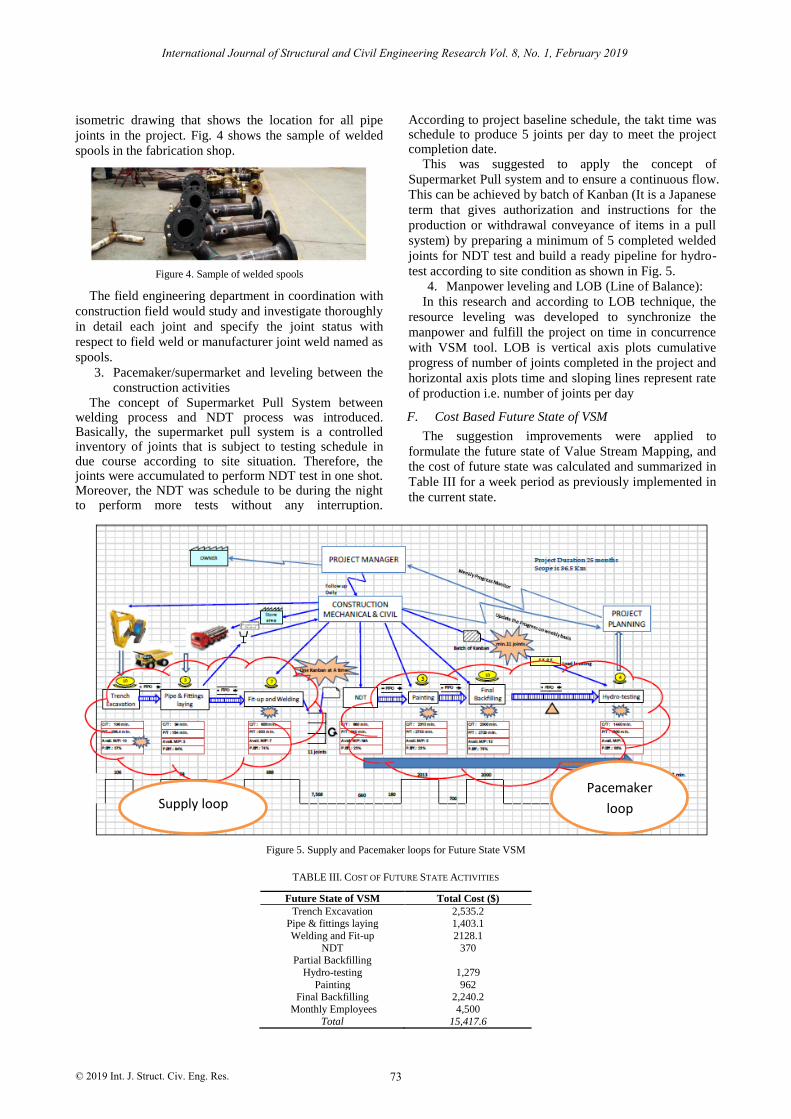
3. Pacemaker/supermarket and leveling between the
construction activities The concept of Supermarket Pull System between
welding process and NDT process was introduced. Basically, the supermarket pull system is a controlled inventory of joints that is subject to testing schedule in due course according to site situation. Therefore, the joints were accumulated to perform NDT test in one shot. Moreover, the NDT was schedule to be during the night to perform more tests without any interruption.
According to project baseline schedule, the takt time was schedule to produce 5 joints per day to meet the project completion date.
This was suggested to apply the concept of
Supermarket Pull system and to ensure a continuous flow.
This can be achieved by batch of Kanban (It is a Japanese
term that gives authorization and instructions for the
production or withdrawal conveyance of items in a pull
system) by preparing a minimum of 5 completed welded
joints for NDT test and build a ready pipeline for hydro-
test according to site condition as shown in Fig. 5.
4. Manpower leveling and LOB (Line of Balance):
In this research and according to LOB technique, the
resource leveling was developed to synchronize the
manpower and fulfill the project on time in concurrence
with VSM tool. LOB is vertical axis plots cumulative
progress of number of joints completed in the project and
horizontal axis plots time and sloping lines represent rate
of production i.e. number of joints per day
F. Cost Based Future State of VSM
The suggestion improvements were applied to
formulate the future state of Value Stream Mapping, and
the cost of future state was calculated and summarized in
Table III for a week period as previously implemented in
the current state.
Figure 5. Supply and Pacemaker loops for Future State VSM
TABLE III. COST OF FUTURE STATE ACTIVITIES
Future State of VSM Total Cost ($)
Trench Excavation 2,535.2 Pipe & fittings laying 1,403.1
Welding and Fit-up 2128.1
NDT 370 Partial Backfilling
Hydro-testing 1,279
Painting 962 Final Backfilling 2,240.2
Monthly Employees 4,500
Total 15,417.6
Supply loop
Pacemaker
loop
Pacemaker
loop
73
International Journal of Structural and Civil Engineering Research Vol. 8, No. 1, February 2019
© 2019 Int. J. Struct. Civ. Eng. Res.
V. DISCUSSION OF RESULTS
The following objectives were outlined after
implementation of VSM in construction environment:
- Work process standardization with assistance of
continuous educating the site workers to eliminate
the time wastes.
- Reduce the problem of waiting time between the
processes.
- Expedite the construction activities by developing
the concept of supermarket- based supply and
pacemaker loops.
- Through the proposed improvement, the total lead
time was reduced by 30.7 % (8,545 to 5,922
minutes), required manpower was reduced by
12.5 % and the cost is reduced by 20.8 % in
comparison between two VSM states.
VI. CONCLUSIONS AND RECOMMENDATIONS
The paper deals with the possibility of implementing
the design method of Value Stream Mapping (VSM)
supported by that of Line of Balance (LOB) on a
construction project focused on the installation of
underground pipelines from the perspective of costs.
More specifically, the cost implementation of the
proposed method enables to reduce the traditional cost
associated to this kind of project, compare its current and
future costs, and improve its productivity. Although
several papers addressed using VSM as a lean tool to
reduce waste and add value during the construction
process, no detailed and unified VSM instructions exist
concerning how to implement it in construction to
evaluate the improvements and calculate the cost
reduction. This paper tried to cover this gap.
REFERENCES
[1] S. Alvandi, W. Li, M. Schönemann, S. Kara, and C. Herrmann, “Economic and environmental value stream map (E2VSM)
simulation for multiproduct manufacturing systems,” International Journal of Sustainable Engineering, vol. 9, no. 6,
pp. 354–362, 2016.
[2] A. C. V. Carvalho, A. D. Granja, and V. G. Silva, “A systematic literature review on integrative lean and sustainability synergies
over a building’s lifecycle,” Sustainability, vol. 9, no. 7, 1156,
2017. [3] L. Chien-Liang and J. Chen-Huu, “Exploring interface problems
in Taiwan’S construction projects using structural equation
modeling,” Sustainability, vol. 9, no. 5, p. 822, 2017. [4] S. Dinesh, S. Nitin, and D. Pratik, “Application of value stream
mapping (VSM) for lean and cycle time reduction in complex
production environments: A case study,” Production Planning & Control, vol. 28, no. 5, pp. 398-419, 2017.
[5] W. Jeong, S. Chang, J. Son, and J. Yi, “BIM-integrated
construction operation simulation for just-in-time production management,” Sustainability, vol. 8, no. 11, pp. 1106, 2016.
[6] D. Lee, S. Kim, and S. Kim, “Development of hybrid model for
estimating construction waste for multifamily residential
buildings using artificial neural networks and ant colony
optimization,” Sustainability, vol. 8, no. 9, pp. 870, 2016.
[7] W. Shou, J. Wang, H. Y. Chong, and X. Wang, “Examining the critical success factors in the adoption of value stream mapping,”
in Proc. 24th Ann. Conf. of the Int’l. Group for Lean
Construction, Boston, MA, USA, sect.1 pp. 93–102, 2016. [8] S. Wenchi, W. Jun, W. Peng, W. Xiangyu, and C. Heap-Yih.
(2017). A cross-sector review on the use of Value Stream
Mapping. International Journal of Production Research, Vol. 55(13), [Online].
Available:http://dx.doi.org/10.1080/00207543.2017.1311031
Dr. Murat Gunduz is a Professor at the
Department of Civil and Architectural
Engineering at Qatar University. His area of
expertise is Construction Engineering and
Management with interest in construction
productivity measurement and improvement,
construction health and safety, data collection and
analysis. He is an editorial board member of
ASCE Journal of Management in Engineering since 2010.
74
International Journal of Structural and Civil Engineering Research Vol. 8, No. 1, February 2019
© 2019 Int. J. Struct. Civ. Eng. Res.