Embed Size (px)
Citation preview

Values and variables Mathematics education in high-performing countries
Mike Askew, Jeremy Hodgen, Sarmin Hossain and Nicola Bretscher, King’s College London
Nuffield Foundation28 Bedford SquareLondon WC1B 3JS
Telephone 020 7631 0566
ISBN: 978-0-904956-77-1
Also available as an electronic publication at:www.nuffieldfoundation.org
Database of sources available at:www.kcl.ac.uk/education/research/mechma
Copyright © Nuffield Foundation 2010
Extracts from this document may be reproduced for non-commercial purposes on the condition that the source is ackno wledged.
2 Values and variables: Mathematics education in high-performing countries
The Nuffield Foundation has commissioned several reviews of aspects of mathematics teachingand learning, both to inform its own work and as a contr ibution to the national debate aboutfuture directions for mathematics education.
This review arises from a conviction that we can benefit from looking at educational pr actices in countries beyond the UK, not necessarily by ‘cherry picking’ good ideas, but rather throughpresenting alternative perspectives on familiar assumptions and pr actices.
Alongside the growth of international comparisons of mathematics attainment in schools inrecent decades, there has been a cor responding growth in the volume of research literatureexploring and comparing the impact of different national systems of mathematics education. This review is an attempt to identify , explore and explain key messages ar ising from thisextensive body of evidence .
We are grateful to the review team for their diligence in under taking this review and are conf identits publication will make a significant contribution to the continuing debates about policy andpractice in the UK and beyond.
Anthony TomeiDirector, Nuffield Foundation
The review teamThe review was led by Professor Mike Askew and co-authored by Dr Jeremy Hodgen, Dr SarminHossain and Nicola Bretscher, all of King’s College London. Additional support was provided byProfessor Margaret Brown and Professor Jill Adler, also of King’s College London, and Laurie Jacques.
The Nuffield FoundationThe Nuffield Foundation is an endowed charitable trust established in 1943 by William Morris(Lord Nuffield), the founder of Morris Motors, with the aim of advancing social w ell being. We fund research and pr actical experiment and the development of capacity to under take them; working across education, science, social science and social policy.
www.nuffieldfoundation.org 3
Foreword

4 Values and variables: Mathematics education in high-performing countries
Introduction 6
Research evidence from countries with high performance in mathematics 7
What factors appear to contribute most to high performance? 11
Roots of or routes to high attainment? 14
Themes
1. Impact of teaching 16
2. What rankings tell us 18
3. Attainment and enjoyment 20
4. Parental expectations 22
5. Starting school 24
6. The language of number 26
7. Attainment gaps 28
8. Shadow education 30
9. Problem solving 32
10. Textbooks 34
11. Teacher subject knowledge 36
12. Pedagogy 38
13. Confidence and attainment 40
14. Wider goals 42
Conclusions 44
References 47
Contents
www.nuffieldfoundation.org 5

6 Values and variables: Mathematics education in high-performing countries
IntroductionThis report addresses two questions posed by the Nuffield Foundation:
• What is the range and type of research evidence from countries with high performance in mathematics that gives insights into the reasons for their relatively high position?
• What constitutes high performance in mathematics learning and what factors appear tocontribute most to achieving it?
Our investigation of the first question led us to believe that there was sufficient evidence tosuggest that the second question was worth investigating.
The following section discusses how we set about answering the first question. We have identifieda wide range of research evidence, and a bibliography arising from this is freely available from theKing’s College London website at www.kcl.ac.uk/education/research/mechma
There then follows a discussion of the assumptions behind international comparisons and thepossible limitations to learning from such studies.
From the detailed review of the literature we identified a number of themes each of which is brieflydiscussed. This is not meant to be an exhaustive list of themes and there are many more we couldhave included. In the interests of keeping this report relatively brief, we selected themes in areaswith strong research evidence, particularly if this evidence could raise questions about practice inteaching mathematics in England. For example, much of the research highlights the importance ofculture and learner dispositions, so many of the themes focus on how pupils directly interact withmathematics education – through engaging with their parents, teachers, lessons, textbooks andshadow education. Factors such as school leadership, inspection and money spent on educationhave less direct impact on the pupil experience and are not considered in detail. This is not to saywe consider such aspects as insignificant, but they are beyond the scope of this study.
In discussing these themes we have necessarily identified a relatively small proportion of the papersin our bibliographic database to include in the reference lists in this review. The full set of corereferences coded against all the themes can be downloaded from the King’s College website.
The final section presents a list of conclusions. While some of these relate directly to the themesdiscussed, this final synthesis draws on our reading of the literature more widely and ourprofessional judgement of the issues that the research raises overall.
www.nuffieldfoundation.org 7
Research evidence from countries with highperformance in mathematicsIdentifying countries with high performance inmathematicsWe selected countries to focus on by:
a) identifying mathematics studies conducted on an international scale, for example by theInternational Association for the Evaluation of Educational Achievement (IEA) and Organisation for Economic Co-Operation and Development (OECD). The studies mainly considered for thisidentification exercise include:
• the First International Mathematics Study (FIMS) 1963–1967• the Second International Mathematics Study (SIMS) 1977–1981• the Third International Mathematics and Science Study (TIMSS) 1995• trends in Mathematics and Science Study (TIMSS) 1999 and 2003• programme for International Student Assessment (PISA) on the performance of 15-year-olds
in mathematics in 2003 and 2006
b) studying data related to average (median or mean) mathematics performance scores from these studies. For each of these studies, countries whose scores were above the internationalaverage were tabularised. We scrutinised the data for those countries that over the years wereconsistently above the international average and ranked within the top ten countries taking part in these international studies.
From this analysis the following countries were identified as displaying high performance inmathematics: Singapore, Hong Kong, Korea, China, Chinese Taipei (Taiwan), Japan, the Netherlands,Belgium, Hungary, Latvia, Czech Republic, Finland, Australia, Russian Federation, New Zealand,Slovenia and Slovak Republic. Based on the amount of research evidence available, and to make the task manageable, we finally concentrated in the main on the Pacific Rim countries and Finland,although we do make reference to the other countries listed here when appropriate. We note thatfurther comparative research is needed into some of the other high-performing countries in thefull list, particularly those whose cultural traditions may be closer to ours than the Pacific Rimcountries. Brief vignettes of the education systems in the Pacific Rim countries and Finland follow.
ChinaWe note that China has only taken part in one international survey, conducted at the beginning ofthe 1990s. Although Chinese students' attainment was high, this survey lacks validity because thesampling of Chinese students was poor. Nevertheless, there is considerable international interest in Chinese mathematics education, which has resulted in a great deal of smaller scale researchsuggesting that some aspects of Chinese mathematics education perform very well. We haveincluded it on this basis.
Compulsory education in China consists of primary schools (Grades 1 to 6) and junior secondary(Grades 7 to 9). Around 50% of pupils go on to senior secondary (Grades 10 to 12) and just over20% of all pupils enter higher education. Mathematics education has a long tradition in China, resistingthe ‘new maths’ of the 1960s and 1970s. The Chinese system is nationally governed with, until the mid1980s, only one allowable series of textbooks. There is a strong emphasis on basic knowledge and
8 Values and variables: Mathematics education in high-performing countries
skills, with extensive practice bringing these about. Textbooks however, have carefully constructedexamples that engage pupils beyond mere ‘drill and practice’. Elementary mathematics teachersappear to have comparatively low instructional loads (10–18 40-minute lessons per week), allowingadditional time for marking, feedback and lesson preparation (Li, Chen, and Kulm, 2009). Chinesepolicy-makers are concerned about the extent to which Chinese students can apply mathematics.
Chinese Taipei (Taiwan)Education in Taiwan consists of six years of elementary school followed by three years of junior highschool, then three years of senior high school. Education is compulsory to the end of junior highschool. Textbooks are regulated by government but produced by private publishers and schools arefree to choose from a list of approved textbooks. The junior high school is differentiated with somevocational schools. Technical training courses are available in the final year of compulsory schooling.Formal symbolic algebra is introduced in elementary school. One feature of mathematics educationin Taiwan is that research funds have been used to replicate seminal international research studies(e.g., Lin, 1988).
FinlandFinland’s pupils have been considered high performers in mathematics given their success in recentPISA studies. Finland ranked first in 2003 (although the Canadian province of Ontario was thehighest scoring) and second after Hong Kong in 2006. This success was a surprise both in Finlandand elsewhere (Pehkonen, Ahtee, and Lavonen, 2007). Efforts to understand this achievement havebeen hampered by a limited research base. The Finnish education system consists of comprehensiveschool education at both primary and lower secondary levels. Children start school at the age ofseven and there are nine years of compulsory schooling. All types of education in Finland are freeand well supported. Student groups are heterogeneous: there is officially no tracking or streaming of students, although the flexible school-based curriculum makes it difficult to know how thecomprehensive policies play out at the classroom level. Class sizes are small, for example the meanwas 18 students in 2003, and 20 students in 2006. Teachers assess students providing descriptiveassessments and feedback. All basic (that is primary and secondary) school teachers must hold amasters degree to become permanently employed.A recurrent theme in the research andcommentaries on Finland’s success is the principle of equity and social justice being central toFinland’s education policy. Efforts and resources have been directed so as to provide equalopportunities to all population groups and regions of the country. Early and rapid intervention for pupils falling behind their peers is one of teachers’ key priorities, with parental support sought.Teaching is generally acknowledged to be rather traditional.
Hong KongThe Hong Kong educational system reflects the region’s historical links to the United Kingdom. Thestructure of the system is closely related to the English system in terms of six years of primary schoolfollowed by five years of secondary school, then two years of pre-university study, although only thefirst three years of secondary school are compulsory. Like England, the school curriculum is dividedinto four key stages and students follow the same curriculum until the end of compulsory education(at around age 15). There is some setting of low-attaining pupils into separate classes. Schools canchoose from a list of approved textbooks. Pupils sit national assessments in mathematics at the end ofKey Stages 1 to 3. A small proportion of pupils do not progress to the next grade at the end of eachyear. Some lessons in primary education are taught by specialist mathematics teachers, although notall schools have specialist teachers. Formal algebra is introduced earlier than in England during theequivalent of Year 5. Hong Kong mathematics teaching is largely teacher-directed.
JapanIn TIMSS and PISA studies that look at pupils’ mathematics performances across a number ofcountries, Japan has been consistently ranked within the top ten high-performing countries.
www.nuffieldfoundation.org 9
The levels of education in Japan consist of: non-compulsory pre-primary (for ages 3–5);compulsory primary education (ages 6–11); lower secondary (ages 12–14); non-compulsory uppersecondary education (ages 15–17 with graduation at generally age 18). There are no entrance orexit criteria at the end of lower secondary and entrance into upper secondary is based on pupils’test scores and report cards from lower secondary. Children with good results stand a betterchance of attending the best upper secondary schools in the area. There are night schools or ‘cramschools’ (Juku), which prepare pupils for upper secondary school entrance exams. Pupils may alsochoose to attend vocational/technical institutes that combine upper secondary school withvocational higher education. Japan’s education system is based on principles that include equalopportunity of access, secular and non-political education. The education system in Japan is highlycentralised and relatively homogeneous. Classes are not streamed – there is an emphasis on auniform educational experience – and much effort is placed in ensuring equality and homogeneity.Differentiation mainly takes place in post-compulsory education, existing between schools insteadof within classes and year groups. Following the TIMSS video study, international attention hasfocused on Japan’s apparently more conceptual teaching and on the practices of lesson study(Stigler and Hiebert, 1999). As in China, Japanese educators are concerned about students’problem-solving and application skills (e.g., Hughes, Desforges, Mitchell, and Carre, 2000).
SingaporeSingapore’s educational structure comprises six years of primary, four years of secondary and twoyears pre-university. Only the first four years of primary follow a common curriculum: pupils followone of two ‘orientation’ curricula in the last two years of primary, one of these being a reducedcurriculum at a slower pace. There is a leaving exam at the end of primary: some pupils take adifferent exam if they have followed the ‘reduced’ curriculum. There are three courses at secondaryschool: around 60% of pupils follow an ‘express course’ leading to a GCE O-level in four years, 25%a ‘Normal’ (academic) course leading to O-level in five years (or an N-level in four years) and 15%in a ‘normal’ (technical) course leading to N-level. Between 20% and 25% of pupils continue touniversity. While the curriculum is centrally mandated and there is high-stakes assessment, schoolshave flexibility over the implementation of the curriculum. Since the 1990s there is no longer asingle state-mandated textbook, with commercial publishers producing textbooks in an openmarket. A five-fold curriculum framework emphasises attitudes and meta-cognition as well as skills,concepts and processes. Compared to its near neighbours, Singapore’s pupils do report moreenjoyment of mathematics.
South KoreaThe Korean educational system comprises six years of elementary, three years of middle school,three years high school and four years of college. Official statistics report 99% of pupils graduatingfrom high school. There is a compulsory core curriculum taught to all pupils to the end of Grade 10.In Grades 11 and 12 there are elective courses. Pupils are assessed at the end of each year and haveto pass to proceed to the next grade level. They may remain in a grade level if they fail the end ofyear assessment, but can only repeat a year once; if they fail a second time, pupils have to move up.Skipping grades is not allowed. Only one textbook series is available at the primary level and allschools use this. Textbooks for secondary mathematics have to follow guidelines provided by theMinistry of Education. Education is hugely important in Korean society, with parents willing to endurepersonal hardships to support their children’s education. But despite the success on internationalcomparisons, Korean policy makers are concerned about pupils’ general dislike of mathematics.
England’s positionIt is worth noting where England sits in all these international studies. England regularly getspositioned towards the top of the group of second ranked countries and its performance is fairlystable over time. It also needs to be noted that the differences between countries’ performanceare not that large and are usually statistically insignificant. The ‘horse race’ approach to the rankingsproduced by international studies – looking to see which position England is placed in and whether
10 Values and variables: Mathematics education in high-performing countries
or not it has moved up or down the league tables – is not that meaningful, partly because theabsolute differences in scores between countries are not that great and partly because theconstituent group of comparators changes from study to study and year to year. Overall and overtime, England’s relative performance is not that worrisome. However, the fact that some countriesare consistently ranked highly (Japan, Korea, and Singapore), and some occasionally dramaticallyimprove (Finland), makes a closer study of such countries worthy of attention.
Judging the literatureHaving identified the countries to focus on, we selected the research literature using several filters.Using electronic searches in the first instance we tracked down literature from a wide range ofstudies conducted within various disciplines, including economics, philosophy and psychology, inaddition to education. This resulted in an initial database of over 1600 papers. Based on theabstracts of papers (or a quick review of the paper itself where an abstract was not available), eachpaper was allocated a rating in terms of Priority 1, 2 or 3, with 1 being those papers that lookedhighly relevant to our study, 2 needing a closer look and 3 not relevant. This initial judgement ofrelevance was based on the extent to which studies addressed: mathematical attainment,international comparisons, the mathematical system/education in one or more of our identifiedcountries, and factors contributing to mathematical attainment. Priority 2 papers were reviewedand some re-ranked as priority 1, resulting in a core database of around 550 papers.
This core group of papers was recoded for a finer grouping according to the substantive aspect of education addressed: national/societal; schooling system; schools, curriculum; pupils; and teachers.We also coded these according to the type of research: original empirical research; policy research;literature review; and critique of research. The groups of papers that emerged from this codingformed the basis of the findings that are discussed in this report.
www.nuffieldfoundation.org 11
What factors appear tocontribute most to highperformance?
Assumptions underlying international comparisonsLooking to countries that are consistently successful in international comparative studies andexpecting to learn directly from studies into these countries embodies certain assumptions.
1. International studies not only measure an appropriate model of mathematical attainment butthat countries deemed to be high performing are indeed doing better at teaching mathematics.
2. Mathematics education practices within those countries are stable, coherent, and codifiable.3. It is differences in these mathematics education practices that mostly account for higher attainment.4. The practices of higher attaining countries if adopted by other countries would also lead to
higher attainment.
Our analysis of the literature indicates fundamental difficulties with all four assumptions.
1. How valid are international studies?It is not our intention to reiterate the arguments pointing out the difficulties and flaws in studies of international comparisons of mathematics education. For example, there may be considerabledifferences in the extent to which schools and students feel the tests are important. In PISA 2006the comparison of first round school participation rates between Finland (100%) and the UnitedKingdom (76%) is telling. Perhaps more striking is the oft-quoted anecdote from TIMSS 1995 ofKorean students marching into the examination hall behind the national flag. Others provide furthercogent arguments into the shortcomings of TIMSS and PISA (see for example Brown, 1998;Goldstein, 2004).
Setting aside the problems in large-scale international studies, there are difficulties over whatconstitutes ‘doing well’ in teaching mathematics. Our review has revealed that those countriessupposedly ‘doing well’ are themselves not satisfied with simply being ranked highly in internationalleague tables. Korea is concerned that its high ranking is based on too much mechanical testpreparation which prevents pupils from developing an ‘investigative attitude and other desirablemental habits’ (Lew, 2008, p. 45). Singapore feels the need to put in place ‘a flexible educationstructure to cater to the different needs and abilities of the students’ (Soh, 2008). Finland isconcerned that having achieved high ranking, the changing demography of the country means thatcurrent approaches may not continue to be successful (Hargreaves, Halasz, and Pont, 2007). Nonation appears to consider itself to be unequivocally successful in their mathematics education.
It is worth noting in the light of this that the ‘gaze’ across nations for insights into mathematicsteaching is not restricted to those countries lower down the international league tables seekingevidence from the higher attaining countries. China is not alone in revising its national curriculumand enshrining many of the qualities that have been encouraged in the United Kingdom, includingmore emphasis on learner-centred lessons (as opposed to teacher centred) and the need todifferentiate provision to meet different learner needs (Xie, 2004).
12 Values and variables: Mathematics education in high-performing countries
2. Can stable, coherent, and codifiable practices be identified?As hinted at above, no education system stands still. The literature indicates that in all high-attainingcountries the education system in general and mathematics education in particular is far fromstable and is frequently reviewed and revised. Even if it were possible to identify practices thatwere in place at a particular time and linked to assessment results, if the country in question isrevising these practices, what would be the point of adopting them elsewhere? Curriculum reformmust be a process of creation not re-creation.
Early international studies examined ‘characteristic pedagogical flow’ (Schmidt, et al., 1996) or culturallesson scripts (Stigler and Hiebert, 1999) with the assumption that there are ‘typical’ national forms ofmathematics lessons. Researchers are now questioning the extent to which there are national lessonstereotypes and whether variations within cultures or even within the same classroom might not bemore revealing (Laborde, 2006). For example, re-analysis of the TIMSS video data indicates that themuch discussed problem-solving approaches of Japanese classrooms may be distinct when teachinggeometry but are similar to practices elsewhere when it comes to algebra (Neubrand, 2006).
When codifying practices something must always be left out and we must be cautious of theselective nature of evidence drawn upon. Taking again the example of the Japanese problem-solvingapproach, rather less discussion is made of: the degree of central control in Japan (over textbooks,curriculum, assessment); the selection procedures in place as pupils move up through school; andthe extent of the shadow education system (after-school programmes). Is it possible to codify fullysuch a complex interplay of elements let alone select which are the most important features?
3. Can differences in mathematics education practices account fordifferences in attainment?
One of the most striking things the review has shown is that high attainment may be much moreclosely linked to cultural values than to specific mathematics teaching practices. This may be a bitterpill for those of us in mathematics education who like to think that how the subject is taught is thekey to high attainment. But study after study shows that countries ranked highly on internationalstudies – Finland, Flemish Belgium, Singapore, Korea – do not have particularly innovative teachingapproaches. Lest this observation be picked up as ammunition for arguing for a ‘back-to-basics’ styleof teaching, we hasten to add that such traditional approaches only appear to succeed because ofcultural conditions that support them, particularly through parental expectations and relativelyhomogeneous populations. And there are many countries that use traditional practices that comelow in international rankings. Given these conditions the conundrum is that if, as Hess and Azuma(1991) claim, such traditional approaches are ‘not conducive to learning’ then why do pupils attainhighly? National culture helps explain this – being born into a culture that highly values success inmathematics establishes a ‘virtuous cycle’ of continuing success.
All too often schools and teachers are written about as if they somehow sit outside theoverarching culture, attitudes and policies of their nation states. Obviously this is not the case,education systems are part of the broader cultural milieu. Culture, beliefs and dispositions have all come through strongly as powerful influences in learning mathematics and we explore these in some detail in this report.

www.nuffieldfoundation.org 13
4. Will adopting the practices of higher attaining countr ies lead tohigher attainment?
Curriculum reform is littered with attempts to ‘cherry pick’ particular parts of successful systems to transfer and adopt elsewhere. Piecemeal adoptions are, however, not likely to succeed if featuresselected are not looked at in terms of their relationship with other aspects of the national cultureand school system. For example, the fact that all teachers in Finland are educated to master’sdegree level should be considered in the context of the high status afforded Finnish teachers, thestrong levels of competition to enter teacher education, the elaborate and time consumingscreening process of applicants and the relatively ‘flat’ differentials in salary across the professions(Wilkinson and Pickett, 2009). Or the success of Chinese pupils in the light of the impact of theone child per family policy in raising parental expectations and child obligations, and Chineseteachers’ understanding of these expectations and obligations, being themselves in the sameposition (Tsui, 2005). Success depends on a close coordination and integration of cultural andmoral values; economic and policy decisions; the organisation of schools and school systems andleadership within these; the curriculum and how it is taught and assessed.
This complexity can lead to the argument that nothing of relevance can be learned: successfulcountries by virtue of their uniqueness set themselves apart and make their success difficult toreplicate. However, we believe all is not lost and that we can learn from other countries.
14 Values and variables: Mathematics education in high-performing countries
Roots of or routes to highattainment?There is an underlying assumption to many international comparative studies that the answer tosuccessful mathematics teaching is ‘out there’; that somewhere, someone has an education systemthat ‘works’. If not in one country, then maybe the answer can be found by looking across several –put together school organisation from one place, with approaches to training teachers fromanother and pedagogic practices from a third, and a composite solution will emerge.
Our review of the research suggests that finding the ‘roots’ of success is an unattainable fantasy. Theresearch on individual countries shows that no nation has got it all. There are opportunity costs tohigh attainment, for example, poor attitudes towards mathematics. And those countries that doperform well on international comparisons have concerns over whether that in itself is the primarygoal of mathematics education.
An additional complexity is the fact that for every aspect of mathematics education linked to highperformance in one particular country, a contradiction can often be found elsewhere. For example,commentators attribute the lack of a centralised assessment structure in Finland as an importantfactor in achieving high levels of teacher autonomy and pupil success. Conversely, Singapore alsoscores highly in international assessments yet has a highly centralised assessment system. Australiahas a very mixed population and out-performs many of the more monocultural Pacific Rimcountries, challenging the assertion that it is the monocultural natures of Finland and Singapore that account for their success.
One response to such contradictions is to question the evidence and argue that the ‘real’underlying cause of differences has yet to be located. Or dismiss certain aspects altogether andlook for the solutions elsewhere. But there is another way to view these contradictions and that is to view decisions in education as arising as much from values and moral positions as to rational,evidence-based choices. Instead of trying to reconcile contradictions or dissolve them, we believethe research shows that there are many routes to high attainment. You can have an egalitarianeducation and high standards (Finland), or you can have a selective one and still have highstandards (Singapore). You can have a problem solving pedagogy (Japan) or you can have a teacher-centred one (Korea) and either can lead to high standards. The choice is about the sort of societyand culture that education can help support or develop. The choices here go beyond mathematicseducation to education through the context of mathematics. If the focus remains only on raisingstandards then is mathematics education being morally responsible?
There is much we can learn from research into high-attaining countries, but it is indirect. It can helpus hold a mirror up to our own practice, to raise questions to reflect back on ourselves.

www.nuffieldfoundation.org 15
16 Values and variables: Mathematics education in high-performing countries
THEME 1: Impact of teaching
Teaching is a minor factor compared to the matchbetween curriculum and test items in explaininginternational differences
TIMSS and PISA provide only a broad-brush picture of mathematics education. Findings from TIMSSsuggest that teaching is no more than a minor factor compared to the match between curriculumand test items in explaining international differences, but teaching still has a significant effect onmathematical learning. Detailed comparative studies are needed that examine the impact ofcurriculum and pedagogy.
Over the past 20 years, much policy, research and media attention has been directed at the ‘better’teaching methods of countries that perform well on international comparisons. There is little evidencethat teaching methods are the major causal factor. For example, in a careful analysis of the SIMS data,Burstein and colleagues concluded that differences in teaching had no discernable effect and the keyfactors in different performance were the content of the curriculum and pupils prior learning:
All we can safely say (we hope) is that students do experience different types ofinstructional arrangements cross-nationally and the influence of these arrangements
generically appears weak relative to such matters as prior learning and the contents of learningopportunities during the course of study. (Burstein, 1992)
TIMSS and PISA are different surveys and, whilst complementary, they each assess different aspects of mathematics. PISA, for example, has a specific focus on mathematical literacy and placesemphasis on application and realistic contexts. This benefits countries that have a similar emphasisin their curriculum, such as Australia and the Netherlands.
There may also be considerable differences in the extent to which schools and students feel that the testsare important. In PISA 2006 the comparison of first round school participation rates between Finland(100%) and the United Kingdom (76%) is telling. Perhaps more striking is the oft-quoted anecdote fromTIMSS 1995 of Korean students marching into the examination hall behind the national flag.
Better mathematics performance or better educationalperformance in general?A legitimate and interesting question is the extent to which better mathematics performance onTIMSS and PISA is a result of factors specific to mathematics teaching and learning or simply areflection of more general educational factors. The TIMSS results suggest a fairly strong associationbetween mathematics and science performance. It seems possible, therefore, that there are somecommon national characteristics across teaching and learning in mathematics and science. Perhapsunsurprisingly, any association between mathematics and reading performance on either PIRLS or PISA is much less clear. In light of this, it may be informative to examine countries where there is a mismatch between performance on mathematics and science. Unfortunately, identifying suchcountries is not straightforward. For example, in TIMSS 2007, Hong Kong’s performance in scienceis worse than that in mathematics, yet in PISA 2006 Hong Kong was the top performer in science.
The Pacific Rim CountriesThere is a great deal of research about mathematics education in Pacific Rim countries that points totwo particular factors impacting on attainment: national culture and curriculum content. The researchhighlighting cultural explanations for high mathematical attainment in these countries converges on, forexample; the Confucian Heritage Culture, the stability of mathematics education over the past two
www.nuffieldfoundation.org 17
millennia (in China), and a national emphasis on effort rather than ability. National cultural effects such asthese are doubtless important but are not amenable to change through changes to educational policy(which is likely to reflect national culture anyway). There is also a danger in treating nations as culturallyhomogenous. We note that, although many claims have been made about China's achievement, there isno robust evidence that the attainment of all Chinese students is high. China has only taken part in oneinternational survey, the IAEP2 in 1990/1, and, whilst Chinese performance was high, the samplingprocess was not robust (Lapointe, Mead, and Askew, 1992).
Looking at the content of the curricula, all the Pacific Rim countries place a much greater emphasis on algebraic manipulation than in England, although the educational benefits of this emphasis might be disputed. As a result, all outperform England on this aspect of algebra in TIMSS. Similarly, the greateremphasis placed on data handling in the English secondary National Curriculum is reflected in England’sstrength in data and chance.
There is much to be learnt from curricular comparisons. For example, in Hong Kong, topics inalgebra are expressed more coherently and holistically (Sutherland, 2002). Hoyles, Foxman andKüchemann (2002) find less emphasis on real world geometry in Japan and Singapore, and moreemphasis on congruence and similarity in Japan. They also found more emphasis on 3D geometryin all countries considered in comparison to England. But such comparisons are best seen asproviding guidance.
Understanding Finland’s high performanceFinland’s performance in PISA is difficult to unpack, largely because there is very little publishedresearch on mathematics education in Finland (Pehkonen, Ahtee, and Lavonen, 2007). It is clear thatFinland undertook substantial reforms to its education system during the last two decades. A greatdeal of attention is directed at the quality of teachers, at systemic equity whereby a commoncurriculum is taught to all students, and at the LUMA1 curricular reforms of the 1990s. The LUMAreforms were directed at the PISA conception of mathematics and set a target of achieving a top-quartile position amongst OECD countries by 2002 (Kupari, Reinikainen, and Törnroos, 2007). Wenote, however, that Finland’s performance on TIMSS 1999 in Grade 8, whilst above average, isconsiderably weaker than that of PISA 2000. Hence, it seems likely that the content of the Finnishcurriculum is the key factor in Finland’s performance in PISA.
Identifying comparable countriesBoth TIMSS and PISA necessarily provide a very broad-brush picture. There is much more to be learnt from more detailed comparisons and there is a pressing need to identify international ‘near-neighbours’ in mathematics education with the potential for illuminating comparative work.We were surprised, for example, to find little comparative work between England and Scotland.Other potentially informative near-neighbours are the Netherlands or the high-performing TIMSSBenchmarking Participant of Massachusetts (for which, unlike Finland, there is a research base and a systemic state reform initiative comparable to those in England, e.g., Riordan and Noyce, 2001).
REFERENCESBurstein, L. (Ed.). (1992). The IEA Study of Mathematics III: Student Growth and Classroom Processes. Oxford: Pergamon Press.Hoyles, C., Foxman, D., and Küchemann, D. (2002). A comparative study of geometry curricula. Sudbury, Suffolk: QCA.Kupari, P., Reinikainen, P., and Törnroos, J. (2007). Finnish students’ mathematics and science results in recent international assessment
studies: PISA and TIMSS. In E. Pehkonen, M. Ahtee and J. Lavonen (Eds.), How Finns learn mathematics and science (pp. 11-34).Rotterdam: Sense Publishers.
Lapointe, A. E., Mead, N. A., and Askew, J. (1992). Learning mathematics. Princeton, NJ: Educational Testing Service’s Center for theAssessment of Educational Progress.
Pehkonen, E., Ahtee, M., and Lavonen, J. (Eds.). (2007). How Finns learn mathematics and science. Rotterdam: Sense Publishers.Riordan, J. E., and Noyce, P. E. (2001). The Impact of Two Standards-Based Mathematics Curricula on Student Achievement in
Massachusetts. Journal for Research in Mathematics Education, 32(4), 368-398.Sutherland, R. (2002). A comparative study of algebra curricula. Sudbury, Suffolk: QCA.
1 LUMA originates in the Finnish Luonnonieteet (Natur al Sciences) and Mathematiikka (Mathematics).
18 Values and variables: Mathematics education in high-performing countries
THEME 2:What rankings tell us
England’s performance on international studies needs to be examined beyond looking at rankings
England’s success in TIMSS 2007 is significant, but it may overstate the performance. At Grade 8(Year 9), pupil results in algebra were below the international average and weak in comparison tocompetitor countries. At Grade 4 (Year 5), performance in number, although above the internationalaverage, was relatively weak in comparison to England’s overall performance in other areas ofmathematics. But these apparent areas of weakness are only important if what is tested in TIMSS is agreed to be important nationally.
England’s performance in TIMSS 2007 has risen significantly from TIMSS 2003 at both Grade 4(Year 5) and Grade 8 (Year 9) (Mullis et al., 2008; Sturman et al., 2008)2. The only countries toperform better than England at both Grade 4 and Grade 8 were the five Pacific Rim countries:Chinese Taipei, Korea, Singapore, Hong Kong and Japan3. However, this broad picture obscuresimportant details, particularly in the attainment of the older age group.
England’s general performanceThe performance of 14-year-olds in England in mathematics, while 13 points higher than theinternational average, is still 57 points below that of Japan, the lowest performing of the Pacific Rimcountries. Moreover, given that relatively few European countries took part in TIMSS 2007 at Grade8, England’s international ranking (7th) is difficult to judge in terms of our European neighbours,although other results shed some light on this.
For example, England’s mathematics performance on the 2006 OECD PISA survey of 15-year-oldsis not significantly different to the international average. In total, 18 countries perform significantlybetter than England, including five Pacific Rim countries (Chinese Taipei, Korea, Macao, Hong Kongand Japan) and seven European countries (Finland, the Netherlands, Belgium, Estonia, Denmark, theCzech Republic and Slovenia) (Bradshaw et al., 2007). The highest performing group of countries inPISA 2006 contains just three of the Pacific Rim countries (Chinese Taipei, Korea, and Hong Kong,but not Japan) together with Finland (Programme for International Student Assessment, 2007).
Performance on contentReturning to TIMSS 2007, at Grade 4 (Year 5), England’s performance was significantly above theinternational average in all three content areas: number, geometric shapes and measures, and datadisplay. Performance on number (and computation) was significantly lower than in the other twoareas, although still above the international average. This is somewhat surprising given the focus ofthe National Numeracy Strategy (NNS) over the past decade. However, findings on achievementin number from the Leverhulme Numeracy Research Programme suggest that improvements dueto the NNS have been relatively modest (Brown, Askew, Millett, and Rhodes, 2003).
At Grade 8 (Year 9), England’s performance differed across the content areas with data and chancestrong compared to number and geometry. Algebra was weak in comparison to the other areaswith performance just below the international average. There is an emphasis with TIMSS items ontraditional algebraic manipulation, which is likely to benefit those countries that emphasise this intheir curricula (including the Pacific Rim, but not England). However, recent research comparingEnglish students’ understanding of algebra with that of 30 years ago suggests there has been littlechange in general at Year 9 (Hodgen, Küchemann, Brown, and Coe, 2009). This raises two concernsabout participation in mathematics post-16. First, algebra is key to higher levels of study in
www.nuffieldfoundation.org 19
mathematics and STEM disciplines. Second, algebra is frequently cited by students as a reason fordropping mathematics (Osborne et al., 1997).
Performance on knowing, applying and reasoningThere was no significant difference between England’s scores for Year 5 pupils across the threecognitive domains of knowing, applying and reasoning. In contrast, England’s score in the cognitivedomain of applying in Year 9 was only slightly above average and lower than that for the twodomains of reasoning and knowing. This lower performance on application may also be reflected inEngland’s performance in PISA 2006 as indicated above. This is a disappointing finding given that ina previous international survey conducted by IAEP two decades ago, England’s performance inproblem-solving surpassed all others, including the Pacific Rim (Lapointe, Mead, and Philips, 1989).The TIMSS 2007 score may indicate a decline in the key area of application and problem-solvingover this period.
General improvement?At both grades, the increase in overall performance in mathematics was associated withimprovements in the middle score range, but there was no significant change to the proportion of students at the highest level of performance, the advanced benchmark. Replication results fromthe Concepts in Secondary Mathematics and Science (CSMS) study show a similar pattern thatstudents’ understanding of some algebraic ideas has declined at the higher levels of attainment(Shayer and Ginsburg, 2009).
In common with both higher and similar attaining countries, the proportion of students with highlypositive attitudes to mathematics has fallen at both grades. At Grade 4, 62% of students had highlypositive attitudes to mathematics, and at Grade 8, the figure was 40%.
England was relatively unusual in showing no overall gender differences for mathematicsperformance at either Grade 4 or Grade 8, but, at both grades, significantly more boys showed a high level of confidence in learning mathematics.
REFERENCESBradshaw, J., Sturman, L., Vappula, H., Ager, R., and Wheater, R. (2007). Achievement of 15-year-olds in England: PISA 2006 National
Report (OECD Programme for International Student Assessment). Slough: NFER.Brown, M., Askew, M., Millett, A., and Rhodes, V. (2003). The key role of educational research in the development and evaluation of
the National Numeracy Strategy. British Educational Research Journal, 29(5), 655-672.Hodgen, J., Küchemann, D., Brown, M., and Coe, R. (2009). Secondary students’ understanding of mathematics 30 years on. Paper
presented at the British Educational Research Association (BERA) Annual Conference, University of Manchester.Lapointe, A. E., Mead, N. A., and Philips, G. W. (1989). A world of difference: An international assessment of mathematics and science.
Princeton, NJ: Educational Testing Service.Mullis, I. V. S., Martin, M. O., Foy, P., Olson, J. F., Preuschoff, C., Erberber, E., et al. (2008). TIMSS 2007 International Mathematics Report.
Chestnut Hill, MA: TIMSS and PIRLS International Study Center, Boston College.Osborne, J., Black, P., Boaler, J., Brown, M., Driver, R., and Murray, R. (1997). Attitudes to Science, Mathematics and Technology: A review
of research. London: King’s College, University of London.Programme for International Student Assessment, P. (2007). Science competencies for Tomorrow’s World: Volume 1 Analysis. Paris:
Organisation for Economic Co-operation and Development (OECD).Shayer, M., and Ginsburg, D. (2009). Thirty years on – a large anti-Flynn effect? (II): 13- and 14-year-olds. Piagetian tests of formal
operations norms 1976-2006/7. British Journal of Educational Psychology, 79, 409-418.Sturman, L., Ruddock, G., Burge, B., Styles, B., Lin, Y., and Vappula, H. (2008). England’s Achievement in TIMSS 2007 National Report for
England. Slough: NFER.
2 To allow for comparison across years, the TIMSS scales are referenced to the 1995 assessments. The scales are set for eachgrade with a mean of 500 and a standard deviation of 100.
3 At Grade 4: England (541) compared to Hong Kong (607), Singapore (599), Chinese Taipei (576), and Japan (568). At Grade 8:England (513) compared to Chinese Taipei (598), Korea (597), Singapore (593), Hong Kong (572) and Japan (570). In 2007Korea took par t only at Grade 8. England’s performance was also below that of three Benchmar king Participants,Massachusetts and Minnesota at Gr ade 4 and Massachusetts, Minnesota and Quebec at Gr ade 8.
20 Values and variables: Mathematics education in high-performing countries
THEME 3: Attainment and enjoyment
High attainment and pleasure in learning mathematicsare difficult goals to reconcile
Education systems, and mathematics education in particular, are determined by values that may not always be explicitly stated. These values relate to ‘cultural identities’ that may be more or lesshomogeneous in different contexts. Groups with a cultural identity of being good at mathematics do not necessarily also identify themselves as enjoying mathematics.
The new curriculum emphasises: practical mathematics such as problem solving,application and modelling of mathematics, reasoning. More students have to leave
school absorbing mathematics and having confidence.
Content should be associated with social life and keeping attention on students’interests and practices. Students should be encouraged to take active participation
in investigation, field work, communication and cooperation.
Find pleasure in mathematical activities; make good use of mathematics in daily lifesituations.
These quotations might have been taken from any recent English mathematics curriculum policydocument. They actually come from presentations by policy makers representing Korea, China andJapan at a conference held in 2005 (Usiskin and Willmore, 2008). As Broadfoot (2000) points out,goals for education are broadly aligned internationally and aspire to high levels of attainment alongwith learning dispositions and positive attitudes. Our review of research in international mathematicseducation reveals that high-performing countries are as concerned over pupils’ dislike of mathematicsas we are in England. As literature from within high attaining nations becomes available (as opposedto findings reported by outsiders gazing towards other cultures), it reveals a dislike of mathematics.(Hirabayashi, 2006; Leung, Graf, and Lopez-Real, 2006).
[If in Japan] the aim of mathematics education is to make pupils hate mathematics, thenin this point we may have very much succeeded. (Hirabayashi, 2006)
Why do East Asian pupils excel?Leung (2006) raises the question of ‘Why do East Asian pupils excel?’ in relation to these pupils’high attainment in a context of negative attitudes to mathematics. It has become commonplaceknowledge that the Pacific Rim countries place more emphasis on pupils’ efforts than on innateability. Hatano (1990), for example, typically comments that in Asian cultures ‘people generally tendto assign much more importance to effort in regard to skills that every member of the society isexpected to acquire, ability may be considered more important in the case of optional skills’ (p. 112). Two constructs that appear to promote this emphasis on effort over ability are extrinsicmotivation and cultural identities.
Extrinsic versus intrinsic motivation Various authors argue that in certain cultures exams provide a powerful and accepted source ofexternal motivation. In particular China, Japan and Korea have a long tradition of links between high social and economic status to success in examinations. Pupils in these countries may be less
www.nuffieldfoundation.org 21
interested in the mathematics itself and more in the status afforded by exam success (Lew, 2008;Soh, 2008; Tsuneyoshi, 2004). In East Asian countries parents and teachers alike accept that workingtowards success on examinations is a major goal of education and that what is learned is lessimportant than exam success. Policy makers in East Asian countries, however, express concerns overthe dominance of this instrumental view of mathematics education (Usiskin and Willmore, 2008).
Cultural identitiesThe observation that pupils in Asian countries cannot escape mathematics as a ‘national… intellectualpursuit’ (Hatano, 1990, p. 112) links with studies showing how an individual’s cultural identities canimpact on test performance. A US study brought together three groups of female Asian high schoolstudents that each met with a female Asian researcher. The control group chatted generally beforetaking a mathematics test. In another group the researcher led the conversation to focus on the factthat they were all women, while the third group were steered to talk about being Asian. This last groupperformed better than the control group on the mathematics test, while the group tuned into theirfemaleness performed worse. The argument put forward is that attunement to particular culturalidentities – being female or Asian in this case – carries with it particular stereotypes – being worse or better at mathematics than the average – which subsequently get played out (Shih, Pittinsky, andAmbady, 1999). Similar results have been shown for other cultural groups such as black American boys.
Studying hard versus pleasurable learningSuccess within such exam-oriented systems requires effort, and any pleasure is a result of the successattained rather than derived through the processes of learning per se. Researchers within the EastAsian tradition are split on the value of exam-oriented systems, some arguing for reducing theexamination pressure to improve pupils enjoyment, others questioning whether this is a wise move.
If the price to pay for enjoyment is low achievement, should we consider whether theprice is too high? (Leung, 2009)
Implicit goals that arise from nations’ different socio-cultural-historical backgrounds have a powerfulinfluence on pupil attainment. These implicit goals make ‘borrowing’ policies and practices problematicbecause adopting practices from elsewhere might mean adopting implicit goals that do not fit withEngland’s vision for society or individuals. For example, the Asian emphasis on effort, while a factor inhigh attainment, is also closely aligned with obedience and authority.
REFERENCESBroadfoot, P. (2000). Comparative Education for the 21st Century: Retrospect and Prospect. Comparative Education, 36(3), 357-371.Hatano, G. (1990). Commentary: Toward the cultural psychology of mathematical cognition. In H. W. Stevenson, S.-Y. Lee, C. Chen, J .
W. Stigler, C.-C. Hsu, S. Kitamura and G. Hatano (Eds.), Contexts of Achievement: A Study of American, Chinese, and Japanese Children.Monographs of the Society for Research in Child Development (Vol. 55, pp. 108-115): Society for Research in Child Development.
Hirabayashi, I. (2006). A traditional aspect of mathematics education in Japan. In F. K. S. Leung, K. D. Graf and F. J. Lopez-Real (Eds.),Mathematics education in different cultural traditions: a comparative study of East Asia and the West. The 13th ICMI Study (pp. 51-64). Dortrecht: Springer.
Leung, F. K. S., Graf, K. D., and Lopez-Real, F. J. (Eds.). (2006). Mathematics education in different cultural traditions: a comparative studyof East Asia and the West. The 13th ICMI Study. Dortrecht: Springer.
Leung, F. K. S. (2009). In Search of Explanations for the High Performance of East Asian Students in International Studies of MathematicsAchievement. Paper presented at the Mathematics Education Seminar Series, Institute of Education, University of London, 23 February.
Lew, H.-c. (2008). Some characteristics in Korean National Curriculum and its revision process In Z. Usiskin and E. Willmore (Eds.),Mathematics curriculum in Pacific Rim Countries – China, Japan, Korea and Singapore. (pp. 37-78). Mississippi: Information Age Publishing.
Shih, M., Pittinsky, T., and Ambady, N. (1999). Stereotype Susceptibility: Identity Salience and Shifts in Quantitative Performance.Psychological Science, 10(January), 80-93.
Soh, C. K. (2008). An overview of mathematics education in Singapore. In Z. Usiskin and E. Willmore (Eds.), Mathematics curriculumin Pacific Rim Countries – China, Japan, Korea and Singapore. (pp. 23-36). Mississippi: Information Age Publishing.
Tsuneyoshi, R. (2004). The new Japanese educational reforms and the achievement ‘crisis’ debate. Educational Policy, 18(364-394).Usiskin, Z., and Willmore, E. (Eds.). (2008). Mathematics curriculum in Pacific Rim Countries – China, Japan, Korea and Singapore. .
Mississippi: Information Age Publishing.
22 Values and variables: Mathematics education in high-performing countries
THEME 4:Parental expectations
Parental expectations are more influential than directinvolvement
Parents with accurate or realistic expectations of their children’s mathematical attainment have more impact on their children’s learning than parents who over-estimate their children’s attainment.Parents’ realistic expectations have more impact on pupil attainment than direct parentalinvolvement, such as helping with homework.
Parental expectationsThe research evidence points to parental expectations being closely related to pupils’ achievement.For example, a comparison of US and South Korean data from TIMSS 1995 suggests that oneimportant factor underlying higher attainment in South Korea was a close alignment between theeducational objectives and aspirations of home and school (Paik 2001).
Parental expectations play out through how parents judge their particular child against personal andcultural ‘benchmarks’ of appropriate attainment. A comparative study of 1440 first and fifth gradepupils from Japan, Taiwan and the US found maternal attitudes in the Asian societies to be differentfrom those in the US. American mothers were more interested in their children’s general cognitivedevelopment than in their specific mathematical achievement. Chinese and Japanese mothers gavemore realistic evaluations of their children’s mathematical achievements (Stevenson et al. (1990).Other studies show that American parents tend to view their children in a favourable light, judgingthem as doing well against their perceived benchmark standards, whereas Asian parents tend toview their children either modestly or more accurately in relation to their benchmarks (Bell, 1993;Cai and Silver, 1995). The suggestion is that this leads Asian parents to put more pressure on theirchildren to study and work hard in mathematics as they have yet to live up to parental expectations.
Many of these studies have been conducted with middle-class parents, raising the question ofconsistency of parental expectations across different socio-economic groups. One study comparingparental expectations across different socio-economic status (SES) in both China and the UnitedStates found similarities in expectations across SES in China. Questionnaire data (parents and pupils)from Wuhan, a large industrial city, is reported on 990 returns from eighth grade pupils across threesecondary schools (one highly selective and two ‘regular’ schools). The data included information onfamily income and identified some families as below the official poverty line. Chinese parents in thislow-income category did not express lower expectations for their child: 79.7% reported highexpectations for their child (exceeding the 74.3% of high-income US parents reporting the sameexpectations). The Chinese parents, across all SES groups in the survey, reported that, after food,education was the second highest household expenditure with 55% reporting the hiring of tutorsand 76% indicating that they would borrow money for their child to go to college (Tsui, 2005).
Tsui suggests that the traditional high status of mathematics in China has been reinforced throughmarket reforms and the one child per family rule. Chinese parents look to their child for security intheir old age, so families in urban China have become ‘almost obsessed’ with academic success andthe pressure on children not to let their parents down is great.
www.nuffieldfoundation.org 23
Parental involvement While accurate parental expectations have been shown to be positively associated with pupilattainment, the evidence of the impact of direct parental involvement, for example throughteaching children at home or helping with homework, is mixed.
For example, research indicates that Chinese parents are more likely to provide direct instructionin mathematics to their children and help more with homework (Caplan, Choy, and Whitmore,1992; Chen and Stevenson, 1989). Such direct involvement does appear to have an impact onchildren’s mathematics in the early years (Huntsinger, Jose, Liaw, and Ching, 1997), but oncechildren start school, direct involvement appears to have less impact on the performance than thatof indirect involvement through providing tutors or sending children to after school programmes(Cai et al., 1995, Wang, Wildman and Calhoun, 1996).
Some parental involvement comes about through cultural expectations and policy. Chinese parentsare required to buy the textbooks prescribed for their children, from primary years onwards forexample, and that may influence expectations. Teachers and parents together expect children towork on these with pressure to keep up (Shiqi, 2006). Colleagues in China have expressed surprisethat in England textbooks are provided by the state and at the lack of expectation that pupilswould do extra work from textbooks at home. While we might expect parents to provide revisionbooks for GCSE and some do buy revision materials for end of KS2 tests, this is different from aculture where providing textbooks is a requirement.
In Finland direct parental involvement appears to be brought about at the instigation of teachers.Finnish schools report a high proportion of pupils with special educational needs, but the highfigures appear to be the result of early identification of pupils who are not keeping up with theirpeers in particular aspects of the curriculum. Early contact is made with parents to discuss whatprovisions to make (and children themselves are brought into the conversation) (Sahlberg, 2007),thus raising parental awareness of expectations and their child’s attainment from an early age.
National cultural factors are difficult to change, but parents and children from all socio-economicgroups need to be engaged in conversations about expectations and to receive realistic andspecific feedback and expectations about their learning.
REFERENCESBell, G. (1993). Asian perspectives on mathematics education. Maths x language = language x maths (Vol. 197).Cai, J., and Silver, E. A. (1995). Solution Processes and Interpretations of Solutions in Solving a Division-with-Remainder Story
Problem: Do Chinese and U. S. Students Have Similar Difficulties? Journal for Research in Mathematics Education, 26(5), 491-497.Caplan, N., Choy, M. H., and Whitmore, J. K. (1992). Indochinese refugee families and academic achievement. Scientific
American 266, 36-42.Chen, C., and Stevenson, H. W. (1989). Homework: A Cross-Cultural Examination. Child Development, 60(3), 551-561.Huntsinger, C. S., Jose, P. E., Liaw, F.-R., and Ching, W.-D. (1997). Cultural Differences in Early Mathematics Learning: A Comparison of
Euro-American, Chinese-American, and Taiwan-Chinese Families. International Journal of Behavioral Development, 21(2), 371-388.Paik, S. J. (2001). Introduction, background, and international perspectives: Korean history, culture, and education. International
Journal of Educational Research, 35(6), 535-607.Sahlberg, P. (2007). Education policies for raising student learning: the Finnish approach. Journal of Education Policy, 22(2), 147-171.Shiqi, L. (2006). Practice makes perfect: a key belief in China. In F. K. S. Leung, K. D. Graf and F. J. Lopez-Real (Eds.), Mathematics education
in different cultural traditions: a comparative study of East Asia and the West. The 13th ICMI Study (pp. 129-138). Dortrecht: Springer.Stevenson, H. W., Lee, S.-Y., Chen, C., Stigler, J. W., Hsu, C.-C., Kitamura, S., et al. (1990). Contexts of Achievement: A Study of
American, Chinese, and Japanese Children. Monographs of the Society for Research in Child Development, 55(1/2), i-119.Tsui, M. (2005). Family Income, Home Environment, Parenting, and Mathematics Achievement of Children in China and the United
States. Education and Urban Society, 37(3), 336-355.Wang, J., Wildman, L., & Calhoun, G. (1996). The relationships between parental influence and student achievement in Seventh
Grade Mathematics. School Science and Mathematics, 96(8), 395-399.
24 Values and variables: Mathematics education in high-performing countries
THEME 5: Starting school
Evidence is mixed on the impact of children’smathematics on entry into school
Many researchers argue that parental involvement or pre-school experiences in young children’smathematics directly impacts upon early mathematical attainment. Not all the evidence supports this assertion.
The view that early parental influence is important in mathematical attainment is supported by astudy involving interviews with parents of 40 second-generation Euro-American and 40 Chinese-American children from well-educated two-parent families in urban Chicago. The parents of 40Chinese children were also interviewed from a similar population in Taipei, Taiwan. The 40 childrenin each of these 3 groups comprised 10 each of preschool boys and girls and 10 each ofkindergarten boys and girls (Huntsinger, Jose, Liaw, and Ching, 1997).
The children were given two assessments, a test of early mathematical ability, and an assessment ofnumeral formation. Parents individually completed a questionnaire, and then mothers and fatherswere interviewed together. Neither the questionnaire nor the interview prioritised mathematics –the parents were informed that the research was about supporting their children generally.Huntsinger and colleagues found that the Taiwanese children performed significantly better thanthe Euro-American children (the Chinese-American children performed best of all). Theresearchers attribute these differences to two factors.
Firstly, more formal instruction by the Chinese parents, as indicated by their interview responses.In contrast the Euro-American parents spoke more in terms of informal learning and theimportance of play.
Secondly, parental attitudes towards mathematics in general and the influence these had on theirchild-specific beliefs. The more positive the parental attitudes towards mathematics, the higherexpectations they had of their children’s capability and interest in mathematics. In turn, childrenhighly rated by their parents in terms of mathematical interest and ability scored more highly onthe mathematics test. Of course it could be that parents recognised their child’s mathematicalaptitude and so rated them more highly. Taiwanese parents on the whole expressed more positiveattitudes towards mathematics than the Euro-American parents.
While the authors suggest this might mean rethinking what is considered to be appropriate teachingfor young American children, they also point out that the Chinese predisposition to calmness ininfancy may support children’s tolerance of early formal instruction (Kagan, et al., 1994).
Contrasting findingsIn contrast, findings about Korean children do not indicate that they start school with any particularmathematical advantage: their performance on an assessment of early years’ mathematical skills andunderstanding was poorer than that of an American sample. This is accounted for by the Koreanattitude that it is ‘indecent’ to engage pre-school children in formal mathematical activities.However, although the American 4- and 5-year-olds out-performed the Korean children, by the age of 7 the situation was reversed and the Korean children performed at a higher level. Reasonssuggested for the acceleration of the Korean children include early difficulties they experience inlearning two counting systems (an informal one and a formal one) and the greater amount of timedevoted to teaching mathematics once they start school (Song and Ginsburg, 1987).

www.nuffieldfoundation.org 25
Cross-country comparisons amongst six European countries (Belgium, Germany, Greece, theNetherlands, United Kingdom and Slovenia) of the numeracy development of 5–7 year olds foundlittle difference in attainment across the countries, despite a wide variety in the country’s earlyeducation policies (Van de Rijt, et al., 2003). In another study, Scottish, English, Australian and NewZealand children’s scores on a baseline assessment were examined against the amount of pre-school experience the children had. This experience ranged from zero to six terms of experience:only a ‘minimal link was found for mathematics’ between experience and attainment, although thedata for England alone did show a ‘strong and clear’ positive relationship (Merrell and Tymms, 2007p.123). The Effective Provision of Pre-school Education project reports a positive effect of pre-school on mathematics at end of KS2 (although the finding relates to pre-school not formalmathematics teaching in pre-school) (Sylva, Melhuish, Sammons, Siraj-Blatchford, and Taggart, 2008).
We need to ensure that England’s early years curriculum maximises children’s potential for learningmathematics once they enter school. Research is needed into whether or not our expectations forattainment in early years’ mathematics are appropriate.
REFERENCESHuntsinger, C. S., Jose, P. E., Liaw, F.-R., and Ching, W.-D. (1997). Cultural Differences in Early Mathematics Learning: A Comparison of
Euro-American, Chinese-American, and Taiwan-Chinese Families. International Journal of Behavioral Development, 21(2), 371-388.Kagan, J., Arcus, D., Snidman, N., Feng, W., Hendler, J., and Greene, S. (1994). Reactivity in infants: A cross-cultural study.
Developmental Psychology, 26, 342-345.Merrell, C., and Tymms, P. (2007). what children know and can do when they start school and how this varies between countries.
Journal of Early Childhood Research, 5(2), 115-134.Song, M.-J., and Ginsburg, H. P. (1987). The Development of Informal and Formal Mathematical Thinking in Korean and U. S.
Children. Child Development, 58(5), 1286-1296.Sylva, K., Melhuish, E., Sammons, P., Siraj-Blatchford, I., and Taggart, B. (2008). Final Report from the Primary Phase: Pre-school, School
and Family Influences on Children’s Development During Key Stage 2 (Age 7-11). Research Report DCSF-RR061. London:Department for Schools, Children and Families.
Van de Rijt, B., Godfrey, R., Aubrey, C., Luit, v., J. E. H., Ghesquiere, P., Torbeyns, J., et al. (2003). The development of early numeracy inEurope. Journal of Early Childhood Research, 1(2), 155-180.
26 Values and variables: Mathematics education in high-performing countries
THEME 6: The language of number
Asian languages support early adoption of mentalstrategies
The number names in Asian languages make the base ten structure more transparent. This, andother features of the language, may mean that East Asian children move more quickly in earlycalculating from counting methods to strategic mental approaches.
Greater transparency of the place value systemAsian number names make the place value structure of grouping in tens more transparent: ten-one,ten-two, ten-three and so on rather than eleven, twelve, thirteen … and two-ten-one, two-ten-twoetc. for twenty-one, twenty-two… As well as this more transparent base-ten structure there arefewer number names to commit to memory – one to ten and then combinations of these. There is also less phonetic confusion: whereas English children often encounter difficulties over the similarsounds of ‘thirteen’ and ‘thirty’, ten-three and three-ten are clearly differentiated in Chinese, Japaneseand Korean. The naming also more closely matches the Arabian numerals: saying ‘ten-five’ correspondsmore to the grapheme ‘15’ than does ‘fifteen’. Representation in Asian characters is even moretransparent with the numeral 35 written as the equivalent of three-ten(s)-five.
A study investigated whether these differences affected how children might model two-digitnumbers. American, Chinese, Japanese and Korean children with an average age of just over six years eight months were shown a variety of two-digit numerals, for example 43 or 62, and asked to represent them using base-ten blocks (which none of the children had met in school). Afterproducing a first representation the children were asked if they could use the blocks to show thesame number differently. The vast majority of the US children (91%) initially represented thequantities by counting out that number of single cubes, whereas the Chinese, Japanese and Koreanchildren were much more likely to represent the quantities using tens and ones blocks (81%, 72% and83% respectively). A group of younger Korean kindergarten children were also included – more ofthem acted like the US children (59%), but even 34% of these children could make an accuraterepresentation using tens and ones. On being asked to make a second different representation, halfthe American children could not make a different construction for any of the five numerals that theywere presented with – they could only rearrange the single cubes into a different visual arrangement.The majority of the Asian children could create a distinctive second representation (76% Chinese,79% Japanese, 98% Korean first graders) (Miura, Kim, Chang, and Okamoto, 1988).
Speed of number pronunciationDigit names in Asian languages (including Chinese, Japanese and Korean) are shorter and morequickly pronounced than their English counterparts (less than a quarter of a second as comparedto a third of a second). This means that more digits can be held in working memory (around 2 digits more and 3 in Cantonese (Dehaene, 1997). Citing research comparing Americankindergartners with Chinese kindergartners, researchers noted that the former counted moreoften on their fingers, while the latter counted verbally to find totals (Geary, Bow-Thomas, Fan,and Siegler, 1993). They speculated this may lead to early adoption of strategies other thancounting on fingers when calculating with small numbers.
www.nuffieldfoundation.org 27
Adopting strategic approaches There is evidence that Asian children adopt addition strategies based on partitioning(decomposition) of digits, rather than counting in ones, sooner than American peers. Thehypothesis is that this is the result of the Asian language number naming system. For example,adding 6 + 8, Korean children might decompose the 8 into 4 + 4 and calculate 6 + 4, then 10 + 4(Fuson and Kwon, 1992). The suggestion is that the naming of 14 as ‘ten-four’ allows for the earlierand easier adoption of such strategies by Asian speaking children: since they know ‘ten’ is an aspectof naming the final total they partition the numbers in order to make ten. Geary’s researchcomparing Chinese and American children’s strategies supports this hypothesis: second and thirdgrade children in each nation differed in the ‘back-up’ strategies used for additions they could notrecall: Chinese children used this partitioning strategy earlier and more frequently, while USchildren reverted to finger counting. These researchers also found there was a greater increase inthe Chinese pupils’ test scores within the academic year than there was for the American pupils.
The result of language?Whether these early differences are purely a result of language differences has to be consideredin the light of differences in opportunity to learn. The Chinese children in each of the grades 1, 2and 3 had received between 20 and 25% more mathematics lessons than the American childrenin the same grades, a difference confirmed by other studies (James W. Stigler, 1988). From aregression analysis controlling for this additional opportunity, Geary and colleagues conclude thatthe extra teaching time did contribute to differences in performance but did not totally explainthem. Differences in the number of mathematics lessons that children experience appears toaccount for some but not all of the differences in cross-national mathematical performance.
Whether such early differences in achievement have a lasting impact is open to question. Given that(most) English pupils do replace finger counting with strategic methods and recall of number facts,albeit later than Asian pupils do, such early advantages may be thought of as ‘washing out’. On theother hand the early use of verbal counting and the partitioning strategy for adding single digits maypredispose Asian children to construct mathematical ‘mental objects’ and to come more quickly toregard mathematics as a mental rather than a physical activity. Other research has shown that relyingon counting methods can restrict children’s progress (Gray and Pitta, 1996, Askew, Bibby, and Brown,1997).
REFERENCESAskew, M., Bibby, T., and Brown, M. (1997). Raising attainment in numeracy: Final Report to Nuffield Foundation. London: King’s College,
University of London.Dehaene, S. (1997). The number sense: How the mind creates mathematics. Oxford: Oxford University Press.Fuson, K. C., and Kwon, Y. (1992). Korean children’s single-digit addition and subtraction: Numbers structured by ten. Journal for
Research in Mathematics Education, 23(2), 148-165.Geary, D. C., Bow-Thomas, C. C., Fan, L., and Siegler, R. S. (1993). Even before formal instruction, Chinese children outperform
American children in mental addition. Cognitive Development, 8, 517-529.Gray, E. M., and Pitta, D. (1996). Number processing: qualitative differences in thinking and the role of imagery. Paper presented at the
Proceedings of the Twentieth Annual Conference of the International Group for the Psychology of Mathematics Education,University of Valencia, Spain.
James W. Stigler, M. P. (1988). Mathematics learning in Japanese, Chinese, and American classrooms. New Directions for Child andAdolescent Development, 1988 (41), 27-54.
Miura, I. T., Kim, C. C., Chang, C.-M., and Okamoto, Y. (1988). Effects of Language Characteristics on Children’s CognitiveRepresentation of Number: Cross-National Comparisons. Child Development, 59(6), 1445-1450.
28 Values and variables: Mathematics education in high-performing countries
THEME 7: Attainment gaps
High attainment does not necessarily close theattainment gap between pupils from differingsocio-economic backgrounds
Teachers’ mathematics qualifications do not appear to be strongly linked to average levels of pupilattainment. However, differences in teachers’ qualifications are associated with the attainment gapbetween pupils from high and low socio-economic status backgrounds: in high-attaining countrieswith a wide attainment gap, pupils from lower socio-economic status (SES) backgrounds are lesslikely to be taught by well qualified, experienced teachers.
International data shows that countries with high average attainment in mathematics have not allsucceeded in narrowing the attainment gap between pupils from different SES backgrounds. Ananalysis of the TIMSS 2003 mathematics attainment data produced a measure of the gap betweenpupils from high and low SES backgrounds. Ranking the 41 countries according to this measure ofthe gap between high and low SES pupil scores, Korea and Taiwan are in the top ten countries withthe widest gaps. Korea, with a mean average gap of 132 points, is third after South Africa (140 pointgap) and Chile (133 points difference), countries which are ranked bottom and eighth from bottomrespectively in terms of mean average pupil scores (Akiba, LeTendre, and Scribner, 2007). Ranked interms of the average pupil score, Singapore, South Korea, Hong Kong, Taiwan, and Japan are the topfive countries: Korea and Taiwan’s high average scores mask the attainment gap in these countries.
We can see from the figures that both high-achieving countries such as Korea and Taiwanand low-achieving countries such as Chile and South Africa produce large achievement
gaps between high-SES and low-SES students …. The data show that high-achieving countries donot necessarily produce a smaller achievement gap between high and low SES students.
(Akiba et al., 2007)
Teacher characteristics and attainmentTo explore possible reasons for this finding, the researchers used the TIMSS questionnaire data to draw up five measures of teacher qualities: certification, whether they had studied eithermathematics or mathematics education as a ‘major’ in their training (treated as two separatevariables), number of years teaching experience and a composite measure of ‘teacher quality’. No data were available for England on certification, so England is neither included on that strand of analysis on certification nor on the composite strand.
Each of these five teacher measures was considered in relation to mean pupil scores andachievement gap scores. Whether or not teachers had studied mathematics (as opposed tomathematics education) produced the most revealing results. In terms of average pupil attainment theresearchers found a positive relationship between the teacher having studied mathematics and higherlevels of pupil attainment. The teacher ‘having studied mathematics’ taken together with being ‘fullycertified’ and ‘years of teaching experience’ resulted in a more positive correlation with pupilattainment. This result may be the consequence of more experienced teachers being assigned toteach higher attaining pupils rather than more experienced teachers being better at raising standards.
www.nuffieldfoundation.org 29
Teachers who had studied mathematics were significantly more likely to be teaching groups with a narrower attainment gap between pupils from high or low SES backgrounds. None of the othermeasures produced a similarly significant effect on the narrowing of the attainment gap.
Opportunity gapThe researchers report an ‘opportunity gap’ between the percentage of pupils from high SES and low SES backgrounds who were taught by a teacher who reported themselves as having amathematics major. Chile is reported as having the largest opportunity gap with 24.2 % differenceand Taiwan is fifth at 15. 4 %. England was ranked fourth at 17.5% (England does not come in thetop ten countries with the largest attainment gap and no figure is given for the size of this gap.)
An anomaly here is South Korea. The reported opportunity gap between pupils of high and low SES being taught by a teacher with a mathematics major is comparatively small at 6.5% (althoughthis still results in Korea being ranked 12 out of 41), and yet there is a wide attainment gap in Korea.Teachers in Korea do not choose which schools to apply to work in. They are hired by the city orprovince and then assigned to schools. After five years, they are re-assigned to a different school. This regular movement of teachers between schools is designed to even out the quality of teachersacross schools (Kang and Hong, 2008). The high uniformity of South Korean schools apparentlymakes such deployment policies acceptable to teachers, together with incentives for teaching indifficult areas (for example remote or particularly low SES) that include smaller classes, increasedsalary, better promotion prospects and the chance to choose the next school (which presumablyaccounts for the figure of 6.5% difference opportunity gap). If, as Akiba and colleagues claim, theattainment gap between high and low SES pupils is partly accounted for by teachers’ mathematicsqualification, then why does South Korea’s policy for equity in access to well-qualified teachers notreduce the country’s attainment gap?
Akiba and colleagues argue that the continued attainment gap between high and low SES groups is attributable to shadow education opportunities, citing three contributory factors:
• High-income South Korean families spent almost three times more per child on privateinstruction than low-income families.
• A positive correlation between parental level of education and access to private tuition.• Lack of access to shadow education in rural and remote areas.
Other research suggests that shadow education may not have such an impact on pupil attainment.This raises the question of how the Korean policy for teacher deployment actually works inpractice: is the deployment of teachers actually as equitable as the policy suggests?
REFERENCESAkiba, M., LeTendre, G. K., and Scribner, J. P. (2007). Teacher Quality, Opportunity Gap, and National Achievement in 46 Countries.
Educational Researcher, 36(7), 369-387.Kang, H., and Hong, M. (2008). Achieving excellence in teacher workforce and equity in learning opportunities in South Korea.
Educational Researcher, 37(4), 200-207.
30 Values and variables: Mathematics education in high-performing countries
THEME 8: Shadow education
Shadow education is an important adjunct to state education
Mathematics education outside school – shadow education – is widespread, and, particularly in EastAsian countries, parents of all socio-economic status are willing to make sacrifices to pay for extra-curricular mathematics instruction. This extra provision can contribute to maintaining high standards,particularly where the shadow education complements formal education in school. The time spent onshadow education can, however, have adverse effects on pupils’ wider social development.
Shadow education refers to a wide variety of out-of-school activities including one-to-one tutoring,exam preparation courses, and private but school-like classes (for example Japanese juku). Systemsof tutoring are noted to be widespread in Hong Kong, Singapore, Taiwan, Korea, Greece, andTurkey (Baker, Motoko, LeTendre, and Wiseman, 2001).
In a critical synthesis of studies relating to mathematics education outside school, Schümer (1999)argues for the need to look beyond schools and classrooms to understand Japanese achievement inmathematics. Japanese secondary school pupils invest more time in mathematics outside school andreceive more intensive guidance on their learning than pupils in either the United States or Germany(Hiebert, et al., 2003). Whilst Japanese secondary pupils get less directed homework from teachers inschool, they are more likely to have additional tuition, with two-thirds of eighth graders receivingsupplementary mathematics lessons in private tutoring or schooling. Moreover, supplementary tuitionin Japan complements the more conceptual teaching in school by providing more opportunities forpractice and repetition. There are claims that shadow education has reduced the work of Japaneseteachers through standardising many pupils’ achievement levels in classes (LeTendre, 1999).
Enrichment or remedial?As Baker and colleagues note, much of the rhetoric around shadow education is couched in terms of‘enrichment’. High stakes testing regimes, however, place a premium on end-of-school exam resultsand much shadow education is actually remedial in nature (that is, lower attainment pupils engage inshadow education in order to catch up). The analysis by Baker and colleagues of evidence from1994–95 TIMSS data supports this claim. Baker found only three countries that had a predominantlyenrichment focus to shadow education (Korea, Romania and Thailand), although Japan was unusual inhaving ‘rich mixes of remedial and enrichment’ shadow education (p. 14). The overall trend is for useof shadow education to be higher in countries where national expenditure on education is lower andwithout full pupil enrolment (at seventh and eighth grade). However, the analysis did not findevidence to support the hypothesis that nations which are highly motivated to perform well ininternational tests displayed greater use of shadow education (p. 11). Nor did their findings supportthe popularly held view that shadow education may account for success in international assessments.
Other studies, however, do suggest that shadow education may be significant in raising standards. A 2001 follow-up study of a 1989 survey of Japanese primary and middle school pupils examinedtest results and shadow education attendance (juku), SES, and other factors. The results showedthat the test scores were generally lower for the 2001 group. The children who did not go to jukuexperienced the largest decrease in scores (Tsuneyoshi, 2004).
www.nuffieldfoundation.org 31
Shadow education and socio-economic statusKariya and colleagues claim that it was the children of the less-educated parents, who did not havethe extra push at home, whose hours of shadow education had decreased the most.
This finding echoes a popular view of shadow education as a class issue: parents with high SES aremore likely to want (and be able) to pay for shadow education than parents with low SES. Theevidence from the East Asian countries is that SES is not a major factor, with high numbers ofparents across the SES spectrum making shadow education provision for their children. Forexample, high rates of additional tuition are reported for South Korea. Data from 2003 recordsaround 75% of South Korean Grade 7 to 9 pupils getting tutoring or being enrolled in ‘cram’ schools(Lee, 2005). These figures do not include programmes offered by the state schools themselves,which are reported as making shadow provision for over 22% of pupils in 2008 (Kang and Hong,2008). Other commentators report figures that 91% of primary, 81.5% of lower secondary and 70%of upper secondary Korean pupils are involved in out-of-school programmes, concluding that 70%to 90% of pupils study mathematics in out-of-school programmes almost every day (Lew, 2008). Asthis author notes, the most important thing in understanding the Korean education system is how‘Korean parents are willing to submit themselves to their children’s education.’
It is important not to assume that the prevalence of shadow education is simply a consequence ofparental demand. It is a huge private enterprise with resources to convince parents that it serves aneed. One commentator notes that the industry of shadow education in Japan may be inhibitingeducational reform through advertising and distribution of marketing materials that have‘sensationalized the ‘failure’ of public school education’ (Tsuneyoshi, 2004, p. 370).
Shadow education in EnglandThe importance of shadow education in other countries is relevant to England in the light of recentannouncements of the introduction of 1:1 tutoring for under-achieving pupils. The notion of shadoweducation and its acceptability as the norm for many countries suggests that these countries are happyto accept that state education cannot meet the needs of all pupils. Cultural values in England woulddeem the need to tutor a pupil who was falling behind as an indictment on the quality of a mainstreameducational setting. There is a belief in England that the state education package should provide all thatis needed during the school day; a belief that may not be shared by high-attaining countries.
REFERENCESBaker, D. P., Motoko, A., LeTendre, G. K., and Wiseman, A. W. (2001). Worldwide Shadow Education: Outside-School Learning, Institutional
Quality of Schooling, and Cross-National Mathematics Achievement. Educational Evaluation and Policy Analysis, 23(1), 1-17.Hiebert, J., Gallimore, R., Garnier, H., Givvin, K. B., Hollingsworth, H., Jacobs, J., et al. (2003). Teaching Mathematics in Seven Countries:
Results From the TIMSS 1999 Video Study. Washington DC: U.S. Department of Education, National Center for Education Statistics.Kang, H., and Hong, M. (2008). Achieving excellence in teacher workforce and equity in learning opportunities in South Korea.
Educational Researcher, 37(4), 200-207.Lee, C. J. (2005). Korean Education Fever and Private Tutoring. KEDI Journal of Educational Policy, 2(1), 99-107.LeTendre, G. K. (1999). The Problem of Japan: Qualitative Studies and International Educational Comparisons. Educational
Researcher, 28(2), 38-45.Lew, H.-c. (2008). Some characteristics in Korean National Curriculum and its revision process In Z. Usiskin and E. Willmore (Eds.),
Mathematics curriculum in Pacific Rim Countries – China, Japan, Korea and Singapore. (pp. 37-78). Mississippi: Information Age Publishing.Schümer, G. (1999). Mathematics education in Japan. Journal of Curriculum Studies, 31(4), 399-427.Tsuneyoshi, R. (2004). The New Japanese Educational Reforms and the Achievement ‘Crisis’ Debate. Educational Policy, 18(2), 364-394.
32 Values and variables: Mathematics education in high-performing countries
THEME 9: Problem solving
High attainment in international comparisons does notimply high attainment in problem solving
TIMSS results may be largely attributable to proficiency in computation and solving relativelypredictable and routine problems. When solving non-routine problems, differences between nationsappear to be less pronounced. Examination of pupils’ problem-solving strategies reveals that pupilsusing abstract and symbolic approaches to problem solving generally perform more successfully: use ofsuch approaches may be a result of pedagogical emphases rather than being a developmental issue.
Problem solving: learning outcomesIn a series of studies spanning some 15 years, Jinfa Cai has explored differences between Chinese andAmerican pupils’ problem solving strategies (as opposed to simply looking at differences in correctanswers). For example, a major study compared US and Chinese pupils on three types of items:
• computation• routine problems• non-routine problems
While the Chinese pupils scored more highly than the US pupils on the computation and routineproblems, the two populations were much more closely matched on the non-routine problems,with the US pupils marginally out-performing the Chinese pupils (Cai and Hwang, 2002).
In another study Cai explored performance of Chinese fifth and sixth graders on long divisioncalculations and division set in a problem context that required the answer to be rounded up(people travelling on buses). Over 80% of the Chinese pupils could correctly calculate 11.28 ÷ 3.6and over 90% correctly answer 3480 ÷ 60. However, only around 25% of these same pupils gavean acceptable answer to the division with remainder problem, which Cai points out is about thesame level of success that US pupils attained on a very similar task reported in NAEP (Cai, 1995;National Assessment of Educational Progress, 1985).
Problem solving strategiesOne major finding from this research is the evidence of more use of formal and abstract strategiesby Chinese pupils than by American counterparts. For example, when solving non-routine problems,sixth grade American pupils were more likely to use drawing or diagrammatic representations tofind solutions than Chinese peers who preferred numerical or symbolic representations. Interviewdata indicated that American teachers did not expect Grade 6 pupils to use algebraic methodswhereas Chinese teachers of Grade 6 did.
The Chinese pupils’ preference for the symbolic may be a result of differences in curriculum ordering:Chinese pupils tend to be introduced to formal recording, and algebra, earlier than American pupils.To examine this hypothesis Cai carried out a study in the United States and China where the yeargroups were matched on whether or not they had been taught formal algebra rather than matchedfor age. The results showed that US pupils who had been taught algebra (eighth grade) were morelikely to use symbolic representations than US pupils in Grades 6 or 7, but such use was still muchless than that demonstrated by the Chinese pupils who were more likely to use symbolicrepresentations at all grades, irrespective of whether or not they had been taught formal algebra.These differences positively correlated with levels of performance: in both China and the United
www.nuffieldfoundation.org 33
States pupils who used symbolic (arithmetical or algebraic) representations scored more highly thanthose using pictures or words. Analysis across both populations of pupil methods based on concretestrategies showed similar success rates; pupils using abstract representations were more successfuland more Chinese pupils worked in this way (Cai, 2002).
Concrete or abstract?It might be expected that the Chinese preference for abstract representations is due to lessexposure to concrete materials and pictorial representations. However, Stigler and Perry reportthat in classes observed in China and Japan, teachers did make extensive use of manipulatives andreal-world materials or scenarios, more so in fact than the American teachers in the same study(Stigler and Perry, 1988). Another study describes videos of two lessons, one Japanese, oneAmerican. Both lessons introduced the formula for finding the area of triangles to upper primaryschool pupils, but differed in the approach to establishing this. The Japanese lesson was structuredaround children manipulating images to find informal methods for calculating the areas of trianglesand with the teacher subsequently drawing these together into the accepted formula at the end ofthe lesson. The American teacher introduced the formula early in the lesson: the pupils thenapplied this to several problems (Zhou, Peverly, Boehm, and Chongde, 2000).
There are, however, differences reported in the way that concrete materials are used across nations.Observers report that Japanese lessons often focus on one or two problems, with a variety of waysof modelling and solving them being explored in a single lesson, with concrete representations beingexplored alongside and in parallel to more abstract representations. This parallel use of concreterepresentations is different from an approach that starts with the concrete, with the expectation of this providing a foundation for the abstract, and follows on with the concrete gradually beingwithdrawn. The Effective Teachers of Numeracy study at Kings’ noted that the most effectiveteachers in that study worked with a connected range of representations in parallel (Askew, Brown, Rhodes, Wiliam, and Johnson, 1997).
Research is needed into whether encouraging more abstract representations will raise attainmentor whether it is the case that higher attaining pupils are more likely to use abstract representations.
REFERENCESAskew, M., Brown, M., Rhodes, V., Wiliam, D., and Johnson, D. (1997). Effective Teachers of Numeracy: Report of a study carried out for
the Teacher Training Agency. London: King’s College, University of London.Cai, J. (1995). A Cognitive Analysis of U.S. and Chinese Students’ Mathematical Performance on Tasks Involving Computation,
Simple Problem Solving, and Complex Problem Solving. Journal for Research in Mathematics Education. Monograph, 7, i-151.Cai, J. (2002). Assessing and understanding U.S. and Chinese students’ mathematical thinking. Zentralblatt für Didaktik der
Mathematik, 34(6), 278-290.Cai, J., and Hwang, Y. (2002). U.S. and Chinese students’ generalized and generative thinking in mathematical problem solving and
problem posing. Journal of Mathematical Behavior, 21, 401-421.National Assessment of Educational Progress (1985). The third national mathematics assessment: Results, trends and issues.
Denver, CO: NAEP.Stigler, J. W., and Perry, M. (1988). Cross-cultural studies of mathematics teaching and learning: recent findings and new directions. In
D. A. Grouws, T. J. Cooney and D. Jones (Eds.), Perspectives on research on effective mathematics teaching (Vol. 1, pp. 194-223).Reston, VA: National Council of Teachers of Mathematics/Lawrence Erlbaum Associates.
Zhou, Z., Peverly, S. T., Boehm, A. E., and Chongde, L. (2000). American and Chinese children’s understanding of distance, time, andspeed interrelations. Cognitive Development, 15(2), 215-240.
34 Values and variables: Mathematics education in high-performing countries
THEME 10: Textbooks
English textbooks are more routine and involve lessvariation than those of many other countries
In England, procedural fluency and conceptual understanding are largely seen as mutually exclusiveaims. This polarising of procedural and conceptual is not helpful. Pacific Rim teaching is largelydominated by procedures and hence supportive of procedural fluency, but the procedures used tend to be explicitly grounded in mathematical principles and consequently more mathematically coherent andmeaningful than those most commonly used in the United Kingdom. In the Pacific Rim, mathematicallyinformed procedural teaching is introduced and promoted through carefully constructed textbooks.
Textbooks are the major resource for teaching mathematics. In TIMSS 2007, 65% of Grade 4 teachersand 60% of Grade 8 teachers internationally use textbooks as the main basis for mathematics lessons.However, research on textbooks and textbook use is limited and, aside from TIMSS, there is no large-scale study of textbook use in England or internationally.
Textbook use in EnglandTextbook use in England is lower than that in the highest attaining countries. At Grade 4, textbook usein all the Pacific Rim countries is higher than the international average and the proportions of teachersusing textbooks as the primary basis for lessons is as follows: Chinese Taipei (94%), Hong Kong (84%),Japan (83%) and Singapore (75%). In contrast, textbook use in English primary classrooms has fallen to only 15% with Mullis et al. (2008) commenting that England ‘appear[s] to be working towards onlysupplemental use or no use at all for almost all students’ (p. 289). Evidence from the LeverhulmeNumeracy Research Programme supports this finding and suggests that, in primary classrooms, there is widespread use of worksheets with at times dubious quality control.
At Grade 8, the comparison is less stark, although textbook use in England is still comparativelylow. Teachers in all the Pacific Rim countries use textbooks more than England and for all exceptSingapore the use of textbooks as the primary basis for lessons is greater than the internationalaverage. In contrast, textbook use in Scotland is relatively high. Anecdotal evidence suggests that,whilst secondary teachers often use alternative resources at the beginning of lessons, textbooksprovide the principal source of the problems set for pupils in class.
Given the paucity of comparative research in this area, the reasons for these differences intextbook use are not clear, although the lower English figure may reflect a greater use of internetresources, initiatives by the National Strategies promoting the use of alternative resourcesalongside published textbooks, and a view amongst the educational establishment that schoolsover-rely on textbooks rather than undertaking their own detailed planning.
Content of textbooksOver the past 20 years, the educational system in England has been subject to frequent reform and review. One consequence of this has been to limit the time available for the development andtrialling of textbooks, with publishers competing to produce textbooks quickly. This has led to areduction in the quality of textbooks and, in their study comparing textbooks in three Europeansystems, Haggarty and Pepin (2001) find English textbooks to be less coherent and more routinethan French and German textbooks:
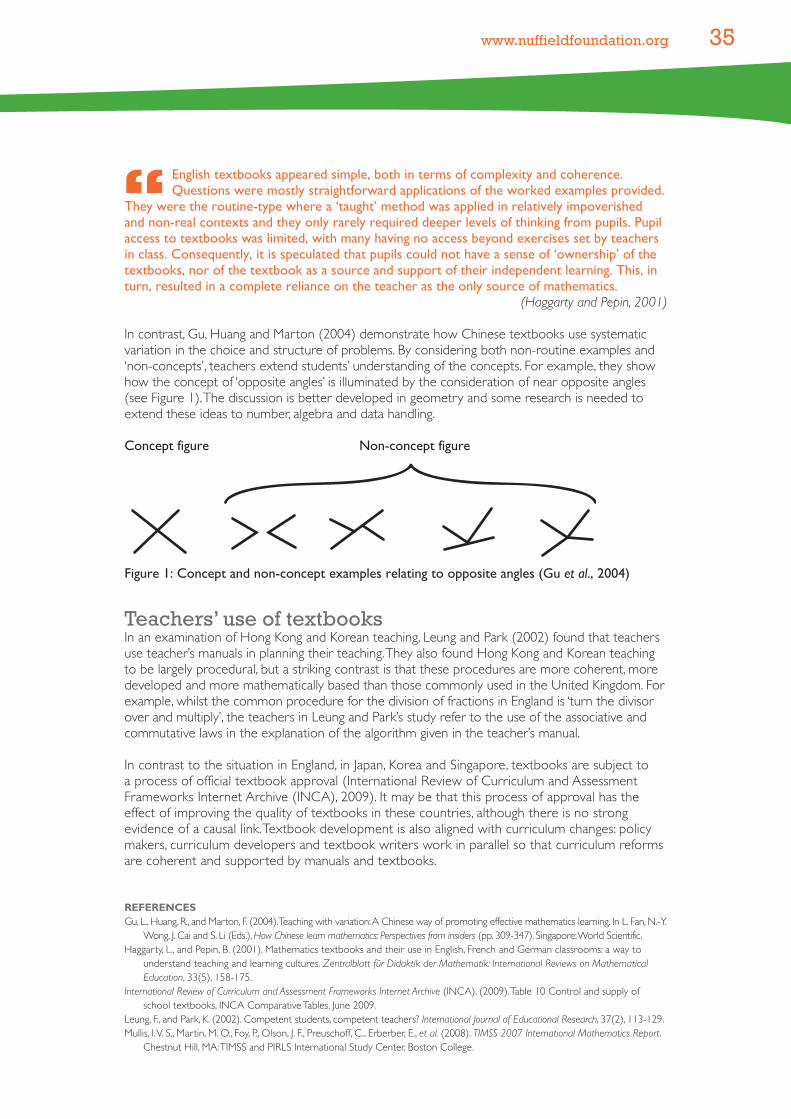
www.nuffieldfoundation.org 35
English textbooks appeared simple, both in terms of complexity and coherence.Questions were mostly straightforward applications of the worked examples provided.
They were the routine-type where a ‘taught’ method was applied in relatively impoverished and non-real contexts and they only rarely required deeper levels of thinking from pupils. Pupilaccess to textbooks was limited, with many having no access beyond exercises set by teachersin class. Consequently, it is speculated that pupils could not have a sense of ‘ownership’ of thetextbooks, nor of the textbook as a source and support of their independent learning. This, inturn, resulted in a complete reliance on the teacher as the only source of mathematics.
(Haggarty and Pepin, 2001)
In contrast, Gu, Huang and Marton (2004) demonstrate how Chinese textbooks use systematicvariation in the choice and structure of problems. By considering both non-routine examples and‘non-concepts’, teachers extend students’ understanding of the concepts. For example, they showhow the concept of ‘opposite angles’ is illuminated by the consideration of near opposite angles(see Figure 1). The discussion is better developed in geometry and some research is needed toextend these ideas to number, algebra and data handling.
Figure 1: Concept and non-concept examples relating to opposite angles (Gu et al., 2004)
Teachers’ use of textbooksIn an examination of Hong Kong and Korean teaching, Leung and Park (2002) found that teachersuse teacher’s manuals in planning their teaching. They also found Hong Kong and Korean teachingto be largely procedural, but a striking contrast is that these procedures are more coherent, moredeveloped and more mathematically based than those commonly used in the United Kingdom. Forexample, w hilst the common procedure for the division of fractions in England is ‘turn the divisorover and multiply’, the teachers in Leung and Park’s study refer to the use of the associative andcommutative laws in the explanation of the algorithm given in the teacher’s manual.
In contrast to the situation in England, in Japan, Korea and Singapore, textbooks are subject to a process of official textbook approval (International Review of Curriculum and AssessmentFrameworks Internet Archive (INCA), 2009). It may be that this process of approval has theeffect of improving the quality of textbooks in these countries, although there is no strongevidence of a causal link. Textbook development is also aligned with curriculum changes: policymakers, curriculum developers and textbook writers work in parallel so that curriculum reformsare coherent and supported by manuals and textbooks.
REFERENCESGu, L., Huang, R., and Marton, F. (2004). Teaching with variation: A Chinese way of promoting effective mathematics learning. In L. Fan, N.-Y.
Wong, J. Cai and S. Li (Eds.), How Chinese learn mathematics: Perspectives from insiders (pp. 309-347). Singapore: World Scientific.Haggarty, L., and Pepin, B. (2001). Mathematics textbooks and their use in English, French and German classrooms: a way to
understand teaching and learning cultures. Zentralblatt für Didaktik der Mathematik: International Reviews on MathematicalEducation, 33(5), 158-175.
International Review of Curriculum and Assessment Frameworks Internet Archive (INCA). (2009). Table 10 Control and supply ofschool textbooks, INCA Comparative Tables, June 2009.
Leung, F., and Park, K. (2002). Competent students, competent teachers? International Journal of Educational Research, 37(2), 113-129.Mullis, I. V. S., Martin, M. O., Foy, P., Olson, J. F., Preuschoff, C., Erberber, E., et al. (2008). TIMSS 2007 International Mathematics Report.
Chestnut Hill, MA: TIMSS and PIRLS International Study Center, Boston College.
Concept figure Non-concept figure
36 Values and variables: Mathematics education in high-performing countries
THEME 11: Teacher subject knowledge
Teaching emphases within lessons may depend oncultural factors as much as teacher subject knowledge
Teachers' mathematical subject knowledge is widely regarded as an important basis for effectiveteaching of mathematics. However the relationship between teacher subject knowledge andpedagogy is not simple, and pedagogy depends upon tacit values and expectations as well asknowledge. What a teacher emphasises within a lesson may depend on cultural factors such as beliefs about learners as much as on the teacher's subject knowledge.
Liping Ma investigated US teachers’ conceptual understanding in many areas of elementarymathematics and found it to be noticeably weaker than that of Chinese teachers. Ma’s research has been widely cited internationally as demonstrating the need for teachers to have a “profoundunderstanding of fundamental mathematics”. Ma’s study involved a small group of teachers, andresearchers are interested in whether or not her findings apply more generally. One such studyexploring this examined 160 American and Chinese teachers’ knowledge of teaching fractions. To assess subject matter knowledge the teachers had to complete a number of problems aboutfractions. The Chinese teachers significantly outperformed the Americans, on all three strands ofconcepts, calculations and word problems. In interview, the American and Chinese teachers displayedsimilar levels of pedagogic content knowledge about the difficulties that children might have, but theChinese teachers were reported as more knowledgeable about which were the most importantfraction concepts to teach, the relevant knowledge that pupils might already have and teachingapproaches that might lead to understanding (Zhou, Peverly, and Xin, 2006, p. 441). The authors arguethat the Chinese teachers demonstrated greater ‘longitudinal coherence’ (Ma, 1999) in knowing whendifferent aspects of knowledge of fractions were introduced into the curriculum and how theserelated to what had been previously taught and what was still to come in later years.
Subject knowledge and teacher practicesLeung questions the relationship between Ma’s construct of ‘Profound Understanding of FundamentalMathematics’ (PUFM) and actual teaching practices through findings from a small-scale replication studyusing some of Ma’s items. His Chinese teachers, when probed, demonstrated elements of PUFM butexpressed beliefs in the importance of teaching procedures to pupils. These beliefs were grounded intheir pragmatic knowledge of what pupils could be expected to understand: they saw understanding as following on from procedural competence and stressed the importance of memorisation. Leungsuggests that the role of memory in East Asian approaches to teaching should not be equated with theWestern idea of ‘rote’ understanding (memorisation without understanding) (Leung, 2001; Leung andPark, 2002). Emphasising the idea of repetition rather than rote, researchers argue that the emphasis ison the ‘intention to both memorise and to understand’ (Dahlin and Watkins, 2000).
Procedural or conceptual?On a larger scale, researchers took responses to 20 items from the (third) TIMSS eighth grade (13-year-olds) teacher questionnaire they considered elicited views on: the nature of mathematics;mathematical pedagogy; and learning mathematics. The items were grouped into two categoriesaccording to whether or not they indicated a perception of mathematics as procedural andalgorithmic, or as conceptual and forming a connected whole (Philippou and Christou, 1999). Theanalysis of teacher responses on these items broadly indicated that teachers from the four EasternAsian countries surveyed (Japan, South Korea, Hong Kong and Singapore) had responded in ways
www.nuffieldfoundation.org 37
consistent with an algorithmic (procedural) view of mathematics and its teaching. Teachers fromthe four European countries (French Belgium, Sweden, Germany, and England) gave responsesclassified as towards the conceptual end of the classification.
Further differences in teaching emphases beyond conceptual or procedural are revealed in aqualitative study in which four teachers from Japan and four from the United States viewed a videoof a lesson either from their home country or from the ‘foreign’ country. The teachers were invitedto stop the tape at any point to comment, and transcripts of their comments were subsequentlycoded and classified.
The Japanese teachers in our study stressed that the following components arenecessary for a well-taught math lesson: students’ understanding of the material,
not too much talking by the teacher, a slow enough pace to give students at all levels time to understand, and proper use of materials and the blackboard-depicting a variety of solutionstrategies and neatness. … The American teachers in the study had a different take on whatqualifies as an effective math lesson. They wanted to see: behavioral indications of studentengagement, clear language and explanations by the teacher, not too little talk by the teacher,a fast enough pace to ensure that the bright students won’t become bored, and the use ofmaterials and the blackboard-especially by the teacher and knowledgeable students.
(Zhou, et al., 2006)
The Japanese teachers’ comments were coded as being much more critical of both lessons thanthose of the American teachers. For example, the US teachers commented on whether pupils wereon task while the Japanese teachers focused on whether pupils appeared to understand and, if not,commented that the teacher should accept this as the result of inadequate instructional approaches.Both groups commented on the quality of teacher talk but the US teachers focused more on whenthey thought teachers gave good explanations, while the Japanese teachers picked out utterances ofwhich they were critical. Only around half the US teachers’ comments about pace were about itbeing too quick, whereas almost all of the comments on pace from the Japanese teachers indicatedthat they thought it was too quick, with concern noted for not all the learners being engaged,particularly the ‘slow’ learners. The American teachers expressed more concerns for the ‘quicker’pupils getting bored.
REFERENCESDahlin, B., and Watkins, D. (2000). The role of repetition in the processes of memorising and understanding: A comparison of the
views of German and Chinese secondary school students in Hong Kong. British Journal of Educational Psychology, 2000(70).Leung, F. (2001). In Search of an East Asian Identity in Mathematics Education. Educational Studies in Mathematics, 47(1), 35-51.Leung, F., and Park, K. (2002). Competent students, competent teachers? International Journal of Educational Research, 37(2), 113-129.Ma, L. (1999). Knowing and Teaching Elementary Mathematics: Teachers’ Understanding of Fundamental Mathematics in China and the
United States. Mahwah, New Jersey: Lawrence Erlbaum Associates.Philippou, G. N., and Christou, C. (1999). Teachers’ conceptions of mathematics and students’ achievement: a cross-cultural study
based on results from TIMSS. Studies in Educational Evaluation, 25, 379-398.Zhou, Z., Peverly, S. T., and Xin, T. (2006). Knowing and teaching fractions: A cross-cultural study of American and Chinese
mathematics teachers. Contemporary Educational Psychology, 31(4), 438-457.
38 Values and variables: Mathematics education in high-performing countries
THEME 12: Pedagogy
Within-country differences in pedagogy need tobe examined
Within-country differences in pedagogy are more than simple distinctions between national teaching‘scripts’ or lesson content. Looking at tasks set does not reveal how teachers develop these in practice.What may look like a procedural task can give rise to cognitive activity that addresses pupils’understanding and, equally, a potentially ‘open’ task can be made procedural by the teachers’directions and interventions.
Lesson scriptsThe first TIMSS video study (1995) concluded there were differences in the ‘lesson scripts’ ofdifferent countries (United States, Germany and Japan), that were greater than within countrydifferences. This conclusion led to the view that teaching was a ‘cultural activity’ (Stigler andHiebert, 1999) and although teachers within a country would clearly vary in their behaviours, there were broad patterns of pedagogic styles and approaches within a country. Major differencesbetween countries appeared to be in the use of problems in lessons and whether or not theemphasis was on conceptual understanding or procedural fluency.
The later TIMSS 1999 Video Study involved seven countries: Australia, Czech Republic, Hong Kong,Japan, the Netherlands, Switzerland and the United States. This study looked further into theproblems pupils worked on in the video lessons and classified tasks and problems as one of threetypes: using procedures (typically arithmetical calculations) or routine problems; stating concepts(use of conventions or concepts, for example plotting points or constructing an isosceles righttriangle) and making connections (constructing relationships and having to reason and generalise)(adapted from Hiebert et al., 2003). On the basis of this classification, Hiebert and colleagues founda predominance in five of the countries for ‘using procedures problems’, the exceptions being Japanand then the Netherlands.
Secondary analyses of the video data from these studies shows that differences both between andwithin countries are more nuanced than these classifications suggest.
Within country variationA re-analysis of lessons from the 1995 video study looked more closely at the cognitive activity thatmight have arisen from the different tasks set in the lessons and concluded that we need to lookbeyond the surface differences of the form and structure of the lessons. In particular, that cross-national differences are ‘deeply rooted in different mathematical demands on the posed problems’(Neubrand, 2006, p. 303). But the analysis raises the question of whether or not ‘mathematicaldemands’ are similar across different content. More of the Japanese lessons were focused ongeometry than algebra than was the case in Germany or the United States. Japanese geometrylessons were more focused on conceptual problems, but in algebra they were more procedural.
Neubrand’s analysis of the TIMMS 1999 video study data supported differences of emphasesbetween countries but further argues that these are largely a result of the content of problems:geometry or statistical problems were much more likely to be conceptual ‘making connections’problems, while algebraic problems tended to be procedural. The majority of Japanese problems in this study were geometrical (84%), as was also the case, to a lesser extent, in the Netherlands.
www.nuffieldfoundation.org 39
Looking beyond the types of problems posed to examine how pupils were actually expected tosolve them shows that looking at a problem and judging the type of mathematical demand it mightprovoke cannot be done in isolation from how the problem played out in practice. Neubrand’sanalysis indicates that problems coded as ‘making connections’ problems tended to retain this focusin the course of the teaching. However, in course of the lessons based around problems initiallyclassified as ‘using procedures’, between 20 and 55% of these problems developed, throughteaching emphases, into ‘making connections’ or ‘stating concepts’ problems. The author suggeststhat using ‘making connections’ could be a central distinctive issue of teaching in high achievingcountries’ (p. 315), and that simply looking at the nature of problems posed cannot reveal this.How the teacher develops the problem is the key to the type of mathematical demand pupilsultimately become engaged in.
Another study re-analysing TIMMS 1999 video data compared the contexts and approaches toproblem solving in Dutch and Japanese classrooms. Although the Dutch lessons were originally codedas displaying more real-life connections, in examining the way teachers developed the problemswithin the lesson, the author concludes the Japanese lessons were actually closer to the spirit of‘Realistic Mathematics Education’ in that the pupils were involved in ‘mathematising’ situations. In theDutch lessons, despite the contexts of the problems, problem solving was much more routine andprocedural (Mosvold, 2008).
More mathematical teacher talk?Drawing on the work of the Mathematics Quality Analysis Group within the TIMSS Video Study,Leung (2005) finds that, although Hong Kong classrooms were dominated by teacher talk, thequality of learning and instruction was nevertheless high. Video data were studied from all countriesparticipating in the TIMSS Video Study except Japan. In Hong Kong, students were found to haveexperienced more opportunities to learn new content (around 75% of lesson time) and moreadvanced content than all others (except the Czech Republic). In Hong Kong, 90% of lessons werefound to be thematically coherent compared to between 30% and 65% for the other countries. Inaddition 75% of the lessons from Hong Kong were found to be either fully or substantiallydeveloped, a figure more than three times higher than in the Netherlands.
REFERENCESHiebert, J., Gallimore, R., Garnier, H., Givvin, K. B., Hollingsworth, H., Jacobs, J., et al. (2003). Teaching Mathematics in Seven Countries:
Results From the TIMSS 1999 Video Study. Washington DC: U.S. Department of Education, National Center for Education Statistics. Leung, F. K. S. (2005). Some characteristics of East Asian mathematics classrooms based on data from the TIMSS 1999 Video Study.
Educational Studies in Mathematics, 60, 199–215.Ma, L. (1999). Knowing and teaching elementary mathematics: Teachers’ understanding of fundamental mathematics in China and the
United States. Mahwah, New Jersey: Lawrence Erlbaum Associates.Mosvold, R. (2008). Real-life Connections in Japan and the Netherlands: National teaching patterns and cultural beliefs. International
Journal for Mathematics Teaching and Learning. Plymouth University, UK: Centre for Innovation in Mathematics Teaching. Neubrand, J. (2006). The TIMSS 1995 and 1999 video studies. In F. K. S. Leung, K. D. Graf and F. J. Lopez-Real (Eds.), Mathematics
Education in Different Cultural Traditions-A Comparative Study of East Asia and the West (pp. 290-318). New York: Springer.Stigler, J. W., and Hiebert, J. (1999). The teaching gap : best ideas from the world’s teachers for improving education in the classroom.
New York: Free Press.
40 Values and variables: Mathematics education in high-performing countries
THEME 13: Confidence and attainment
There is a surprising association of low confidence inmathematics with high attainment
Pupils’ self-perceptions of whether or not they are good at mathematics, and whether or not they likemathematics, may impact on their attainment. To raise attainment, however, it may be that changing the curriculum and teaching would be more effective than trying to change pupils’ attitudes directly.
Given the widely held goal of wanting pupils to find mathematics enjoyable, on the assumption that thiswill raise standards, there is a paradox in the research findings that suggest these are inversely related.
Within and between country comparisonsA study looking for relationships between pupils’ self-perception and their achievement inmathematics examined pupil responses to three questions from each of TIMSS 1995, 1999 and 2003: I enjoy learning maths; I usually do well in maths; maths is an easy subject. Correlationanalyses were performed using data at the individual pupil level for within-country analysis and aggregated data for between-countries analysis. The within-country findings support theconventional wisdom that pupils tend to achieve more highly if their self-perception is good: pupils’ achievement was higher for those who rated themselves highly on all three measures of enjoyment, doing well and finding maths easy (Shen and Tam, 2008).
Between-countries findings, however, revealed negative correlations between achievement and allthree measures of self-perception that were consistent across all three waves of TIMSS. The authorsnote that pupils from the high-achieving East Asian countries tend to downgrade themselves.However, removing East Asian countries from the analysis did not change these negative correlations.
In line with Shen and Tam, Leung (2002) reports that pupils in the top-scoring East Asiancountries (Hong Kong, Singapore, Japan and South Korea) believe they do not achieve well inmathematics. In addition, excepting Singapore, they do not enjoy mathematics relative to othercountries. Leung suggests that low perceptions of confidence in mathematics ability may benecessary for high attainment.
Over-confidence may lower students’ incentive to learn further and cause them to putvery little effort into their studying, and hence result in low achievement. This is exactly
the kind of justification for the stress on humility or modesty in the East Asian culture. TheChinese saying ‘contentedness leads to loss, humility leads to gain’ illustrates the point well.
(Leung, 2002)
Findings comparing mathematics with other subjects present a slightly different picture. A surveyof eighth grade students in Wuhan found that Chinese pupils rated mathematics their jointfavourite subject alongside English (Tsui, 2005). Hong Kong pupils compare mathematicsfavourably to Chinese and Chinese History: they report finding mathematics mentally engagingwhereas they associated the latter subjects with memorising facts (Jablonka, 2005). Pupils’perceptions of mathematics do not ‘stand alone’ but are related to their experience of othersubjects: perceptions are not absolute but ‘benchmarked’.

www.nuffieldfoundation.org 41
Living down to low expectations?Shen and Tam’s hypothesis for their paradoxical findings is that low standards and expectationsbeget low performance. In countries with low expectations, pupils perceive mathematics to beeasy, contributing to an inflated self-perception of their attainment in mathematics, resulting incomplacency and a lack of motivation to improve their performance.
A study comparing attitudes, expectations and achievement in mathematics of 9 to 10 year-oldchildren in economically deprived areas of Russia, England and the United States supports theargument that low expectations go hand in hand with low achievement. Russian children scoredmore highly overall and had a far smaller tail of low achievers than either England or the UnitedStates. The Western children tended to overestimate teachers’ perceptions of them; children inRussia underestimated them. Western pupils were found to have higher self-perceptions and weremore satisfied with their performance and work-rate, perceiving less room for improvement thanthe Russian pupils (Elliott, Hufton, Illushin, and Lauchlan, 2001). The explanation put forward for thisfinding is that Western teachers believe that positive messages motivate pupils; hence there is a gulfbetween their overt messages to children and teachers’ beliefs about pupils’ actual attainment. Elliottand colleagues report similar findings for adolescent children in a parallel study. Shen and Tam warn,however, against the assumption that raising standards and expectations will automatically raiseperformance. Instead they suggest a gradual rise in standards may be necessary, because new valuesneed time to become embedded.
The pupils’ fault?Hess and Azuma (1991) argue that almost universally, the teaching of mathematics is based aroundout-of-date curricula and traditional teaching approaches that are ‘not conducive to learning’, butthat rather than change the curriculum or essence of teaching, teachers work either on pupildispositions (making them adaptive to the classroom culture) or to make lessons more appealing(making them ‘fun’ rather than adopting new pedagogies).
Cultures differ in the emphasis they place on these two strategies. Japanese tend to stressdeveloping adaptive dispositions; Americans try to make the learning context more
attractive. National difference in educational achievement may be more completely understood byanalysis of cultural differences in student dispositions. The interaction of student characteristics andteacher strategies creates very different climates in the two countries. (Hess and Azuma, 1991)
There is danger in reading into such studies an underlying assumption that the key to raisingstandards may lie in changing pupils’ perceptions. Promoting adaptive dispositions – accept theneed to work harder – may indeed have an impact, but a more constructive approach may rest in overhauling the curriculum and teaching approaches.
REFERENCESElliott, J. G., Hufton, N., Illushin, L., and Lauchlan, F. (2001). Motivation in the Junior Years: International Perspectives on Children’s
Attitudes, Expectations and Behaviour and Their Relationship to Educational Achievement. Oxford Review of Education, 27(1), 37-68.Hess, R. D., and Azuma, H. (1991). Cultural Support for Schooling: Contrasts between Japan and the United States. Educational
researcher, 20(9), 2-12.Hwang, Y. (2001). Why do South Korean students study hard? Reflections on Paik’s study. International Journal of Educational
Research, 35(6), 609-618.Jablonka, E. (2005). Motivations and meanings of students’ actions in six classrooms from Germany, Hong Kong and the United
States. Zentralblatt für Didaktik der Mathematik, 37(5), 371-378.Leung, F. K. S. (2002). Behind the High Achievement of East Asian Students. Educational Research and Evaluation, 8(1), 87-108.Shen, C., and Tam, H. P. (2008). The paradoxical relationship between student achievement and self-perception: a cross-national
analysis based on three waves of TIMSS data. Educational Research and Evaluation, 14(1), 87-100.Tsui, M. (2005). Family Income, Home Environment, Parenting, and Mathematics Achievement of Children in China and the United
States. Education and Urban Society, 37(3), 336-355.
42 Values and variables: Mathematics education in high-performing countries
THEME 14: Wider goals
Mathematics education or education through thecontext of mathematics?
Other countries address learning goals as well as mathematical goals in mathematics classes. Forexample, Japanese mathematics teachers have the goal of developing personal qualities, such asworking cooperatively or persevering, alongside the mathematical outcomes. Attending to developingpersonal qualities may be as important as attending to content goals.
The Japanese approach to professional development through ‘lesson study’ has become a popularrecommendation for professional development activity in England. While the concept is bound tobe adapted to the different context, one thing that appears to have been ‘lost in translation’ fromJapan to England is the nature of the goals set for the lessons being studied. For example, theNCETM website suggests teacher groups select a topic – something particularly difficult, new,important, or coming later – and agree a ‘joint statement of the learning goals for that topic’.
This places the emphasis firmly on mathematical content: no mention is made of having any goalsbased around developing personal or collective qualities. Yet the Japanese place equal emphasis onselecting a second goal, such as working cooperatively or persevering, and the design of the lessonis built just as much around this goal as the content one (Isoda, 2007).
The distinction here can be characterised as a focus on mathematics education or on educationthrough the context of mathematics. The mathematics education literature contains much adviceon the advantages of group work and collaborative activity, but this is primarily presented as ameans to an end: such pedagogic approaches are enlisted in the service of improving mathematicalunderstanding. The primary goal is learning mathematics, mathematics education.
Whilst not denying the importance of learning mathematics, the Japanese attention to thedevelopment of personal goals alongside the mathematical content suggests more of a culture of‘education through the context of mathematics’. Mathematics lessons go beyond simply teachingmathematics. They acknowledge that education is also concerned with identity formation.
Goals for teaching mathematicsThis distinction requires a re-imagining of the goals of teaching mathematics. All too often it seemsthat mathematics is bracketed off from the rest of the curriculum, afforded a distinct status thatallows particular practices that would not be countenanced in other subjects. For example, it iscommon practice in UK primary schools to play ‘maths champion’ games – head to headchallenges – that establish who is ‘best’ in class at mathematics, while the same teachers would not publicly establish the ‘pecking order’ in literacy.
The development of qualities such as perseverance may not simply be in addition to mathematicalunderstanding but contributing to it. Despite the wealth of literature citing the East Asian emphasison effort over innate ability, none of the large-scale international studies measure this directly(indeed they probably could not). One group of researchers created a proxy measure of effort, theStudent Task Persistence (STP) variable. This is based on the students’ completion of the (Third)TIMSS student background questionnaire and the percentage of questions answered out of the totalof items asked. This provides a proxy for motivation to stay on task, as well as ability to complete thetask (read the questions, mark the answers etc.) and willingness to have a go at questions that pupilsmight not be sure of the answer to. The hypothesis was that all three of these factors would have abearing on performance on the mathematics test. The researchers found statistically significant
www.nuffieldfoundation.org 43
correlations between mean STP scores and mean mathematics scores at all five grade levels withparticularly strong correlations in grades 7 and 8 (Boe, May, and Boruch, 2002).
Because students completed the questionnaire after taking the mathematics test it is possible thatstudent’s awareness that they had not done well on the test could have discouraged them fromcompleting the questionnaire: poor performance on the test may have accounted for a low STPscore. In looking at a sub-sample of students in the 15th, 50th and 80th percentile the researchersfound evidence that higher scoring pupils did indeed answer more of the questionnaire (82% for80th percentile, 65% for 15th). However, high levels of correlation between the variability of scoresin each of these attainment bands and the variability of the mean scores for the nation led theresearchers to conclude there was no support for the hypothesis that national-level STP scoresmight be partly explained by individual test scores.
Overall this research supports the hypothesis that student effort is a key determinant ofmathematical attainment.
REFERENCESBoe, E. E., May, H., and Boruch, R. F. (2002). Student task persistence in the third international mathematics and science study: a major
source of achievement differences at the national, classroom and student levels. Philadelphia PA: Center for Research andEvaluation in Social Policy, Graduate School of Education, University of Pennsylvania.
Isoda, M. (2007). Japanese lesson study in mathematics: its impact, diversity and potential for educational improvement. Hackensack, N. J.; London: World Scientific.
44 Values and variables: Mathematics education in high-performing countries
ConclusionsThese conclusions are a summary of our key findings and recommendations. They are based on our reading and analysis of the research evidence and our professional judgements of theimplications of these findings. We have chosen to concentrate on findings and recommendationsthat largely apply across all phases of schooling.
Behind the headline findingsEngland’s success in TIMSS 2007 is significant, but rankings alone mask important differences in aspectsof performance. For example, at Grade 4 (Year 5), performance in number, although above theinternational average, was relatively weak in comparison to England’s overall performance on otherareas of mathematics. At Grade 8 (Year 9) pupils’ results in algebra were below the internationalaverage and weak in comparison to competitor countries. But these apparent areas of weakness areonly important if what is tested in TIMSS is agreed to be of national priority and fits with ourcurriculum emphases (see Theme 2: What rankings tell us, page 18).
Findings from repeated TIMSS and PISA studies add to our knowledge of changes over time, butthese international studies are limited by their lack of longitudinal data that examines learningthrough tracking the same pupils over several years of schooling (see Theme 2:What rankings tell us, page 18).
Not all high attaining countries have closed the attainment gap between pupils from differing socio-economic backgrounds (see Theme 7: Attainment gaps, page 28).
Findings from TIMSS suggest the match between curriculum content and the TIMSS test itemsmatters more than teaching in explaining international differences, although the quality of teachingstill has a significant effect on mathematical learning (see Theme 1: Impact of teaching, page 16).
Cultural influencesInternationally, explicit goals for mathematics education are similar in valuing high standards inknowledge and skills, learning dispositions and positive attitudes towards mathematics. No country,including those with high attainment in international studies, appears to have succeeded inachieving all three of these goals. Groups with a cultural identity of being good at mathematics do not necessarily also identify themselves as enjoying mathematics (see Theme 3: Attainment andenjoyment, page 20).
High attaining countries address wider learning goals within the context of mathematics education.For example, Japanese teachers have the goal of developing personal qualities in mathematicslessons, such as working cooperatively or persevering, alongside the mathematical outcomes.Attending to developing personal qualities may be as important as attending to content goals in securing high attainment (see Theme 14: Wider goals, page 42).
Implicit goals arising from nations’ different socio-cultural-historical backgrounds have a powerfulinfluence on pupil attainment. These implicit goals make ‘borrowing’ policies and practices problematicbecause adopting practices from elsewhere might mean adopting implicit goals that do not fit withEngland’s vision for society or individuals. For example, the Asian emphasis on effort, while a factor in high attainment, is also closely aligned with obedience and authority (see Theme 3: Attainment andenjoyment, page 20).

www.nuffieldfoundation.org 45
Contextual influencesParents who have accurate and realistic expectations of their children’s mathematical attainment havemore impact on their children’s learning than parents who over-estimate their children’s attainment.Realistic parental expectations have more impact on pupil attainment than direct parental involvement,such as helping with homework (see Theme 4: Parental expectations, page 22).
Mathematics education outside school – shadow education – is widespread, and parents from allsocio-economic backgrounds are willing to make sacrifices to pay for extra-curricular mathematicsinstruction, particularly in East Asian countries. This extra provision can contribute to maintaininghigh standards, particularly where the shadow education complements formal education in school.The time spent on shadow education can, however, have adverse effects on students’ wider socialdevelopment (see Theme 8: Shadow education, page 30).
Pupils’ self-perceptions of whether or not they are good at mathematics, and whether or not theylike mathematics, impact on their attainment. To raise attainment, however, it may be that changingthe curriculum and teaching would be more effective than trying to change pupils’ attitudes directly(see Theme 13: Confidence and attainment, page 40).
Teachers’ mathematics qualifications do not appear to be strongly linked to average levels of pupilattainment. However, in high attaining countries where there is a wide attainment gap, pupils fromlower socio-economic status backgrounds tend to be lower attainers and are less likely to betaught by well qualified, experienced teachers. Hence differences in teachers’ qualifications areassociated with the attainment gap between pupils from high and low socio-economic statusbackgrounds (see Theme 7: Attainment gaps, page 28).
Pedagogical influencesHigh attainment in international comparisons does not imply high attainment in problem solving.TIMSS results may be largely attributable to proficiency in computation and solving relativelypredictable and routine problems. When solving non-routine problems, differences betweennations appear to be less pronounced. Examination of pupils’ problem-solving strategies revealsthat pupils using abstract and symbolic approaches to problem solving generally perform moresuccessfully: use of such approaches may be a result of pedagogical emphases rather than being a developmental issue (see Theme 9: Problem solving, page 32).
In England, procedural fluency and conceptual understanding in mathematics are largely seen asmutually exclusive aims. This is not helpful. Teaching in Pacific Rim countries is largely dominated by procedures and hence supportive of procedural fluency, but the procedures used tend to beexplicitly grounded in mathematical principles, and hence more mathematically coherent andmeaningful than those most commonly used in the United Kingdom (see Theme 10: Textbooks, page 34 and Theme 11: Teacher subject knowledge, page 36).
In Pacific Rim countries, mathematically informed procedural teaching is introduced and promotedthrough carefully constructed textbooks. England’s textbooks are more routine and involve lessvariation in the construction of examples than those of many high attaining countries. Well-constructed textbooks not only support teachers but also provide support for pupils to workindependently out of class (see Theme 10: Textbooks, page 34).
Pupils from high attaining countries have, through textbooks, access at home to the materials theyand their teachers have used and will use in class. This enables them, and their parents and siblings,to work on catching up or preparing for new ideas (see Theme 10: Textbooks, page 34).
46 Values and variables: Mathematics education in high-performing countries
Teachers’ mathematical subject knowledge is widely regarded as an important basis for effectiveteaching of mathematics. However the relationship between teacher subject knowledge andpedagogy is not simple and pedagogy depends upon tacit values and expectations as well asknowledge. What a teacher emphasises within a lesson may depend on cultural factors such asbeliefs about learners as much as on the teacher’s subject knowledge (see Theme 11: Teacher subjectknowledge, page 36).
Descriptions of national teaching ‘scripts’ or lesson content may not reveal important characteristicsof pedagogic practices employed by teachers within that nation. For example, listing the tasks set ina lesson does not reveal how teachers develop these in practice. What may look like a proceduraltask can give rise to cognitive activity that addresses pupils’ understanding. Equally, a potentially ‘open’task can be made procedural by the teachers’ directions and interventions (see Theme 12: Pedagogy,page 38).
www.nuffieldfoundation.org 47
RecommendationsThere are a number of features widely held to be important in making a difference in attainment inmathematics, for example, setting, high expenditure on ICT (particularly interactive white boards)and specific types of lesson structure. Our survey found that such features either do not appear tomake a difference to attainment or produce different results in different contexts (this is exploredmore fully in the Introduction). We therefore conclude by identifying a small number of areas thatwe consider do have an impact on mathematical attainment and where further investigation anddevelopment would be worthwhile.
1. Evidence is needed from detailed comparative studies of mathematics education withinternational ‘culturally near-neighbours’ to England, such as Scotland, Massachusetts and theNetherlands. Evidence from such studies could include teacher recruitment and training, teachersubject knowledge, curriculum and pedagogy.
2. Studies are needed into the pedagogies of schools that achieve high standards in mathematicsfor all pupils to help our understanding of the interplay between cultures of high achievementand individual pupil progress.
3. Research is needed into the extent to which attainment in mathematics in England is supportedby shadow education. A particular question is whether or not pupils from lower socio-economicstatus backgrounds are being disadvantaged by lack of access to shadow education.
4. English textbooks or e-resources for pupils and teachers need to be improved. Textbooks orresources should be designed to have more mathematical coherence, connections and variation,as well as provide better support for teachers and support for pupils in independent learning.
5. Policy makers need to examine strategies for reducing the ‘opportunity gap’ in English schools interms of the mathematics qualifications and experience of the teachers of pupils from differentsocio-economic backgrounds.
6. Pupils and their parents from all socio-economic groups need to be engaged in establishingappropriately challenging yet realistic expectations for learning.
7. Investigation is needed into how teachers can develop classroom tasks that encourageunderstanding through deeper thinking about mathematical concepts and inter-relationships as well as procedural fluency.

48 Values and variables: Mathematics education in high-performing countries
ReferencesAkiba, M., LeTendre, G. K., and Scribner, J. P. (2007). Teacher Quality, Opportunity Gap, and National Achievement in 46 Countries.
Educational Researcher, 36(7), 369-387.Askew, M., Bibby, T., and Brown, M. (1997). Raising attainment in numeracy: Final Report to Nuffield Foundation. London: King’s College,
University of London.Askew, M., Brown, M., Rhodes, V., Wiliam, D., and Johnson, D. (1997). Effective Teachers of Numeracy: Report of a study carried out for
the Teacher Training Agency. London: King’s College, University of London.Baker, D. P., Motoko, A., LeTendre, G. K., and Wiseman, A. W. (2001). Worldwide Shadow Education: Outside-School Learning, Institutional
Quality of Schooling, and Cross-National Mathematics Achievement. Educational Evaluation and Policy Analysis, 23(1), 1-17.Bell, G. (1993). Asian perspectives on mathematics education. Maths x language = language x maths (Vol. 197).Boe, E. E., May, H., and Boruch, R. F. (2002). Student task persistence in the third international mathematics and science study: a major
source of achievement differences at the national, classroom and student levels. Philadelphia PA: Center for Research andEvaluation in Social Policy, Graduate School of Education, University of Pennsylvania.
Bradshaw, J., Sturman, L., Vappula, H., Ager, R., and Wheater, R. (2007). Achievement of 15-year-olds in England: PISA 2006 NationalReport (OECD Programme for International Student Assessment). Slough: NFER.
Broadfoot, P. (2000). Comparative Education for the 21st Century: Retrospect and Prospect. Comparative Education, 36(3), 357-371.Brown, M. (1998). The tyranny of the international horse race. In R. Slee, G. Weiner and S. Tomlinson (Eds.), School effectiveness for
whom? Challenges to the school effectiveness and school improvement movements (pp. 33-47). London: Falmer Press.Brown, M., Askew, M., Millett, A., and Rhodes, V. (2003). The key role of educational research in the development and evaluation of
the National Numeracy Strategy. British Educational Research Journal, 29(5), 655-672.Burstein, L. (Ed.). (1992). The IEA Study of Mathematics III: Student Growth and Classroom Processes. Oxford: Pergamon Press.Cai, J. (1995). A Cognitive Analysis of U.S. and Chinese Students’ Mathematical Performance on Tasks Involving Computation,
Simple Problem Solving, and Complex Problem Solving. Journal for Research in Mathematics Education. Monograph, 7, i-151.Cai, J. (2002). Assessing and understanding U.S. and Chinese students’ mathematical thinking. Zentralblatt für Didaktik der
Mathematik, 34(6), 278-290.Cai, J., and Hwang, Y. (2002). U.S. and Chinese students’ generalized and generative thinking in mathematical problem solving and
problem posing. Journal of Mathematical Behavior, 21, 401-421.Cai, J., and Silver, E. A. (1995). Solution Processes and Interpretations of Solutions in Solving a Division-with-Remainder Story
Problem: Do Chinese and U. S. Students Have Similar Difficulties? Journal for Research in Mathematics Education, 26(5), 491-497.Caplan, N., Choy, M. H., and Whitmore, J. K. (1992). Indochinese refugee families and academic achievement. Scientific American
266, 36-42.Chen, C., and Stevenson, H. W. (1989). Homework: A Cross-Cultural Examination. Child Development, 60(3), 551-561.Dahlin, B., and Watkins, D. (2000). The role of repetition in the processes of memorising and understanding: A comparison of the
views of German and Chinese secondary school students in Hong Kong. British Journal of Educational Psychology, 2000(70).Dehaene, S. (1997). The number sense: How the mind creates mathematics. Oxford: Oxford University Press.Elliott, J. G., Hufton, N., Illushin, L., and Lauchlan, F. (2001). Motivation in the Junior Years: International Perspectives on Children’s
Attitudes, Expectations and Behaviour and Their Relationship to Educational Achievement. Oxford Review of Education, 27(1), 37-68.Fuson, K. C., and Kwon, Y. (1992). Korean children’s single-digit addition and subtraction: Numbers structured by ten. Journal for
Research in Mathematics Education, 23(2), 148-165.Geary, D. C., Bow-Thomas, C. C., Fan, L., and Siegler, R. S. (1993). Even before formal instruction, Chinese children outperform
American children in mental addition. Cognitive Development, 8, 517-529.Goldstein, H. (2004). International comparisons of student attainment: some issues arising from the PISA study. Assessment in
Education: Principles, Policy and Practice, 11(3), 319-330.Gray, E. M., and Pitta, D. (1996). Number processing: qualitative differences in thinking and the role of imagery. Paper presented at the
Proceedings of the Twentieth Annual Conference of the International Group for the Psychology of Mathematics Education,University of Valencia, Spain.
Gu, L., Huang, R., and Marton, F. (2004). Teaching with variation: A Chinese way of promoting effective mathematics learning. In L. Fan, N.-Y.Wong, J. Cai and S. Li (Eds.), How Chinese learn mathematics: Perspectives from insiders (pp. 309-347). Singapore: World Scientific.
Haggarty, L., and Pepin, B. (2001). Mathematics textbooks and their use in English, French and German classrooms: a way tounderstand teaching and learning cultures. Zentralblatt für Didaktik der Mathematik: International Reviews on MathematicalEducation, 33(5), 158-175.
Hargreaves, A., Halasz, G., and Pont, B. (2007). School leadership for systemic improvement in Finland: A case study report for theOECD activity ‘Improving school leadership’ Retrieved June 24 2008, fromhttp://www.oecd.org/dataoecd/43/17/39928629.pdf
Hatano, G. (1990). Commentary: Toward the cultural psychology of mathematical cognition. In H. W. Stevenson, S.-Y. Lee, C. Chen, J .W. Stigler, C.-C. Hsu, S. Kitamura and G. Hatano (Eds.), Contexts of Achievement: A Study of American, Chinese, and Japanese Children.Monographs of the Society for Research in Child Development (Vol. 55, pp. 108-115): Society for Research in Child Development.
Hess, R. D., and Azuma, H. (1991). Cultural Support for Schooling: Contrasts between Japan and the United States. Educationalresearcher, 20(9), 2-12.
www.nuffieldfoundation.org 49
Hiebert, J., Gallimore, R., Garnier, H., Givvin, K. B., Hollingsworth, H., Jacobs, J., et al. (2003). Teaching Mathematics in Seven Countries:Results From the TIMSS 1999 Video Study. Washington DC: U.S. Department of Education, National Center for Education Statistics.
Hirabayashi, I. (2006). A traditional aspect of mathematics education in Japan. In F. K. S. Leung, K. D. Graf and F. J. Lopez-Real (Eds.),Mathematics education in different cultural traditions: a comparative study of East Asia and the West. The 13th ICMI Study (pp. 51-64).Dortrecht: Springer.
Hodgen, J., Küchemann, D., Brown, M., and Coe, R. (2009). Secondary students’ understanding of mathematics 30 years on. Paperpresented at the British Educational Research Association (BERA) Annual Conference, University of Manchester.
Hoyles, C., Foxman, D., and Küchemann, D. (2002). A comparative study of geometry curricula. Sudbury, Suffolk: QCA.Hughes, M., Desforges, C., Mitchell, C., and Carre, C. (2000). Numeracy and beyond: Applying mathematics in the primary school.
Buckingham: Open University Press.Huntsinger, C. S., Jose, P. E., Liaw, F.-R., and Ching, W.-D. (1997). Cultural Differences in Early Mathematics Learning: A Comparison of
Euro-American, Chinese-American, and Taiwan-Chinese Families. International Journal of Behavioral Development, 21(2), 371-388.Hwang, Y. (2001). Why do South Korean students study hard? Reflections on Paik’s study. International Journal of Educational
Research, 35(6), 609-618.International Review of Curriculum and Assessment Frameworks Internet Archive (INCA). (2009). Table 10 Control and supply of
school textbooks, INCA Comparative Tables, June 2009. Isoda, M. (2007). Japanese lesson study in mathematics: its impact, diversity and potential for educational improvement. Hackensack, N.
J.; London: World Scientific.Jablonka, E. (2005). Motivations and meanings of students’ actions in six classrooms from Germany, Hong Kong and the United
States. Zentralblatt für Didaktik der Mathematik, 37(5), 371-378.James W. Stigler, M. P. (1988). Mathematics learning in Japanese, Chinese, and American classrooms. New Directions for Child and
Adolescent Development, 1988 (41), 27-54.Kagan, J., Arcus, D., Snidman, N., Feng, W., Hendler, J., and Greene, S. (1994). Reactivity in infants: A cross-cultural study.
Developmental Psychology, 26, 342-345.Kang, H., and Hong, M. (2008). Achieving excellence in teacher workforce and equity in learning opportunities in South Korea.
Educational Researcher, 37(4), 200-207.Kang, H., and Hong, M. (2008). Achieving excellence in teacher workforce and equity in learning opportunities in South Korea.
Educational Researcher, 37(4), 200-207.Kupari, P., Reinikainen, P., and Törnroos, J. (2007). Finnish students’ mathematics and science results in recent international
assessment studies: PISA and TIMSS. In E. Pehkonen, M. Ahtee and J. Lavonen (Eds.), How Finns learn mathematics and science(pp. 11-34). Rotterdam: Sense Publishers.
Laborde, C. (2006). Teaching and learning. Introduction. In F. K. S. Leung, K. D. Graf and F. J. Lopez-Real (Eds.), Mathematics Educationin Different Cultural Tradition – A Comparative Study of East Asia and the West (pp. 285-289). New York: Springer.
Lapointe, A. E., Mead, N. A., and Askew, J. (1992). Learning mathematics. Princeton, NJ: Educational Testing Service’s Center for theAssessment of Educational Progress
Lapointe, A. E., Mead, N. A., and Philips, G. W. (1989). A world of difference: An international assessment of mathematics and science.Princeton, NJ: Educational Testing Service.
Lee, C. J. (2005). Korean Education Fever and Private Tutoring. KEDI Journal of Educational Policy, 2(1), 99-107.LeTendre, G. K. (1999). The Problem of Japan: Qualitative Studies and International Educational Comparisons. Educational
Researcher, 28(2), 38-45.Leung, F. (2001). In Search of an East Asian Identity in Mathematics Education. Educational Studies in Mathematics, 47(1), 35-51.Leung, F. K. S. (2002). Behind the High Achievement of East Asian Students. Educational Research and Evaluation, 8(1), 87-108.Leung, F. K. S. (2005). Some characteristics of East Asian mathematics classrooms based on data from the TIMSS 1999 Video Study.
Educational Studies in Mathematics, 60, 199–215.Leung, F. K. S., Graf, K. D., and Lopez-Real, F. J. (Eds.). (2006). Mathematics education in different cultural traditions: a comparative study
of East Asia and the West. The 13th ICMI Study. Dortrecht: Springer.Leung, F., and Park, K. (2002). Competent students, competent teachers? International Journal of Educational Research, 37(2), 113-129.Lew, H.-C. (2008). Some characteristics in Korean National Curriculum and its revision process In Z. Usiskin and E. Willmore
(Eds.), Mathematics curriculum in Pacific Rim Countries – China, Japan, Korea and Singapore. (pp. 37-78). Mississippi:Information Age Publishing.
Li, Y., Chen, X., and Kulm, G. (2009). Mathematics teachers’ practices and thinking in lesson plan development: a case of teachingfraction division. Zentralblatt für Didaktik der Mathematik, 41, 717-731.
Ma, L. (1999). Knowing and Teaching Elementary Mathematics: Teachers’ Understanding of Fundamental Mathematics in China and theUnited States. Mahwah, New Jersey: Lawrence Erlbaum Associates.
Merrell, C., and Tymms, P. (2007). What children know and can do when they start school and how this varies between countries.Journal of Early Childhood Research, 5(2), 115-134.
Miura, I. T., Kim, C. C., Chang, C.-M., and Okamoto, Y. (1988). Effects of Language Characteristics on Children’s CognitiveRepresentation of Number: Cross-National Comparisons. Child Development, 59(6), 1445-1450.
Mosvold, R. (2008). Real-life Connections in Japan and the Netherlands: National teaching patterns and cultural beliefs. InternationalJournal for Mathematics Teaching and Learning. Plymouth University, UK: Centre for Innovation in Mathematics Teaching
Mullis, I. V. S., Martin, M. O., Foy, P., Olson, J. F., Preuschoff, C., Erberber, E., et al. (2008). TIMSS 2007 International Mathematics Report.Chestnut Hill, MA: TIMSS and PIRLS International Study Center, Boston College.
National Assessment of Educational Progress (1985). The third national mathematics assessment: Results, trends and issues. Denver,CO: NAEP.
50 Values and variables: Mathematics education in high-performing countries
Neubrand, J. (2006). The TIMSS 1995 and 1999 video studies. In F. K. S. Leung, K. D. Graf and F. J. Lopez-Real (Eds.), MathematicsEducation in Different Cultural Traditions-A Comparative Study of East Asia and the West (pp. 290-318). New York: Springer.
Osborne, J., Black, P., Boaler, J., Brown, M., Driver, R., and Murray, R. (1997). Attitudes to Science, Mathematics and Technology: A reviewof research. London: King’s College, University of London.
Paik, S. J. (2001). Introduction, background, and international perspectives: Korean history, culture, and education. InternationalJournal of Educational Research, 35(6), 535-607.
Pehkonen, E., Ahtee, M., and Lavonen, J. (Eds.). (2007). How Finns learn mathematics and science. Rotterdam: Sense Publishers.Philippou, G. N., and Christou, C. (1999). Teachers’ conceptions of mathematics and students’ achievement: a cross-cultural study
based on results from TIMSS. Studies in Educational Evaluation, 25, 379-398.Programme for International Student Assessment, P. (2007). Science competencies for Tomorrow’s World: Volume 1 Analysis. Paris:
Organisation for Economic Co-operation and Development (OECD).Riordan, J. E., and Noyce, P. E. (2001). The Impact of Two Standards-Based Mathematics Curricula on Student Achievement in
Massachusetts. Journal for Research in Mathematics Education, 32(4), 368-398.Sahlberg, P. (2007). Education policies for raising student learning: the Finnish approach. Journal of Education Policy, 22(2), 147-171.Schmidt, W. H., Jorde, D., Cogan, L. S., Barrier, E., Gonzalo, I., Moser, U., et al. (1996). Characterizing pedagogical flow.
Dordrecht/Boston/London: Kluwer Academic Publishers.Schümer, G. (1999). Mathematics education in Japan. Journal of Curriculum Studies, 31(4), 399-427.Shayer, M., and Ginsburg, D. (2009). Thirty years on – a large anti-Flynn effect? (II): 13- and 14-year-olds. Piagetian tests of formal
operations norms 1976-2006/7. British Journal of Educational Psychology, 79, 409-418.Shen, C., and Tam, H. P. (2008). The paradoxical relationship between student achievement and self-perception: a cross-national
analysis based on three waves of TIMSS data. Educational Research and Evaluation, 14(1), 87-100.Shih, M., Pittinsky, T., and Ambady, N. (1999). Stereotype Susceptibility: Identity Salience and Shifts in Quantitative Performance.
Psychological Science, 10(January), 80-93.Shiqi, L. (2006). Practice makes perfect: a key belief in China. In F. K. S. Leung, K. D. Graf and F. J. Lopez-Real (Eds.), Mathematics
education in different cultural traditions: a comparative study of East Asia and the West. The 13th ICMI Study (pp. 129-138).Dortrecht: Springer.
Soh, C. K. (2008). An overview of mathematics education in Singapore. In Z. Usiskin and E. Willmore (Eds.), Mathematics curriculumin Pacific Rim Countries – China, Japan, Korea and Singapore. (pp. 23-36). Mississippi: Information Age Publishing.
Song, M.-J., and Ginsburg, H. P. (1987). The Development of Informal and Formal Mathematical Thinking in Korean and U. S.Children. Child Development, 58(5), 1286-1296.
Stevenson, H. W., Lee, S.-Y., Chen, C., Stigler, J. W., Hsu, C.-C., Kitamura, S., et al. (1990). Contexts of Achievement: A Study ofAmerican, Chinese, and Japanese Children. Monographs of the Society for Research in Child Development, 55(1/2), i-119.
Stigler, J. W., and Hiebert, J. (1999). The teaching gap: best ideas from the world’s teachers for improving education in the classroom.New York: Free Press.
Stigler, J. W., and Perry, M. (1988). Cross-cultural studies of mathematics teaching and learning: recent findings and new directions. InD. A. Grouws, T. J. Cooney and D. Jones (Eds.), Perspectives on research on effective mathematics teaching (Vol. 1, pp. 194-223).Reston, VA: National Council of Teachers of Mathematics/Lawrence Erlbaum Associates.
Sturman, L., Ruddock, G., Burge, B., Styles, B., Lin, Y., and Vappula, H. (2008). England’s Achievement in TIMSS 2007 National Report forEngland. Slough: NFER.
Sutherland, R. (2002). A comparative study of algebra curricula. Sudbury, Suffolk: QCA.Sylva, K., Melhuish, E., Sammons, P., Siraj-Blatchford, I., and Taggart, B. (2008). Final Report from the Primary Phase: Pre-school, School
and Family Influences on Children’s Development During Key Stage 2 (Age 7-11). Research Report DCSF-RR061. London:Department for Schools, Children and Families.
Tsui, M. (2005). Family Income, Home Environment, Parenting, and Mathematics Achievement of Children in China and the UnitedStates. Education and Urban Society, 37(3), 336-355.
Tsuneyoshi, R. (2004). The new Japanese educational reforms and the achievement ‘crisis’ debate. Educational Policy, 18(364-394).Usiskin, Z., and Willmore, E. (Eds.). (2008). Mathematics curriculum in Pacific Rim Countries – China, Japan, Korea and Singapore. .
Mississippi: Information Age Publishing.Van de Rijt, B., Godfrey, R., Aubrey, C., Luit, v., J. E. H., Ghesquiere, P., Torbeyns, J., et al. (2003). The development of early numeracy in
Europe. Journal of Early Childhood Research, 1(2), 155-180.Wang, J., Wildman, L., & Calhoun, G. (1996). The relationships between parental influence and student achievement in Seventh
Grade Mathematics. School Science and Mathematics, 96(8), 395-399.Wilkinson, R., and Pickett, K. (2009). The Spirit Level. Why more equal societies almost always do better. London: Allen Lane.Xie, X. (2004). The Cultivation of Problem-Solving and Reason in NCTM and Chinese National Standards [87]. International Journal
for Mathematics Teaching and Learning, 12, 1-19.Zhou, Z., Peverly, S. T., and Xin, T. (2006). Knowing and teaching fractions: A cross-cultural study of American and Chinese
mathematics teachers. Contemporary Educational Psychology, 31(4), 438-457.Zhou, Z., Peverly, S. T., Boehm, A. E., and Chongde, L. (2000). American and Chinese children’s understanding of distance, time, and
speed interrelations. Cognitive Development, 15(2), 215-240.

www.nuffieldfoundation.org 51

Published by the Nuffield Foundation, 28 Bedford Square, London WC1B 3JSCopyright © Nuffield Foundation 2010
ISBN 978-0-904956-77-1
www.nuffieldfoundation.org ww
w.d
esig
n-m
ill.co
.uk