Embed Size (px)
Citation preview
Valuing Cash Flows IIValuing Cash Flows II
Contingent PaymentsContingent Payments
Valuing Cash FlowsValuing Cash Flows
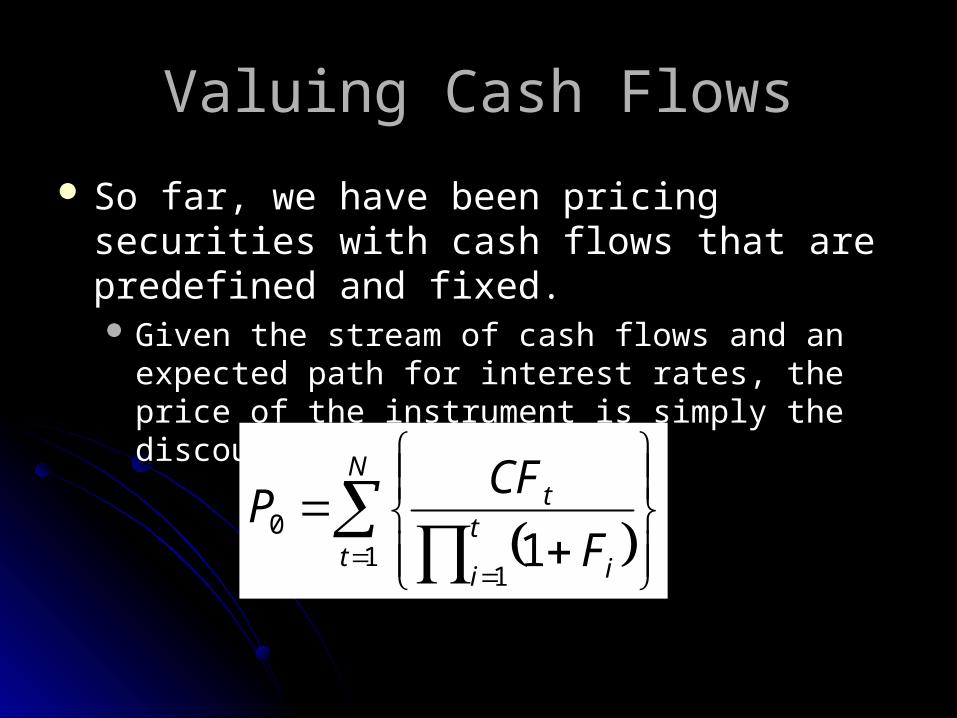
So far, we have been pricing securities with cash So far, we have been pricing securities with cash flows that are predefined and fixed. flows that are predefined and fixed. Given the stream of cash flows and an expected path Given the stream of cash flows and an expected path
for interest rates, the price of the instrument is simply for interest rates, the price of the instrument is simply the discounted valuethe discounted value
N
tt
i i
t
F
CFP
11
01
Valuing Cash FlowsValuing Cash Flows
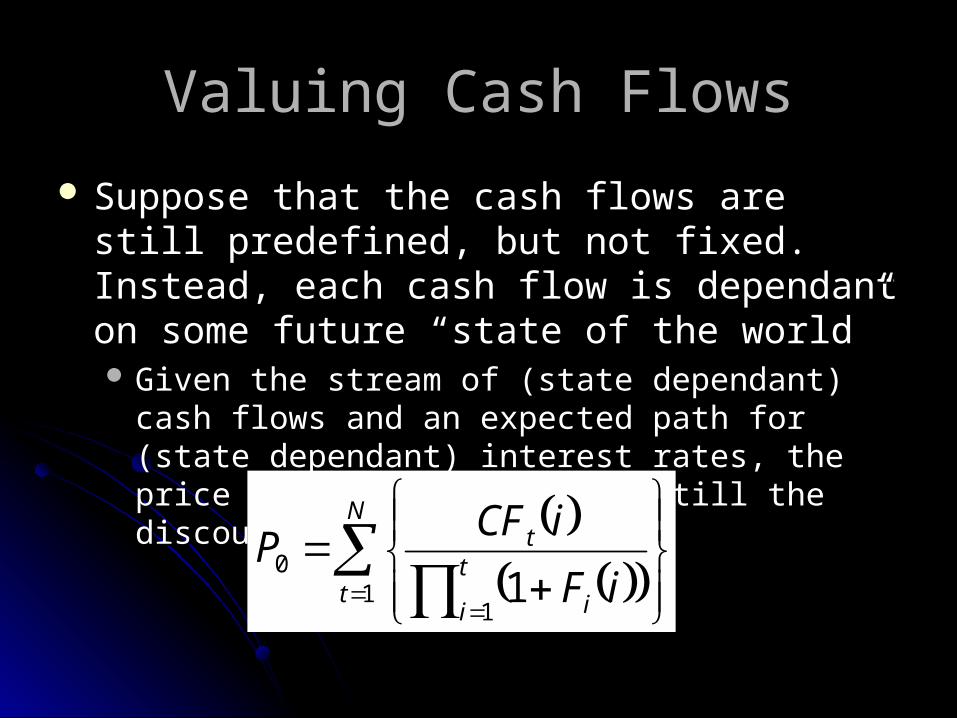
Suppose that the cash flows are still predefined, Suppose that the cash flows are still predefined, but not fixed. Instead, each cash flow is but not fixed. Instead, each cash flow is dependant on some future “state of the world”dependant on some future “state of the world” Given the stream of (state dependant) cash flows and Given the stream of (state dependant) cash flows and
an expected path for (state dependant) interest rates, an expected path for (state dependant) interest rates, the price of the instrument is still the discounted valuethe price of the instrument is still the discounted value
N
tt
i i
t
iF
iCFP
11
01
ExampleExample
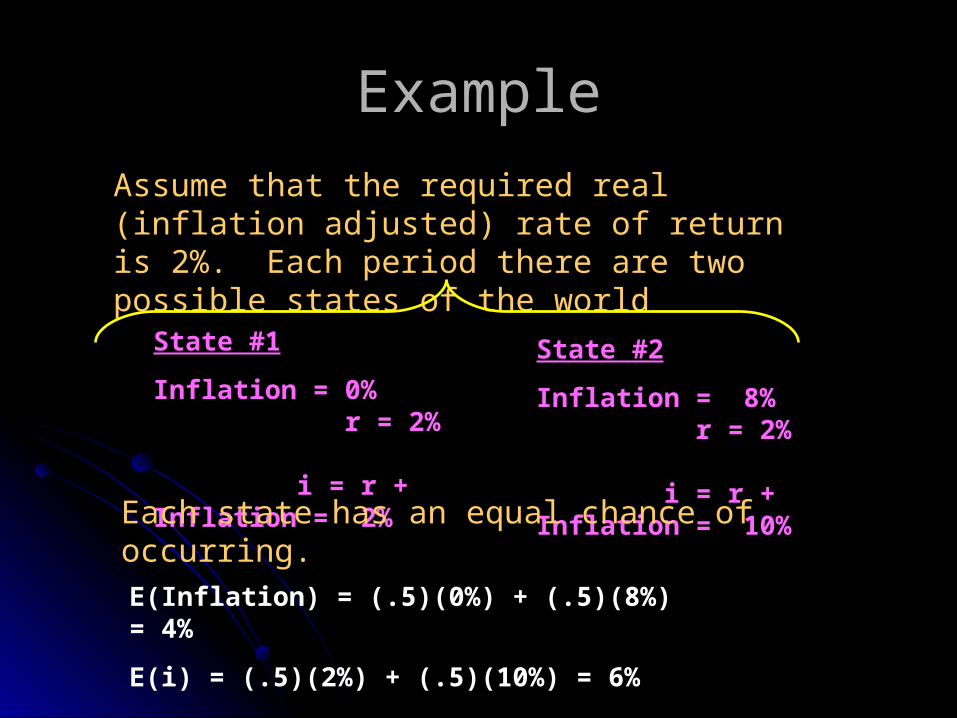
Assume that the required real (inflation adjusted) rate of return is 2%. Each period there are two possible states of the world
State #1
Inflation = 0% r = 2% i = r + Inflation = 2%
State #2
Inflation = 8% r = 2% i = r + Inflation = 10%
Each state has an equal chance of occurring.
E(Inflation) = (.5)(0%) + (.5)(8%) = 4%
E(i) = (.5)(2%) + (.5)(10%) = 6%
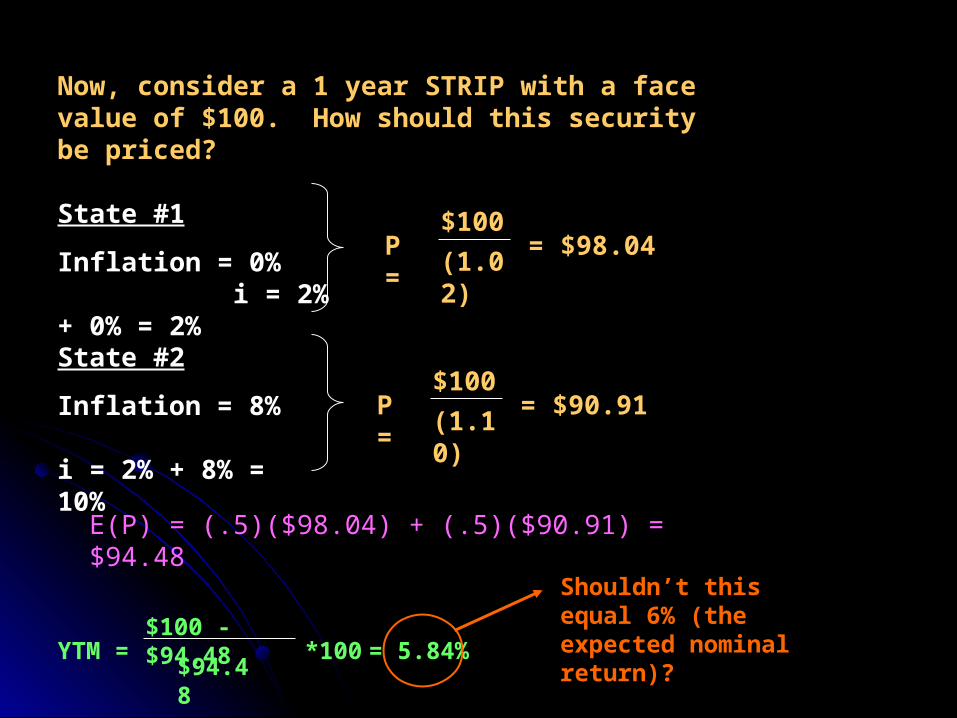
Now, consider a 1 year STRIP with a face value of $100. How should this security be priced?
State #1
Inflation = 0% i = 2% + 0% = 2%
State #2
Inflation = 8% i = 2% + 8% = 10%
P = $100
(1.02)= $98.04
P = $100
(1.10)= $90.91
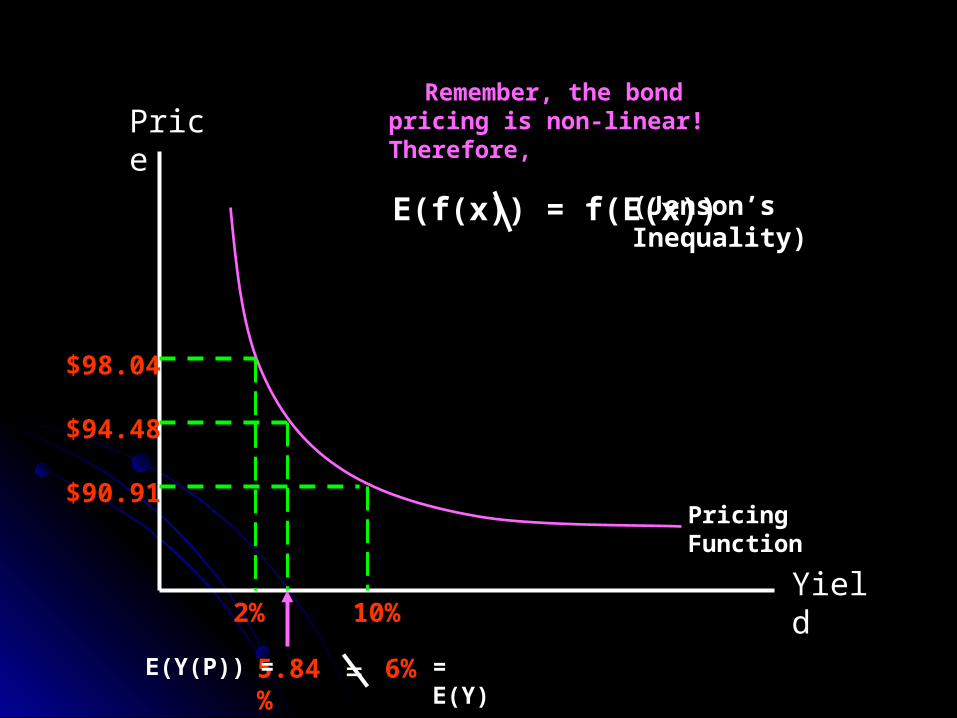
E(P) = (.5)($98.04) + (.5)($90.91) = $94.48
YTM = $100 - $94.48
$94.48= 5.84%
Shouldn’t this equal 6% (the expected nominal return)?*100
Price
Yield
$90.91
5.84%
10%2%
$98.04
$94.48
Pricing Function
Remember, the bond pricing is non-linear! Therefore,
= 6%E(Y(P)) = = E(Y)
E(f(x)) = f(E(x)) (Jenson’s Inequality)
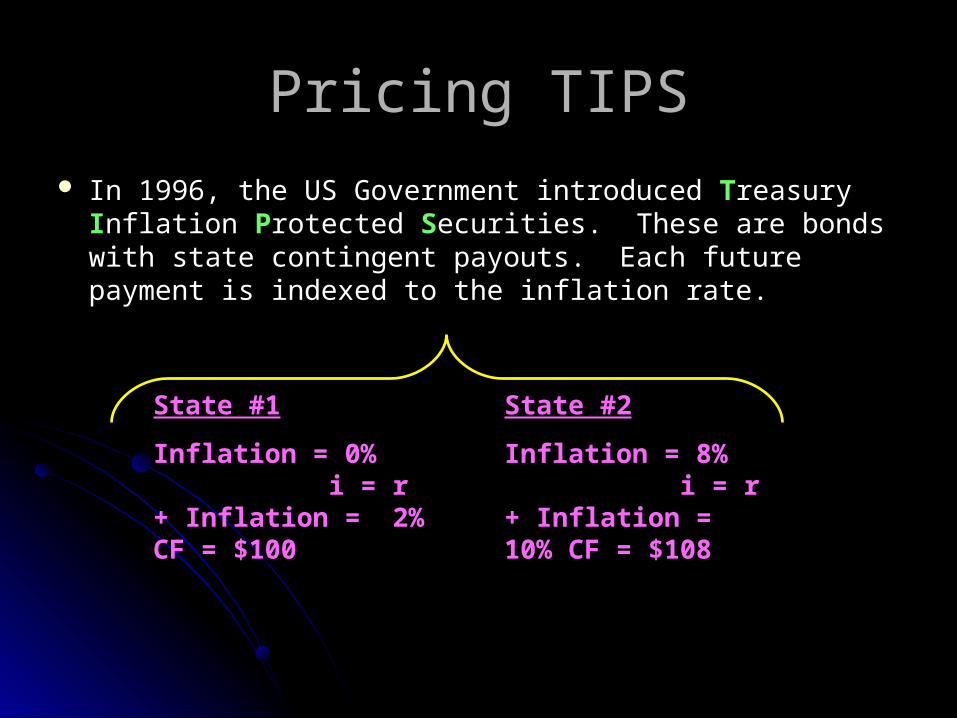
Pricing TIPSPricing TIPS
In 1996, the US Government introduced In 1996, the US Government introduced Treasury reasury Inflation nflation Protected rotected Securities. These are bonds with ecurities. These are bonds with state contingent payouts. Each future payment is state contingent payouts. Each future payment is indexed to the inflation rate. indexed to the inflation rate.
State #1
Inflation = 0% i = r + Inflation = 2% CF = $100
State #2
Inflation = 8% i = r + Inflation = 10% CF = $108
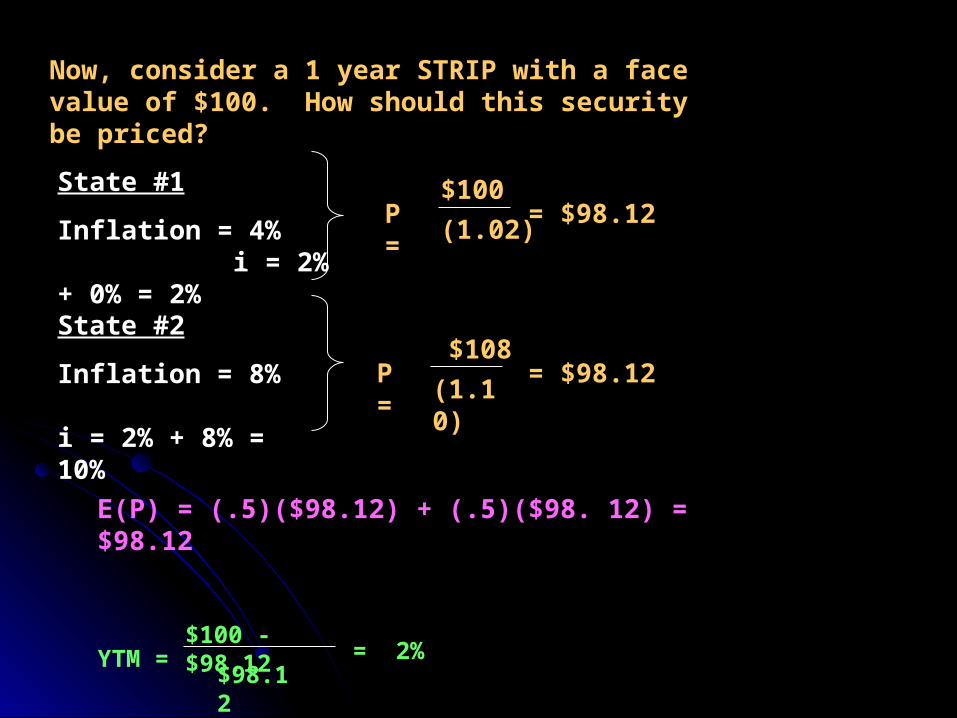
Now, consider a 1 year STRIP with a face value of $100. How should this security be priced?
State #1
Inflation = 4% i = 2% + 0% = 2%
State #2
Inflation = 8% i = 2% + 8% = 10%
P = $100
(1.02)= $98.12
P = $108
(1.10)= $98.12
E(P) = (.5)($98.12) + (.5)($98. 12) = $98.12
YTM = $100 - $98.12
$98.12= 2%
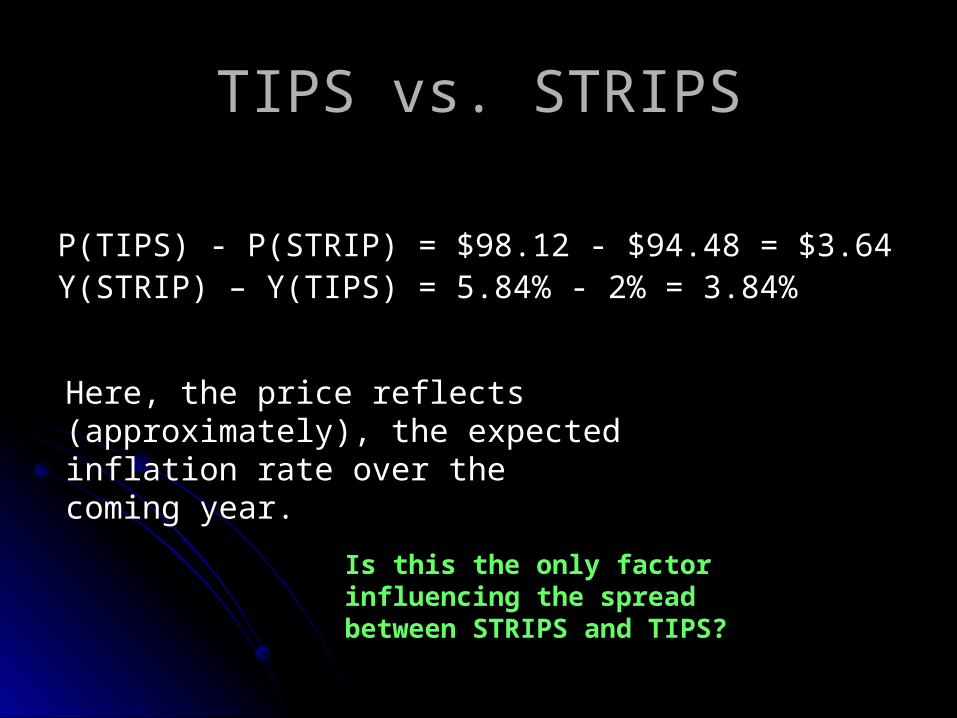
TIPS vs. STRIPSTIPS vs. STRIPS
P(TIPS) - P(STRIP) = $98.12 - $94.48 = $3.64P(TIPS) - P(STRIP) = $98.12 - $94.48 = $3.64Y(STRIP) – Y(TIPS) = 5.84% - 2% = 3.84%Y(STRIP) – Y(TIPS) = 5.84% - 2% = 3.84%
Here, the price reflects (approximately), the expected inflation rate over the coming year.
Is this the only factor influencing the spread between STRIPS and TIPS?
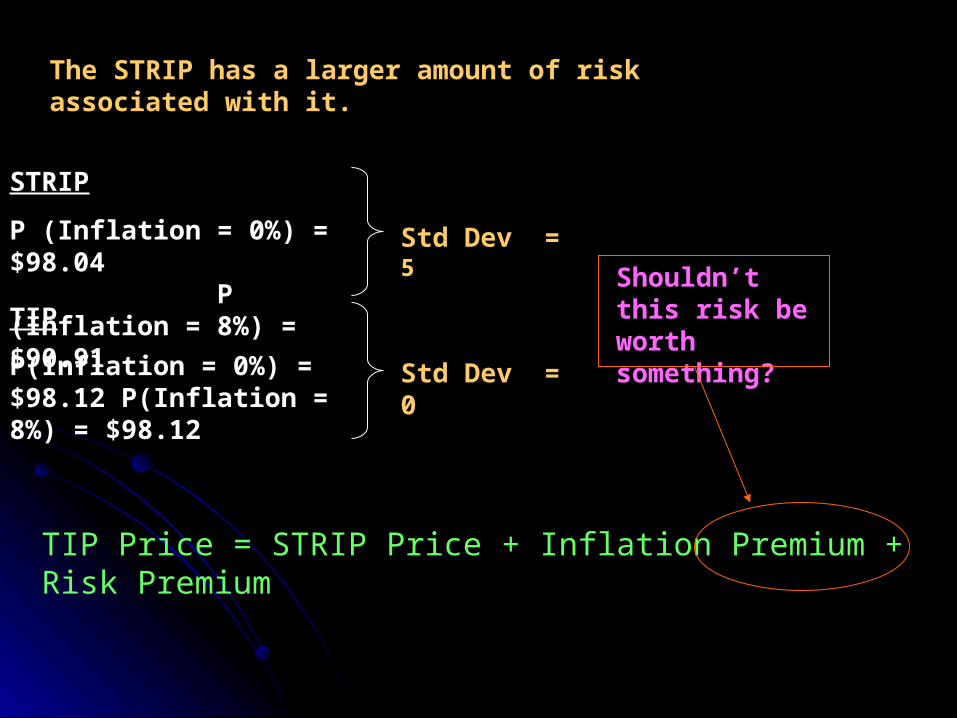
The STRIP has a larger amount of risk associated with it.
STRIP
P (Inflation = 0%) = $98.04 P (Inflation = 8%) = $90.91TIP
P(Inflation = 0%) = $98.12 P(Inflation = 8%) = $98.12
Std Dev = 5
Shouldn’t this risk be worth something?
Std Dev = 0
TIP Price = STRIP Price + Inflation Premium + Risk Premium
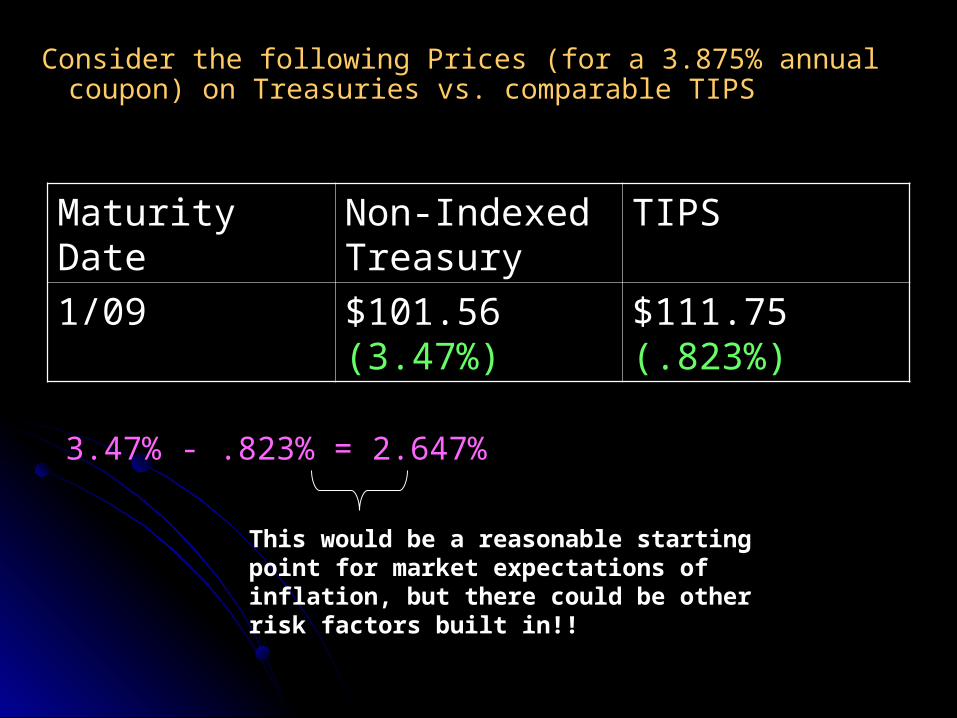
Consider the following Prices (for a 3.875% annual coupon) on Treasuries vs. comparable TIPS
Maturity DateMaturity Date Non-Indexed Non-Indexed TreasuryTreasury
TIPSTIPS
1/091/09 $101.56 $101.56 (3.47%)
$111.75 $111.75 (.823%)
3.47% - .823% = 2.647%
This would be a reasonable starting point for market expectations of inflation, but there could be other risk factors built in!!
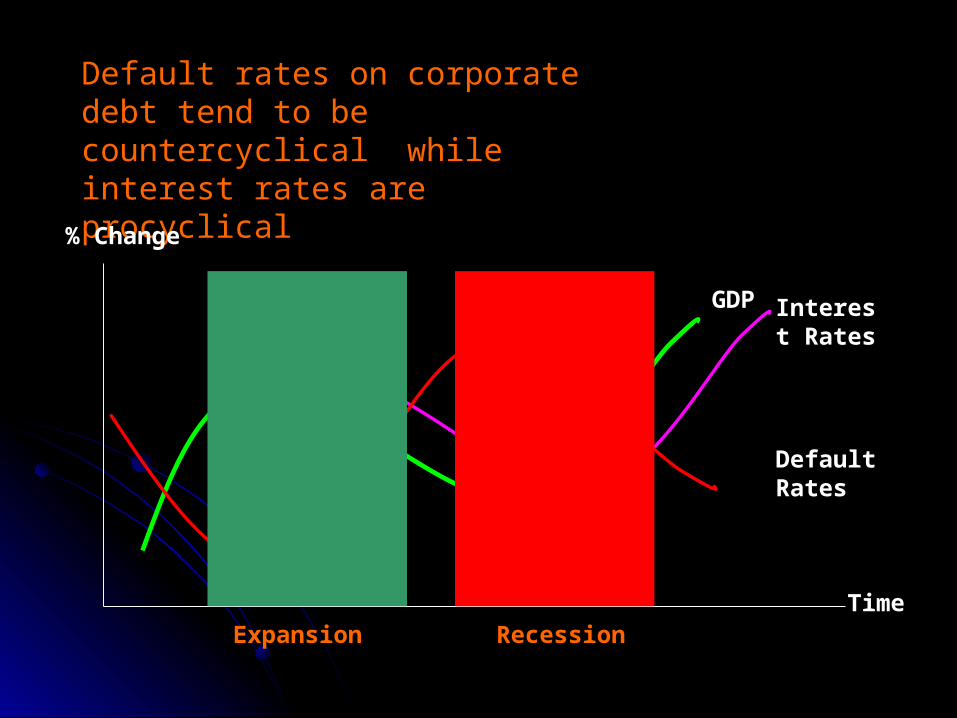
Default rates on corporate debt tend to be countercyclical while interest rates are procyclical
GDP
Time
Interest Rates
% Change
Default Rates
RecessionExpansion
StateState TreasuryTreasury Corporate Interest RateInterest Rate
ExpansionExpansion $100$100 $98 6%6%
RecessionRecession $100$100 $88 3%3%
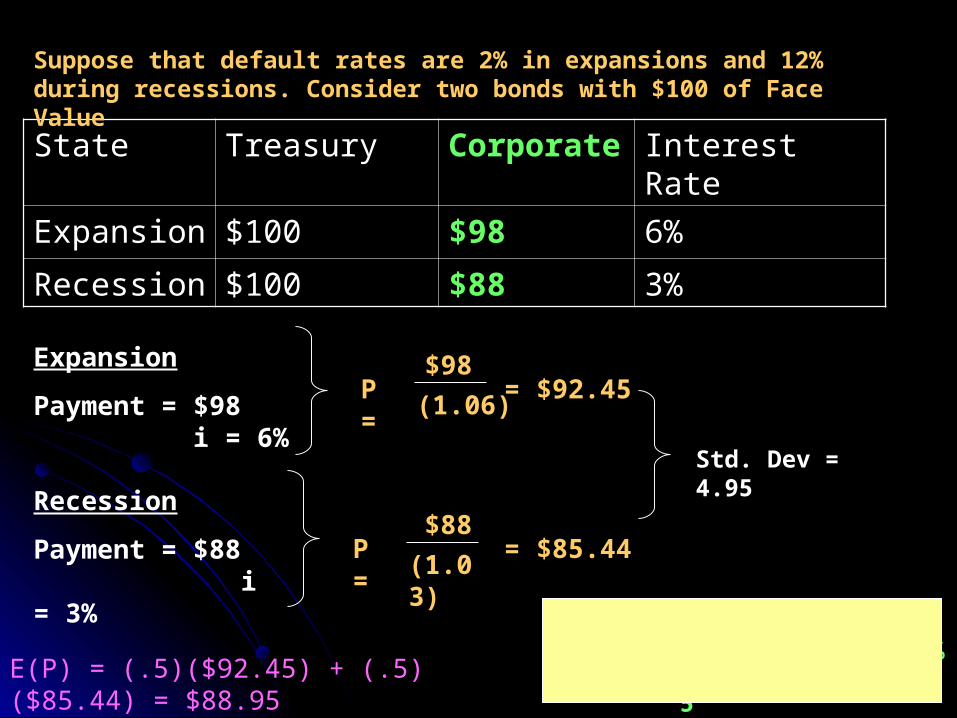
Suppose that default rates are 2% in expansions and 12% during recessions. Consider two bonds with $100 of Face Value
Expansion
Payment = $98 i = 6%
Recession
Payment = $88 i = 3%
P = $98
(1.06)= $92.45
P = $88
(1.03)= $85.44
E(P) = (.5)($92.45) + (.5)($85.44) = $88.95 YTM = $100 - $88.95
$88.95= 12.42%
Std. Dev = 4.95

StateState Treasury CorporateCorporate Interest RateInterest Rate
ExpansionExpansion $100 $98 $98 6%6%
RecessionRecession $100 $88$88 3%3%
A Treasury Bill Pays out $100 Regardless of the State
Expansion
Payment = $100 i = 6%
Recession
Payment = $100 i = 3%
P = $100
(1.06)= $94.34
P = $100
(1.03)= $97.08
E(P) = (.5)($94.34) + (.5)($97.08) = $95.71 YTM = $100 - $95.71
$95.71= 4.48%
Std. Dev = 1.93
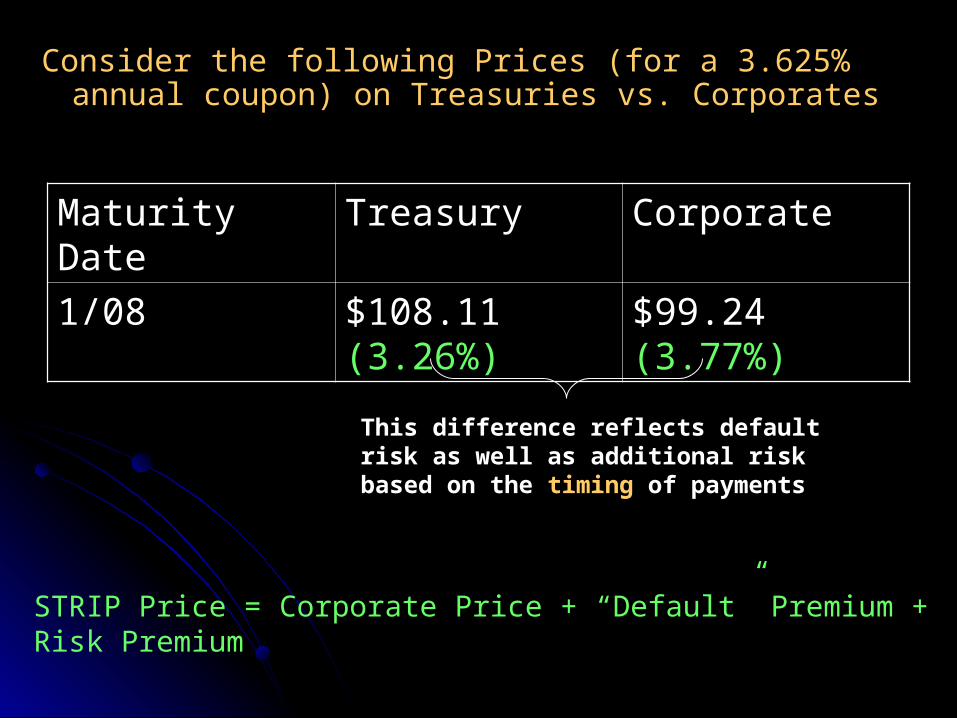
Consider the following Prices (for a 3.625% annual coupon) on Treasuries vs. Corporates
Maturity DateMaturity Date TreasuryTreasury CorporateCorporate
1/081/08 $108.11 $108.11 (3.26%)
$99.24 $99.24 (3.77%)
This difference reflects default risk as well as additional risk based on the timing of payments
STRIP Price = Corporate Price + “Default” Premium + Risk Premium
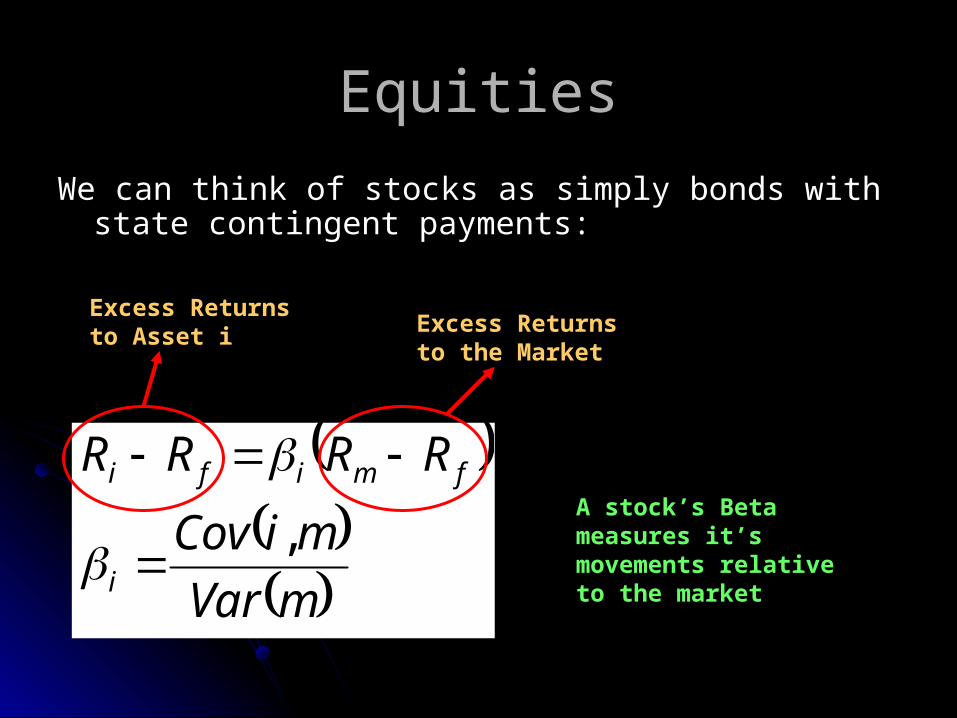
EquitiesEquities
We can think of stocks as simply bonds with state We can think of stocks as simply bonds with state contingent payments: contingent payments:
mVar
miCov
RRRR
i
fmifi
,
Excess Returns to Asset i Excess Returns
to the Market
A stock’s Beta measures it’s movements relative to the market
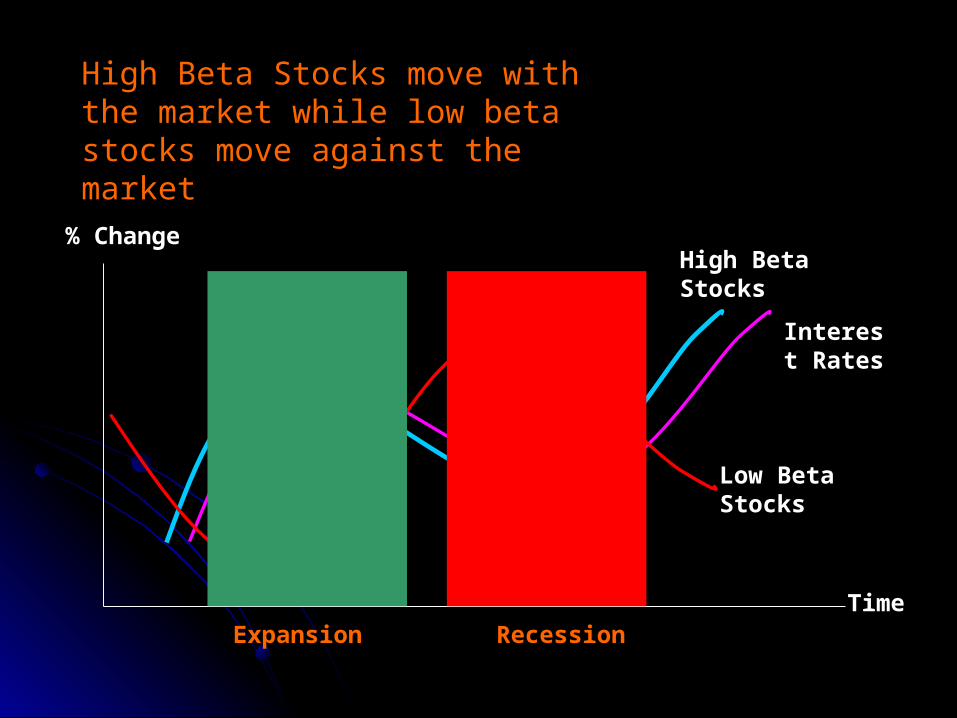
High Beta Stocks move with the market while low beta stocks move against the market
High Beta Stocks
Time
Interest Rates
% Change
Low Beta Stocks
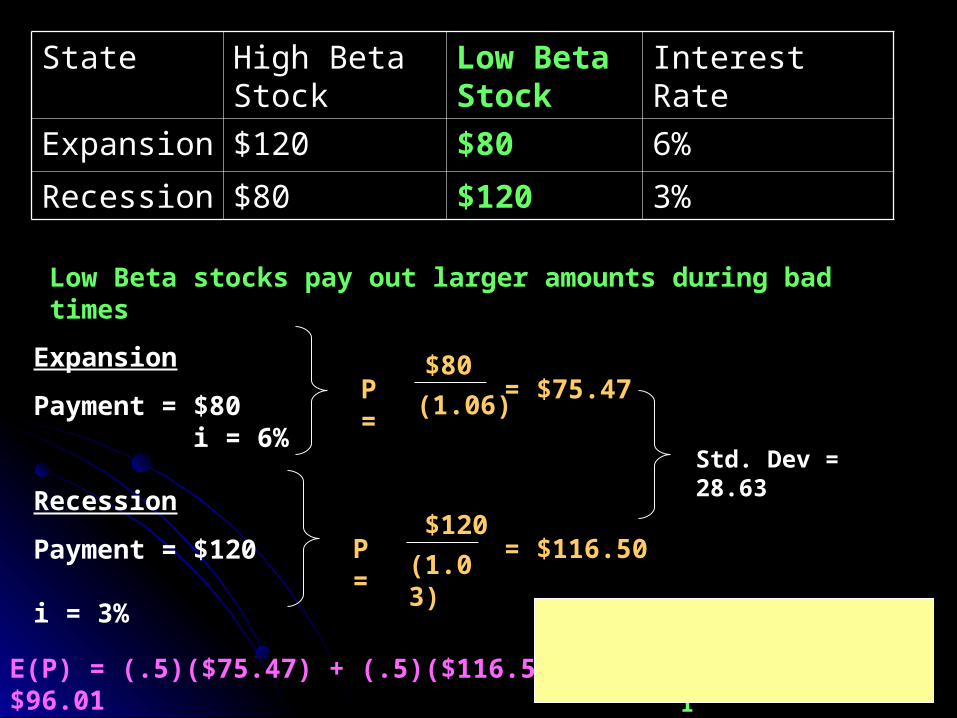
RecessionExpansion
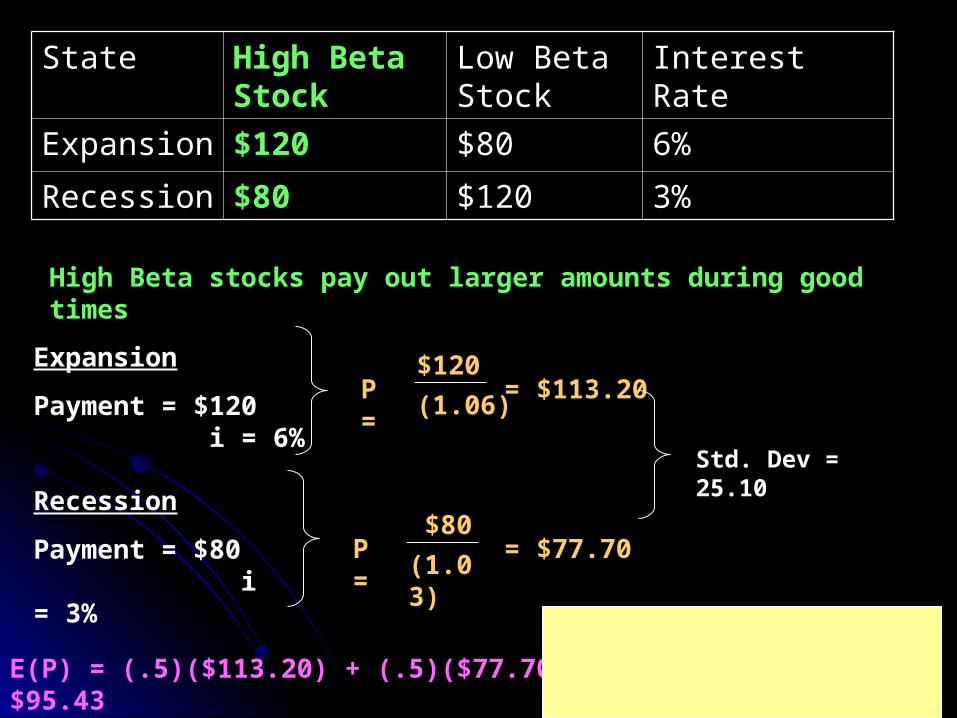
StateState High Beta Stock
Low Beta Low Beta StockStock
Interest RateInterest Rate
ExpansionExpansion $120 $80 $80 6%6%
RecessionRecession $80 $120$120 3%3%
High Beta stocks pay out larger amounts during good times
Expansion
Payment = $120 i = 6%
Recession
Payment = $80 i = 3%
P = $120
(1.06)= $113.20
P = $80
(1.03)= $77.70
E(P) = (.5)($113.20) + (.5)($77.70) = $95.43 YTM = $100 - $95.43
$95.43= 4.8%
Std. Dev = 25.10
StateState High Beta High Beta StockStock
Low Beta Stock
Interest RateInterest Rate
ExpansionExpansion $120$120 $80 6%6%
RecessionRecession $80$80 $120 3%3%
Expansion
Payment = $80 i = 6%
Recession
Payment = $120 i = 3%
P = $80
(1.06)= $75.47
P = $120
(1.03)= $116.50
E(P) = (.5)($75.47) + (.5)($116.50) = $96.01 YTM = $100 - $96.01
$96.01= 4.41%
Std. Dev = 28.63
Low Beta stocks pay out larger amounts during bad times
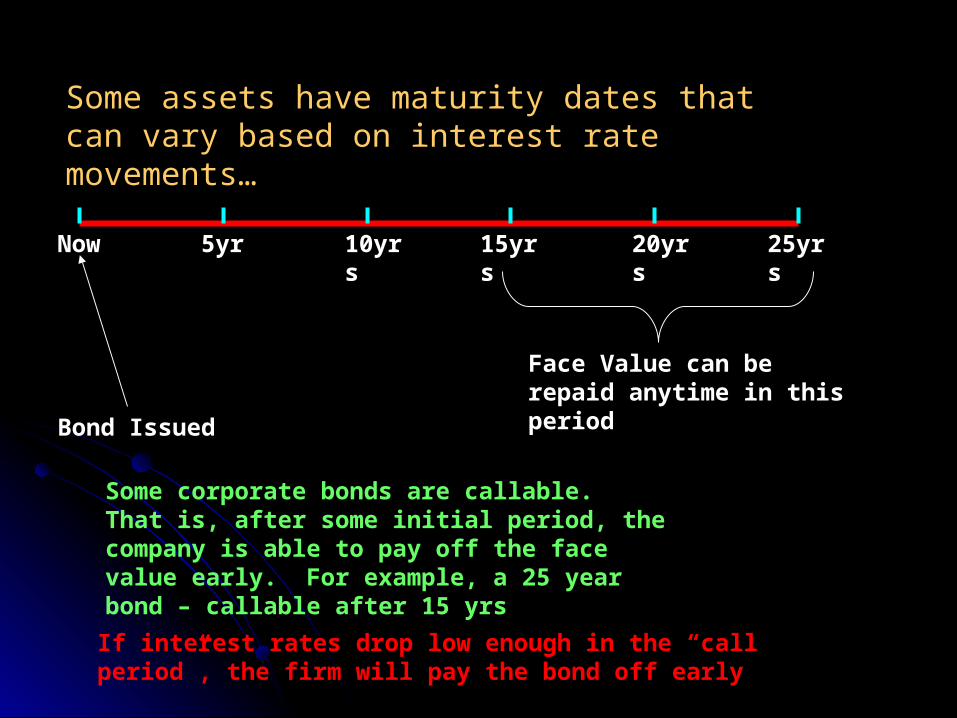
Some assets have maturity dates that can vary based on interest rate movements…
Now 5yr 10yrs 20yrs15yrs 25yrs
Some corporate bonds are callable. That is, after some initial period, the company is able to pay off the face value early. For example, a 25 year bond – callable after 15 yrs
Bond Issued
Face Value can be repaid anytime in this period
If interest rates drop low enough in the “call period”, the firm will pay the bond off early
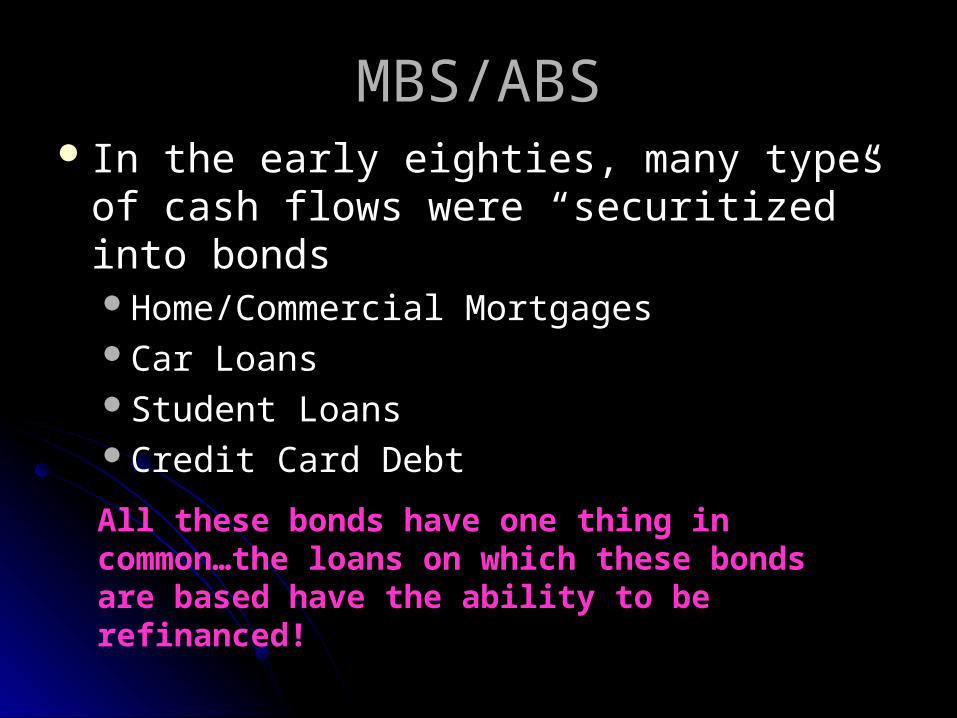
MBS/ABSMBS/ABS In the early eighties, many types of cash In the early eighties, many types of cash
flows were “securitized” into bondsflows were “securitized” into bondsHome/Commercial MortgagesHome/Commercial MortgagesCar LoansCar LoansStudent LoansStudent LoansCredit Card DebtCredit Card Debt
All these bonds have one thing in common…the loans on which these bonds are based have the ability to be refinanced!
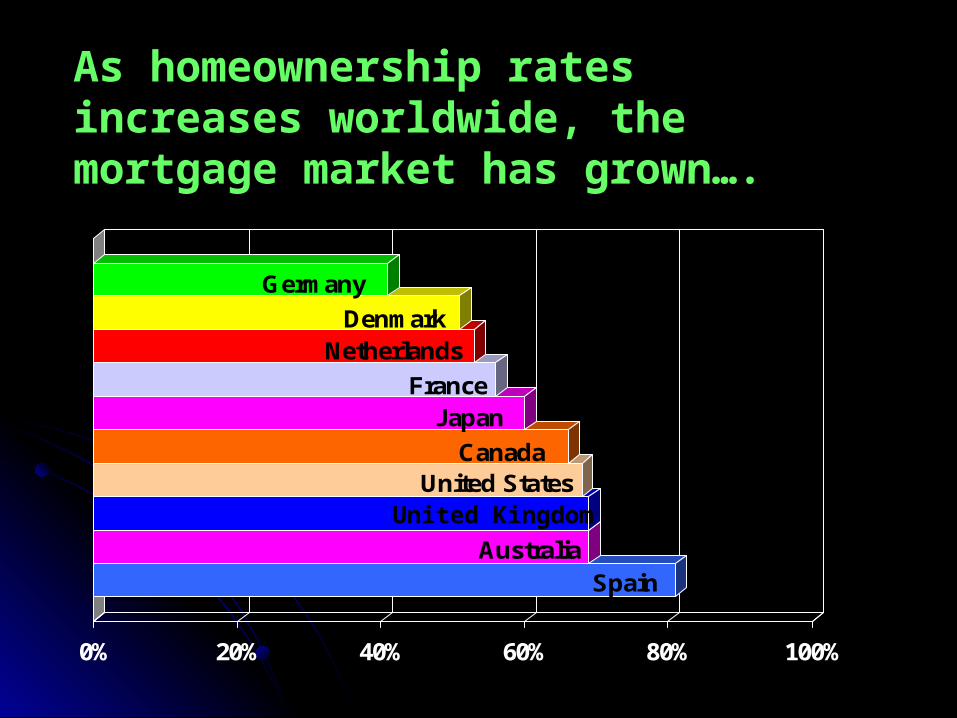
As homeownership rates increases As homeownership rates increases worldwide, the mortgage market has worldwide, the mortgage market has grown….grown….
SpainAustralia
United StatesCanada
JapanFrance
NetherlandsDenmark
Germany
0% 20% 40% 60% 80% 100%
United Kingdom
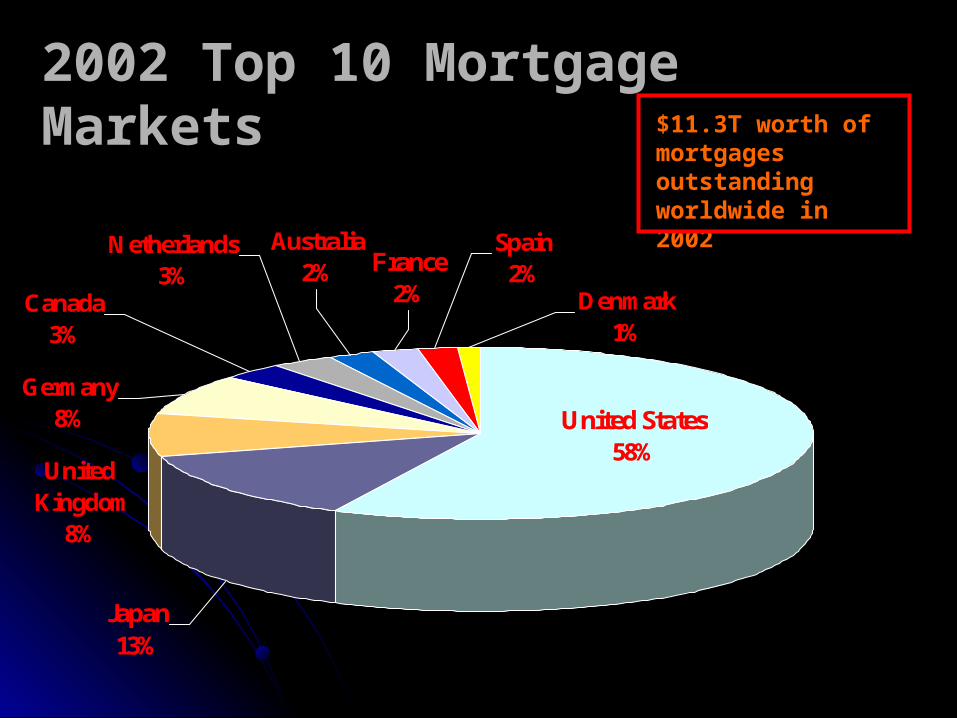
Canada3%
Germany8%
United Kingdom
8%
Australia2%
United States58%
Japan13%
France2%
Spain2%
Netherlands3%
Denmark1%
2002 Top 10 Mortgage 2002 Top 10 Mortgage MarketsMarkets $11.3T worth of
mortgages outstanding worldwide in 2002
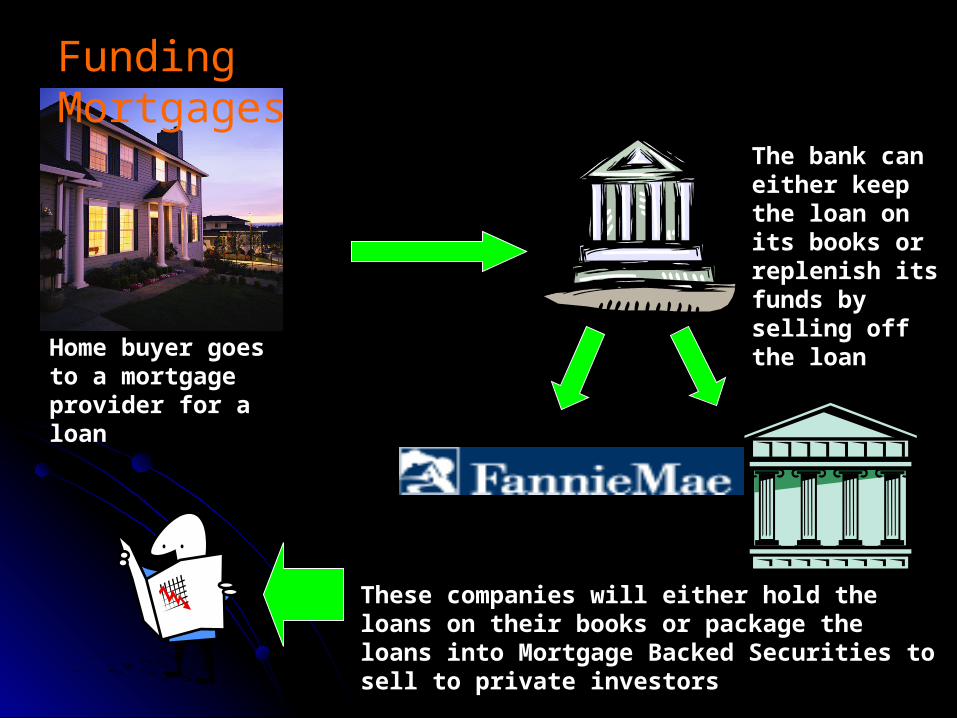
Funding Mortgages
Home buyer goes to a mortgage provider for a loan
The bank can either keep the loan on its books or replenish its funds by selling off the loan
These companies will either hold the loans on their books or package the loans into Mortgage Backed Securities to sell to private investors
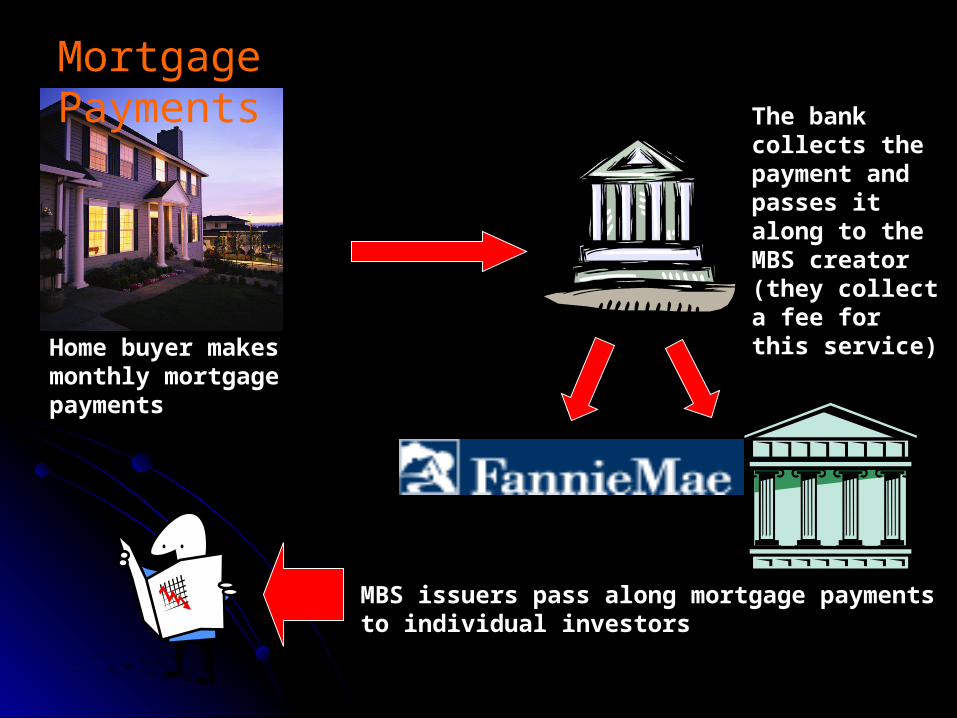
Mortgage Payments
Home buyer makes monthly mortgage payments
The bank collects the payment and passes it along to the MBS creator (they collect a fee for this service)
MBS issuers pass along mortgage payments to individual investors
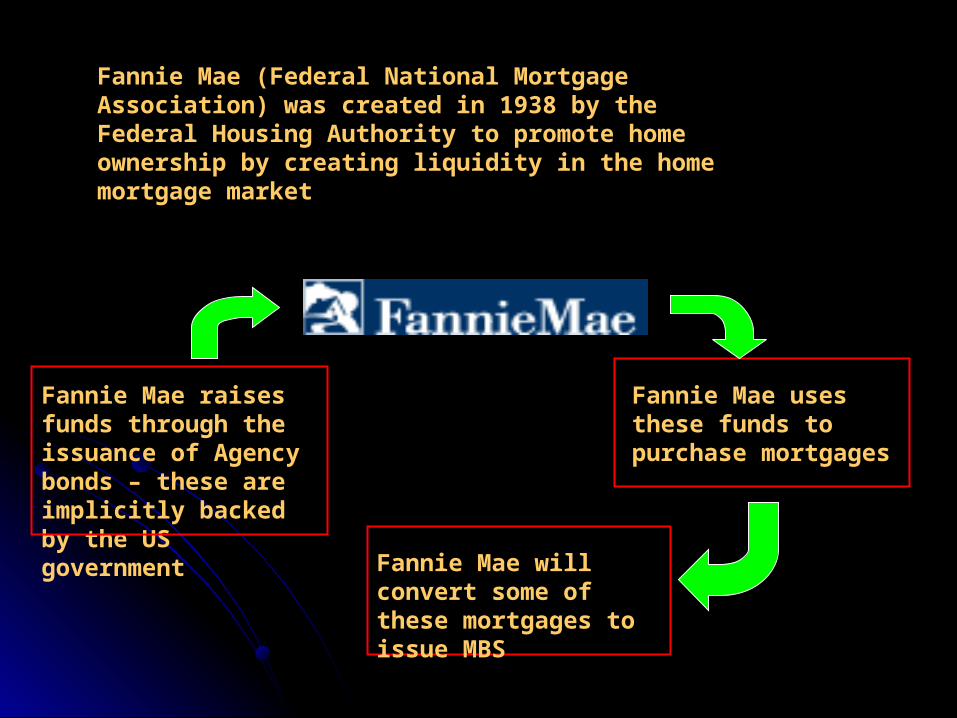
Fannie Mae (Federal National Mortgage Association) was created in 1938 by the Federal Housing Authority to promote home ownership by creating liquidity in the home mortgage market
Fannie Mae raises funds through the issuance of Agency bonds – these are implicitly backed by the US government
Fannie Mae uses these funds to purchase mortgages
Fannie Mae will convert some of these mortgages to issue MBS
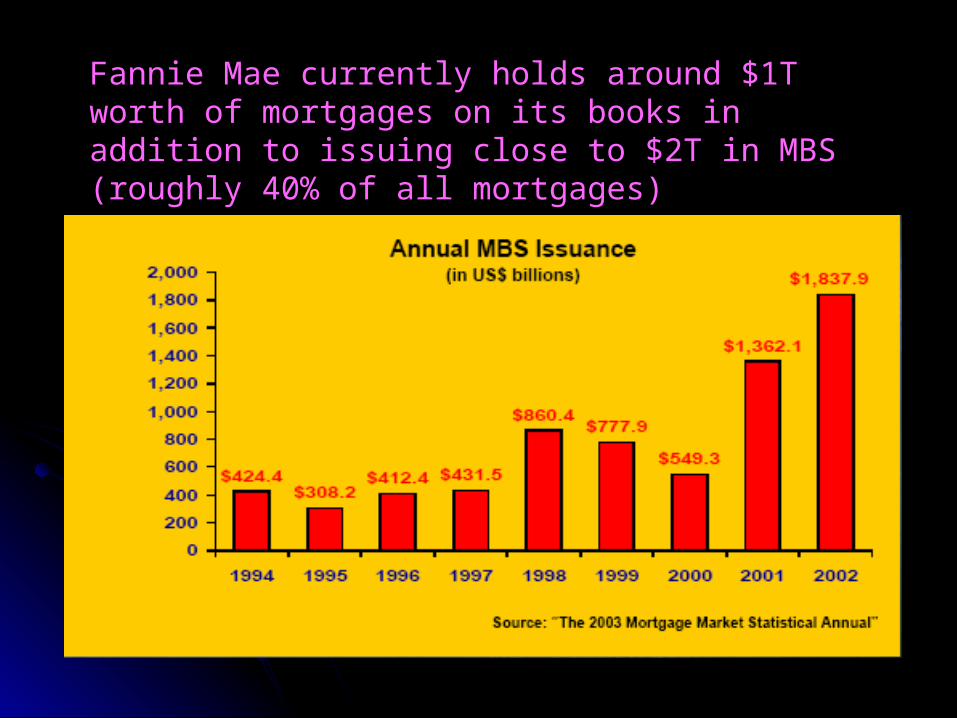
Fannie Mae currently holds around $1T worth of mortgages on its books in addition to issuing close to $2T in MBS (roughly 40% of all mortgages)
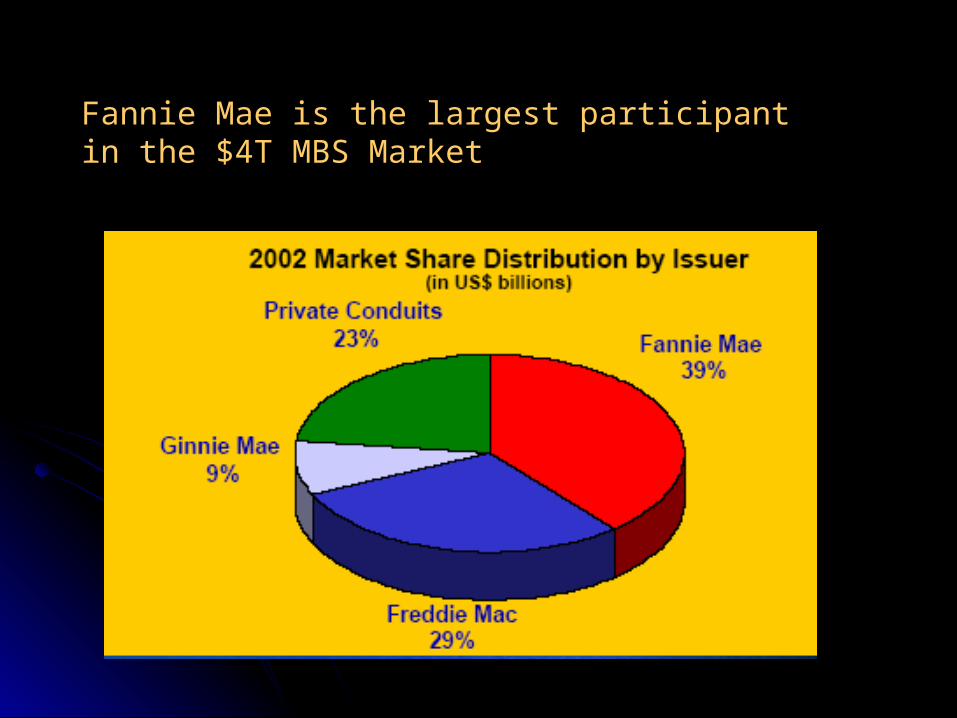
Fannie Mae is the largest participant in the $4T MBS Market
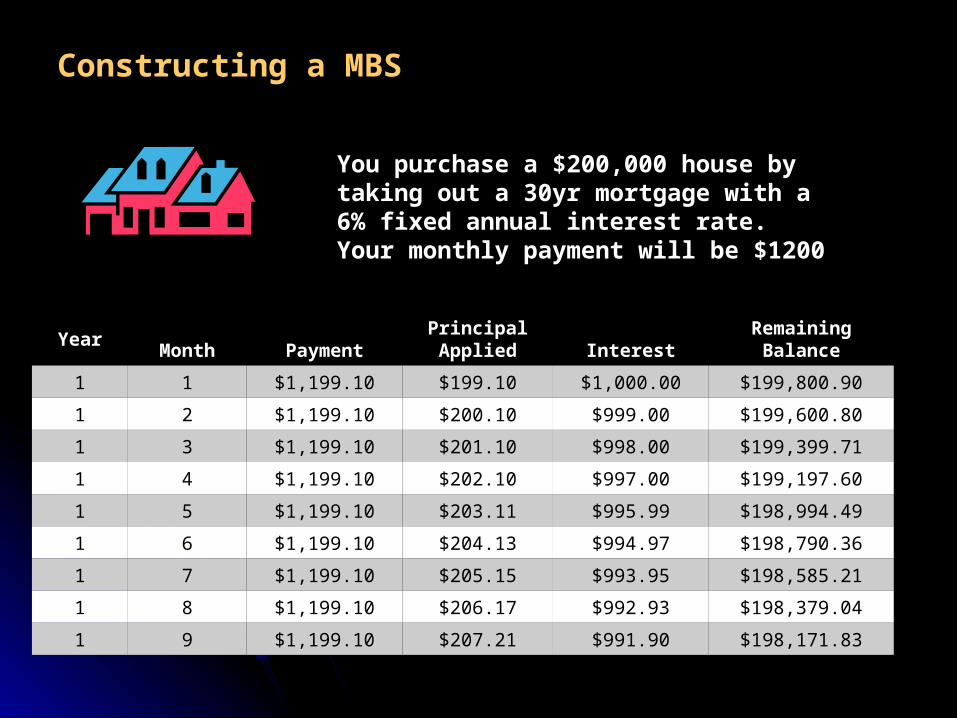
Constructing a MBS
You purchase a $200,000 house by taking out a 30yr mortgage with a 6% fixed annual interest rate. Your monthly payment will be $1200
YearMonth Payment
PrincipalApplied Interest
RemainingBalance
1 1 $1,199.10 $199.10 $1,000.00 $199,800.90
1 2 $1,199.10 $200.10 $999.00 $199,600.80
1 3 $1,199.10 $201.10 $998.00 $199,399.71
1 4 $1,199.10 $202.10 $997.00 $199,197.60
1 5 $1,199.10 $203.11 $995.99 $198,994.49
1 6 $1,199.10 $204.13 $994.97 $198,790.36
1 7 $1,199.10 $205.15 $993.95 $198,585.21
1 8 $1,199.10 $206.17 $992.93 $198,379.04
1 9 $1,199.10 $207.21 $991.90 $198,171.83
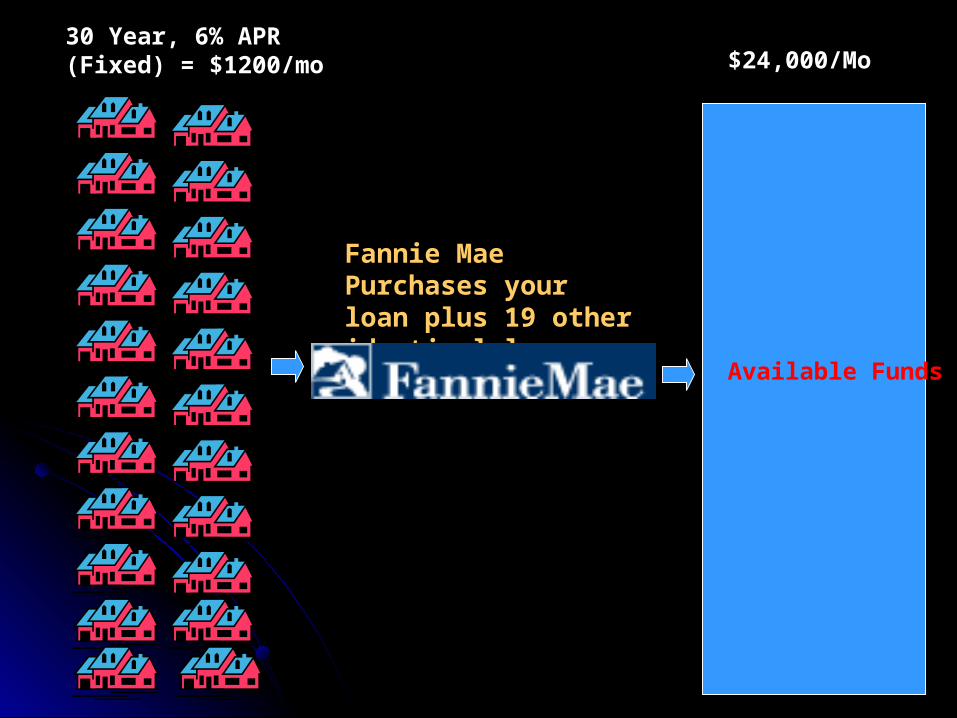
Fannie Mae Purchases your loan plus 19 other identical loans
30 Year, 6% APR (Fixed) = $1200/mo $24,000/Mo
Available Funds
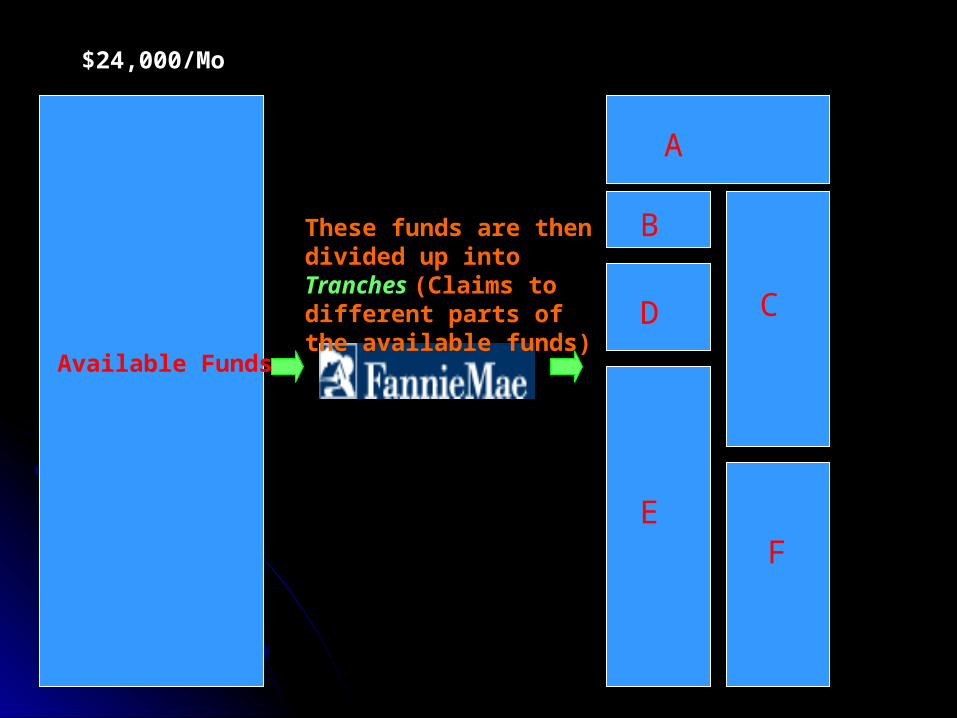
$24,000/Mo
Available Funds
These funds are then divided up into Tranches (Claims to different parts of the available funds)
A
B
CD
EF
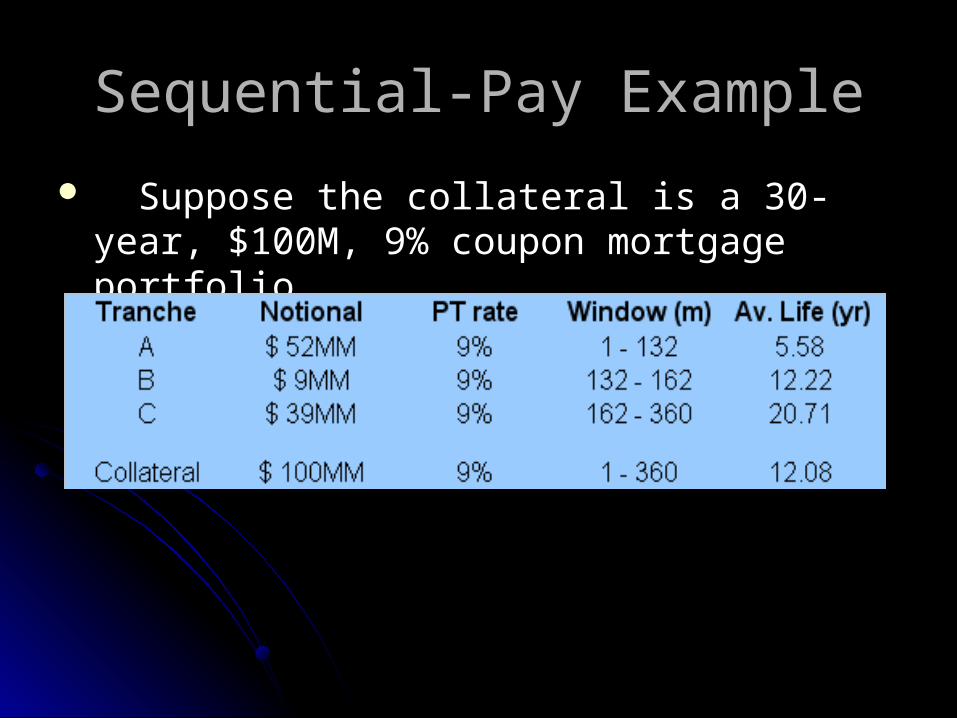
Sequential-Pay ExampleSequential-Pay Example
Suppose the collateral is a 30-year, $100M, Suppose the collateral is a 30-year, $100M, 9% coupon mortgage portfolio9% coupon mortgage portfolio
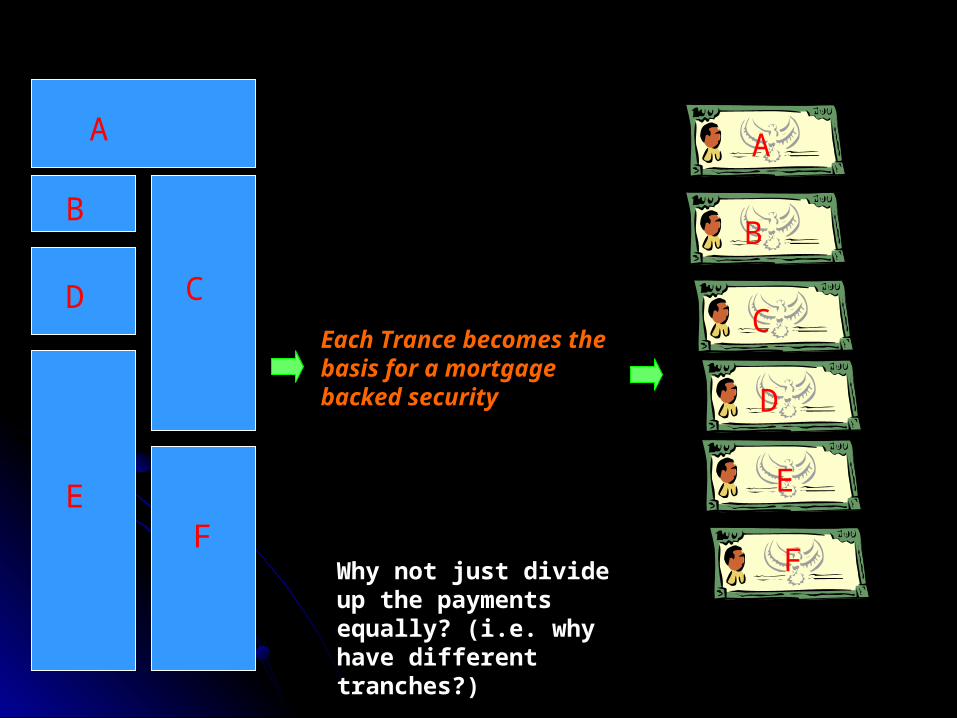
Each Trance becomes the basis for a mortgage backed security
A
B
CD
EF
Why not just divide up the payments equally? (i.e. why have different tranches?)
A
B
F
E
D
C
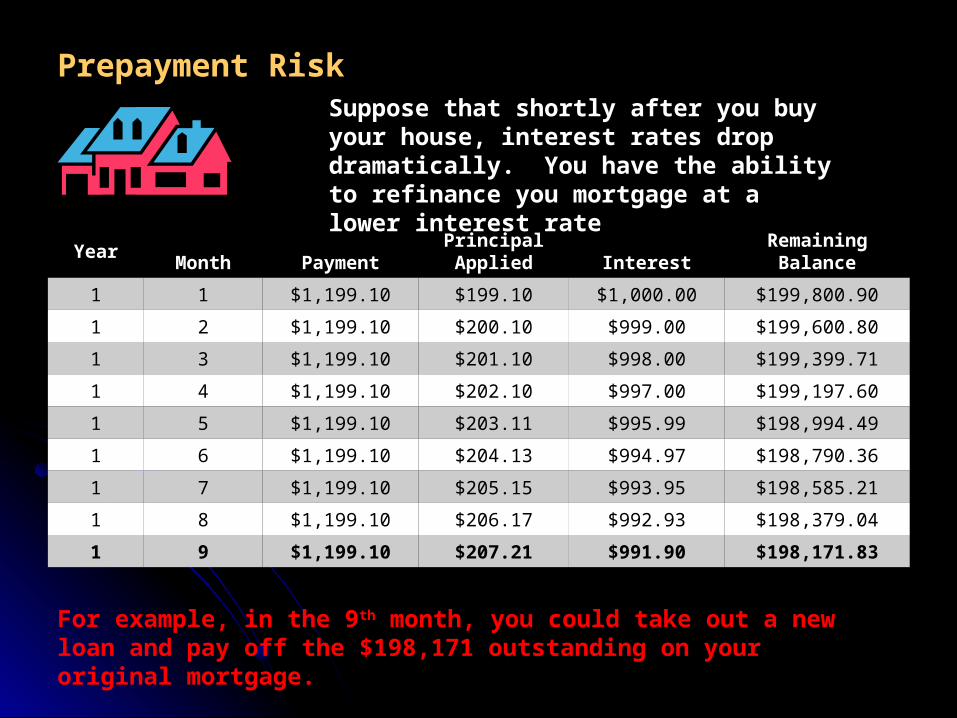
Prepayment RiskSuppose that shortly after you buy your house, interest rates drop dramatically. You have the ability to refinance you mortgage at a lower interest rate
YearMonth Payment
PrincipalApplied Interest
RemainingBalance
1 1 $1,199.10 $199.10 $1,000.00 $199,800.90
1 2 $1,199.10 $200.10 $999.00 $199,600.80
1 3 $1,199.10 $201.10 $998.00 $199,399.71
1 4 $1,199.10 $202.10 $997.00 $199,197.60
1 5 $1,199.10 $203.11 $995.99 $198,994.49
1 6 $1,199.10 $204.13 $994.97 $198,790.36
1 7 $1,199.10 $205.15 $993.95 $198,585.21
1 8 $1,199.10 $206.17 $992.93 $198,379.04
1 9 $1,199.10 $207.21 $991.90 $198,171.83
For example, in the 9th month, you could take out a new loan and pay off the $198,171 outstanding on your original mortgage.
0 360month
30
6.0
3.0
9.0
CPR (%)
100% PSA
50% PSA
150% PSA
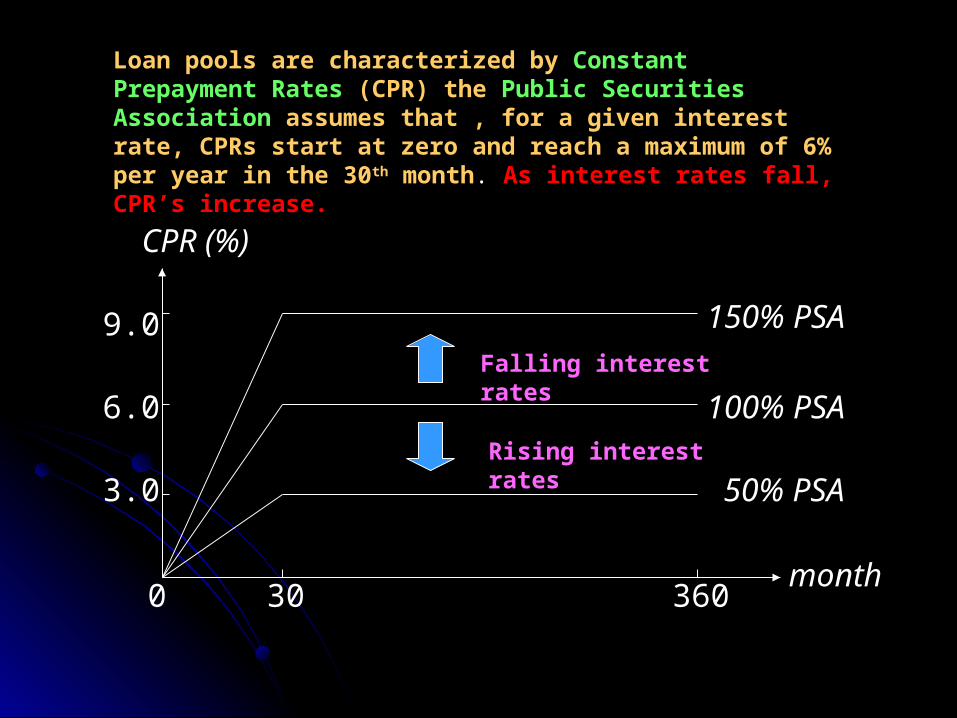
Loan pools are characterized by Constant Prepayment Rates (CPR) the Public Securities Association assumes that , for a given interest rate, CPRs start at zero and reach a maximum of 6% per year in the 30th month. As interest rates fall, CPR’s increase.
Rising interest rates
Falling interest rates
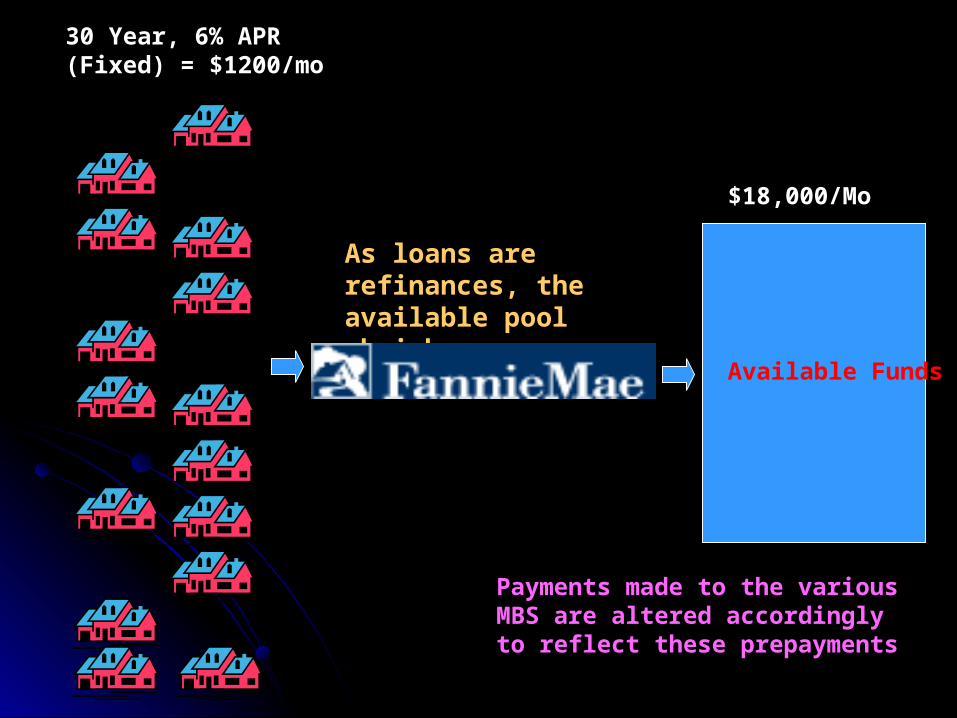
As loans are refinances, the available pool shrinks
30 Year, 6% APR (Fixed) = $1200/mo
$18,000/Mo
Available Funds
Payments made to the various MBS are altered accordingly to reflect these prepayments
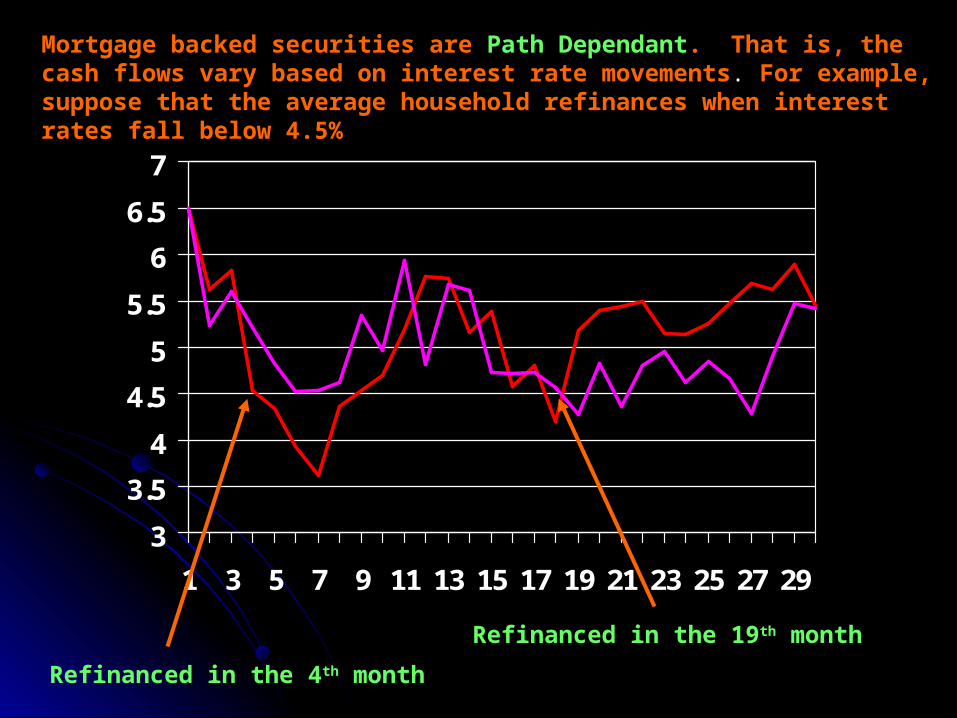
Mortgage backed securities are Path Dependant. That is, the cash flows vary based on interest rate movements. For example, suppose that the average household refinances when interest rates fall below 4.5%
3
3.5
4
4.5
5
5.5
6
6.5
7
1 3 5 7 9 11 13 15 17 19 21 23 25 27 29
Refinanced in the 4th month
Refinanced in the 19th month
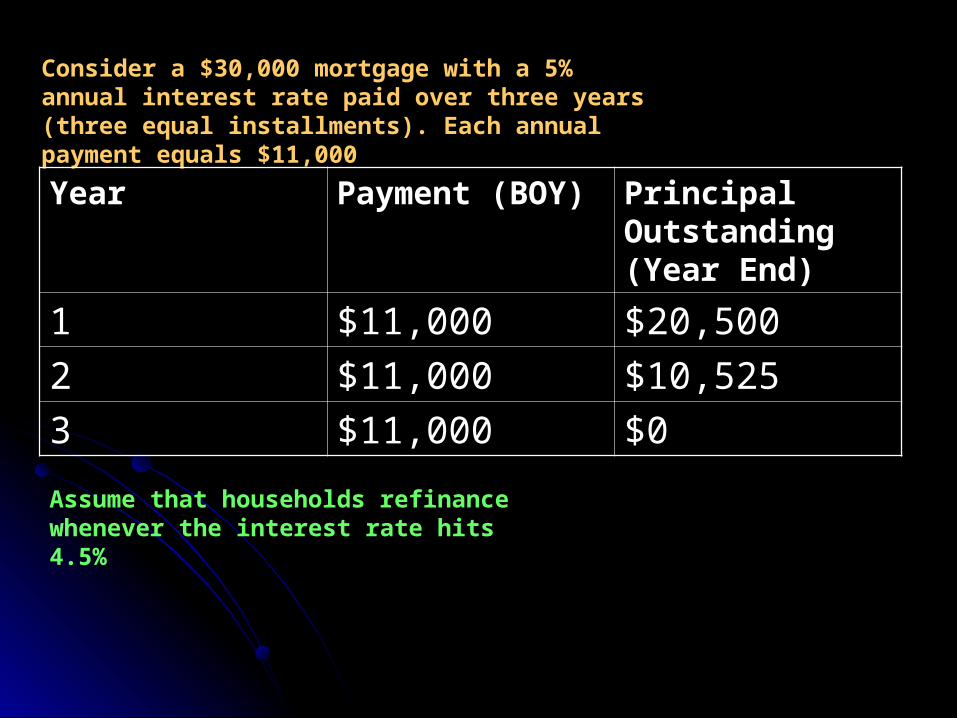
Consider a $30,000 mortgage with a 5% annual interest rate paid over three years (three equal installments). Each annual payment equals $11,000
YearYear Payment (BOY)Payment (BOY) Principal Principal Outstanding Outstanding (Year End)(Year End)
11 $11,000$11,000 $20,500$20,500
22 $11,000$11,000 $10,525$10,525
33 $11,000$11,000 $0$0
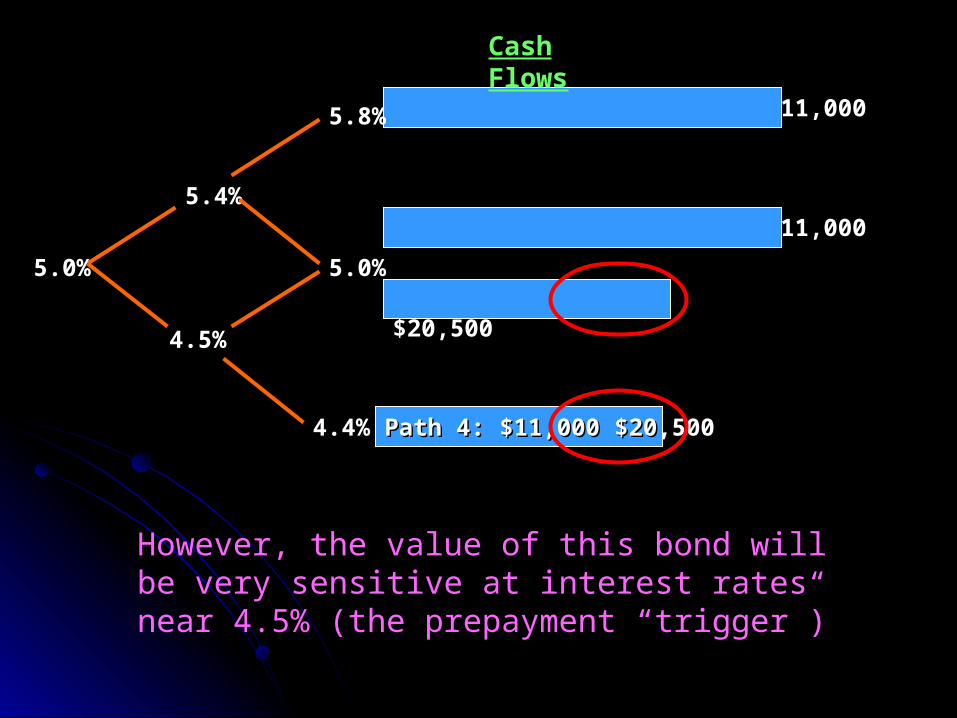
Assume that households refinance whenever the interest rate hits 4.5%
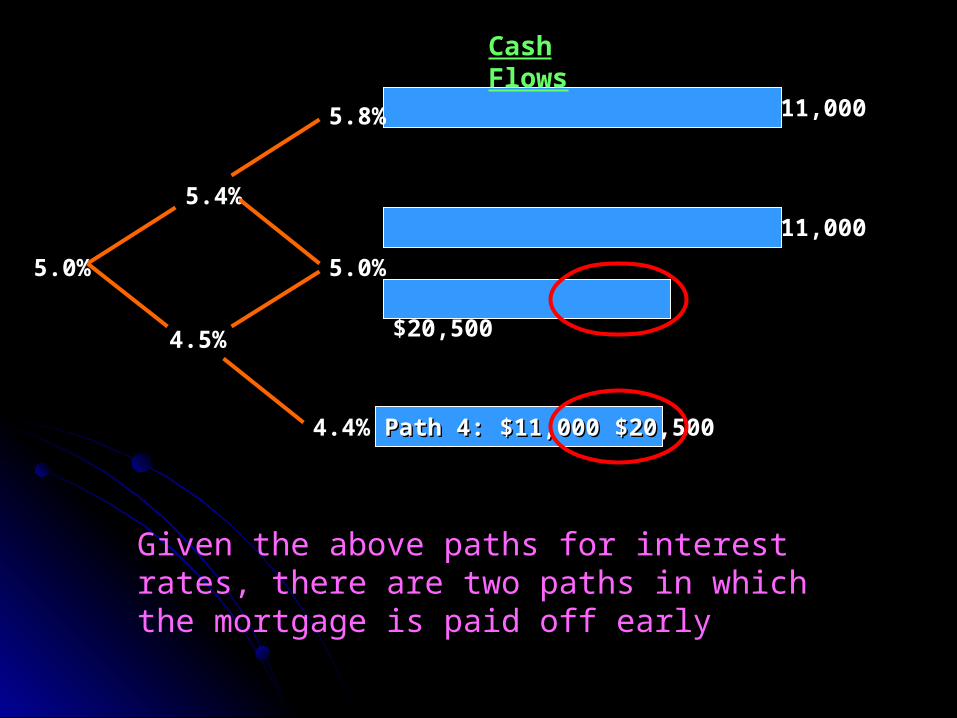
5.4%
5.0%
4.5%
Path 1: $11,000 $11,000 $11,000Path 1: $11,000 $11,000 $11,000
Path 2: $11,000 $11,000 $11,000Path 2: $11,000 $11,000 $11,000
4.4%
5.0%
5.8%
Path 3: $11,000 $20,500Path 3: $11,000 $20,500
Path 4: $11,000 $20,500Path 4: $11,000 $20,500
Cash Flows
Given the above paths for interest rates, there are two paths in which the mortgage is paid off early
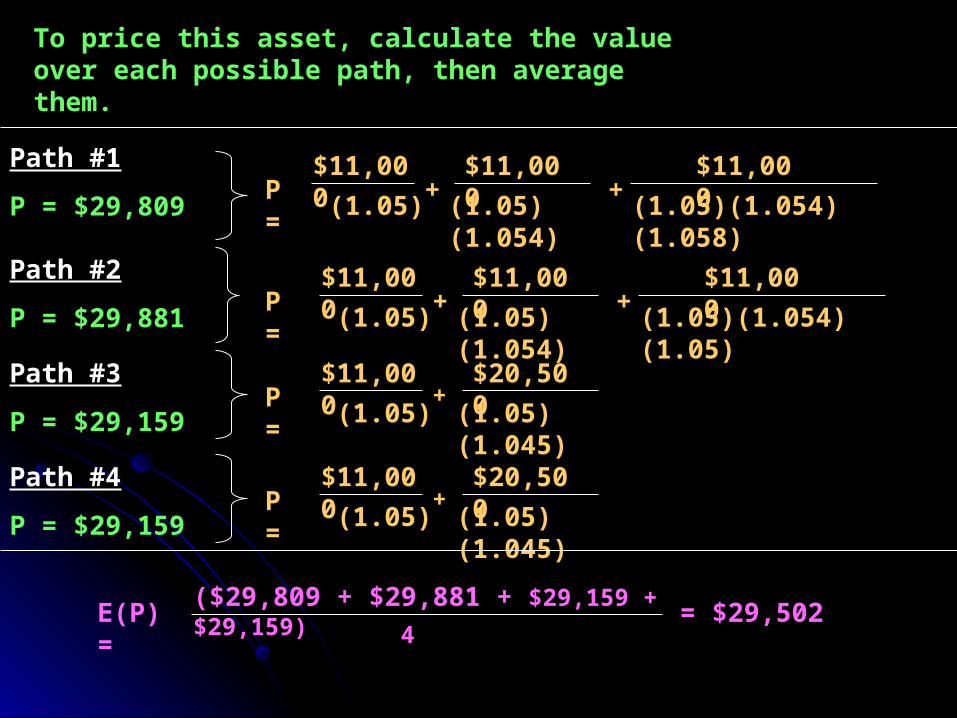
To price this asset, calculate the value over each possible path, then average them.
Path #1
P = $29,809
Path #2
P = $29,881
P = $11,000
(1.05)
($29,809 + $29,881 + $29,159 + $29,159)
Path #3
P = $29,159
Path #4
P = $29,159
$11,000
(1.05)(1.054)(1.058)
$11,000
(1.05)(1.054)+ +
P = $11,000
(1.05)
$11,000
(1.05)(1.054)(1.05)
$11,000
(1.05)(1.054)+ +
P = $11,000
(1.05)
$20,500
(1.05)(1.045)+
P = $11,000
(1.05)
$20,500
(1.05)(1.045)+
E(P) =4
= $29,502
Interest Rate RiskInterest Rate Risk
When the payments of an asset are When the payments of an asset are variable, how do we asses interest rate variable, how do we asses interest rate risk?risk?
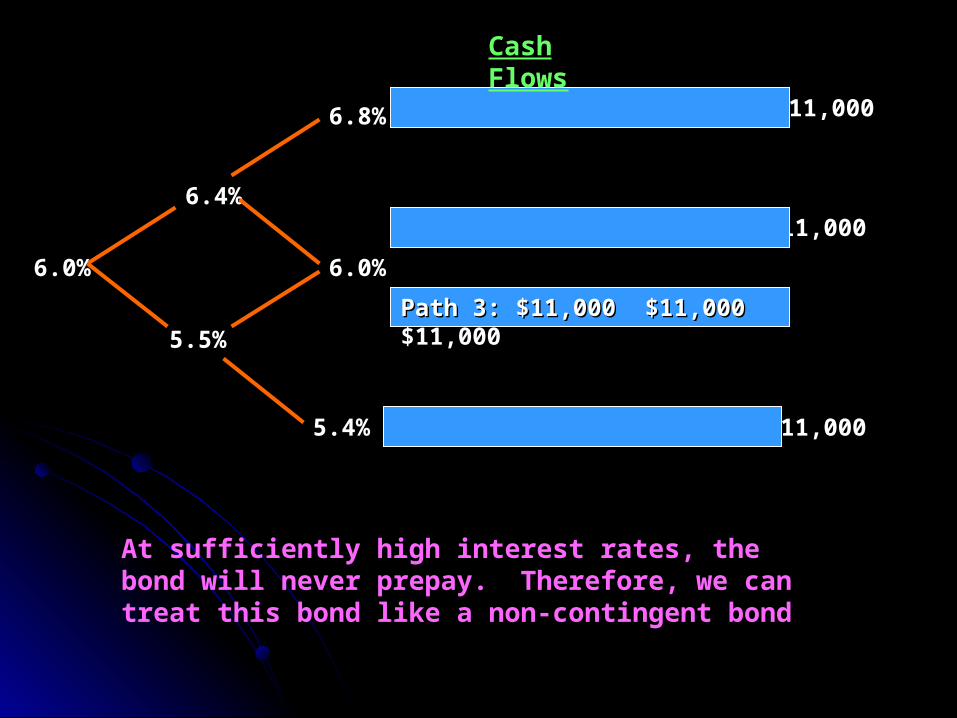
6.4%
6.0%
5.5%
Path 1: $11,000 $11,000 $11,000Path 1: $11,000 $11,000 $11,000
Path 2: $11,000 $11,000 $11,000Path 2: $11,000 $11,000 $11,000
5.4%
6.0%
6.8%
Cash Flows
At sufficiently high interest rates, the bond will never prepay. Therefore, we can treat this bond like a non-contingent bond
Path 3: $11,000 $11,000 $11,000Path 3: $11,000 $11,000 $11,000
Path 2: $11,000 $11,000 $11,000Path 2: $11,000 $11,000 $11,000
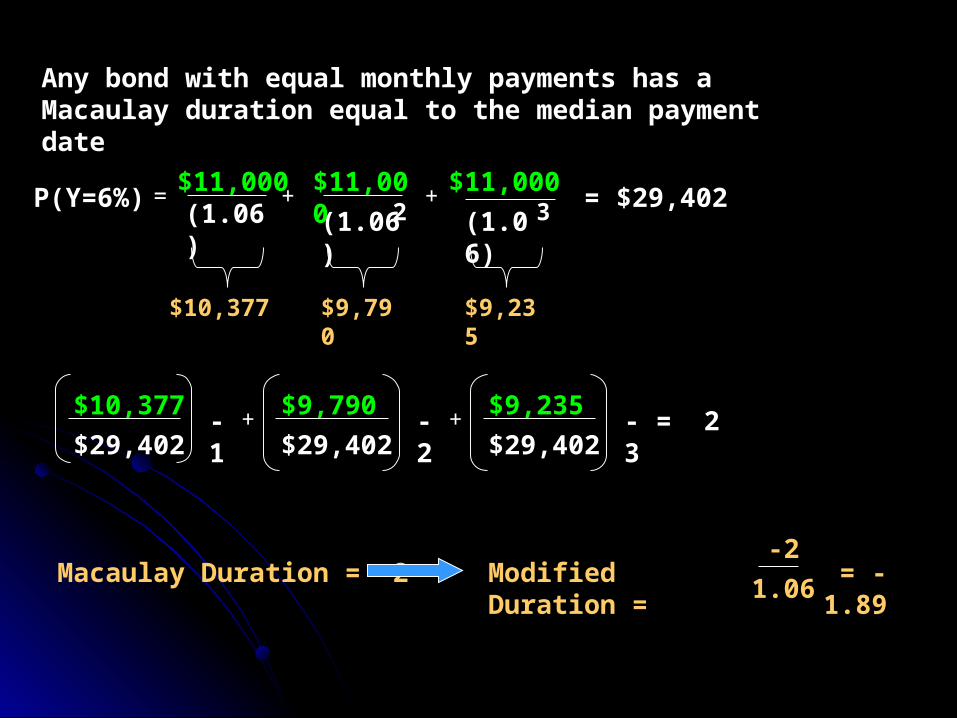
Any bond with equal monthly payments has a Macaulay duration equal to the median payment date
$11,000 $11,000$11,000= ++(1.06) (1.06) (1.06)2 3P(Y=6%) = $29,402
$10,377 $9,235$9,790
$10,377
$29,402+-1
Macaulay Duration = -2
$9,790
$29,402+-2
$9,235
$29,402= 2-3
Modified Duration =-2
1.06 = -1.89
5.4%
5.0%
4.5%
Path 1: $11,000 $11,000 $11,000Path 1: $11,000 $11,000 $11,000
Path 2: $11,000 $11,000 $11,000Path 2: $11,000 $11,000 $11,000
4.4%
5.0%
5.8%
Path 3: $11,000 $20,500Path 3: $11,000 $20,500
Path 4: $11,000 $20,500Path 4: $11,000 $20,500
Cash Flows
However, the value of this bond will be very sensitive at interest rates near 4.5% (the prepayment “trigger”)
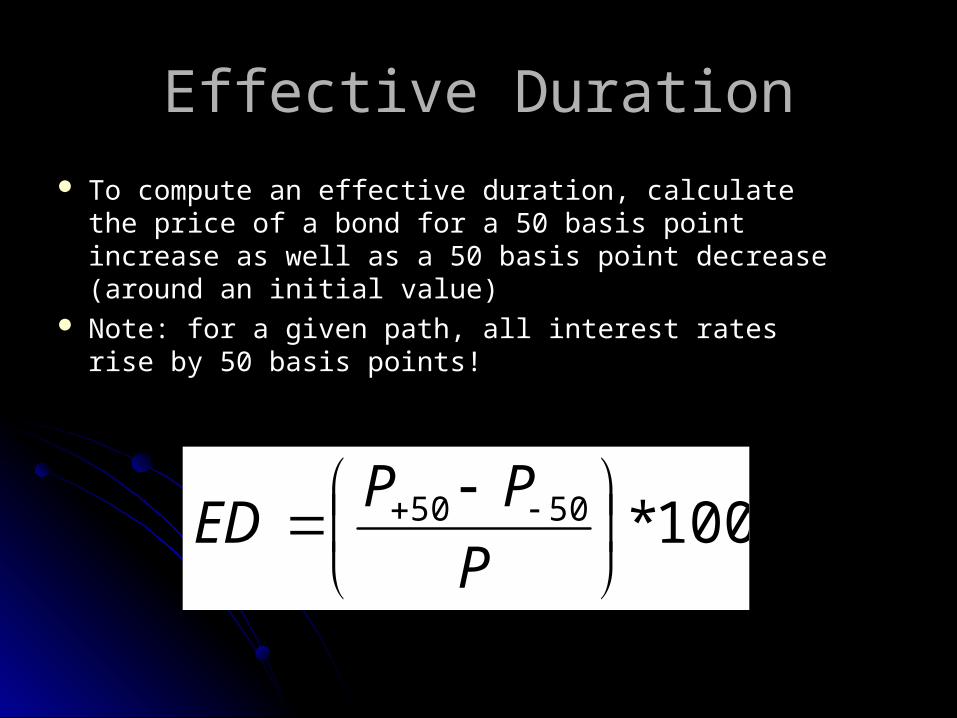
Effective DurationEffective Duration
To compute an effective duration, calculate the price To compute an effective duration, calculate the price of a bond for a 50 basis point increase as well as a 50 of a bond for a 50 basis point increase as well as a 50 basis point decrease (around an initial value)basis point decrease (around an initial value)
Note: for a given path, all interest rates rise by 50 Note: for a given path, all interest rates rise by 50 basis points!basis points!
100*5050
P
PPED
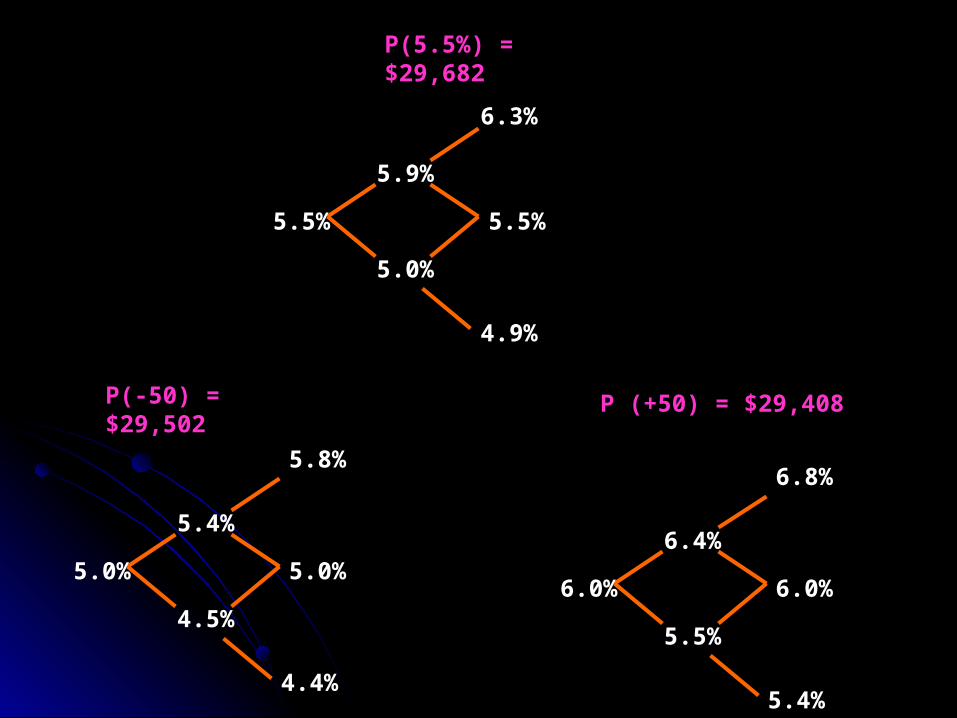
5.4%
5.0%
4.5%
4.4%
5.0%
5.8%
6.4%
6.0%
5.5%
5.4%
6.0%
6.8%
5.9%
5.5%
5.0%
4.9%
5.5%
6.3%
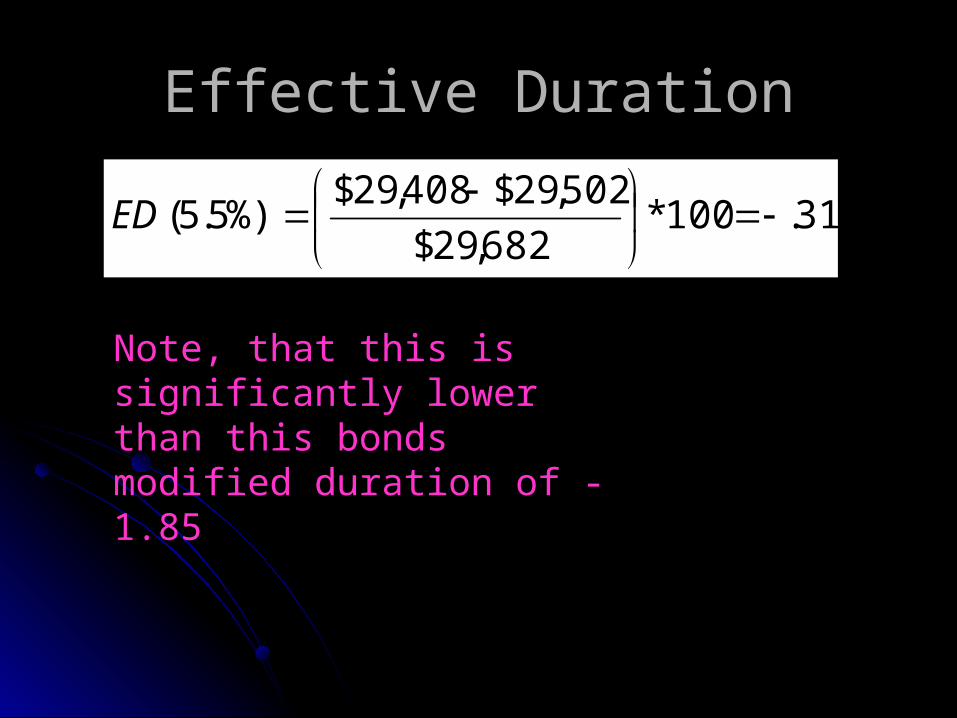
P(-50) = $29,502 P (+50) = $29,408
P(5.5%) = $29,682
Effective DurationEffective Duration
31.100*682,29$
502,29$408,29$%)5.5(
ED
Note, that this is significantly lower than this bonds modified duration of -1.85
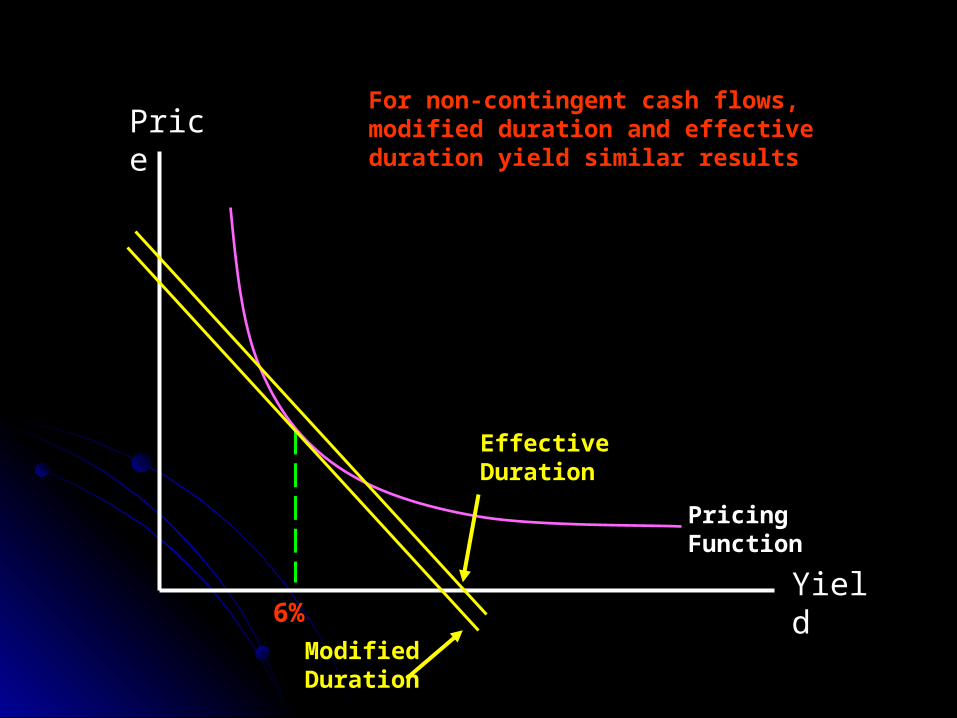
Price
Yield6%
Pricing Function
Modified Duration
Effective Duration
For non-contingent cash flows, modified duration and effective duration yield similar results
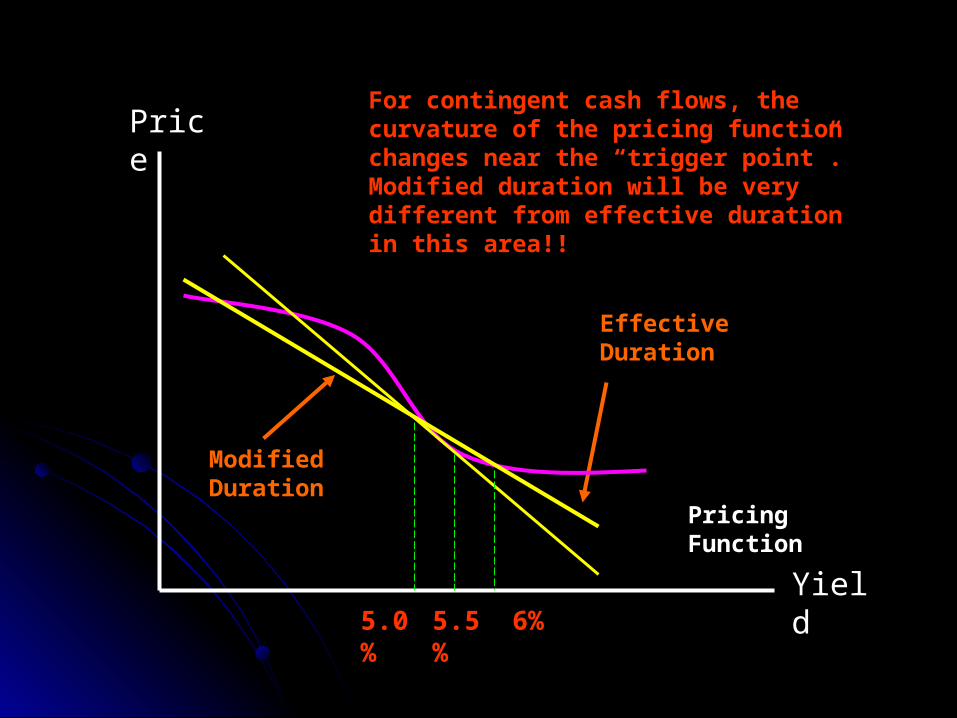
Price
Yield6%5.5%
Pricing Function
Modified Duration
Effective Duration
For contingent cash flows, the curvature of the pricing function changes near the “trigger point”. Modified duration will be very different from effective duration in this area!!
5.0%