Embed Size (px)
Citation preview

ISSN 1795-5300
MTT Discussion Papers 1 • 2009MTT Discussion Papers 1 • 2009
Valuing international marine resources: A meta-analysis
on the Baltic Sea
Heini Ahtiainen
MTT Discussion Papers 1 · 2009
Valuing international marine resources:
A meta-analysis on the Baltic Sea
Heini Ahtiainen
MTT Economic Research, Luutnantintie 13, 00410 Helsinki, Finland, [email protected]
Abstract
The study uses meta-analysis to provide insights into the value of international marine resources,
illustrating the issue with the case of the Baltic Sea. Willingness to pay for water quality
improvements varies systematically with factors such as a country’s income level, characteristics of
the change in water quality, water body type, study year and methodology. The results of the meta-
analysis are applied to benefit transfer in order to assess the distribution of the benefits of marine
protection measures between the Baltic Sea countries and to compare the results with previous
research. The net benefits of protecting the Baltic are positive, but they are asymmetrically
distributed between the littoral countries.
Key words: meta-analysis, water quality valuation, marine areas, the Baltic Sea
JEL Classification Codes: Q26, Q51

2
1 Introduction
Environmental valuation of water resources has been carried out for several decades,
and the results of these studies have recently been synthesized and summarized using
meta-analysis. This paper focuses on the value of internationally shared marine
resources. Previously, Johnston et al. (2006) have used meta-analysis to study the
willingness to pay for recreational fishing for both fresh and saltwater species. Our
approach to valuing marine amenities is wider in that it includes a variety of recreational
activities as well as the non-use values related to water quality in sea areas.
We use the Baltic Sea to illustrate the issues related to the valuation of international
marine ecosystems. The Baltic Sea is a small, brackish sea area in Northern Europe with
nine littoral countries. The state of the Baltic has been adversely affected by human
activities for several decades, and its protection has been called for on many occasions
(see e.g. Helcom 1974, 1988 and 2007). In practice, there are still no binding
agreements on the protection of the Baltic and the measures implemented have largely
been taken without cooperation among the littoral countries. Despite these efforts,
significant improvements have not been achieved, for example, in the case of
eutrophication.
Where protection of international marine resources is concerned, it is unlikely that
the costs and benefits will be symmetrically distributed between the countries involved.
As suggested in Turner et al. (1999), this applies also to the Baltic Sea, and some
countries will gain and some lose if they participate in joint actions to improve the state
of the sea area. The availability of cost and benefit estimates makes it possible to
determine the net benefits of different policies, which in turn is crucial for reaching
binding agreements on protection measures.
This paper explores the potential of meta-analysis to evaluate the benefits of
improving the state of internationally shared marine resources, illustrating the case with
the Baltic Sea. We explain the variation in willingness to pay for water quality and also
discuss how meta-analysis can be applied to benefit transfer to assess the distribution of
benefits between countries. The benefit estimates from the meta-analysis are compared
with the costs of protection measures to assess the net benefits of improving the state of
3
the Baltic Sea in terms of reduced eutrophication. The estimates are further compared
with the results from the Baltic Drainage Basin Project (Turner et al. 1999).
The present meta-analysis is novel in the sense that it focuses on internationally
shared marine resources and uses primarily European valuation studies. The case has
broader implications, as the approach employed here provides insights into the
applicability of international meta-analyses and can be used for other international
marine areas (e.g. the Mediterranean and the Black Sea).
The meta-analytic framework in the present study allows the inclusion of studies
that originate from several countries, use different valuation methods and focus on
different geographical areas. This implies a rather heterogeneous set of valuation
studies. Yet, the willingness to pay for water quality varies systematically according to
expectations. The income level of the focal country, represented by its gross domestic
product, has a significant effect on willingness to pay, allowing the assessment of
benefit distribution among the Baltic Sea countries. In addition, the water body type, the
study methodology and the year of the study affect the value of water quality changes.
Meta-analysis proves to be useful for discussing the value of an international good
and for providing a more comprehensive understanding of the benefits of improving the
state of a sea area in terms of the factors that affect willingness to pay for marine water
quality and the magnitude of the benefits. The distribution of the benefits of protecting
the Baltic is found to be asymmetric and to differ from that presented in the results of
the Baltic Drainage Basin Project (Turner et al. 1999), but the magnitude of total
benefits is in line with previous research. The aggregate net benefits of protecting the
Baltic Sea are estimated to be positive, an outcome providing an argument for the
continuation of protective actions.
The paper is organized as follows. Section 2 presents previous research and the
method and section 3 the data for the meta-analysis and how it was collected. Section 4
discusses the variables included in the meta-regression and the expectations regarding
their sign. The meta-regression models are presented in section 5 and the results in
section 6. Section 7 discusses a model application that uses meta-analysis to assess the
distribution of net benefits between the Baltic Sea countries and the comparison of
benefits with earlier results. Section 8 presents insights gained and policy implications.

4
2 Previous research and method
Previous economic studies on the Baltic Sea have focused primarily on evaluating the
costs and cost-effectiveness of protection measures in the international context (see e.g.
Gren, Elofsson and Jannke 1997; Ollikainen and Honkatukia 2001; Wulff et al. 2001;
Elofsson 2003; COWI 2007). The benefits of such measures have been estimated to a
lesser extent due to, for example, the difficulties associated with valuation and the
complications arising from the international dimension of the issues. The results of the
valuation studies and benefit transfers implemented in the Baltic Drainage Basin Project
constitute the only available Baltic-wide benefit estimates (see e.g. Gren, Söderqvist
and Wulff 1997; Turner et al. 1999 and Markowska and Zylicz 1999). In the project,
stated preference surveys were conducted in three Baltic Sea countries – Poland, Latvia
and Sweden – and the results were transferred to the other littoral countries1 to provide a
benefit estimate for the entire Baltic Sea region. However, the project results date back
to the mid-1990s and might thus be considered outdated, as some Baltic Sea countries
and their economies have undergone significant changes during the last decade.
Since the 1990s, no coordinated efforts have been undertaken to value the benefits
of water quality improvements and the distribution of those benefits for the entire Baltic
Sea region. What information is available is rather fragmented. Valuation studies on the
protection of the Baltic have lacked coordination and have typically been context-
specific, for example, focusing on single countries and limited geographical areas of the
Baltic Sea (see e.g. Frykblom 1998 or Atkins, Burdon and Allen 2007). The present
study uses meta-analysis to synthesize the existing information and to obtain a more
comprehensive understanding of the benefits of improving the state of the Baltic.
Meta-analysis refers to methods and techniques that review and summarize the
results of empirical studies. In the field of environmental valuation, meta-analysis is
used for three general purposes: research evaluation and synthesis, hypothesis testing
and benefit transfer (Smith and Pattanayak 2002, 277). Meta-regression is the
predominant method of analysis, allowing the examination of heterogeneity across
studies and the effects of explanatory variables on the value estimates. Meta-regression
can also be used to construct a benefit transfer function that provides an alternative to

5
the more common function-based transfer from a primary study (Stapler and Johnston
2009, 228).
Glass (1976) is typically credited with introducing meta-analysis to the social
sciences. The first applications in environmental valuation were conducted in the early
1990s (Smith and Kaoru 1990, Walsh, Johnson and McKean 1992). Since then, meta-
analyses of environmental amenities have covered a variety of topics, including air
quality (Smith and Huang 1995), outdoor recreation (Rosenberger and Loomis 2000),
threatened and endangered species (Loomis and White 1996), wetland services
(Brouwer et al. 1999; Woodward and Wui 2001; Brander, Florax and Vermaat 2006),
recreational fishing (Johnston et al. 2006) and pesticide risk exposure (Florax, Travisi
and Nijkamp 2005).
The increasing interest in benefit estimation and the infeasibility of conducting
primary studies has prompted a significant number of meta-analyses in the field of
environmental valuation. Previous meta-analyses have varied in the procedures used
and in quality, raising questions about the reliability of their results (Nelson and
Kennedy 2009). For example, the shortcomings criticized include differences in goods
valued and in valuation concepts and problems with econometric modeling.
Primary valuation studies have been used to investigate marine and coastal
amenities and their value as regards beach protection (Huang, Poor and Zhao 2007,
Whitehead et al. 2008) and marine protected areas (Wallmo and Edwards 2008). The
meta-analyses of water quality benefits have not, to the best of our knowledge, focused
on international marine resources. Previous meta-analyses have covered primarily
freshwaters, although estuaries have been included in addition to rivers and lakes.
Johnston, Besedin and Wardwell (2003) use meta-regression to model relationships
between non-use values for surface water quality improvements and several study-
specific attributes, and find a clear empirical relationship between use and non-use
values. Johnston et al. (2005) conduct a meta-analysis on aquatic resource
improvements to identify systematic patterns in willingness to pay and to evaluate the
challenges of using meta-analytic models for benefit transfer. Their results indicate that
the variation in willingness to pay can be successfully explained with meta-analysis but
that methodological variables pose challenges for the estimation and interpretation of
the results. Van Houtven, Powers and Pattanayak (2007) evaluate the results of stated
6
preference studies on water quality and put forward implications for benefit transfer and
policy analysis. They argue that meta-analysis provides a reasonable basis for predicting
willingness to pay for water quality changes but also highlight the limitations of the
method resulting from the unexplained variation in willingness to pay. Liu and Stern
(2008) conduct a meta-analysis of coastal and near-shore marine ecosystems and
include contingent valuation studies from throughout the world, although most of their
data comes from North America.
The earlier meta-analyses of water quality largely deal with the United States, and
we are aware of no published meta-analyses focusing mainly on European water quality
valuation studies. Most meta-analyses have also limited their scope to one country.
Examples of international meta-analyses are Lindhjem (2007), who summarizes the
existing valuation studies on non-timber benefits in Norway, Sweden and Finland, and
Jacobsen and Hanley (2008), who study the income effects on willingness to pay for
biodiversity. Our meta-analysis is novel in the sense that it focuses on internationally
shared marine resources and uses primarily European valuation studies. Another distinct
feature of our data is its heterogeneity, which derives from the need to include studies
from several countries and from the characteristics of the available valuation studies.
Since our data includes studies from several countries and we use benefit transfer to
predict country-specific benefits, we have to address issues similar to those encountered
in international benefit transfer. Using a set of studies from eight countries introduces
additional challenges compared to more common intra-country meta-analyses and
benefit transfers. Currency conversion and differences between countries and their
populations have to be taken into account. As transfer errors should intuitively be
smaller in cases where the sites and their surroundings are more similar, we may expect
that international benefit transfers produce higher errors than transfers within a country.
However, Ready and Navrud (2006, 433) observe that in general international benefit
transfer errors are similar to those found in intra-country transfers.
The empirical results on the performance of meta-analysis in international benefit
transfer are somewhat mixed. Shrestha and Loomis (2001) report an average error of
24-30% for international meta-analytic benefit transfer in the case of recreation values,
a range which they consider acceptable for many benefit transfer applications. Lindhjem
and Navrud (2008) assess the reliability of international value transfer for non-timber

7
benefits. They compare the transfer errors between different benefit transfer techniques
and conclude that meta-analytic transfers do not always outperform more simple
approaches. The mean transfer errors in their meta-analysis are between 47-126%
depending on the model used. We expect a similar error rate in the present case,
although the heterogeneity of the data might increase the size of the error.
3 Data selection
Our data complements a set of European valuation studies with research from the
United States and applies the findings to the Baltic Sea. Ideally, the data set should
include only studies that value water quality changes in sea areas. However, the small
number of direct marine studies (13 studies with 18 value estimates) does not make
thorough statistical analysis possible; accordingly, we have included studies that either
relate to the Baltic indirectly or deal with the drainage basin. The data encompasses not
only studies from the Baltic Sea countries, but also comparable research from the
United States, which has not previously been included in meta-analyses. The starting
point of the search for the primary studies was a review, which compiled information
about valuation studies on the Baltic Sea from the littoral countries (Söderqvist and
Hasselström 2008). The European data consists of those studies in the review that
address water quality. The studies from the United States have been found by
conducting exhaustive searches on travel costs studies valuing water quality.
The selection criteria for the data are the following. First, the focus of the study
needs to be water quality, not other water-related issues, such as beach protection or
visual disamenities from windmills. In the present case, water quality is defined broadly
to include effects from eutrophication, the state of fisheries and also other physical
factors. Second, the water quality change valued must affect recreational activities
and/or biodiversity in water ecosystems. In addition, it is essential that the description of
the change be detailed enough to connect it to a common metric, in this case the
percentual change in water quality. Third, the valuation methods are limited to stated
preference methods (contingent valuation and choice experiment) and the travel cost
method. Fourth, it is essential that the study report provide sufficient data for purposes
of the analysis.

8
The criteria for exclusion center on the availability of information from the study
reports. The studies that have been excluded do not provide a willingness to pay
estimate per person or per household (e.g. Sandström 1996, NAO 2007) and do not
contain sufficient information for computing these. The data includes both stated
preference and travel cost studies, although it has been argued that meta-analyses should
strive for consistency by only including studies that use comparable valuation concepts
(Smith and Pattanayak 2002, Nelson and Kennedy 2008). A counter-argument is
presented in Stapler and Johnston (2009, 235), who suggest that differences in welfare
estimates are less critical if the meta-regression can appropriately predict heterogeneous
welfare measures. Hedonic pricing studies have been excluded as they differ
considerably in their characteristics from stated preference and travel cost studies.
We include studies from both peer-reviewed publications and the “gray literature”,
which encompasses sources such as working papers, reports, master’s thesis and PhD
dissertations. As most of the valuation study reports on the Baltic Sea belong to the gray
literature, excluding these would have not been reasonable. It can also be argued that
unpublished studies may be as good as published ones (Lipsey and Wilson 2001, 19).
Including only published articles might also introduce a publication selection bias in the
results, which would reduce the validity and reliability of the meta-analysis for benefit
transfer (Rosenberger and Stanley 2006, 375).
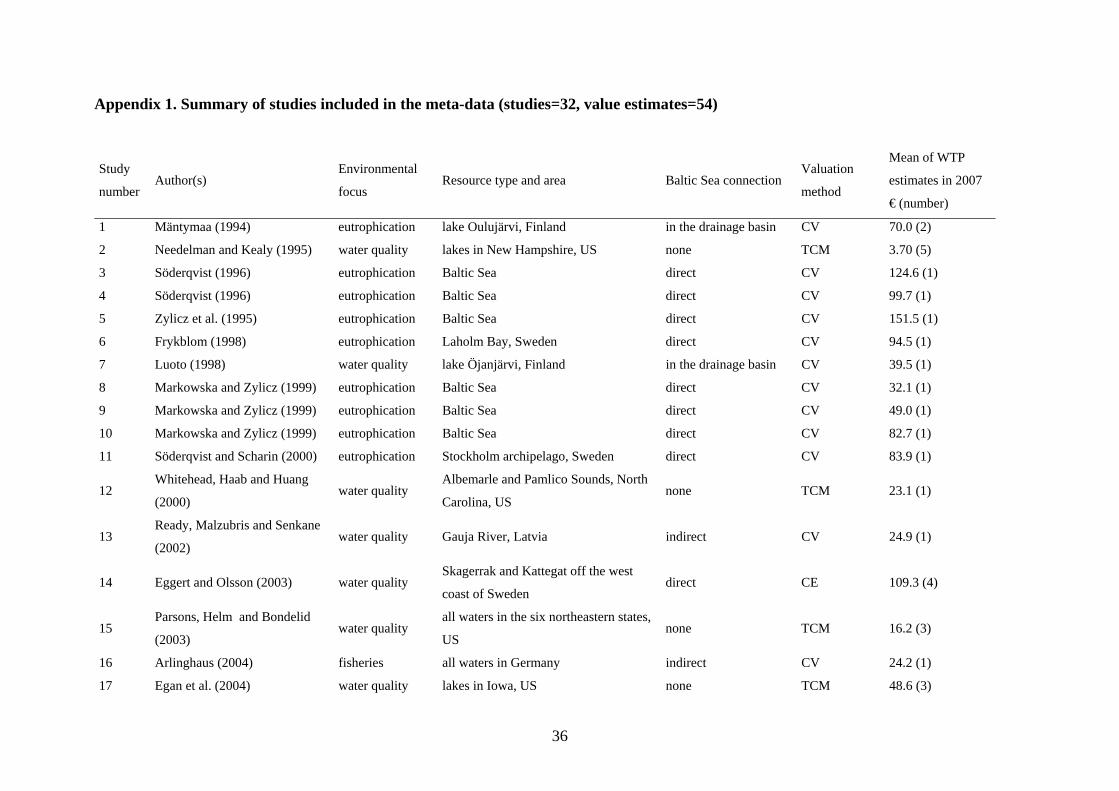
The final data consist of 32 studies and 54 observations (see Appendix 1). Some
authors recommend using only one value estimate per study (Lipsey and Wilson 2001,
113), but in the present case this approach would have led to a substantial reduction in
the sample size of the meta-analysis. In practice, it is more common to include several
estimates per study (see e.g. Van Houtven, Powers and Pattanayak 2007; Johnston et al.
2005). The most frequent reason for using multiple observations from a single study is
that the study provides value estimates for different water quality change scenarios
(Kosenius 2008, Vesterinen et al. 2008, Hasler et al. 2005, Egan et al. 2004, Eggert and
Olsson 2003, Parsons, Helm and Bondelid 2003, Needelman and Kealy 1995,
Mäntymaa 1993). Toivonen et al. (2004) include value estimates for several scenarios
and separately for three Nordic countries. Atkins and Burdon (2006) and Atkins,
Burdon and Allen (2007) both provide one estimate for the same scenario but use
distinct approaches.
9
If there are minor differences in statistical procedures that produce multiple mean
willingness to pay estimates from the same data, the estimates are averaged into a single
observation. It should also be noted that some study reports provide several value
estimates that are based on different samples and valuation approaches. These are
treated as separate observations. Roughly one-third of the studies provide one value
estimate and the remaining multiple estimates (not more than five). Table 1 summarizes
the features of the data, and the next section describes the variables used in the meta-
regression in detail.
[insert Table 1 here]
4 Variables and hypotheses
The meta-regression aims at explaining the variation in willingness to pay for water
quality changes through a set of explanatory variables. The range of possible variables
is large and the final set of variables has been chosen based on several factors. First,
theoretical assumptions and empirical results of prior meta-analyses have been
considered. Second, the purpose of using the meta-regression for predicting the
distribution of benefits between countries has affected the variable selection. The
availability of detailed information on the studies has also been decisive.
The dependent variable in all meta-regression models is willingness to pay for the
water quality change specified in the valuation study. Most value estimates have been
reported as annual willingness to pay per person and thus this has been chosen as the
base format. Household-specific willingness to pay estimates are divided by 2. To make
the willingness to pay estimates comparable, they are first converted to euros using the
Eurostat annual purchasing power parities (PPP) of the original country and Finland in
the year of the study. The resulting estimates are then adjusted to 2007 euros using
country-specific consumer price indices (CPI). Individual indices are employed for each
country as the rate of change in CPI differs significantly between countries. PPP is used
because it adjusts to differences in price levels between countries and thus measures the
differences in purchasing power more accurately than exchange rates do.
10
The distribution of the willingness to pay estimates is shown in Figure 1, and it has
a shape similar to that established in other meta-analyses (Lindhjem 2007, 259). The
mean annual willingness to pay for water quality based on the meta-data is 64.2€ per
person. The weighted mean, weighted by the number of observations, is similar, 62.9€
per person.
[insert Figure 1 here]
Meta-regression models typically include explanatory variables describing the
characteristics of the environmental good, the population studied, the methodology
used, the quality of the research and other study-specific features. The variables
ultimately included in the present meta-regressions are listed in Table 2. Most
explanatory variables are binary, meaning that they may take only the values 0 or 1.
[insert Table 2 here]
The first set of explanatory variables describes the valued environmental good: the
variables in the set pertain to the characteristics of the water quality change, the water
body type and the geographical scope of the good. The descriptions of the water quality
change are inherently diverse due to the heterogeneity of the studies. Our purpose is to
control the dissimilarities in the environmental good with a set of explanatory variables.
The extent of the change in water quality is captured with the variable WQCPERC. All
changes are converted to a common scale ranging from 25 to 230, which is based on the
percentual change in water quality. Some percentual changes were provided in the study
reports; others had to be inferred from the scenarios. Although we attempted to make
the magnitudes of the changes comparable, it is clear that there is room for
interpretation. A basic expectation derived from the economic theory is that people’s
willingness to pay should be responsive to the amount of the good provided: that is, the
willingness to pay estimates should be scope sensitive. Thus it is assumed that people
are willing to pay more for larger changes in water quality, whereby the sign of
WQCPERC is positive.

11
The dummy variable GAIN is included to indicate whether the study measures the
willingness to pay for an improvement in water quality or for preventing the quality
from deteriorating. The hypothesis here is that people value losses higher than gains and
the expected sign of GAIN is therefore negative (Tversky and Kahneman 1991 or
Kahneman, Knetsch and Thaler 1991).
The water quality change is further described by the variables EFFREC and
EFFBIO, which capture the dimensions of the good affected by the change. EFFREC
describes the changes that are specified as affecting recreation and EFFBIO those
affecting biodiversity or habitats. The expectation for both variables is that the sign will
be positive, although the relative magnitudes are unknown beforehand. Other variables
describing the water quality change, e.g. variables distinguishing changes that are
represented in terms of eutrophication, fisheries or water quality in general, were
included in the early stages of analysis, but they were not significant in explaining
willingness to pay for water quality.
It is interesting to investigate whether the water body type affects people’s
willingness to pay, especially as our focus is on marine ecosystems and assessing the
benefits of protecting the Baltic Sea. The dummy variables SEA, LAKE, RIVER AND
SOUND distinguish different water body types, with the base case being several
different water bodies. The variable SEA provides a convenient way of assessing the
magnitude of the value estimates for the Baltic Sea relative to other water bodies as all
these studies deal with the Baltic. There is no prior expectation regarding the sign of the
variables for water body type.
The geographical dimension of the good is captured with the dummy variable
REGLOC, which indicates whether the valued good is regional or local rather than
national. The expectation regarding the sign of REGLOC is ambivalent. The variable
can be thought to reflect the spatial scope of the water quality change and therefore have
a negative sign. On the other hand, it has been observed that people’s willingness to pay
decays with distance (Bateman et al. 2006), and thus local water quality improvements
may be valued higher per person than national ones.
An indicator for the income level is necessary for assessing the benefit distribution,
as the differences in mean willingness to pay between countries originate from the
differences in their income and wealth. The ideal indicator of income would be the

12
mean income of the study population, but this is seldom reported. Therefore GDP is
used as a proxy. In the present case, GDP gives the country’s gross domestic product in
purchasing power standards (PPS) for the year of the study. All GDPs are adjusted to
the year 2007 using country-specific consumer price indices. There are significant
differences in gross domestic product between the countries. Economic theory suggests
that willingness to pay is higher in countries with higher GDPs.
The third set of variables describes the methodology used. The valuation method is
captured with the dummies CE and TCM for choice experiment and travel cost method
respectively; the base case is contingent valuation. A previous meta-analysis has
indicated that travel cost studies produce higher value estimates than contingent
valuation studies do (Carson et al. 1996). Then again, as the travel cost method is
capable of measuring use value only, it can intuitively be expected to produce lower
willingness to pay estimates than stated preference methods if stated preference
methods are used to measure both use and non-use values. Moreover, the non-use value
component is likely to be substantial in the case of water ecosystems (Wilson and
Carpenter 1999, 779). There is no strong expectation concerning the use of the choice
experiment method compared to contingent valuation for the value estimates, as prior
results on the relationships between these methods have varied (see e.g. Adamovicz et
al. 1998; Hanley et al. 1998).
The final set of variables consists of the variables PUBLISH and YEAR. PUBLISH
is used as a proxy variable for study quality. The expected direction of the effect on
value estimates is unclear as prior results have been inconsistent. Rosenberger and
Stanley (2006) found that published estimates have been lower than unpublished
estimates in several meta-analyses of non-market valuation. On the other hand, in their
meta-analysis of water quality Van Houtven, Powers and Pattanayak (2007, 222) report
a positive and significant effect on value estimates for published studies.
The variable YEAR is included in the meta-regression to reveal whether there is a
systematic trend in willingness to pay over the years. The expected sign is ambivalent,
although prior meta-analyses of water quality have found a negative and significant
effect on willingness to pay estimates indicating that values for water quality have
declined over time (see e.g. Van Houtven, Powers and Pattanayak 2007 and Johnston et
al. 2005). One possible reason for the lower willingness to pay estimates in later studies
13
could be that improvements in survey design have reduced biases that previously led to
overestimating the true values (Johnston, Besedin and Wardwell 2003, 7).
The variables NUMOBS and ESTW are used as a combined weighting factor in the
meta-regression and they are described in detail in section 5.
5 Models
Previous meta-analyses of non-market valuation have employed various statistical
methods, and there is no consensus on the appropriate estimation technique for the
meta-regression model. However, the heteroskedasticity of the value estimate variances
and the correlation between studies need to be addressed in the analyzing stage. These
issues are taken into account by using weighted least squares and calculating
heteroskedasticity-consistent standard errors.
We present the meta-regression models for two data sets, the first of which
comprises all studies and the second of which only European studies. The European
subsample has the advantage of being more homogeneous than the overall sample but,
on the other hand, has substantially fewer observations, making statistical inferences
more challenging. The results for both full and restricted models are reported. There is
no standard for the functional form of the meta-regression model, and in the early stages
of the analysis three forms (linear, semi-log and log-linear) were used to assess the
robustness of the specifications. The results across these were rather similar, and the
linear specification was chosen, as it seems to provide the best fit to the data according
to the significance of the explanatory variables and the R2 and adjusted R2 statistics.
All regressions use weighted least squares (WLS). Two weighting factors are
combined in accordance with the approach set out by Van Houtven, Powers and
Pattanayak (2007). First, estimates that are based on larger sample sizes are more
precise and should therefore be given more weight (Lipsey and Wilson 2001, 36).
Ideally, we would weight each value estimate by the inverse of its variance. As standard
errors of willingness to pay estimates are generally not reported, we use the number of
observations as proxies for the variances. Thus each value estimate is weighted directly
using the number of observations (NUMOBS) that the calculation of the mean
willingness to pay estimate is based on. For example, if the value estimate is calculated
14
based on a sample of 400 respondents, the estimate is weighted directly with 400.
Second, the data contains value estimates that originate from the same study and use the
same sample population but differ in some other respect, typically the valuation
scenario. Ignoring this would give disproportionate weight to those studies that have
produced several value estimates. To address the issue, all observations are given a
weight that sums to one for a study (ESTW); that is, if a study has produced two
estimates, each is given a weight of 0.5. The combined weighting factor (CWEIGHT) is
the product of the two weights, NUMOBS and ESTW.
For all models, both WLS standard errors and White’s heteroskedasticity-consistent
standard errors are reported for comparison.
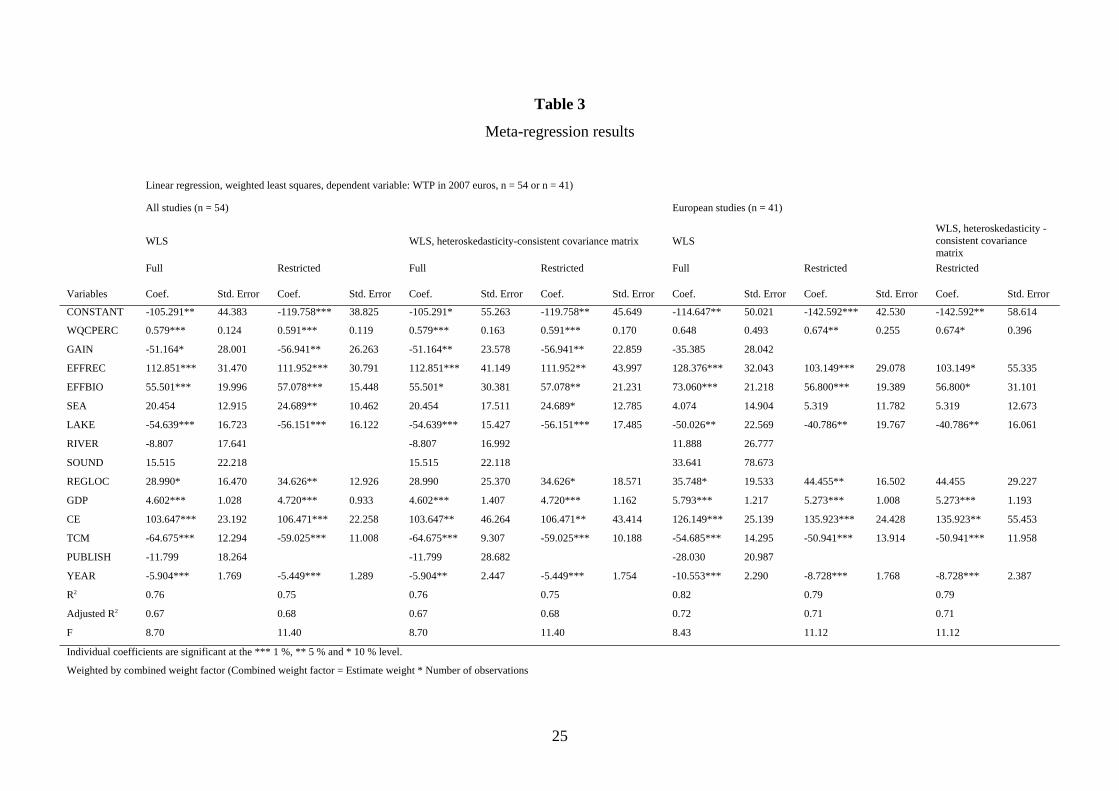
6 Meta-regression results
Table 3 reports the results of four different meta-regression models. Both full and
restricted models are reported for the whole data set (n = 54) and for the European data
set (n = 41). The full models include the variables that are of interest and that were
introduced in section 4. The restricted models exclude variables that are not statistically
significant in explaining willingness to pay estimates at the 0.10 level or less. However,
the variables describing the environmental change – WQCPERC, EFFREC and
EFFBIO – are retained in all models due to their importance. The variable SEA is
included in all models, as we are especially interested in its influence.
The results of the meta-regressions are fairly robust, as the signs and statistical
significances of the variables are consistent across specifications. Understandably, there
are differences in the magnitudes of the coefficients across the data sets. All models
give a reasonably good fit to the data, the R2 statistic being between 0.75-0.82 and
adjusted R2 statistics between 0.67-0.72. The variance inflation factors (VIF) were
examined to assess the extent of multicollinearity in the models. The higher the VIF, the
higher is the degree of multicollinearity. There is no common threshold for the
acceptability of the VIF; rather, several rules of thumb have been applied, the most
common being a VIF of 10 (O’Brien 2007, 673). In the full model, all variance inflation
factors are below 10. For the restricted models, the variance inflation factors are below
15
5 for all variables other than EFFBIO in both data sets and REGLOC in the European
data set.
The willingness to pay for water quality varies in systematic patterns according to
our expectations. Importantly, the results indicate that the variables describing the
change in water quality are statistically significant in determining the willingness to pay
estimates. The value estimates seem to be scope sensitive; that is, they increase as the
improvement in water quality increases. WQCPERC is positive and statistically
significant in all models but one.
The coefficient of GAIN is negative, as expected, but it is statistically significant
only in the models that include all studies. Thus, the variable has been excluded from
the restricted models in the European subsample. The variables describing the effects of
the water quality change, EFFREC and EFFBIO are positive and consistently
significant across the models. The coefficient of EFFREC is larger than that of EFFBIO,
indicating that changes that affect recreation are valued higher.
Water body type is found to affect willingness to pay, as the variable LAKE is
consistently negative and significant across specifications. Thus water quality changes
taking place in a lake or lakes are valued lower than those in other water bodies. The
coefficient of SEA is positive, but is statistically significant only in models that include
all studies. Other water body types (RIVER and SOUND) have no significant effect on
value estimates, and are excluded from the restricted models.
The geographical scope of the good is statistically significant in determining
willingness to pay for water quality, as the variable REGLOC is significant in most
models. The positive sign of the variable indicates that regional and local goods are
valued higher, a finding that may be a result of distance decay of values.
Our models indicate that the income variable, GDP, performs well. GDP is
significant and positive in all specifications, indicating that willingness to pay for water
quality is higher in countries that have higher gross domestic products. This result is
important, as it argues for using the variable in assessing the distribution of the benefits
of protection measures among the Baltic Sea countries.
The study methodology is also significant in determining water quality values.
Choice experiments produce higher willingness to pay estimates than contingent
valuation, as CE is consistently positive and significant across specifications. In contrast
16
to prior findings, travel cost studies seem to give lower value estimates for water
quality. The coefficient of TCM is negative and significant in all models.
The variable reflecting study quality, PUBLISH, is not statistically significant in
explaining willingness to pay and has been excluded from the restricted models. Thus,
our results do not indicate significant differences in willingness to pay estimates
between peer-reviewed and other types of study reports. This is promising, as the
majority of our observations come from sources other than peer-reviewed journals.
The year of the study also affects water quality values, as the variable YEAR is
statistically significant in all specifications. The sign is consistently negative, indicating
that recent valuation studies have produced lower willingness to pay values for water
quality. There are many possible reasons for this trend: it may reflect the change in
environmental attitudes over time or stem from the degradation in the state of the Baltic
Sea and other water bodies. Another could be the progress in valuation methodologies
which has led to lower estimates.
[insert Table 3 here]
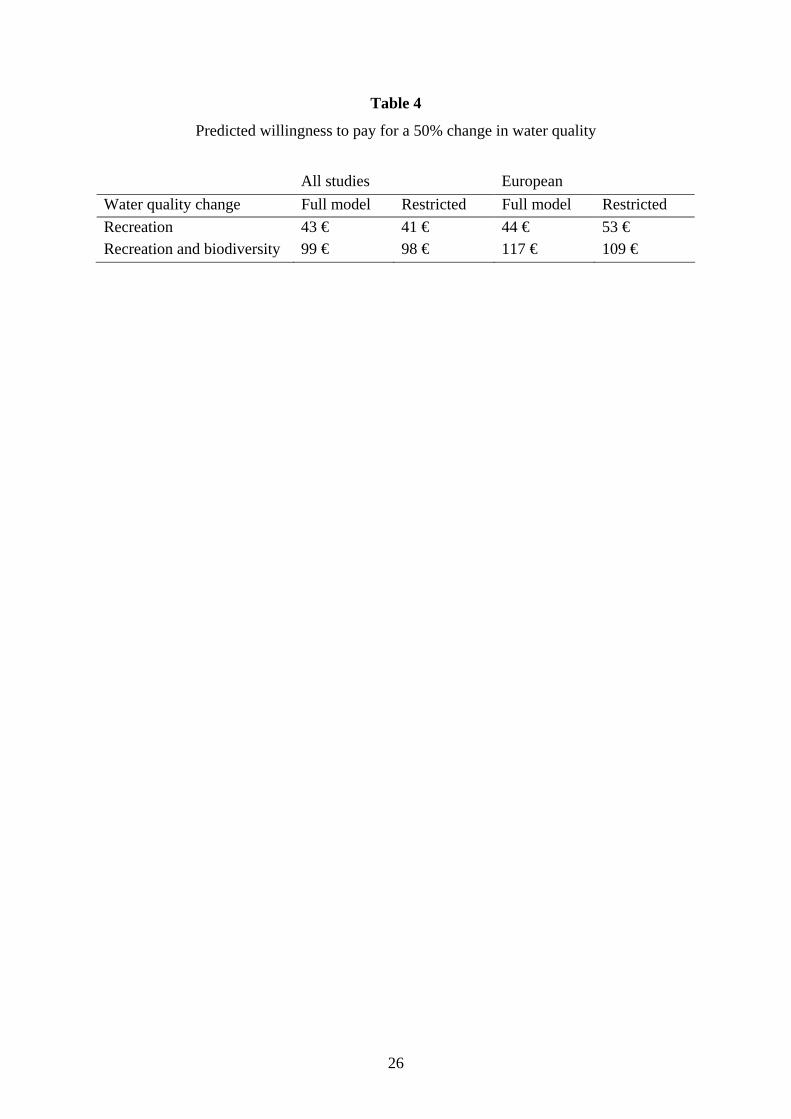
The meta-regression allows predicting the willingness to pay for specific water
quality change scenarios. Table 4 presents benefit estimates for a 50% change in water
quality affecting either recreation or both recreation and biodiversity. Other variables
are set to their mean values. We use both data sets and calculate the estimates for the
full and restricted models to compare the willingness to pay estimates.
The willingness to pay estimates are close to each other in the full and the restricted
models for the full data set. The European subset produces somewhat higher estimates,
but in any case the order of magnitude is similar between all models. The annual mean
willingness to pay estimates per person range from 41€ to 53€ for a change that affects
only recreation to 98€ to 117€ for a change that affects both recreation and biodiversity.
Our results are similar in magnitude to those of other meta-analyses of water quality.
Van Houtven, Powers and Pattanayak (2007) report annual willingness to pay estimates
of $24-93 for a medium-sized change in water quality.
[insert Table 4 here]
17
7 Application to assess the benefits for the Baltic Sea
The meta-regression makes it possible to assess the benefits of improving the state of
the Baltic Sea. In addition, it is possible to calculate the distribution of the benefits
between the littoral countries and to compare the benefits with the costs of protection
measures. However, the limitations and drawbacks of the method should be borne in
mind. Benefit transfers derived from meta-analyses have been found to produce transfer
errors and, given the heterogeneity of our data set, the predicted benefit estimates
should be considered only indicative of the value of protecting the Baltic Sea. On the
other hand, no up-to-date estimates based on primary valuation studies for each Baltic
Sea country are available: the existing results date from the mid-1990s and are for the
most part based on benefit transfer.
We estimate both the benefits and net benefits of improving the state of the Baltic
Sea and compare them with the results of the Baltic Drainage Basin Project (Turner et
al. 1999). Calculating the net benefits requires updated information on both benefits and
costs. To make our approach comparable with that in previous studies, we focus on
eutrophication, which is considered the most serious environmental problem in the
Baltic, and use the same costs as in the Drainage Basin Project (Turner et al. 1999). The
population figures for each country represent the share of the adult population living in
the drainage basin (Söderqvist and Hasselström 2008). The costs evaluated in the
Drainage Basin Project were calculated for a 50% reduction in the total nutrient load
flowing into the Baltic Sea. These costs have been adjusted using purchasing power
parities and country-specific consumer price indices to reflect 2007 euros.
The benefit figures for the Baltic Drainage Basin Project are from Söderqvist and
Hasselström (2008), where updated estimates for the benefits are presented. They use
data on income elasticity of willingness to pay, growth in gross domestic product per
capita and consumer price indices to adjust the estimates. Söderqvist and Hasselström
(2008) report the benefits in 2005 euros, and we adjust them further with country-
specific consumer price indices to the year 2007. The population figures and the
distribution of costs, benefits and net benefits among the Baltic Sea countries according
to the Baltic Drainage Basin Project are presented in Table 5. The variation in benefits

18
between countries reflects the differences in population size and in mean willingness to
pay estimates.
The estimates of the benefits derived from the meta-analysis have been calculated
using the full model with a data set that includes all studies. The advantages of using the
complete data set are that it is based on more observations and produces more
conservative estimates compared to the European subsample. The water quality change
is specified as a 50% improvement and as affecting both recreation and biodiversity.
The benefits are estimated for a change that takes place in a sea area. The other water
body type variables are set to zero. Country-specific GDPs are used to evaluate the
mean willingness to pay for each country. Other variables (YEAR, PUBLISH, CE,
TCM and REGLOC) are set to their mean values. Table 6 presents the country-specific
mean willingness to pay estimates, benefits and net benefits based on the meta-analysis.
The population figures and costs are identical to those in Table 5. Here, the variation in
mean willingness to pay between countries results from the differences in the countries’
GDPs and as before, the benefits vary due to different population sizes.
[insert Table 5 and Table 6 here]
The aggregate benefit estimates of the Baltic Drainage Basin Project and the meta-
analysis are very similar, both being approximately MEUR 5000 per year. Although
total benefits are similar, the distribution of the benefits between countries differs. In
general, the meta-regression predicts lower benefits for Denmark, Finland, Germany
and Sweden and higher benefits for Estonia, Latvia, Lithuania, Poland and Russia.
Contrary to the Baltic Drainage Basin Project results, Germany is now a net loser and
Poland a net winner. Overall, both approaches predict positive total net benefits (around
MEUR 870 per year) and thus suggest that measures should be implemented to reduce
eutrophication in the Baltic Sea.
In the Baltic Drainage Basin Project the benefits are estimated for a plan that
decreases eutrophication to a sustainable level, and Turner et al. (1999) note the
difficulty in relating the outcome in the valuation scenario to a specific nutrient load
reduction. This reflects a common problem in comparing benefits from valuation
studies with costs. It is generally very challenging to link the benefit estimates directly

19
to ecological indicators, such as nutrient loads. Additional complications arise because
the benefit estimates are inherently subjective as opposed to the cost measures, which
are typically assumed objective.
The comparison of the estimates from the Drainage Basin Project and the meta-
analysis reveals that the benefits of protecting the Baltic Sea are distributed differently
according to the results of these studies. This is interesting from the viewpoint of
international negotiations, as net benefits are decisive in determining countries’
incentives to adhere to international agreements on protecting shared marine areas.
Although total net benefits from the protection measures will be positive, some
countries will have to bear costs that are higher than their anticipated gain, and these
countries may thus be reluctant to participate in common actions. In this situation,
binding agreements are difficult to reach. However, the positive aggregate net benefits
noted would allow for compensation to be paid between countries, which might
facilitate the conclusion of international agreements on the protection of the Baltic Sea.
8 Conclusions and discussion
Information on the benefits of protecting water bodies is in general fragmented, and this
applies also to the Baltic Sea. Meta-analysis can be used to summarize existing
information in order to attain a more comprehensive understanding of the value of
environmental amenities. Our study represents an attempt to illustrate the potential of
meta-analysis in assessing internationally shared marine resources. We also present up-
to-date estimates of the benefits of protecting the Baltic Sea and their distribution
among the countries involved.
Meta-analysis proves to be useful in assessing the benefits of improvements in
water quality also in the case of internationally shared marine resources. In the present
study, it has revealed systematic and consistent patterns in willingness to pay for water
quality. Value estimates are higher for larger changes in water quality and sensitive to
the amenities affected. There is a positive and highly significant relationship between a
country’s GDP and willingness to pay for water quality, a finding that argues for the
estimation of country-specific benefits. More recent studies have in general yielded
lower values for water quality. The valuation method also affects willingness to pay, as
20
choice experiments give higher and travel cost method lower estimates than contingent
valuation.
The predicted mean annual willingness to pay per person for a 50% water quality
change ranges from 40€ to 120€, depending on the dimensions of the good that are
affected. In comparison to the results of the Baltic Drainage Basin Project, the present
meta-analysis predicts similar aggregate benefits for improvements in the state of the
Baltic Sea. The total net benefits are estimated to be positive. The results also indicate
that the distribution of the net benefits is somewhat different than reported in earlier
studies, which is important, as it is net benefits in particular that are decisive in
prompting countries to enter into international agreements.
The main limitation of the present meta-analysis is the heterogeneity of the data,
particularly regards to the descriptions of the change in the environmental good. The
studies, although having a common focus on water quality, value diverse changes,
which has complicated expressing them on a comparable scale. Differing approaches in
describing the good being valued between studies is a frequent problem in
environmental valuation as there are no common standards. The variation in practices
complicates comparisons between valuation studies and also diminishes the reliability
of meta-analyses of environmental valuation.
Another limitation stems also from the characteristics of the valuation studies. At
present, it is difficult to link the benefit estimates to ecological indicators and therefore
to the costs of protection measures. Thus the benefits obtained from valuation studies
and the estimated costs are typically not directly comparable. Using such ecological
indicators for water quality as nutrient levels, state of fish stocks and sight depth is
possible, but in any case it is not evident how people perceive the improvements in
terms of the indicators. Thus one of the objectives of future research should be on
identifying suitable indicators for monetary valuation which can easily be connected to
cost estimates.
The results of the meta-analysis with regard to benefit transfer and the assessment
of benefit distribution are subject to transfer errors, which might be exacerbated by the
heterogeneity of our data. On the other hand, we have compiled valuation information
from a range of studies and included estimates from several countries to increase the
reliability of our results. Moreover, separate benefit estimates do not exist for each of

21
the Baltic Sea countries, which makes the use of benefit transfers compelling if we want
to estimate the Baltic-wide benefits. As uncertainties related to the benefit estimates
remain, further studies are needed to provide more accurate information on the country-
specific benefits of protecting the Baltic Sea.
Footnotes
1 The littoral countries are Denmark, Estonia, Finland, Germany, Latvia, Lithuania,
Poland, Sweden and Russia.

22
Figure 1. Distribution of willingness to pay estimates (€/person)

23
Table 1
Summary statistics for the meta-data
Studies (n=32) Value estimates (n= 54)
Number Percent Number Percent
Type of publication Journal article 11 34.4 % 19 35.2 %
Working/discussion paper 8 25.0 % 17 31.5 %
Report 9 28.1 % 14 25.9 %
PhD/master’s thesis 4 12.5 % 4 7.4 %
Year of publication
1990 - 1999 10 31.3 % 15 27.8 %
2000 - 22 68.8 % 39 72.2 %
Country
Denmark 3 9.4 % 6 11.1 %
Finland 9 28.1 % 16 29.6 %
Germany 1 3.1 % 1 1.9 %
Latvia 2 6.3 % 2 3.7 %
Lithuania 2 6.3 % 2 3.7 %
Poland 3 9.4 % 3 5.6 %
Sweden 7 21.9 % 11 20.4 %
United States 5 15.6 % 13 24.1 %
Type of water body affected
Sea (area) 13 40.6 % 18 33.3 %
Lake(s) 5 15.6 % 12 22.2 %
River(s) 4 12.5 % 4 7.4 %
Several types of water bodies 8 25.0 % 17 31.5 %
Other (sounds, estuaries) 2 6.3 % 3 5.6 %
Geographic extent of change
National 13 40.6 % 22 40.7 %
Local/regional 19 59.4 % 32 59.3 %
Connection to the Baltic Sea
Direct 13 40.6 % 18 33.3 %
Indirect 8 25.0 % 15 27.8 %
Drainage basin 6 18.8 % 8 14.8 %
None 5 15.6 % 13 24.1 %
Focus of the study
Eutrophication 16 50.0 % 24 44.4 %
Fisheries 5 15.6 % 8 14.8 %
Oil spills 1 3.1 % 1 1.9 %
Water quality in general 10 31.3 % 21 38.9 %
Valuation method
Contingent valuation (CV) 22 68.8 % 27 50.0 %
Choice experiment (CE) 3 9.4 % 9 16.7 %
Travel cost method (TCM) 6 18.8 % 17 31.5 %
Other (combined CV and TCM) 1 3.1 % 1 1.9 %

24
Table 2
Variables and summary statistics (for all studies)
Variable Description Mean Std
deviation Min Max
WTP PPP and country-specific CPI-adjusted annual
willingness to pay per person (in 2007 euros)
64.2 56.4 0.1 237.0
NUMOBS Number of observations, continuous 789 779 40 3340
ESTW Estimate weight; sums to one for a study 0.59 0.33 0.20 1.00
CWEIGHT Combined weight factor, = Estimate weight *
Number of observations
469.77 590.46 40.00 3340.00
WQCPERC Percentual change in water quality, continuous 56.3 43.3 25.0 230.0
GAIN 1 if WTP is asked for an improvement in water
quality, 0 if it is asked to prevent deterioration
0.89 0.32 0 1
EFFREC 1 if the water quality change has an effect on
recreation, 0 otherwise
0.93 0.26 0 1
EFFBIO 1 if the water quality change has an effect on
biodiversity or habitats, 0 otherwise
0.43 0.50 0 1
SEA 1 if the water body is a sea area, 0 otherwise 0.33 0.48 0 1
LAKE 1 if the water body is a lake or lakes, 0 otherwise 0.22 0.42 0 1
RIVER 1 if the water body is a river or rivers, 0 otherwise 0.07 0.26 0 1
SOUND 1 if the water body is a sound or an estuary, 0
otherwise
0.06 0.23 0 1
REGLOC 1 if the good is regional or local, 0 if it is national 0.56 0.50 0 1
GDP Country’s gross domestic product in PPS in the study
year, in thousands of 2007 euros, continuous
25.28 6.68 6.90 35.70
CE 1 if choice experiment, 0 otherwise 0.17 0.38 0 1
TCM 1 if travel cost method, 0 otherwise 0.31 0.47 0 1
PUBLISH 1 if the study was published in a peer-reviewed
journal , 0 otherwise
0.39 0.49 0 1
YEAR Study year (minus 1988), continuous 10.65 5.25 1 20
25
Table 3
Meta-regression results
Linear regression, weighted least squares, dependent variable: WTP in 2007 euros, n = 54 or n = 41)
All studies (n = 54) European studies (n = 41)
WLS WLS, heteroskedasticity-consistent covariance matrix WLS WLS, heteroskedasticity -consistent covariance matrix
Full Restricted Full Restricted Full Restricted Restricted
Variables Coef. Std. Error Coef. Std. Error Coef. Std. Error Coef. Std. Error Coef. Std. Error Coef. Std. Error Coef. Std. Error
CONSTANT -105.291** 44.383 -119.758*** 38.825 -105.291* 55.263 -119.758** 45.649 -114.647** 50.021 -142.592*** 42.530 -142.592** 58.614
WQCPERC 0.579*** 0.124 0.591*** 0.119 0.579*** 0.163 0.591*** 0.170 0.648 0.493 0.674** 0.255 0.674* 0.396
GAIN -51.164* 28.001 -56.941** 26.263 -51.164** 23.578 -56.941** 22.859 -35.385 28.042
EFFREC 112.851*** 31.470 111.952*** 30.791 112.851*** 41.149 111.952** 43.997 128.376*** 32.043 103.149*** 29.078 103.149* 55.335
EFFBIO 55.501*** 19.996 57.078*** 15.448 55.501* 30.381 57.078** 21.231 73.060*** 21.218 56.800*** 19.389 56.800* 31.101
SEA 20.454 12.915 24.689** 10.462 20.454 17.511 24.689* 12.785 4.074 14.904 5.319 11.782 5.319 12.673
LAKE -54.639*** 16.723 -56.151*** 16.122 -54.639*** 15.427 -56.151*** 17.485 -50.026** 22.569 -40.786** 19.767 -40.786** 16.061
RIVER -8.807 17.641 -8.807 16.992 11.888 26.777
SOUND 15.515 22.218 15.515 22.118 33.641 78.673
REGLOC 28.990* 16.470 34.626** 12.926 28.990 25.370 34.626* 18.571 35.748* 19.533 44.455** 16.502 44.455 29.227
GDP 4.602*** 1.028 4.720*** 0.933 4.602*** 1.407 4.720*** 1.162 5.793*** 1.217 5.273*** 1.008 5.273*** 1.193
CE 103.647*** 23.192 106.471*** 22.258 103.647** 46.264 106.471** 43.414 126.149*** 25.139 135.923*** 24.428 135.923** 55.453
TCM -64.675*** 12.294 -59.025*** 11.008 -64.675*** 9.307 -59.025*** 10.188 -54.685*** 14.295 -50.941*** 13.914 -50.941*** 11.958
PUBLISH -11.799 18.264 -11.799 28.682 -28.030 20.987
YEAR -5.904*** 1.769 -5.449*** 1.289 -5.904** 2.447 -5.449*** 1.754 -10.553*** 2.290 -8.728*** 1.768 -8.728*** 2.387
R2 0.76 0.75 0.76 0.75 0.82 0.79 0.79
Adjusted R2 0.67 0.68 0.67 0.68 0.72 0.71 0.71
F 8.70 11.40 8.70 11.40 8.43 11.12 11.12
Individual coefficients are significant at the *** 1 %, ** 5 % and * 10 % level.
Weighted by combined weight factor (Combined weight factor = Estimate weight * Number of observations
26
Table 4
Predicted willingness to pay for a 50% change in water quality
All studies European
Water quality change Full model Restricted Full model Restricted
Recreation 43 € 41 € 44 € 53 € Recreation and biodiversity 99 € 98 € 117 € 109 €

27
Table 5
Distribution of benefits according to the Baltic Drainage Basin Project
Country Population
(in millions)a
Costs per
year (millions
of 2007
euros)b
Benefits per
year (millions
of 2007
euros)
Net benefits
(millions of
2007 euros)
Denmark 3.58 373 952 579
Estonia 1.05 228 67 -161
Finland 3.86 348 628 280
Germany 2.45 495 552 57
Latvia 1.78 286 70 -215
Lithuania 2.42 307 88 -219
Poland 25.85 1357 966 -391
Russia 7.01 114 197 83
Sweden 6.78 653 1507 854
Total 54.78 4160 5027 867 a Population figures are the same as in Söderqvist and Hasselström (2008) b Costs are updated from Turner et al. (1999)

28
Table 6
Distribution of benefits based on meta-regression
Country Annual mean
willingness
to pay per
person (2007
euros)
Benefits per
year
(millions of
2007 euros)
Net benefits
per year
(millions of
2007 euros)
Denmark 147 527 154
Estonia 89 93 -135
Finland 141 544 197
Germany 137 335 -160
Latvia 74 132 -154
Lithuania 78 188 -119
Poland 69 1778 422
Russia 58 408 294
Sweden 151 1026 373
Total 5030 871

29
References
Adamovicz, W., Boxall, P., Williams, M. and Louviere, J. 1998. Stated Preference
Approaches for Measuring Passive Use Values: Choice Experiments and Contingent
Valuation. American Journal of Agricultural Economics 80:64-75.
Ahtiainen, H. 2007. Willingness to pay for improvements in the oil spill response capacity in
the Gulf of Finland – an application of the contingent valuation method. Master's thesis,
University of Helsinki.
Ahtiainen, H. 2008. Järven tilan parantamisen hyödyt – esimerkkinä Hiidenvesi [Benefits of
lake water quality improvement. A case study of Lake Hiidenvesi]. The Finnish
Environment 47/2008, Finnish Environment Institute.
Arlinghaus, R. 2004. Angelfischerei in Deutschland - eine soziale und ökonomische Analyse.
[Recreational fishing in Germany – a social and economic analysis]. Berichte des IGB,
Institute for Freshwater Ecology and Fisheries, Heft 18/2004.
www.igb-berlin.de/abt4/mitarbeiter/arlinghaus/download/Angeln_in_Deutschland.pdf
Atkins, J. P. and Burdon, D. 2006. An initial economic evaluation of water quality
improvements in the Randers Fjord, Denmark. Marine Pollution Bulletin 53:195-204.
Atkins, J. P., Burdon, D. and Allen, J. H. 2007. An application of contingent valuation and
decision tree analysis to water quality improvements. Marine Pollution Bulletin 55:591-
602.
Bateman, I. J., Day, B. H. Georgiou, S. and Lake, I. 2006. The aggregation of environmental
benefit values: Welfare measures, distance decay and total WTP. Ecological Economics
60:450-460.
Brander, L. M., Florax, R. J. G. M. and Vermaat, J. E. 2006. The Empirics of Wetland
Valuation: A Comprehensive Summary and a Meta-Analysis of the Literature.
Environmental and Resource Economics 33:223-250.
Brouwer, R., Langford, I. H., Bateman I. J. and Turner, R. K. 1999. A meta-analysis of
wetland contingent valuation studies. Regional Environmental Change 1:47-57.
Carson, R. T., Flores, N. E., Martin, K. M. and Wright, J. L. 1996. Contingent Valuation and
Revealed Preference Methodologies: Comparing the Estimates for Quasi-Public Goods.
Land Economics 72(1):80-99.
COWI 2007. Economics analysis of the BSAP with focus on eutrophication. Final report.
30
Egan, K. J., Herriger, J. A., Kling, C. L. and Downing, J. A. 2004. Recreation demand using
physical measures of water quality. Working Paper 04-WP 372. Center for Agricultural and
Rural Development, Iowa State University, US.
Eggert, H. and Olsson, B. 2003. Heterogeneous preferences for marine amenities: A Choice
experiment applied to water quality. Working Paper, Göteborg University. See also Eggert,
H. and Olsson, B. 2009. Valuing multi-attribute marine water quality. Marine Policy
33(2):201-206.
Elofsson, K. 2003. Cost-effective reductions of stochastic agricultural loads to the Baltic Sea.
Ecological Economics 47:13-31.
Florax, R. J. G. M., Travisi, C. M. and Nijkamp, P. 2005. A meta-analysis of the willingness
to pay for reductions in pesticide risk exposure. European Review of Agricultural
Economics 32(4):441-467.
Frykblom, P. 1998. Halved Emissions of Nutrients, What are the Benefits? A Contingent
Valuation Survey Applied to Laholm Bay. In Questions in the Contingent Valuation
Method - Five Essays. PhD diss., Swedish University of Agricultural Sciences, Uppsala.
Glass, G. V. 1976. Primary, Secondary and Meta-analysis. Educational Researcher 5:3-8.
Gren, I-M., Elofsson, K. and Jannke, P. 1997. Cost-Effective Nutrient Reduction to the Baltic
Sea. Environmental and Resource Economics 10:341-362.
Gren, I-M., Söderqvist, T. and Wulff, F. 1997. Nutrient Reductions to the Baltic Sea:
Ecology, Costs and Benefits. Journal of Environmental Management 51:123-143.
Hanley, N., MacMillan, D., Wright, R. E., Bullock, G., Simpson, I., Parsisson, D. and
Crabtree, B. 1998. Contingent Valuation Versus Choice Experiments: Estimating the
Benefits of Environmentally Sensitive Areas in Scotland. Journal of Agricultural
Economics 49(1):1-15.
Hasler, B., Lundhede, T., Martinsen, L., Neye, S. and Schou, J. S. 2005. Valuation of
groundwater protection versus water treatment in Denmark by choice experiments and
contingent valuation. NERI Technical Report No. 543, National Environmental Research
Institute.
Söderqvist, T. and Hasselström, L. 2008. The economic value of ecosystem services provided
by the Baltic Sea and Skagerrak. Existing information and gaps of knowledge. Report
5874. Swedish Environmental Protection Agency, Stockholm.
Helcom 1974. Convention on the protection of the marine environment of the Baltic Sea area
(Helsinki Convention).
31
Helcom 1988. Declaration on the protection of the marine environment of the Baltic Sea.
Helsinki Commission.
Helcom 2007. Baltic Sea Action Plan. HELCOM Ministerial Meeting.
Huang, J-C., Poor, P. J., Zhao, M. Q. 2007. Economic Valuation of Beach Erosion Control.
Marine Resource Economics 22(3):221-138.
Jacobsen, J. B. and Hanley, N. 2008. Are There Income Effects on Global Willingness to Pay
for Biodiversity Conservation? Environmental and Resource Economics 2008. Online first.
Johnston, R. J., Besedin, E. Y. and Wardwell, R. F. 2003. Modeling relationships between use
and nonuse values for surface water quality: A meta-analysis. Water Resources Research
39(12):1-9.
Johnston R. J., Besedin, E. Y. Iovanna, R., Miller, C. M., Wardwell, R. F. and Ranson, M. H.
2005. Systematic Variation in Willingness to Pay for Aquatic Resource Improvements and
Implications for Benefit Transfer: A Meta-Analysis. Canadian Journal of Agricultural
Economics 53:221-248.
Johnston, R. J., Ranson, M. H. Besedin, E. Y. and Helm, E. C. 2006. What Determines
Willingness to Pay per Fish? A Meta-analysis of Recreational Fishing Values. Marine
Resource Economics 21(1):1-32.
Kahneman, D., Knetsch, J. L. and Thaler, R. 1991. The Endowment Effect, Loss Aversion,
and Status Quo Bias. Anomalies. Journal of Economic Perspectives 5(1):193-206.
Kosenius, A-K. 2004. Estimating the Benefit from Algal Bloom Reduction - an Application
of Contingent Valuation Method. Master's thesis, University of Helsinki.
Kosenius, A-K. 2008. Heterogeneous Preferences for Water Quality Attributes: the case of
Eutrophication of the Gulf of Finland, Baltic Sea. Discussion paper No 24. University of
Helsinki.
Lindhjem, H. 2007. 20 years of stated preference valuation of non-timber benefits from
Fennoscandian forests: A meta-analysis. Journal of Forest Economics 12:251-277.
Lindhjem, H. and Navrud, S. 2008. How reliable are meta-analyses for international benefit
transfers? Ecological Economics 66:425-435.
Lipsey, M. W. and Wilson, D. B. 2001. Practical meta-analysis. Applied Social Research
Methods Series, v. 49. Sage Publications, California.
Liu, S. and Stern, D. I. 2008. A Meta-Analysis of Contingent Valuation Studies in Coastal
and Near-Shore Marine Ecosystems. MPRA Paper No. 11720.
Loomis, J. B. and White, D. S. 1996. Economic benefits of rare and endangered species:
summary and meta-analysis. Ecological Economics 18:197-206.
32
Luoto, I. 1998. Öjanjärven virkistyskäyttö ja sen taloudellinen arvottaminen [Recreation in
lake Öjanjärvi and its economic valuation]. Research report 8/1998, Chydenius Institute,
University of Jyväskylä.
Markowska, A. and Zylicz, T. 1999. Costing an international public good: the case of the
Baltic Sea. Ecological Economics 30:301-16.
Mäntymaa, E. 1993. Ympäristöhyötyjen arviointi contingent valuation –menetelmällä
[Evaluation of environmental benefits using the contingent valuation method]. Research
Reports 109, Research Institute of Northern Finland, University of Oulu.
NAO (National Audit Office of Finland) 2007. Kalatalouden kehittäminen [Development of
the fishing industry]. Valtiontalouden tarkastusviraston toiminnantarkastuskertomus
155/2007.
Needelman, M. S. and Kealy, M. J. 1995. Recreational swimming benefits of New Hampshire
lake water quality policies: an application of a repeated discrete choice model. Agricultural
and Resource Economics Review 24(1):78-87.
Nelson, J. P. and Kennedy, P. E. 2009. The Use (and Abuse) of Meta-analysis in
Environmental and Natural Resource Economics: An Assessment. Environmental and
Resource Economics 42(3):345-377.
O’Brien, R. M. 2007. A Caution Regarding Rules of Thumb for Variance Inflation Factors.
Quality and Quantity 41:673-690.
Ollikainen, M. and Honkatukia, J. 2001. Towards Efficient Pollution Control in the Baltic
Sea: An Anatomy of Current Failure with Suggestions for Change. Ambio 30(4-5):245-253.
Pakalniete, K., Lezdina, A. and Veidemane, K. 2007. Assessing environmental costs by
applying contingent valuation method in the sub-basin of the river Ludza: Latvian case
study report. Wageningen International and BEF Group.
Parkkila, K. 2005 Simojoen lohen saalismäärän lisääntymisen taloudellinen arviointi
contingent valuation –menetelmällä. Master's thesis, University of Helsinki.
Parsons, G. R., Helm, E. C. and Bondelid, T. 2003. Measuring the economic benefits of water
quality improvements to recreational users in six northeastern states: an application of the
random utility maximization model. Working paper, University of Delaware.
Ready, R. Malzubris, J. and Senkane, S. 2002. The relationship between environmental values
and income in a transition economy: surface water quality in Latvia. Environment and
Development Economics 7:147-156.
Ready, R. and Navrud, S. 2006. International benefit transfer: Methods and validity tests.
Ecological Economics 60:429-434.
33
Rosenberger, R. S. and Loomis, J. B. 2000. Using meta-analysis for benefit transfer: In-
sample convergent validity tests of an outdoor recreation database. Water Resources
Research 36(4):1097-1107.
Rosenberger, R. S. and Stanley, T. D. 2006. Measurement, generalization, and publication:
Sources of error in benefit transfers and their management. Ecological Economics 60:372-
376.
Sandström, M. 1996. Recreational benefits from improved water quality: A random utility
model of Swedish seaside recreation. Working Paper No. 121. The Economic Research
Institute, Stockholm School of Economics.
Sceponaviciute, R., Monarchova, J. and Semeniene, D. 2007. Nevezis river basin case study.
Wageningen International.
Shrestha, R. K. and Loomis, J. N. 2001. Testing meta-analysis for benefit transfer in
international outdoor recreation. Ecological Economics 39:67-83.
Smith, K. and Huang, J-C. 1995. Can Markets Value Air Quality? A Meta-Analysis of
Hedonic Property Value Models. The Journal of Political Economy 103(1):209-227.
Smith, K. and Kaoru, Y. 1990. What have we learned since Hotelling’s letter? A meta-
analysis. Economic Letters 32: 267–272.
Smith, V. K. and Pattanayak, S. K. 2002. Is Meta-Analysis a Noah’s Ark for Non-Market
Valuation? Environmental and Resource Economics 22:271-296.
Stapler, R. W. and Johnston, R. J. 2009. Meta- Analysis, Benefit Transfer, and
Methodological Covariates: Implications for Transfer Error. Environmental and Resource
Economics 42(2):227-246.
Soutukorva, Å. 2005. The Value of Improved Water Quality. A Random Utility Model of
Recreation on the Stockholm Archipelago. Beijer International Institute of Ecological
Economics, The Royal Swedish Academy of Sciences.
Söderqvist, T. 1996. Contingent Valuation of a Less Eutrophicated Baltic Sea. Beijer
Discussion Paper Series No. 88, The Beijer Institute, Stockholm.
Söderqvist, T. and Scharin, H. 2000. The regional willingness to pay for a reduced
eutrophication in the Stockholm archipelago. Discussion Paper, no. 128, Beijer
International Institute of Ecological Economics, The Royal Swedish Academy of Sciences.
Toivonen, A.L., Roth, E., Navrud, S., Gudbergsson, G., Appelblad, H., Bengtsson, B. and
Tuunainen, P., 2004. The Economic Value of Recreational Fisheries in Nordic Countries.
Fisheries Management and Ecology, 11(2):1-14.
34
Turner, R. K., Geourgiou, S., Gren, I-M., Wulff, F., Barrett, S., Söderqvist, T., Bateman, I. J.,
Folke, C., Langaas, S., Zylicz, T., Mäler, K-G. and Markowska, A. 1999. Managing
nutrient fluxes and pollution in the Baltic Sea: an interdisciplinary simulation study.
Ecological Economics 30:333-352.
Tversky, A. and Kahneman, D. 1991. Loss Aversion in Riskless Choice: A Reference-
Dependent Model. Quarterly Journal of Economics 106:1039-1061.
Van Houtven, G. Powers, J. and Pattanayak, S. K. 2007. Valuing water quality improvements
in the United States using meta-analysis: Is the glass half-full or half-empty for national
policy analysis? Resource and Energy Economics 29:206-228.
Vesterinen, J., Pouta, E., Huhtala, A. and Neuvonen, M. 2008, manuscript. Water quality
change impacts on recreation behaviour and benefits in Finland.
Wallmo, K. and Edwards, S. 2008 Estimating Non-market Value of Marine Protected Areas:
A Latent Class Modeling Approach. Marine Resource Economics 23:301-323.
Walsh, R. G., Johnson, D. M. and McKean, J. R. 1992. Benefit Transfer of Outdoor
Recreation Demand Studies, 1968-1988. Water Resources Research 28(3):707-713.
Whitehead, J. C., Dumas, C. F., Herstine, J., Hill, J. and Buerger, B. 2008. Valuing Beach
Access and Width with Revealed and Stated Preference Data. Marine Resource Economics
23:119-135.
Whitehead, J. C. 2005. Combining willingness to pay and behaviour data with limited
information. Resource and Energy Economics 27:143-155.
Whitehead, J. C., Haab, T. C. and Huang, J-C. 2000. Measuring recreation benefits of quality
improvements with revealed and stated preference data. Resource and Energy Economics
22:339-354.
Wilson, M. A., and S. R. Carpenter. 1999. Economic valuation of freshwater ecosystem
services in the United States, 1977-1997. Ecological Applications 9:772-783.
Woodward, R. T. and Wui, Y-S. 2001. The economic value of wetland services: a meta-
analysis. Ecological Economics 37:257-270.
Wulff, F., Bonsdorff, E., Gren, I-M., Johansson, S. and Stigebrandt, A. 2001. Giving Advice
on Cost-Effective Measures for a Cleaner Baltic Sea: A Challenge for Science. Ambio
30(4-5): 254-259.
Zylicz, T., Bateman, I., Georgiou, S., Markowska, A., Dziegielewska, D., Turner, R. K.,
Graham, A. and Langford, I. 1995. Contingent valuation of eutrophication damage in the
Baltic Sea region. Centre for Social and Economic Research on the Global Environment,

35
University College London and University of East Anglia. Warsaw Ecological Economics
Centre, University of Warsaw.
36
Appendix 1. Summary of studies included in the meta-data (studies=32, value estimates=54)
Study
number Author(s)
Environmental
focus Resource type and area Baltic Sea connection
Valuation
method
Mean of WTP
estimates in 2007
€ (number)
1 Mäntymaa (1994) eutrophication lake Oulujärvi, Finland in the drainage basin CV 70.0 (2)
2 Needelman and Kealy (1995) water quality lakes in New Hampshire, US none TCM 3.70 (5)
3 Söderqvist (1996) eutrophication Baltic Sea direct CV 124.6 (1)
4 Söderqvist (1996) eutrophication Baltic Sea direct CV 99.7 (1)
5 Zylicz et al. (1995) eutrophication Baltic Sea direct CV 151.5 (1)
6 Frykblom (1998) eutrophication Laholm Bay, Sweden direct CV 94.5 (1)
7 Luoto (1998) water quality lake Öjanjärvi, Finland in the drainage basin CV 39.5 (1)
8 Markowska and Zylicz (1999) eutrophication Baltic Sea direct CV 32.1 (1)
9 Markowska and Zylicz (1999) eutrophication Baltic Sea direct CV 49.0 (1)
10 Markowska and Zylicz (1999) eutrophication Baltic Sea direct CV 82.7 (1)
11 Söderqvist and Scharin (2000) eutrophication Stockholm archipelago, Sweden direct CV 83.9 (1)
12 Whitehead, Haab and Huang
(2000) water quality
Albemarle and Pamlico Sounds, North
Carolina, US none TCM 23.1 (1)
13 Ready, Malzubris and Senkane
(2002) water quality Gauja River, Latvia indirect CV 24.9 (1)
14 Eggert and Olsson (2003) water quality Skagerrak and Kattegat off the west
coast of Sweden direct CE 109.3 (4)
15 Parsons, Helm and Bondelid
(2003) water quality
all waters in the six northeastern states,
US none TCM 16.2 (3)
16 Arlinghaus (2004) fisheries all waters in Germany indirect CV 24.2 (1)
17 Egan et al. (2004) water quality lakes in Iowa, US none TCM 48.6 (3)

37
18 Kosenius, (2004) eutrophication Gulf of Finland direct CV 26.0 (1)
19 Toivonen et al. (2004) fisheries all waters in Finland indirect CV 57.5 (2)
20 Toivonen et al. (2004) fisheries all waters in Sweden indirect CV 61.4(2)
21 Toivonen et al. (2004) fisheries all waters in Denmark indirect CV 107.6 (2)
22 Hasler et al. (2005) water quality lakes and watercourses in Denmark in the drainage basin CE 90.7 (2)
23 Parkkila (2005) fisheries Simojoki River, Finland indirect CV 53.0 (1)
24 Soutukorva (2005) eutrophication Stockholm archipelago, Sweden direct TCM 22 (1)
25 Whitehead (2005) water quality Neuse River, North Carolina, US none combined CV
and TCM 47.7 (1)
26 Ahtiainen (2007) oil spills Gulf of Finland direct CV 28.0 (1)
27 Atkins, Burdon and Allen
(2007) eutrophication Randers Fjord, Denmark indirect CV 115.2 (2)
28 Pakalniete, Lezdina and
Veidemane (2007) eutrophication river and lake Ludza, Latvia in the drainage basin CV 5.8 (1)
29 Sceponaviciute, Monarchova
and Semeniene (2007) water quality Nevezis river basin, all rivers, Lithuania in the drainage basin CV 17.8 (1)
30 Ahtiainen (2008) eutrophication Lake Hiidenvesi, Finland in the drainage basin CV 29.4 (1)
31 Kosenius (2008) eutrophication Gulf of Finland direct CE 206.0 (3)
32 Vesterinen et al. (2008) eutrophication all lakes and coastal waters in Finland indirect TCM 25.8 (4)

ISSN 1795-5300
MTT Discussion Papers 1 • 2009MTT Discussion Papers 1 • 2009
Valuing international marine resources: A meta-analysis
on the Baltic Sea
Heini Ahtiainen