Embed Size (px)
Citation preview
ASIAN DEVELOPMENT BANK
ASIAN DEVELOPMENT BANK6 ADB Avenue, Mandaluyong City1550 Metro Manila, Philippineswww.adb.org
Valuing Unpaid Care Work in Bhutan
This paper estimates the value of unpaid care work in Bhutan. It finds that, as in other countries, women spend more than twice as much time as men performing unpaid care work regardless of their income, age, residency, and household size. Bhutan has been ahead of its time in incorporating a measure of welfare—the Gross National Happiness Index—to better formulate social policy. This paper is the first to estimate the value of unpaid care work in the country and discusses the pros and cons of various approaches. It adds to the growing body of scholarly literature scrutinizing the importance of properly measuring the value of unpaid care work.
About the Asian Development Bank
ADB is committed to achieving a prosperous, inclusive, resilient, and sustainable Asia and the Pacific, while sustaining its efforts to eradicate extreme poverty. Established in 1966, it is owned by 68 members —49 from the region. Its main instruments for helping its developing member countries are policy dialogue, loans, equity investments, guarantees, grants, and technical assistance. VALUING UNPAID
CARE WORK IN BHUTAN Jooyeoun Suh, Changa Dorji, Valerie Mercer-Blackman, and Aimee Hampel-Milagrosa
ADB ECONOMICSWORKING PAPER SERIES
NO. 624
November 2020
ASIAN DEVELOPMENT BANK
ADB Economics Working Paper Series
Valuing Unpaid Care Work in Bhutan
Jooyeoun Suh, Changa Dorji, Valerie Mercer-Blackman, and Aimee Hampel-Milagrosa
No. 624 | November 2020
Jooyeoun Suh ([email protected]) is a longevity economics expert at the American Association of Retired Persons; Changa Dorji ([email protected]) is an independent researcher based in Thimphu, Bhutan. Valerie Mercer-Blackman ([email protected]) is a senior economist at the World Bank; Aimee Hampel-Milagrosa ([email protected]) is an economist at the Economic Research and Regional Cooperation Department of the Asian Development Bank.
This paper was used as a background material for the report on Accounting for Unpaid Care Work in Bhutan 2019 published by the National Commission for Women and Children. The authors thank Karma Wangdi, Francesco Tornieri, Brenda Batistiana, Nidup Tshering, and the various agencies in Bhutan that cooperated with the data—the Centre for Bhutan & GNH Studies, National Commission for Women and Children, Ministry of Labour and Human Resources, and the National Statistics Bureau.
Creative Commons Attribution 3.0 IGO license (CC BY 3.0 IGO)
© 2020 Asian Development Bank6 ADB Avenue, Mandaluyong City, 1550 Metro Manila, PhilippinesTel +63 2 8632 4444; Fax +63 2 8636 2444www.adb.org
Some rights reserved. Published in 2020.
ISSN 2313-6537 (print), 2313-6545 (electronic) Publication Stock No. WPS200065-2 DOI: http://dx.doi.org/10.22617/WPS200065-2
The views expressed in this publication are those of the authors and do not necessarily reflect the views and policies of the Asian Development Bank (ADB) or its Board of Governors or the governments they represent.
ADB does not guarantee the accuracy of the data included in this publication and accepts no responsibility for any consequence of their use. The mention of specific companies or products of manufacturers does not imply that they are endorsed or recommended by ADB in preference to others of a similar nature that are not mentioned.
By making any designation of or reference to a particular territory or geographic area, or by using the term “country” in this document, ADB does not intend to make any judgments as to the legal or other status of any territory or area.
This work is available under the Creative Commons Attribution 3.0 IGO license (CC BY 3.0 IGO) https://creativecommons.org/licenses/by/3.0/igo/. By using the content of this publication, you agree to be bound by the terms of this license. For attribution, translations, adaptations, and permissions, please read the provisions and terms of use at https://www.adb.org/terms-use#openaccess.
This CC license does not apply to non-ADB copyright materials in this publication. If the material is attributed to another source, please contact the copyright owner or publisher of that source for permission to reproduce it. ADB cannot be held liable for any claims that arise as a result of your use of the material.
Please contact [email protected] if you have questions or comments with respect to content, or if you wish to obtain copyright permission for your intended use that does not fall within these terms, or for permission to use the ADB logo.
Corrigenda to ADB publications may be found at http://www.adb.org/publications/corrigenda.
Note: In this publication, “$” refers to United States dollars and “€” to euros.
The ADB Economics Working Paper Series presents data, information, and/or findings from ongoing research and studies to encourage exchange of ideas and to elicit comment and feedback about development issues in Asia and the Pacific. Since papers in this series are intended for quick and easy dissemination, the content may or may not be fully edited and may later be modified for final publication.
CONTENTS
TABLES AND FIGURES iv ABSTRACT v I. INTRODUCTION 1 II. MEASUREMENT AND VALUATION OF UNPAID CARE WORK 2 A. Measuring Unpaid Care Work 2 B. Valuing Unpaid Care Work 4 III. DATA AND METHODOLOGY 9 A. Data 6 B. Unpaid Care Work and Corresponding Occupations 11 C. Methodology 12 IV. FINDINGS BASED ON THE 2015 TIME USE SURVEY 14 A. Time Spent on Paid Work and Unpaid Caregiving Work by Gender 14 B. Time Spent on Unpaid Care Work by Socioeconomic Demographics 19 C. Corresponding Wage Rates for Unpaid Care Work 24 D. Values of Unpaid Care Work 25 V. CONCLUSIONS AND RECOMMENDATIONS 28 REFERENCES 33
TABLES AND FIGURES
TABLES 1 International Estimates of the Value of Unpaid Care Work 8
2 Unpaid Housework and Caregiving Activities, and Corresponding Occupations 11
3 Maximum Hourly Wages of Corresponding Occupations for Unpaid Housework 25 and Caregiving, 2011–2016
4 Estimated Values of Unpaid Housework and Caregiving, Using the Specialist 26 Wage Approach
5 Estimated Values of Unpaid Housework and Caregiving, Using the Generalist 27 Wage Approach
FIGURES 1 Categorization of Time Use into Various Subgroups 10
2 Methodology for Valuing Unpaid Care Work 12
3 Daily Time Spent on Personal Care and Sleep, by Gender 14
4 Time Spent on Major Time Use Activities, by Gender 15
5 Participation Rates in Unpaid Housework and Caregiving, by Gender 16
6 Daily Time Spent on Various Unpaid Housework and Caregiving Activities, by Gender 17
7 Participation Rates in Various Housework and Caregiving Activities, by Gender 18
8 Daily Time Devoted to Unpaid Care Work and Paid Work, by Income Quintile and Gender 19
9 Daily Time Devoted to Unpaid Housework and Caregiving, by Area of Residence 20 and Gender
10 Daily Time Devoted to Unpaid Housework and Caregiving, by Gender 21 and Household Size
11 Daily Time Devoted to Unpaid Housework, by Age Cohort and Gender 22
12 Daily Time Devoted to Unpaid Caregiving, by Age Cohort and Gender 23
13 Daily Time Devoted to Unpaid Housework and Caregiving, by Employment Status 24 and Gender
14 Value of Unpaid Care Work as a Share of Gross Domestic Product 28
15 Daily Time Allocations, by Gender 31
ABSTRACT
A growing body of scholarly literature has attempted to measure and value unpaid care work in various countries, but perhaps only the government statistical agencies in the United States and the United Kingdom have seriously undertaken periodic and systematic measures of the time spent on unpaid work at the national level, and partially incorporated those values into their gross domestic product (GDP). One country that has been ahead of its time on aspects of societal welfare measurement is Bhutan, which produces the Gross National Happiness (GNH) Index. However, until the first GNH Survey, in 2008, Bhutan did not have any sense of the size and distribution of unpaid work, despite its strong societal norms about the value of volunteering and community work. This paper is the first to estimate the value of unpaid care work in Bhutan. It shows the pros and cons of various approaches and their equivalent measures of unpaid care work as a share of GDP. As with similar studies on the topic, this paper also finds that women spend more than twice as much time as men performing unpaid care work, regardless of their income, age, residency, or number of people in the household. The paper also provides recommendations for improving the measurement of unpaid care work in Bhutan.
Keywords: Bhutan, gender, labor productivity, measurement, time use, unpaid care work
JEL codes: D13, J16, J22, J39, O53
I. INTRODUCTION
Unpaid care work done by family members and friends (housework and caregiving) comprises a set of essential activities necessary for producing goods and services to sustain daily life and to ensure social reproduction for the future. As workplaces around the world have become more inclusive and diverse, and the nature of work itself has been transformed, measuring unpaid care work has become even more crucial. Throughout the world, women remain the primary providers of unpaid care, and its provision is still viewed by many people as the natural duty of women (Benería 2003). While the implications of unpaid care work for well-being, gender equality, and women’s empowerment are important, such work remains statistically invisible to many policy makers, economists, and national statisticians because it falls outside the conventional definitions of what counts as work. Given that it is a nonmarket activity, such work is excluded from conventional national income accounts (e.g., in the measure of gross domestic product [GDP]). This invisibility has important consequences for women, as it perpetuates the imbalances in economic relations and earnings that underlie gender inequality.
Yet unpaid care work plays a fundamental role in human capabilities and development (ADB 2020). For example, the Human Development Report 2019 published by the United Nations Development Programme (UNDP), showed that human development prospers not only when there are improvements in income, schooling, health, and in the environment, but also when a nurturing environment and high-quality care are provided for children (UNDP 2019). In line with this finding, Bhutan has acknowledged the role of unpaid care work as a cornerstone of human development and well-being, making it an important component of the country’s measure of Gross National Happiness (GNH), a concept first introduced in Bhutan (CBS 2016). The country’s incorporation of unpaid care work into the calculation of the GNH Index has the potential to attract international attention to the importance of care work in promoting happiness.
This analysis, the first of its kind undertaken in Bhutan, contributes to the growing body of scholarly literature (Chadeau 1985; Holloway, Short, and Tamplin 2002; International Labour Organization [ILO] and UNDP 2018; Suh and Folbre 2016; UN Women 2019) that measures and values unpaid care work, including that published in the United States (US), Mexico, and the United Kingdom (UK), as well as in various developing nations. This paper is based on a report by the National Commission for Women and Children (2019) that presented findings and offered short-term and long-term policy recommendations, which have received due consideration. The goal going forward is to replicate, extend, and refine the computations in the report, so that unpaid care work can be measured on a regular basis. To that end, this paper will (i) focus on how the report’s findings relate to the literature on measuring unpaid care work, (ii) describe the methodology of valuing unpaid care and work in detail, and (iii) provide the data utilized for that report to third-party users. The estimates of the monetary value of unpaid care work are based on time use data that were collected by the Centre for Bhutan & GNH Studies (CBS); the Labour Force Survey (LFS), conducted by the Government of Bhutan and the ILO; and the Bhutan Living Standards Survey—and used to compute the GNH Index. Most of the data presented in this paper date from 2015. This was a deliberate choice, as that was the year of the most recent GNH Survey Report; although LFSs are published annually, we used the data from the same year as the GNH Survey for better comparability. From year to year, there will often be changes in wage levels, the number of people employed, the distribution of work between men and women, and in the descriptions of work and job categories. Thus, the data from the 2015 LFS, although not the most recent, would mesh better with the GNH Survey data for that same year.
2 ADB Economics Working Paper Series No. 624
The rest of this paper is organized as follows. Section I provides a brief review of the research that has been done on the measurement and valuation of unpaid care work. Our methodology is described in section II, followed by section III, which lays out our empirical findings based on the 2017 dataset; and in section IV, we present concluding remarks and recommendations for improving and extending the measurement of unpaid care work in Bhutan.
II. MEASUREMENT AND VALUATION OF UNPAID CARE WORK
A. Measuring Unpaid Care Work
Unpaid care work is a crucial dimension of social reproduction—the process of enabling individuals, families, and the society as a whole to continue thriving. Unpaid care work involves time and energy devoted to supporting human well-being. Despite its importance, unpaid care work is undervalued because it is performed outside market transactions, comprising a so-called “missing market” (Janvry, Fafchamps, and Sadoulet 1991). Yet, the benefits of unpaid care work extend beyond market transactions because they represent “public goods” (Folbre 2008). Unpaid care work is clearly “work,” but there is lack of consensus as to how to define it.
In introductory microeconomic textbooks, “work” is defined as an activity that yields disutility in exchange for income or consumption. In other words, work is something you do to get money, not something you get any pleasure from. Yet, people report expressing considerable satisfaction (or “process benefits”) from paid work (Juster and Stafford 1985). In terms of intrinsic satisfaction, some people certainly get satisfaction or utility by minding children, cooking, or gardening, and even by doing remunerated work.
An alternative approach to defining work, and the one that is generally followed in defining both paid and unpaid care work, is Margaret Reid’s “third-person criterion.” A pioneer of research on household production in the 1930s, Reid defined work as an activity that one could pay another person to perform. She noted that
[i]f an activity is of such character that it might be delegated to a paid worker, then that activity shall be deemed productive….[H]ousehold production…consists of those unpaid activities which are carried on, by and for the members, which activities might be replaced by market goods, or paid services, if circumstances such as income, market conditions, and personal inclinations permit the service being delegated to someone outside the household group (Reid 1934, 11).
According to the third-person criterion, many forms of unpaid care work, including childcare, are considered work if someone else (a third person) could, in principle, be hired to perform it on one’s behalf. Another criterion is whether an activity creates a transferable benefit. According to both criteria, the time devoted to unpaid care qualifies as work.
Time use data make it possible to measure the amount of time devoted to unpaid care work, but such data can also have some limitations, all of which are present in Bhutan.
Valuing Unpaid Care Work in Bhutan 3
First, because time use surveys (TUSs) are primarily intended to measure explicit functions such as meal preparation, housecleaning, or feeding a child, they are based on activities—both primary and secondary. A primary activity is a response to the question, “What were you doing?” A secondary activity is a response to the question, “What else were you doing during the primary activity?” But neither question accounts for supervisory care, which can be thought of as on-call time (Folbre 2008).1 Neither primary nor secondary activities are adequate categories for capturing the time devoted to supervisory care because it typically involves constraints, rather than activities. That is, while being present in order to keep an eye on dependents, the care provider’s ability to engage in some other activity is constrained. For example, even though infants sleep most of the time during a day, they wake up at random times; and when they do, they require the adult’s immediate attention. Someone caring for an infirm adult must be on call in a similar manner.
Second, few TUSs include all adult members of a household. While time diary data can be used to construct approximate measures of the total value of unpaid care work, measuring the value of unpaid care work across different types of households is difficult when the data from only one adult providing unpaid care are captured. For instance, the impact of additional household members on unpaid childcare is not trivial, and it has been investigated and documented in various studies.2 It is important to note, however, that several surveys have included time allocation from all members of a household, conducted in countries before nationally representative, large-scale time diary survey data became available. For instance, the 1980 National Socioeconomic Survey of Indonesia asked all household members about time allocation on four principal activities (work, school, home care, and leisure) (Haddad, Hoddinott, and Alderman 1997). Recall data spanning 24 hours on household allocation of time in six developing countries (Gambia, Guatemala, Kenya, Malawi, the Philippines, and Rwanda) was also collected in the 1980s at a smaller scale (Kennedy, Bouis, and Von Braun 1992).
Third, TUSs are often conducted independently from other household surveys, such as those on consumer expenditures or household wealth. Some efforts have been made to collect time use data as a module for another survey like the Living Standard Measurement Survey, income–expenditure surveys, or LFS. For instance, the Pakistan Rural Household Panel survey includes a variety of topics including information on income, consumption, time use, assets, and employment in the rural areas of Punjab and Sindh provinces (IFPRI 2017). While a regionally representative survey with time use data and other economic data is valuable, one that is nationally representative has seldom been attempted. As a result, efforts to combine analyses of time use and household expenditures have been quite limited (Gronau and Hamermesh 2006). In addition, the general lack of household expenditure data distorts our understanding of the substitutability of time and money within a household, which also relates to economic growth and inequality in living standards. Therefore, the unavailability of expenditure data for joint analyses of time use and expenditures can deter efforts to improve the measurement of unpaid care work and of the transfers of both time and money.
With these methodological and technical caveats in mind, we define unpaid care work in this paper broadly to include both caring for children and other dependent household members (such as the elderly, sick, and persons with disabilities) and activities that are necessary for maintaining and managing households (such as cooking and cleaning). The word “unpaid” specifies that the person doing the activity does not receive remuneration for it, making it fall outside the production boundary of the System of National Accounts (SNA). The term “care” means that the activity serves people and
1 The CBS reported that the question had been asked, but in an informal way, and the answers were not analyzed. 2 For example, see Varjonen and Aalto (2006) and Craig and Bittman (2008).
4 ADB Economics Working Paper Series No. 624
their well-being. The term “work” emphasizes that the activity has a cost in terms of time and energy (OECD 2004).
The operational criteria used for recognizing unpaid care work in this paper are based on the third-party principle, which, as previously noted, states that if a third party can be hired to do the job on one’s behalf, it can be defined as unpaid care work. For instance, leisure is an activity that you cannot pay someone else to do for you, and the same holds for sleeping and eating. Such activities are categorized as personal activities, not productive activities. Based on these conceptual distinctions, we extracted two broad activities from the time use data in the GNH Survey and defined as constituting unpaid care work—maintenance and management (i.e., housework) and caregiving services.
Although volunteer work falls under the “unpaid care work” category based on the operational criteria, this type of unpaid work is excluded from the definition used in this paper. Our focus is on unpaid care work for household members. Volunteering at some level presumes that the actor has some free time, which is also an issue. For example, women in Bhutan are often considered to be more “available” for tasks such as maintaining farm roads because their unpaid care work is not taken seriously as work (ADB 2014).
B. Valuing Unpaid Care Work
1. The Methodology for Valuing Unpaid Care Work
The total economic value of an activity is equal to the amount of time spent on an activity times the “price” or unit value of that activity per unit of time. Finding the right unit value of unpaid care work is tricky, so the literature on time use provides a couple of methods for accomplishing this. Specifically, the value of unpaid care work can be determined by an input-based or an output-based approach.
The output-based approach asks what it would cost to purchase an unpaid care service in the market (for instance, an hour of center-provided day care). The price of equivalent market substitutes is thus assigned to nonmarket goods and services. However, this method presents certain conceptual difficulties when defining the output of unpaid care work, such as caring for children. Also, the output-based approach is limited by the difficulty of finding appropriate data that show market prices for outputs of the equivalent quality and quantity of the goods and services created by unpaid care work.
The input-based approach focuses on the measurement and valuation of labor inputs into unpaid care work. In principle, other inputs such as capital and raw materials should also be measured, but labor is the most important input. Large-scale, nationally representative time diary surveys offer good estimates of the time devoted to unpaid care work in the household, including childcare and eldercare. Following the third-person criterion, it then values the time estimates against market wage rates for workers who perform similar activities in the labor market.
The two most common methods used to construct market wage rates build on estimates of the opportunity cost or replacement cost (Abraham and Mackie 2005).3 Opportunity cost is the per-hour value of time that a person could have spent in an alternative activity if she or he had not been doing unpaid care work. For those who have paid jobs, the opportunity cost may reasonably refer to forgone earnings, but some calculation might be required for those who have no such jobs. While this
3 See Jacoby (1993) for an approach that estimates shadow wages for home production combining input and output
methods.
Valuing Unpaid Care Work in Bhutan 5
measure accurately reflects what an individual gives up in order to engage in unpaid care work, it does not necessarily capture the benefits to others. By contrast, the replacement cost valuation uses the wage that would have been paid to a person hired to perform the same tasks (i.e., the third-party criterion). Accordingly, as opposed to opportunity cost valuation, the replacement cost valuation uses the same market wage of a specific occupation to which unpaid work can be equated, regardless of the person’s earnings from paid employment.
Moreover, the range of wage rates for hired substitutes for unpaid care workers varies substantially because the generalist wage approach assigns one wage to all activities, irrespective of the nature of the work, while the specialist wage approach assigns different wages to different activities based on the actual wage rate for each job. This is especially true for care work. At one end (the generalist measure), there are low-paid workers in the market, including domestic workers. At the other end (the specialist measure), there are relatively high-wage workers, such as nurses and teachers, who spend their time in the relevant specialized activities. Given that the specialist wage approach to valuing household production applies specific wage rates to various tasks, the time spent preparing meals, for instance, would be valued at a cook’s wage; and the time spent caring for adults with Alzheimer’s disease or other forms of dementia would be valued at a highly skilled nurse’s wage (Levine 2004). Since there is no consensus on best-fit wages, a wide range of wages can run between a lower-bound estimate and an upper-bound estimate. However, the difficulty with both the generalist and the specialist wage approaches is that they fail to consider the amount of time that individuals spend on unpaid care work. For instance, an inexperienced individual would spend far more time on tasks like painting or plumbing than would an experienced specialist. Therefore, it is possible that the use of the specialist wage approach could lead to overstating the value of unpaid care work (Abraham and Mackie 2005).
Another concern with the replacement cost method is quality control. Is a cook’s wage suitable for a mother’s labor? It is possible that a mother is either a terrible cook whose value should not match a hired cook’s wage or a terrific cook whose value should be adjusted higher than a typical cook’s wage. This issue has not been definitively solved, but a 25% deduction in the wages of specialists for some types of unpaid care work, such as cooking and home repairs, has been suggested, with admonitions to pay careful attention to caregiving activities due to their lack of perfect substitutes (Landefeld and McCulla 2000). Some have argued that a wage should not be deduced because, when a mother cooks for her child, her skill is more specialized in that she has knowledge of her child’s preferences and dietary needs (Suh and Folbre 2016).
Taking into account the issues regarding measurement and the availability of data on Bhutan, this paper adopts the input-based, replacement cost approach for valuing unpaid care work performed in Bhutan, using both generalist and specialist wages to provide lower-bound and upper-bound estimates of the value of unpaid care work.
2. Prior Efforts to Value Unpaid Care Work
There is a long history of attempts to estimate the value of unpaid care work. Efforts to improve the accuracy of the official National Income and Product Accounts (NIPAs) as a measure of the total value of goods and services produced—including unpaid services—have only recently come under discussion. The current benchmark drawn from the NIPAs is the GDP, primarily based on market goods and services that can be directly measured with money, an issue of key importance for NIPA creators (Pigou 1932, 11). As useful as this guideline is, the NIPAs’ focus on market transactions is
6 ADB Economics Working Paper Series No. 624
limited in that it fails to include household services that also represent productive work. Consequently, the importance of unpaid care work has been ignored in a large number of economic policy studies.
At present, there is a persistent lack of consensus on the methodology of measuring and valuing unpaid household services, but various efforts have been made across countries and organizations to measure and value unpaid work (Ferrant and Thim 2019). This section provides a brief summary of those efforts, detailing the methodological differences among the various valuation approaches, and highlighting the important role that time use data play in all of them.
Unpaid care work is quantitatively significant and measurable with currently available time use data (Bianchi, Robinson, and Milkie 2006). For example, using Latin American TUSs including Colombia, Mexico, Peru, and Uruguay, Amarante and Rossel (2018) showed that women, in particular, spent more than half of their total working hours to unpaid household work. Numerous other national TUSs have also documented the substantial magnitude of unpaid care work (housework and caregiving) and the disproportionate share of it borne by women, a pattern common to all countries regardless of their level of development. Using the Harmonised European TUSs for 15 European countries, Folbre and Yoon (2008) found that working-age women (ages 25–60) devoted about 58% of their time to unpaid care work, ranging from a low of about 46% in Latvia to a high of about 69% in Italy. While recent estimates show that the average amount of time used in unpaid care has fallen in many countries—possibly due to time-saving automation—the gender gap persists. The Organisation for Economic Co-operation and Development (2011) showed that the largest gender gaps in time spent on unpaid work are mostly explained by the relatively small amounts of time that men devote to unpaid care work. Men in India, Japan, and the Republic of Korea, spent less than 1 hour per day on unpaid care work, while women in those countries spent at least four times more than that. Gender differences in the time spent on unpaid care work in sub-Saharan Africa were also large. For instance, women’s involvement in domestic and care activities was much greater than men’s, i.e., 3.1 times more in Benin and 4.7 times more in Madagascar (Blackden and Wodon 2006). Among the regions, the gender gap is greatest in South Asia (ILO and UNDP 2018; note that this study did not include Bhutan).
With regard to the developing countries of Asia, the conduct of TUSs and their use for economic valuation is growing. By 2018, nationwide TUSs using the time diary approach had been conducted in Bangladesh, India, Mongolia, Pakistan, the People’s Republic of China, and Thailand; and national modular surveys had been implemented in Cambodia, the Cook Islands, the Lao People’s Democratic Republic, Malaysia, Nepal, Timor-Leste, and Viet Nam (ILO and UNDP 2018). Smaller-scale and pilot studies have been conducted in Iran, some Pacific islands, and the Philippines. Among the countries that have not yet conducted TUSs are Afghanistan, Maldives, the Marshall Islands, Myanmar, Palau, and Singapore (Hirway 2016). The surveys conducted in Asia revealed a wide gap in time use data and the need for improved approaches to valuation.
Microlevel studies have also confirmed these gender gaps. For example, Floro and Pichetpongsa (2010) investigated the time use dimensions of the well-being of home-based workers in three districts of the Bangkok metropolitan area. Using multiple visits to a sample of 359 individuals (household heads and spouses), the team used a simplified time use diary format in combination with the recall method and direct observation. Their study showed that, on average, while both women and men spent nearly all their waking hours working, women reported fewer paid working hours than men (8.97 hours versus 9.93 hours). When housework and caregiving were accounted for, the length of the female respondents’ average total workday (paid and unpaid) exceeded the male respondents’ by nearly an hour. It should be noted that the team had modified the methodology to control for the lack of a clock-based concept of time and for the low literacy rates of the survey respondents.
Valuing Unpaid Care Work in Bhutan 7
In theory, an attempt at valuation should include an estimate of the market value of unpriced inputs and outputs, but few studies have done so in practice.4 Due to the limited availability of relevant data, most studies have relied on the input method, to the exclusion of the output method. These have included some TUSs, which facilitated their valuations of unpaid work based on using the input method. For instance, the Statistics Finland, the national statistical service of Finland, has been developing methods to gauge household satellite accounts since the 1990s. Varjonen and Aalto (2006) estimated the gross value of household production in Finland in 2006 by using the input method and applying a generalist wage (“home helper’s” wage) approach. They still came up with a very large figure for the value of unpaid work—€75 billion, or 39% of GDP.5
Estimates based on specialist wages for valuation have come up with similar ranges. Using national TUS data for 2009–2010 and a suitable set of specialist wage rates, the Hungarian Central Statistical Office found that including household production in Hungary’s 2010 GDP would have increased its value by 25% (Hungarian Central Statistical Office 2016). Some researchers, such as Landefeld and McCulla (2000) and Landefeld, Fraumeni, and Vojtech (2009), have applied both generalist and specialist wages. In their valuation of household production in the US between 1965 and 2004, they find that nonmarket household services made up 31% of GDP in 1965 but decreased to 19% by 2004. This shift reflects the increased female labor force participation rates in the US, which rose from 40% in 1965 to 60% in 2004. In the Latin American countries for which TUS data and replacement cost estimates were available, Durán and Milosavljevic (2012) found that the value of unpaid care work as a percentage of GDP ranged from 23% in Nicaragua in 1999 to 30% in El Salvador in 2009, based on the generalist wage approach.
Prominent efforts pioneered by Ironmonger (1989) and others to refine the output-based approach have made it possible to produce output-based estimates in some countries. For example, the Office for National Statistics in the UK has published estimates based on the valuation of the outputs of household production in 2000, 2005, and 2014, adopting the method used by Holloway, Short, and Tamplin (2002). The Office calculated the total gross value added of home production at £1,019 billion in 2014, equivalent to 56% of the UK’s GDP, up from 52.5% in 2005 (ONS UK 2018).6
Even with the conceptual and empirical problems of the output-based approach, many statistics agencies have adopted it. Along with the UK’s Office for National Statistics, the statistical offices of Canada and Finland have done so, but not those in the Republic of Korea or in the US (Ferrant and Thim 2019). Regarding the UK, Holloway, Short, and Tamplin (2002) estimated the quantity of output of childcare provided by households in 2000 by subtracting from 24 hours the time children spent in school and in formal care facilities. They set the value of output according to the wage of a live-in nanny divided by the average number of children. They noted that the wage of a live-in nanny was lower than might be expected because nannies often received the additional compensation of housing and food. Taking these factors into account, they showed that the value of informal childcare, measured as a share of the UK’s GDP in 2000, ranged from 19% to 25%.
4 Recent literature also has brought up the question of attribution of that value between inputs and outputs. For example,
Mazzucato (2018) shows how remuneration of firms’ chief financial officers under certain conditions can overvalue their actual inputs through a process of value extraction.
5 €75 billion is roughly equivalent to $95.3 billion. In 5 November 2006, €1 = $1.27 or $1 = €0.79. 6 It is important to note that estimates resulting from output-based approaches can be much larger than those employing
input-based approaches because output-based approaches include the cost of raw materials, intermediate materials, capital, and equipment, along with labor costs.
8 ADB Economics Working Paper Series No. 624
A seminal work by Acharya (1993) was one of the first efforts at unpaid care valuation in developing countries in Asia. It valued unpaid work in Nepal using data from the 1984–1985 Multi-Purpose Household Budget Survey of 5,323 households. Of the five categories of activities covered in the TUS component, two were in the unpaid sector—household maintenance and voluntary work. Using a value-added approach for cooking and the generalist wage approach and normative value for the other household maintenance activities, the study estimated that the equivalent of 46.6% of Nepal’s GDP in 1991 was contributed by unpaid work, and that women contributed 93% of this unpaid work. However, the study contained several conceptual and methodological issues, including its use of value-added and normative approaches as time valuation methods.
Hirway (2016) tested the pilot Indian TUS to value non-NIPA unpaid activities in the state of Gujarat, using 1988–1989 data. The study showed that the monetary value of activities excluded from the national accounts was equivalent to 29.3% of the state GDP and that the estimated portion accounted for by women was 93.5%, based on the generalist wage approach. The author noted that the valuation of unpaid work was challenging because of the lack of concepts regarding standards and methods and because of the limited amount of literature integrating unpaid work into the national accounts system.
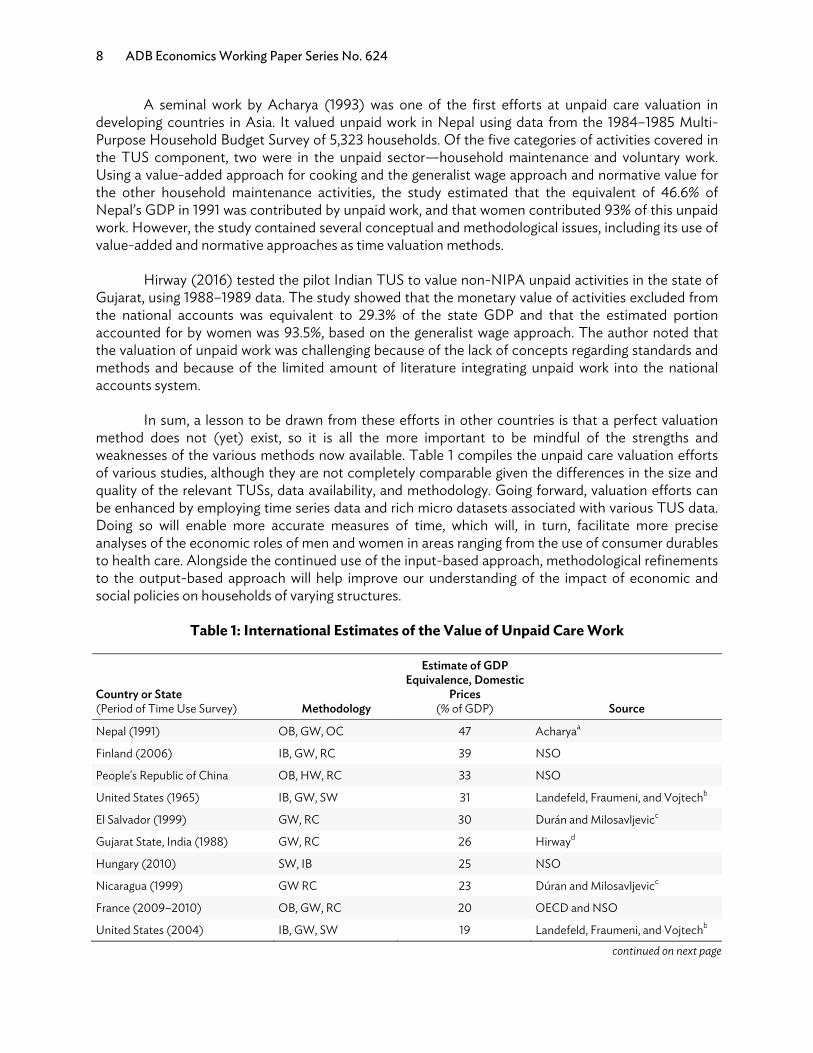
In sum, a lesson to be drawn from these efforts in other countries is that a perfect valuation method does not (yet) exist, so it is all the more important to be mindful of the strengths and weaknesses of the various methods now available. Table 1 compiles the unpaid care valuation efforts of various studies, although they are not completely comparable given the differences in the size and quality of the relevant TUSs, data availability, and methodology. Going forward, valuation efforts can be enhanced by employing time series data and rich micro datasets associated with various TUS data. Doing so will enable more accurate measures of time, which will, in turn, facilitate more precise analyses of the economic roles of men and women in areas ranging from the use of consumer durables to health care. Alongside the continued use of the input-based approach, methodological refinements to the output-based approach will help improve our understanding of the impact of economic and social policies on households of varying structures.
Table 1: International Estimates of the Value of Unpaid Care Work
Country or State (Period of Time Use Survey) Methodology
Estimate of GDP Equivalence, Domestic
Prices (% of GDP) Source
Nepal (1991) OB, GW, OC 47 Acharyaa
Finland (2006) IB, GW, RC 39 NSO
People's Republic of China OB, HW, RC 33 NSO
United States (1965) IB, GW, SW 31 Landefeld, Fraumeni, and Vojtechb
El Salvador (1999) GW, RC 30 Durán and Milosavljevicc
Gujarat State, India (1988) GW, RC 26 Hirwayd
Hungary (2010) SW, IB 25 NSO
Nicaragua (1999) GW RC 23 Dúran and Milosavljevicc
France (2009–2010) OB, GW, RC 20 OECD and NSO
United States (2004) IB, GW, SW 19 Landefeld, Fraumeni, and Vojtechb
continued on next page
Valuing Unpaid Care Work in Bhutan 9
Country or State (Period of Time Use Survey) Methodology
Estimate of GDP Equivalence, Domestic
Prices (% of GDP) Source
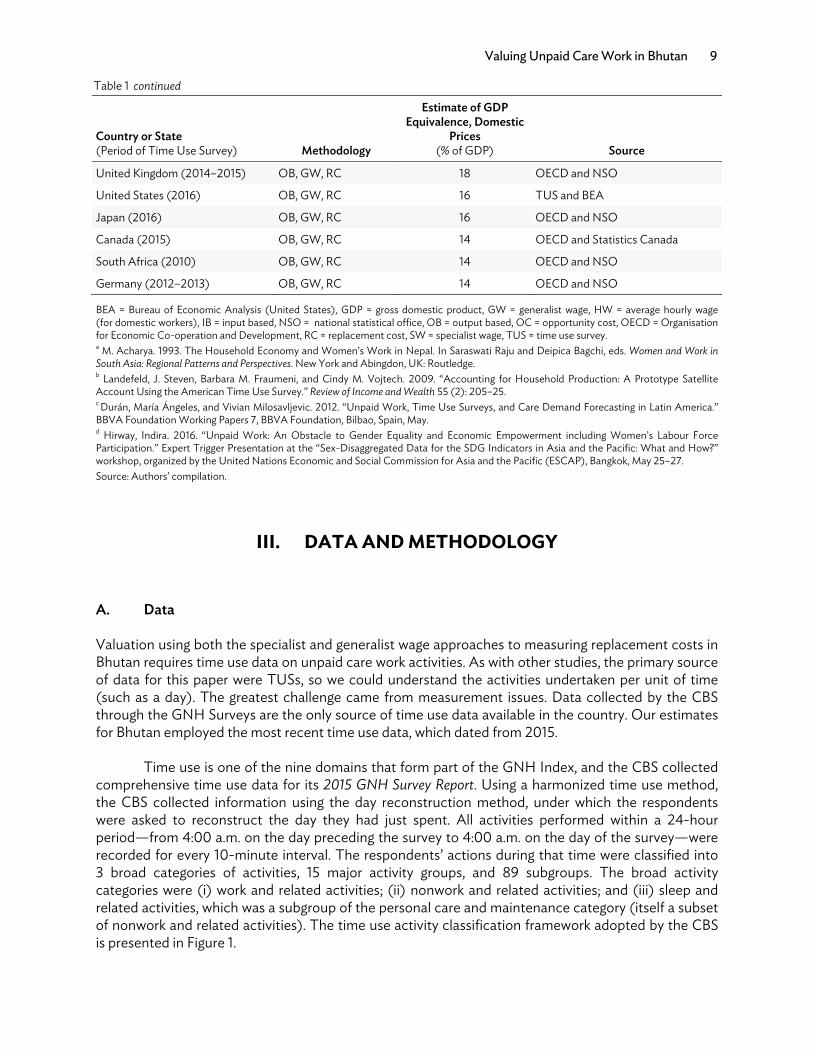
United Kingdom (2014–2015) OB, GW, RC 18 OECD and NSO
United States (2016) OB, GW, RC 16 TUS and BEA
Japan (2016) OB, GW, RC 16 OECD and NSO
Canada (2015) OB, GW, RC 14 OECD and Statistics Canada
South Africa (2010) OB, GW, RC 14 OECD and NSO
Germany (2012–2013) OB, GW, RC 14 OECD and NSO
BEA = Bureau of Economic Analysis (United States), GDP = gross domestic product, GW = generalist wage, HW = average hourly wage (for domestic workers), IB = input based, NSO = national statistical office, OB = output based, OC = opportunity cost, OECD = Organisation for Economic Co-operation and Development, RC = replacement cost, SW = specialist wage, TUS = time use survey. a M. Acharya. 1993. The Household Economy and Women’s Work in Nepal. In Saraswati Raju and Deipica Bagchi, eds. Women and Work in South Asia: Regional Patterns and Perspectives. New York and Abingdon, UK: Routledge. b Landefeld, J. Steven, Barbara M. Fraumeni, and Cindy M. Vojtech. 2009. “Accounting for Household Production: A Prototype Satellite Account Using the American Time Use Survey.” Review of Income and Wealth 55 (2): 205–25. c Durán, María Ángeles, and Vivian Milosavljevic. 2012. “Unpaid Work, Time Use Surveys, and Care Demand Forecasting in Latin America.” BBVA Foundation Working Papers 7, BBVA Foundation, Bilbao, Spain, May. d Hirway, Indira. 2016. “Unpaid Work: An Obstacle to Gender Equality and Economic Empowerment including Women’s Labour Force Participation.” Expert Trigger Presentation at the “Sex-Disaggregated Data for the SDG Indicators in Asia and the Pacific: What and How?” workshop, organized by the United Nations Economic and Social Commission for Asia and the Pacific (ESCAP), Bangkok, May 25–27. Source: Authors’ compilation.
III. DATA AND METHODOLOGY
A. Data
Valuation using both the specialist and generalist wage approaches to measuring replacement costs in Bhutan requires time use data on unpaid care work activities. As with other studies, the primary source of data for this paper were TUSs, so we could understand the activities undertaken per unit of time (such as a day). The greatest challenge came from measurement issues. Data collected by the CBS through the GNH Surveys are the only source of time use data available in the country. Our estimates for Bhutan employed the most recent time use data, which dated from 2015.
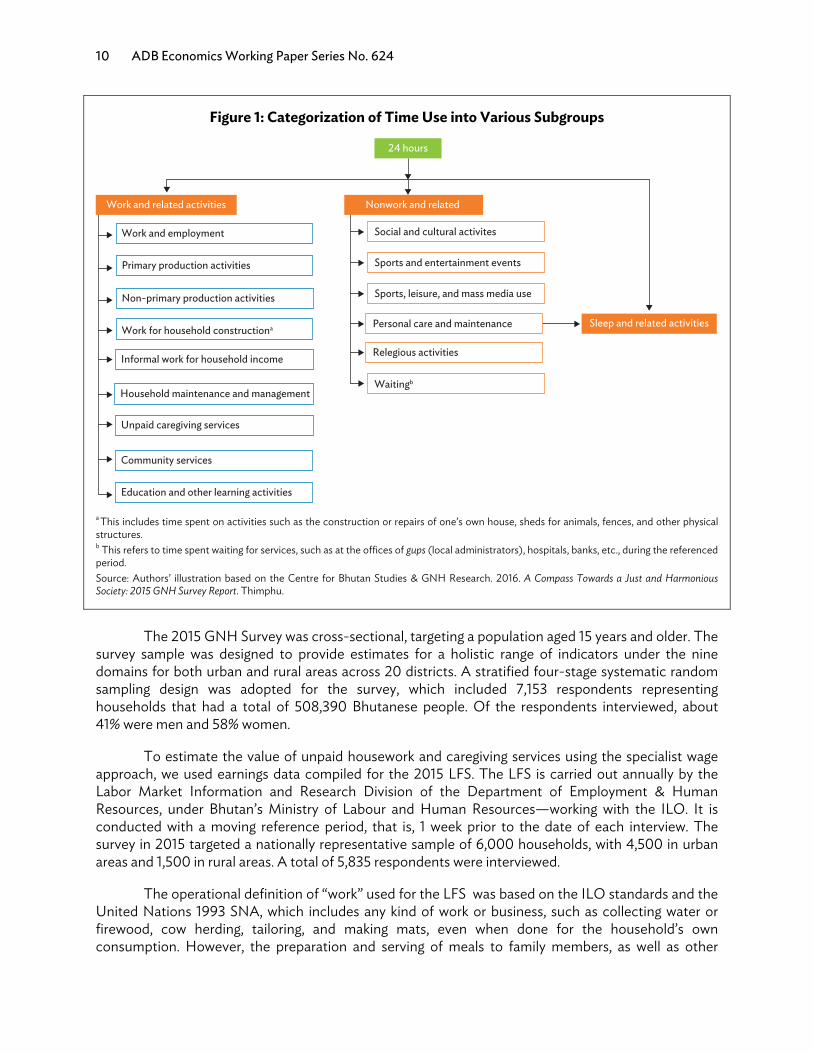
Time use is one of the nine domains that form part of the GNH Index, and the CBS collected comprehensive time use data for its 2015 GNH Survey Report. Using a harmonized time use method, the CBS collected information using the day reconstruction method, under which the respondents were asked to reconstruct the day they had just spent. All activities performed within a 24-hour period—from 4:00 a.m. on the day preceding the survey to 4:00 a.m. on the day of the survey—were recorded for every 10-minute interval. The respondents’ actions during that time were classified into 3 broad categories of activities, 15 major activity groups, and 89 subgroups. The broad activity categories were (i) work and related activities; (ii) nonwork and related activities; and (iii) sleep and related activities, which was a subgroup of the personal care and maintenance category (itself a subset of nonwork and related activities). The time use activity classification framework adopted by the CBS is presented in Figure 1.
Table 1 continued
10 ADB Economics Working Paper Series No. 624
Figure 1: Categorization of Time Use into Various Subgroups
a This includes time spent on activities such as the construction or repairs of one’s own house, sheds for animals, fences, and other physical structures. b This refers to time spent waiting for services, such as at the offices of gups (local administrators), hospitals, banks, etc., during the referenced period.
Source: Authors’ illustration based on the Centre for Bhutan Studies & GNH Research. 2016. A Compass Towards a Just and Harmonious Society: 2015 GNH Survey Report. Thimphu.
The 2015 GNH Survey was cross-sectional, targeting a population aged 15 years and older. The
survey sample was designed to provide estimates for a holistic range of indicators under the nine domains for both urban and rural areas across 20 districts. A stratified four-stage systematic random sampling design was adopted for the survey, which included 7,153 respondents representing households that had a total of 508,390 Bhutanese people. Of the respondents interviewed, about 41% were men and 58% women.
To estimate the value of unpaid housework and caregiving services using the specialist wage approach, we used earnings data compiled for the 2015 LFS. The LFS is carried out annually by the Labor Market Information and Research Division of the Department of Employment & Human Resources, under Bhutan’s Ministry of Labour and Human Resources—working with the ILO. It is conducted with a moving reference period, that is, 1 week prior to the date of each interview. The survey in 2015 targeted a nationally representative sample of 6,000 households, with 4,500 in urban areas and 1,500 in rural areas. A total of 5,835 respondents were interviewed.
The operational definition of “work” used for the LFS was based on the ILO standards and the United Nations 1993 SNA, which includes any kind of work or business, such as collecting water or firewood, cow herding, tailoring, and making mats, even when done for the household’s own consumption. However, the preparation and serving of meals to family members, as well as other
24 hours
Work and related activities Nonwork and related
Sleep and related activities
Work and employment
Primary production activities
Non-primary production activities
Work for household constructiona
Informal work for household income
Household maintenance and management
Unpaid caregiving services
Community services
Education and other learning activities
Social and cultural activites
Sports and entertainment events
Sports, leisure, and mass media use
Personal care and maintenance
Relegious activities
Waitingb
Valuing Unpaid Care Work in Bhutan 11
household activities (e.g., babysitting; training and instructing children; transporting household members or goods; and repairing household durables, vehicles, or other items), were not considered work for the purpose of the LFS.
The LFS provides important details on occupations, disabilities, estimated earnings, unemployment, and education and training. The 2015 LFS in Bhutan used administrative data from the Ministry of Labour and Human Resources on the primary occupations of the respondents, lengths of time they had spent on primary occupations, nature of their occupations, average number of hours they had spent on primary activities, and on the earnings from their primary occupations. The primary occupations of the respondents were grouped into 242 occupational groups, as per the classification system of the ILO.
B. Unpaid Care Work and Corresponding Occupations
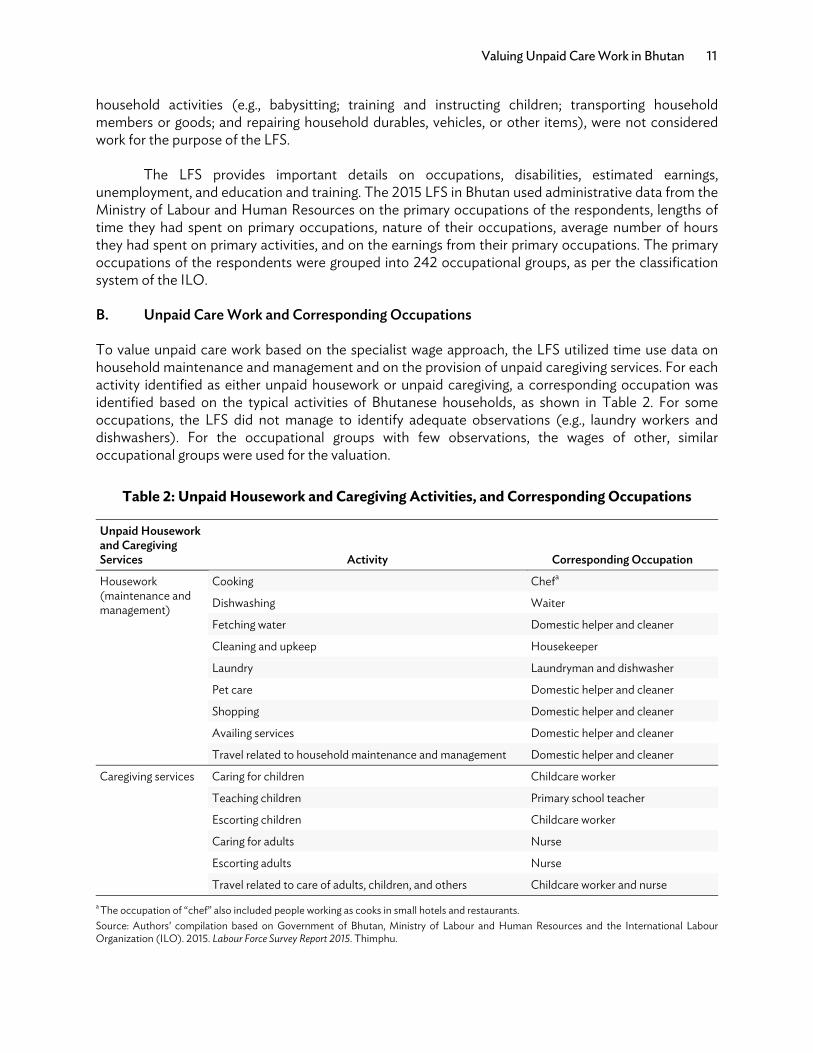
To value unpaid care work based on the specialist wage approach, the LFS utilized time use data on household maintenance and management and on the provision of unpaid caregiving services. For each activity identified as either unpaid housework or unpaid caregiving, a corresponding occupation was identified based on the typical activities of Bhutanese households, as shown in Table 2. For some occupations, the LFS did not manage to identify adequate observations (e.g., laundry workers and dishwashers). For the occupational groups with few observations, the wages of other, similar occupational groups were used for the valuation.
Table 2: Unpaid Housework and Caregiving Activities, and Corresponding Occupations
Unpaid Housework and Caregiving Services Activity Corresponding Occupation
Housework (maintenance and management)
Cooking Chefa
Dishwashing Waiter
Fetching water Domestic helper and cleaner
Cleaning and upkeep Housekeeper
Laundry Laundryman and dishwasher
Pet care Domestic helper and cleaner
Shopping Domestic helper and cleaner
Availing services Domestic helper and cleaner
Travel related to household maintenance and management Domestic helper and cleaner
Caregiving services Caring for children Childcare worker
Teaching children Primary school teacher
Escorting children Childcare worker
Caring for adults Nurse
Escorting adults Nurse
Travel related to care of adults, children, and others Childcare worker and nursea The occupation of “chef” also included people working as cooks in small hotels and restaurants. Source: Authors’ compilation based on Government of Bhutan, Ministry of Labour and Human Resources and the International Labour Organization (ILO). 2015. Labour Force Survey Report 2015. Thimphu.
12 ADB Economics Working Paper Series No. 624
C. Methodology
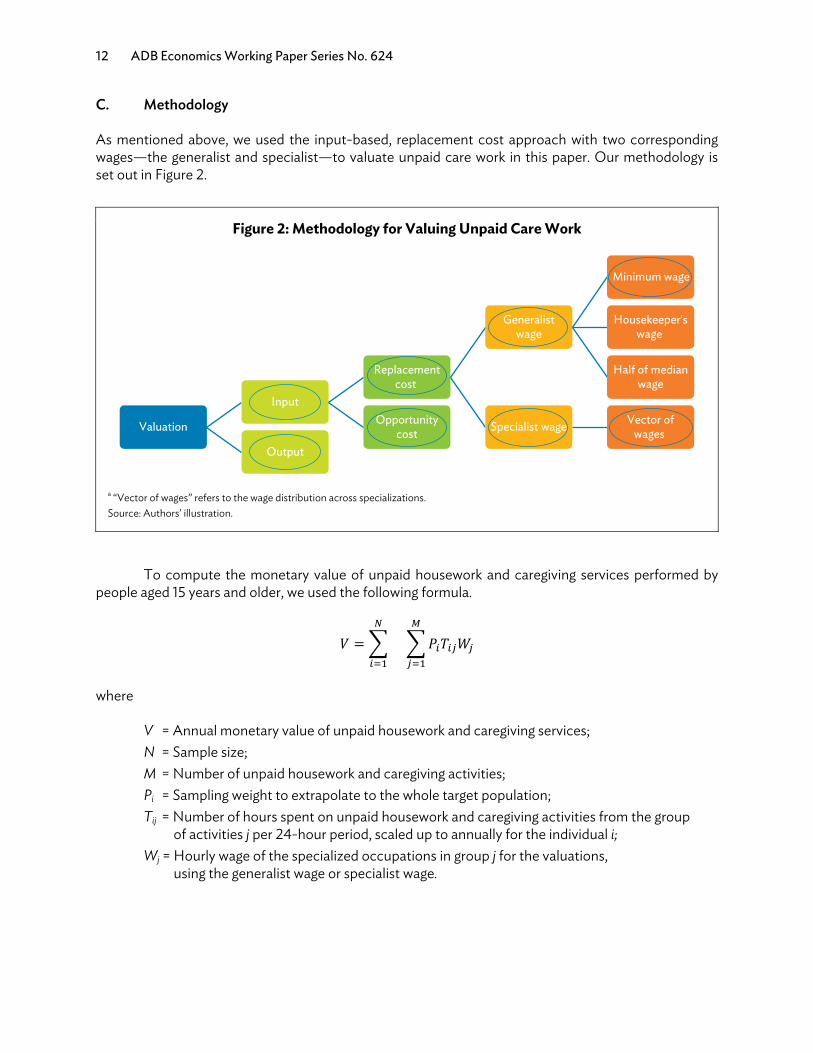
As mentioned above, we used the input-based, replacement cost approach with two corresponding wages—the generalist and specialist—to valuate unpaid care work in this paper. Our methodology is set out in Figure 2.
Figure 2: Methodology for Valuing Unpaid Care Work
a “Vector of wages” refers to the wage distribution across specializations. Source: Authors’ illustration.
To compute the monetary value of unpaid housework and caregiving services performed by people aged 15 years and older, we used the following formula.
𝑉 = 𝑃 𝑇 𝑊
where
V = Annual monetary value of unpaid housework and caregiving services; N = Sample size; M = Number of unpaid housework and caregiving activities; Pi = Sampling weight to extrapolate to the whole target population; Tij = Number of hours spent on unpaid housework and caregiving activities from the group of activities j per 24-hour period, scaled up to annually for the individual i; Wj = Hourly wage of the specialized occupations in group j for the valuations, using the generalist wage or specialist wage.
Valuation
Input
Replacementcost
Generalistwage
Minimum wage
Housekeeper'swage
Half of medianwage
Specialist wage Vector ofwages
Opportunitycost
Output
Valuing Unpaid Care Work in Bhutan 13
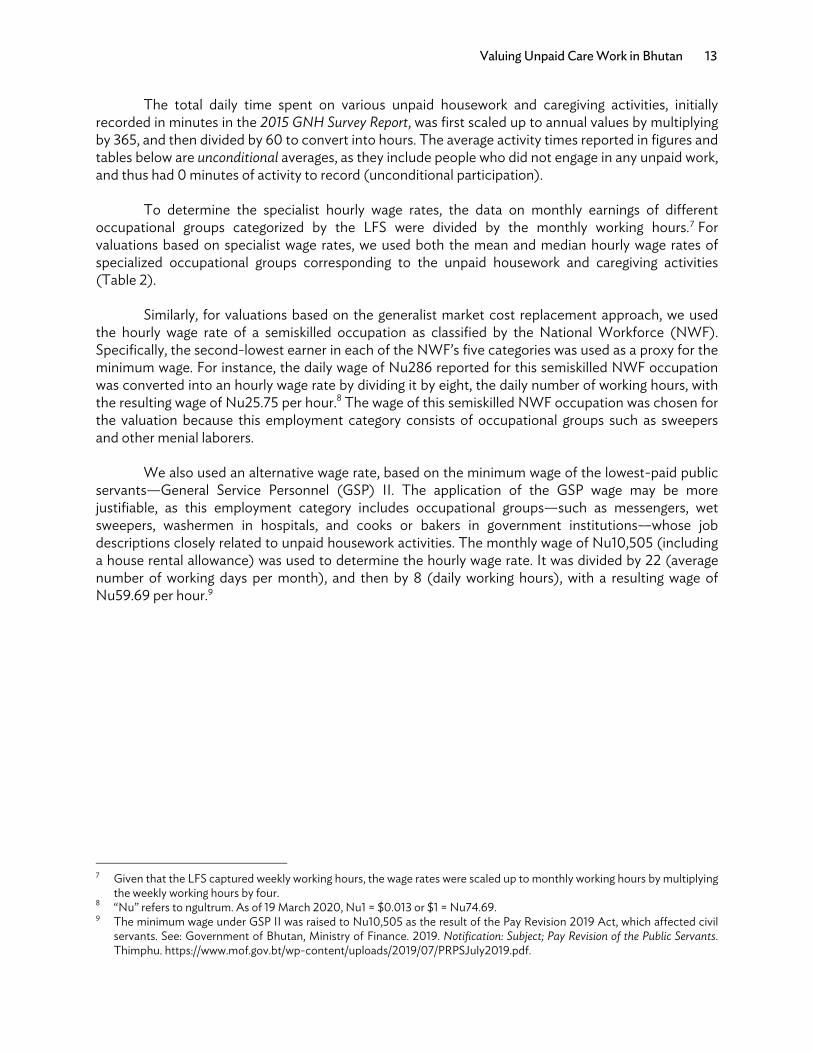
The total daily time spent on various unpaid housework and caregiving activities, initially recorded in minutes in the 2015 GNH Survey Report, was first scaled up to annual values by multiplying by 365, and then divided by 60 to convert into hours. The average activity times reported in figures and tables below are unconditional averages, as they include people who did not engage in any unpaid work, and thus had 0 minutes of activity to record (unconditional participation).
To determine the specialist hourly wage rates, the data on monthly earnings of different occupational groups categorized by the LFS were divided by the monthly working hours.7 For valuations based on specialist wage rates, we used both the mean and median hourly wage rates of specialized occupational groups corresponding to the unpaid housework and caregiving activities (Table 2).
Similarly, for valuations based on the generalist market cost replacement approach, we used the hourly wage rate of a semiskilled occupation as classified by the National Workforce (NWF). Specifically, the second-lowest earner in each of the NWF’s five categories was used as a proxy for the minimum wage. For instance, the daily wage of Nu286 reported for this semiskilled NWF occupation was converted into an hourly wage rate by dividing it by eight, the daily number of working hours, with the resulting wage of Nu25.75 per hour.8 The wage of this semiskilled NWF occupation was chosen for the valuation because this employment category consists of occupational groups such as sweepers and other menial laborers.
We also used an alternative wage rate, based on the minimum wage of the lowest-paid public servants—General Service Personnel (GSP) II. The application of the GSP wage may be more justifiable, as this employment category includes occupational groups—such as messengers, wet sweepers, washermen in hospitals, and cooks or bakers in government institutions—whose job descriptions closely related to unpaid housework activities. The monthly wage of Nu10,505 (including a house rental allowance) was used to determine the hourly wage rate. It was divided by 22 (average number of working days per month), and then by 8 (daily working hours), with a resulting wage of Nu59.69 per hour.9
7 Given that the LFS captured weekly working hours, the wage rates were scaled up to monthly working hours by multiplying
the weekly working hours by four. 8 “Nu” refers to ngultrum. As of 19 March 2020, Nu1 = $0.013 or $1 = Nu74.69. 9 The minimum wage under GSP II was raised to Nu10,505 as the result of the Pay Revision 2019 Act, which affected civil
servants. See: Government of Bhutan, Ministry of Finance. 2019. Notification: Subject; Pay Revision of the Public Servants. Thimphu. https://www.mof.gov.bt/wp-content/uploads/2019/07/PRPSJuly2019.pdf.
14 ADB Economics Working Paper Series No. 624
IV. FINDINGS BASED ON THE 2015 TIME USE SURVEY
A. Time Spent on Paid Work and Unpaid Caregiving Work by Gender
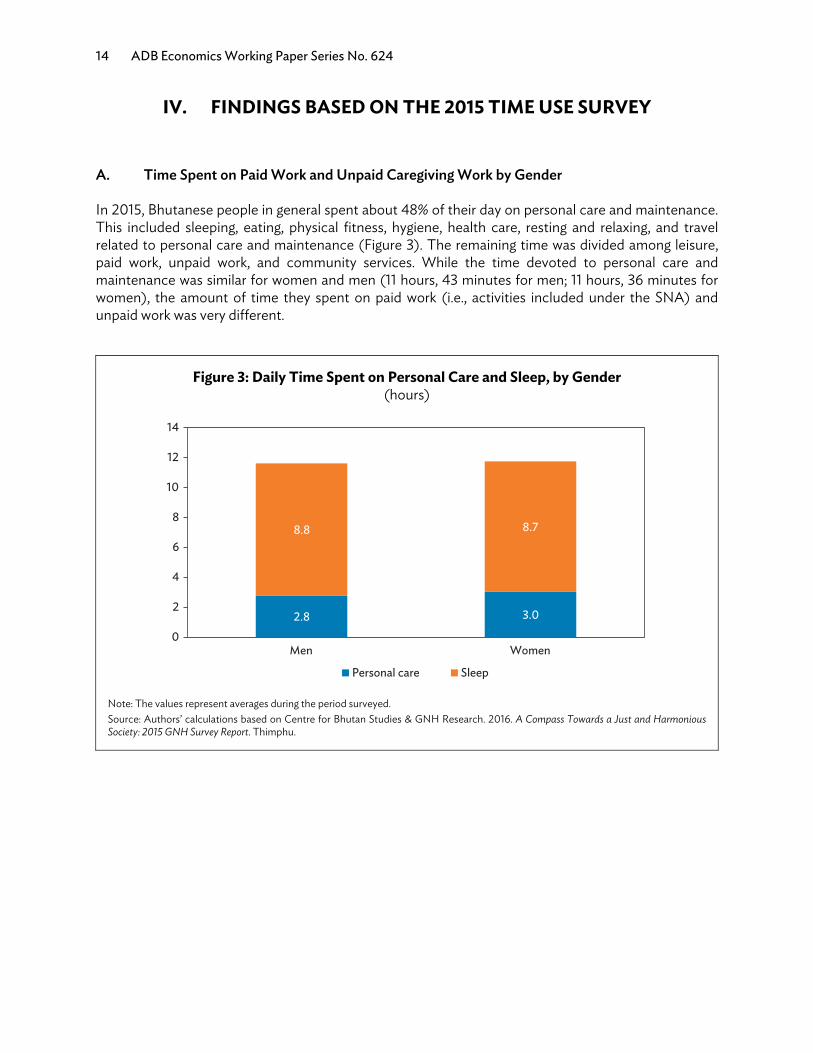
In 2015, Bhutanese people in general spent about 48% of their day on personal care and maintenance. This included sleeping, eating, physical fitness, hygiene, health care, resting and relaxing, and travel related to personal care and maintenance (Figure 3). The remaining time was divided among leisure, paid work, unpaid work, and community services. While the time devoted to personal care and maintenance was similar for women and men (11 hours, 43 minutes for men; 11 hours, 36 minutes for women), the amount of time they spent on paid work (i.e., activities included under the SNA) and unpaid work was very different.
Figure 3: Daily Time Spent on Personal Care and Sleep, by Gender (hours)
Note: The values represent averages during the period surveyed. Source: Authors’ calculations based on Centre for Bhutan Studies & GNH Research. 2016. A Compass Towards a Just and Harmonious Society: 2015 GNH Survey Report. Thimphu.
2.8 3.0
8.8 8.7
0
2
4
6
8
10
12
14
Men
Personal care Sleep
Women
Valuing Unpaid Care Work in Bhutan 15
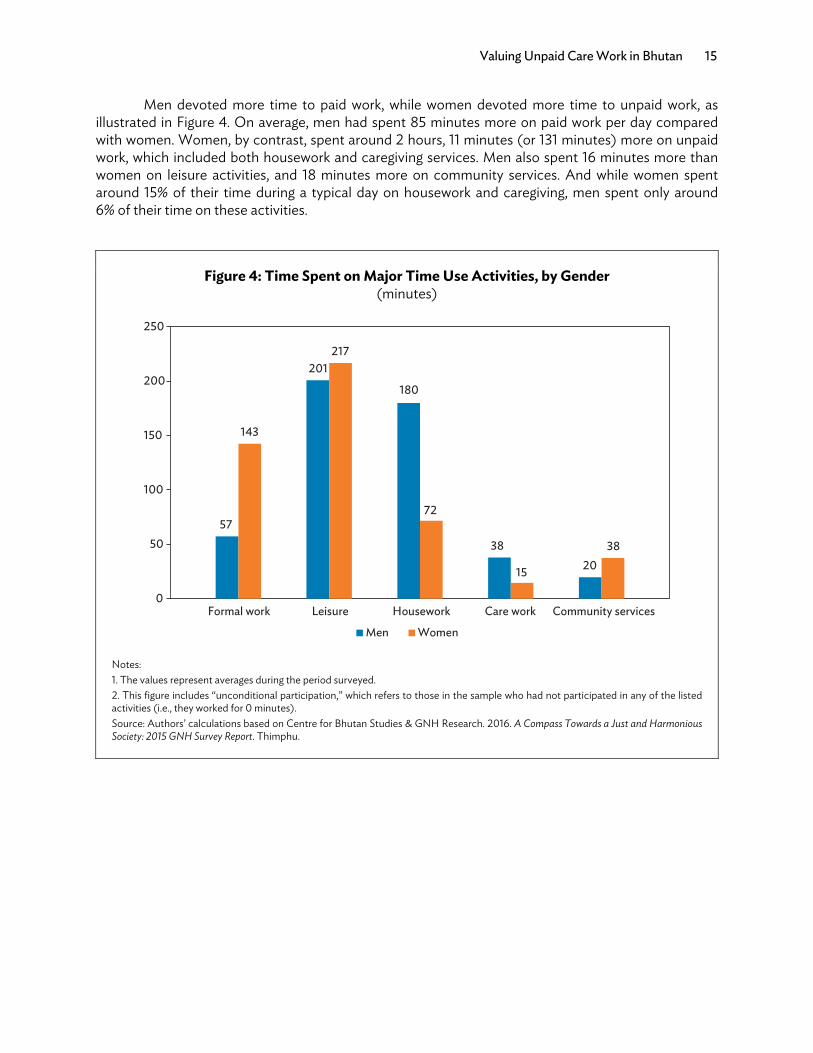
Men devoted more time to paid work, while women devoted more time to unpaid work, as illustrated in Figure 4. On average, men had spent 85 minutes more on paid work per day compared with women. Women, by contrast, spent around 2 hours, 11 minutes (or 131 minutes) more on unpaid work, which included both housework and caregiving services. Men also spent 16 minutes more than women on leisure activities, and 18 minutes more on community services. And while women spent around 15% of their time during a typical day on housework and caregiving, men spent only around 6% of their time on these activities.
Figure 4: Time Spent on Major Time Use Activities, by Gender (minutes)
Notes: 1. The values represent averages during the period surveyed. 2. This figure includes “unconditional participation,” which refers to those in the sample who had not participated in any of the listed activities (i.e., they worked for 0 minutes). Source: Authors’ calculations based on Centre for Bhutan Studies & GNH Research. 2016. A Compass Towards a Just and Harmonious Society: 2015 GNH Survey Report. Thimphu.
57
201
180
38
20
143
217
72
15
38
0
50
100
150
200
250
Formal work Leisure Housework Care work Community services
Men Women
16 ADB Economics Working Paper Series No. 624
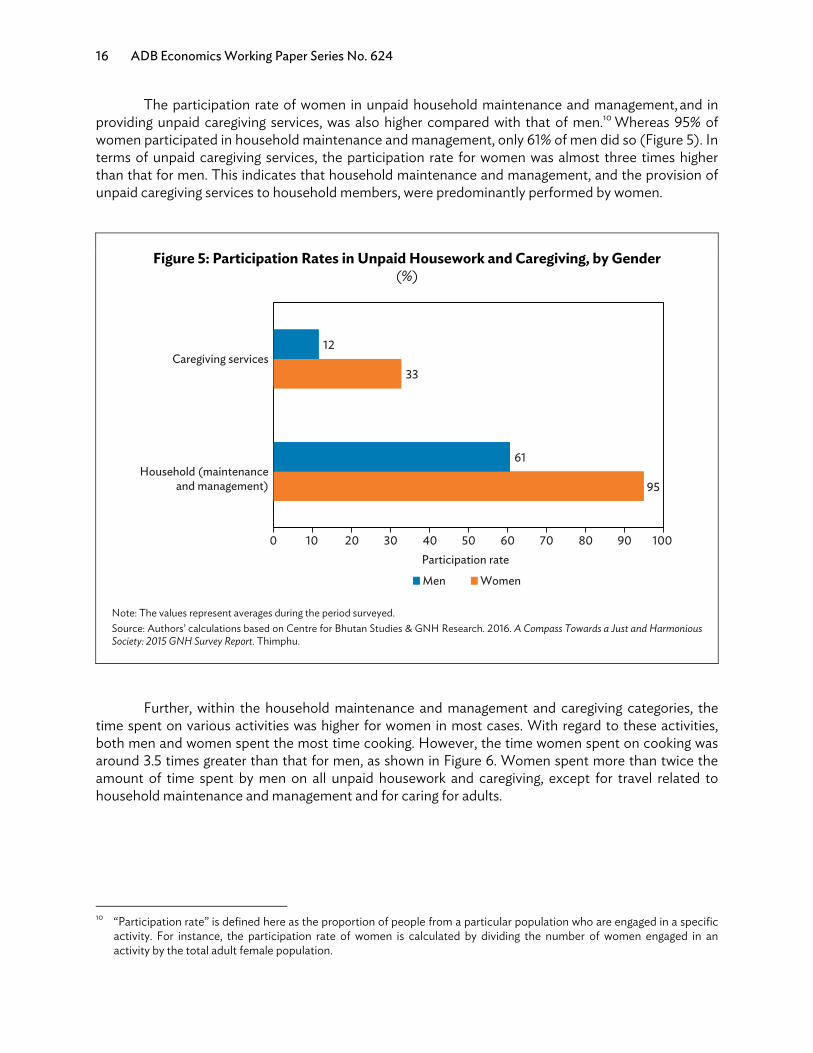
The participation rate of women in unpaid household maintenance and management, and in providing unpaid caregiving services, was also higher compared with that of men.10 Whereas 95% of women participated in household maintenance and management, only 61% of men did so (Figure 5). In terms of unpaid caregiving services, the participation rate for women was almost three times higher than that for men. This indicates that household maintenance and management, and the provision of unpaid caregiving services to household members, were predominantly performed by women.
Figure 5: Participation Rates in Unpaid Housework and Caregiving, by Gender (%)
Note: The values represent averages during the period surveyed. Source: Authors’ calculations based on Centre for Bhutan Studies & GNH Research. 2016. A Compass Towards a Just and Harmonious Society: 2015 GNH Survey Report. Thimphu.
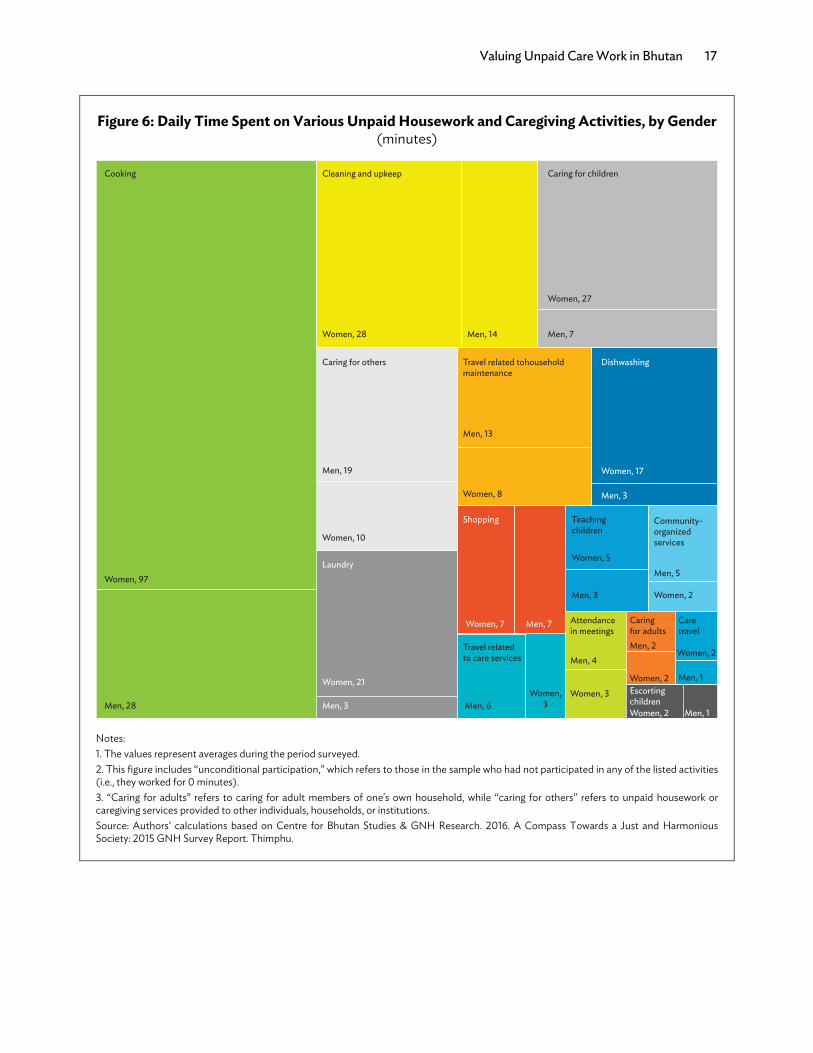
Further, within the household maintenance and management and caregiving categories, the time spent on various activities was higher for women in most cases. With regard to these activities, both men and women spent the most time cooking. However, the time women spent on cooking was around 3.5 times greater than that for men, as shown in Figure 6. Women spent more than twice the amount of time spent by men on all unpaid housework and caregiving, except for travel related to household maintenance and management and for caring for adults.
10 “Participation rate” is defined here as the proportion of people from a particular population who are engaged in a specific
activity. For instance, the participation rate of women is calculated by dividing the number of women engaged in an activity by the total adult female population.
95
33
61
12
0 10 20 30 40 50 60 70 80 90 100
Household (maintenanceand management)
Caregiving services
Participation rate Men Women
Valuing Unpaid Care Work in Bhutan 17
Figure 6: Daily Time Spent on Various Unpaid Housework and Caregiving Activities, by Gender (minutes)
Notes: 1. The values represent averages during the period surveyed. 2. This figure includes “unconditional participation,” which refers to those in the sample who had not participated in any of the listed activities (i.e., they worked for 0 minutes). 3. “Caring for adults” refers to caring for adult members of one's own household, while “caring for others” refers to unpaid housework or caregiving services provided to other individuals, households, or institutions. Source: Authors’ calculations based on Centre for Bhutan Studies & GNH Research. 2016. A Compass Towards a Just and Harmonious Society: 2015 GNH Survey Report. Thimphu.
Cooking Caring for children
Women, 27
Men, 7
Men, 28 Men, 3
Men, 19
Men, 13
Men, 3
Men, 5
Men, 3 Women, 2
Caring for adults
Escortingchildren
Caretravel
Women, 17
Women, 5
Shopping
Travel related to care services
Attendancein meetings
Men, 4
Teaching children
Community-organizedservices
Caring for others
Cleaning and upkeep
Women, 28 Men, 14
Travel related tohousehold maintenance
Dishwashing
Women, 97
Women, 21
Women, 10
Women, 8
Women, 7 Men, 7
Men, 6Women,
3Women, 3
Women, 2
Laundry
Men, 2
Men, 1Women, 2
Men, 1 Women, 2
18 ADB Economics Working Paper Series No. 624
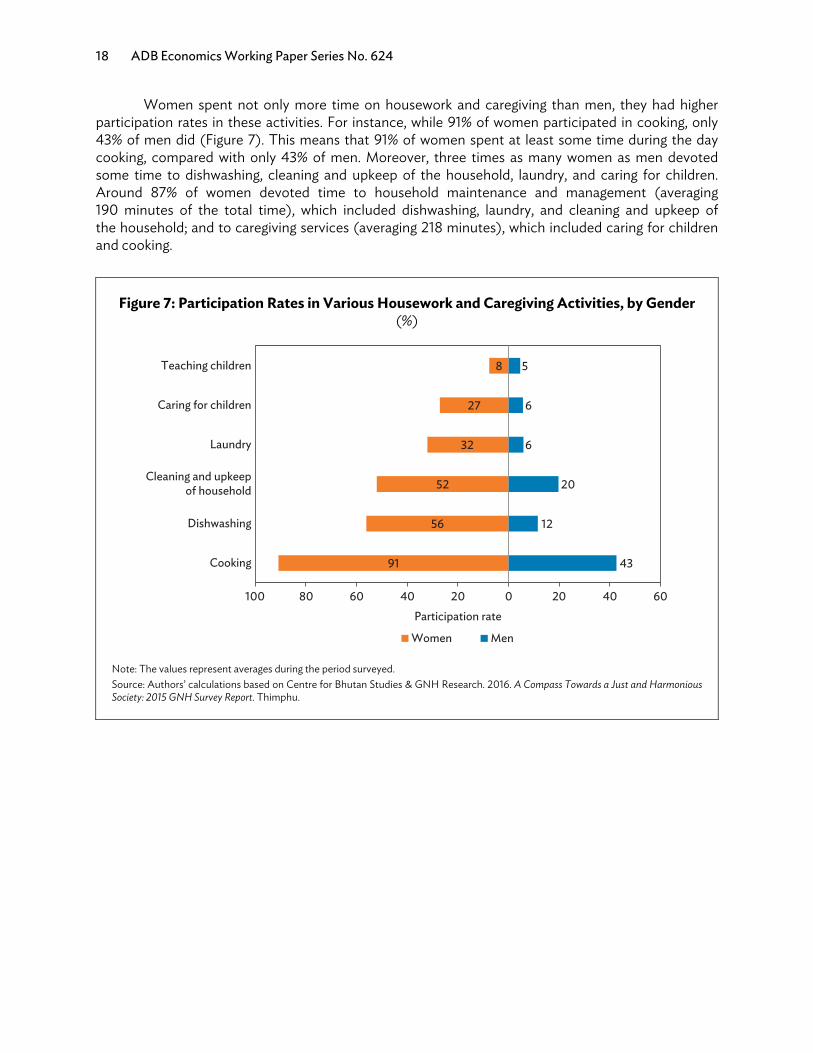
Women spent not only more time on housework and caregiving than men, they had higher participation rates in these activities. For instance, while 91% of women participated in cooking, only 43% of men did (Figure 7). This means that 91% of women spent at least some time during the day cooking, compared with only 43% of men. Moreover, three times as many women as men devoted some time to dishwashing, cleaning and upkeep of the household, laundry, and caring for children. Around 87% of women devoted time to household maintenance and management (averaging 190 minutes of the total time), which included dishwashing, laundry, and cleaning and upkeep of the household; and to caregiving services (averaging 218 minutes), which included caring for children and cooking.
Figure 7: Participation Rates in Various Housework and Caregiving Activities, by Gender (%)
Note: The values represent averages during the period surveyed. Source: Authors’ calculations based on Centre for Bhutan Studies & GNH Research. 2016. A Compass Towards a Just and Harmonious Society: 2015 GNH Survey Report. Thimphu.
91
56
52
32
27
8
43
12
20
6
6
5
100 80 60 40 20 200 40 60
Cooking
Dishwashing
Cleaning and upkeepof household
Laundry
Caring for children
Teaching children
Participation rate
Women Men
Valuing Unpaid Care Work in Bhutan 19
B. Time Spent on Unpaid Care Work by Socioeconomic Demographics
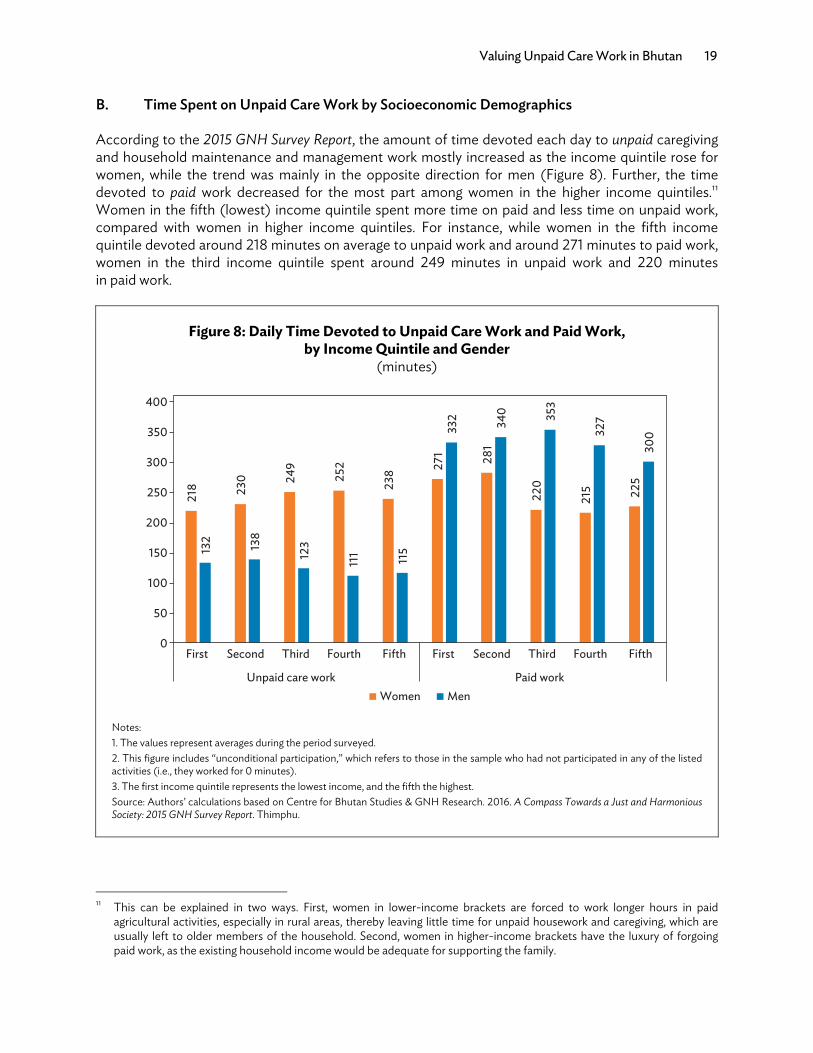
According to the 2015 GNH Survey Report, the amount of time devoted each day to unpaid caregiving and household maintenance and management work mostly increased as the income quintile rose for women, while the trend was mainly in the opposite direction for men (Figure 8). Further, the time devoted to paid work decreased for the most part among women in the higher income quintiles.11 Women in the fifth (lowest) income quintile spent more time on paid and less time on unpaid work, compared with women in higher income quintiles. For instance, while women in the fifth income quintile devoted around 218 minutes on average to unpaid work and around 271 minutes to paid work, women in the third income quintile spent around 249 minutes in unpaid work and 220 minutes in paid work.
Figure 8: Daily Time Devoted to Unpaid Care Work and Paid Work, by Income Quintile and Gender
(minutes)
Notes: 1. The values represent averages during the period surveyed. 2. This figure includes “unconditional participation,” which refers to those in the sample who had not participated in any of the listed activities (i.e., they worked for 0 minutes). 3. The first income quintile represents the lowest income, and the fifth the highest. Source: Authors’ calculations based on Centre for Bhutan Studies & GNH Research. 2016. A Compass Towards a Just and Harmonious Society: 2015 GNH Survey Report. Thimphu.
11 This can be explained in two ways. First, women in lower-income brackets are forced to work longer hours in paid
agricultural activities, especially in rural areas, thereby leaving little time for unpaid housework and caregiving, which are usually left to older members of the household. Second, women in higher-income brackets have the luxury of forgoing paid work, as the existing household income would be adequate for supporting the family.
218
230
249
252
238
271
281
220
215
225
132
138
123
111
115
332
340
353
327
300
0
50
100
150
200
250
300
350
400
First Second Third Fourth Fifth First Second Third Fourth Fifth
Unpaid care work Paid workWomen Men
20 ADB Economics Working Paper Series No. 624
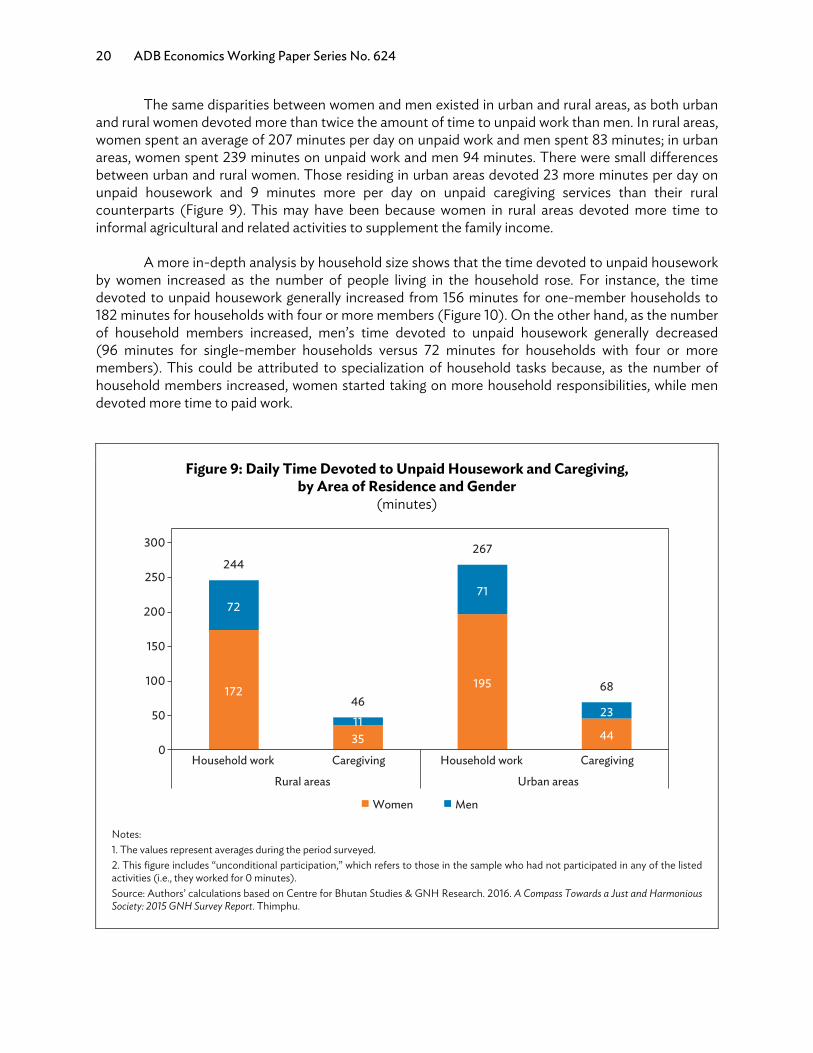
The same disparities between women and men existed in urban and rural areas, as both urban and rural women devoted more than twice the amount of time to unpaid work than men. In rural areas, women spent an average of 207 minutes per day on unpaid work and men spent 83 minutes; in urban areas, women spent 239 minutes on unpaid work and men 94 minutes. There were small differences between urban and rural women. Those residing in urban areas devoted 23 more minutes per day on unpaid housework and 9 minutes more per day on unpaid caregiving services than their rural counterparts (Figure 9). This may have been because women in rural areas devoted more time to informal agricultural and related activities to supplement the family income.
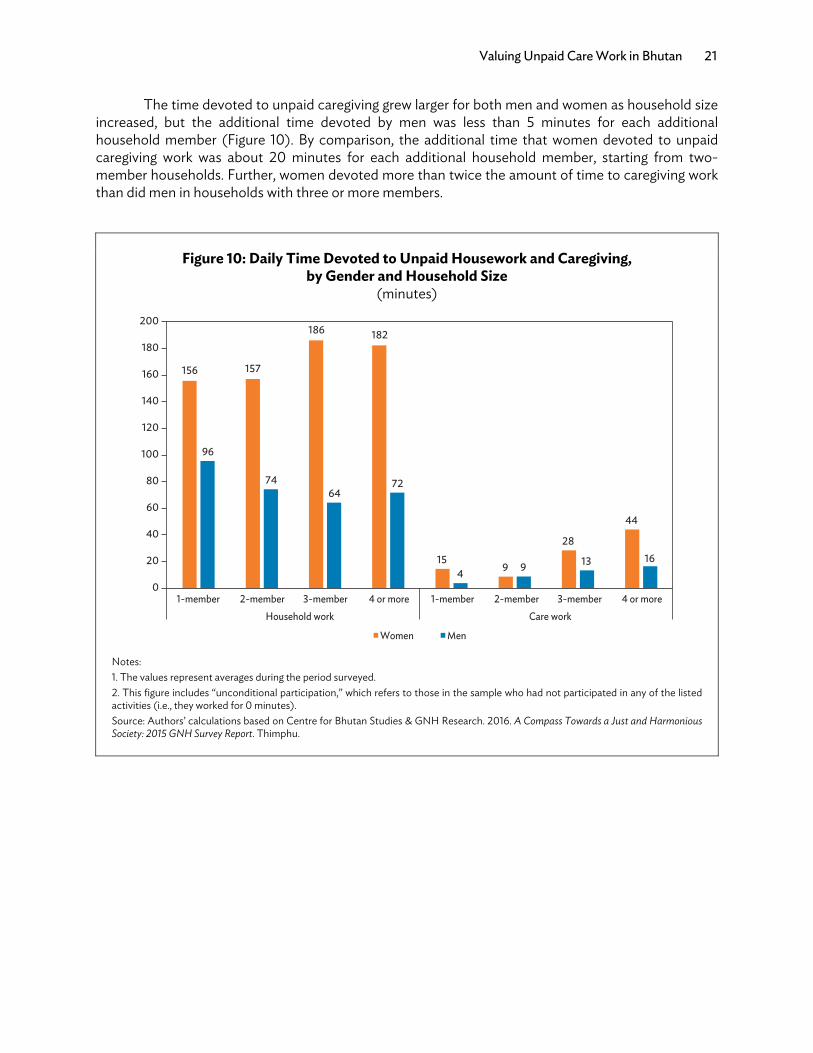
A more in-depth analysis by household size shows that the time devoted to unpaid housework by women increased as the number of people living in the household rose. For instance, the time devoted to unpaid housework generally increased from 156 minutes for one-member households to 182 minutes for households with four or more members (Figure 10). On the other hand, as the number of household members increased, men’s time devoted to unpaid housework generally decreased (96 minutes for single-member households versus 72 minutes for households with four or more members). This could be attributed to specialization of household tasks because, as the number of household members increased, women started taking on more household responsibilities, while men devoted more time to paid work.
Figure 9: Daily Time Devoted to Unpaid Housework and Caregiving, by Area of Residence and Gender
(minutes)
Notes: 1. The values represent averages during the period surveyed. 2. This figure includes “unconditional participation,” which refers to those in the sample who had not participated in any of the listed activities (i.e., they worked for 0 minutes). Source: Authors’ calculations based on Centre for Bhutan Studies & GNH Research. 2016. A Compass Towards a Just and Harmonious Society: 2015 GNH Survey Report. Thimphu.
172
35
195
44
72
11
71
23
244
46
267
68
0
50
100
150
200
250
300
Household work Caregiving Household work Caregiving
Rural areas Urban areas
Women Men
Valuing Unpaid Care Work in Bhutan 21
The time devoted to unpaid caregiving grew larger for both men and women as household size increased, but the additional time devoted by men was less than 5 minutes for each additional household member (Figure 10). By comparison, the additional time that women devoted to unpaid caregiving work was about 20 minutes for each additional household member, starting from two-member households. Further, women devoted more than twice the amount of time to caregiving work than did men in households with three or more members.
Figure 10: Daily Time Devoted to Unpaid Housework and Caregiving, by Gender and Household Size
(minutes)
Notes: 1. The values represent averages during the period surveyed. 2. This figure includes “unconditional participation,” which refers to those in the sample who had not participated in any of the listed activities (i.e., they worked for 0 minutes). Source: Authors’ calculations based on Centre for Bhutan Studies & GNH Research. 2016. A Compass Towards a Just and Harmonious Society: 2015 GNH Survey Report. Thimphu.
156 157
186 182
15 9
28
44
96
7464
72
4 9 13 16
0
20
40
60
80
100
120
140
160
180
200
1-member 2-member 3-member 4 or more 1-member 2-member 3-member 4 or moreHousehold work Care work
Women Men
22 ADB Economics Working Paper Series No. 624
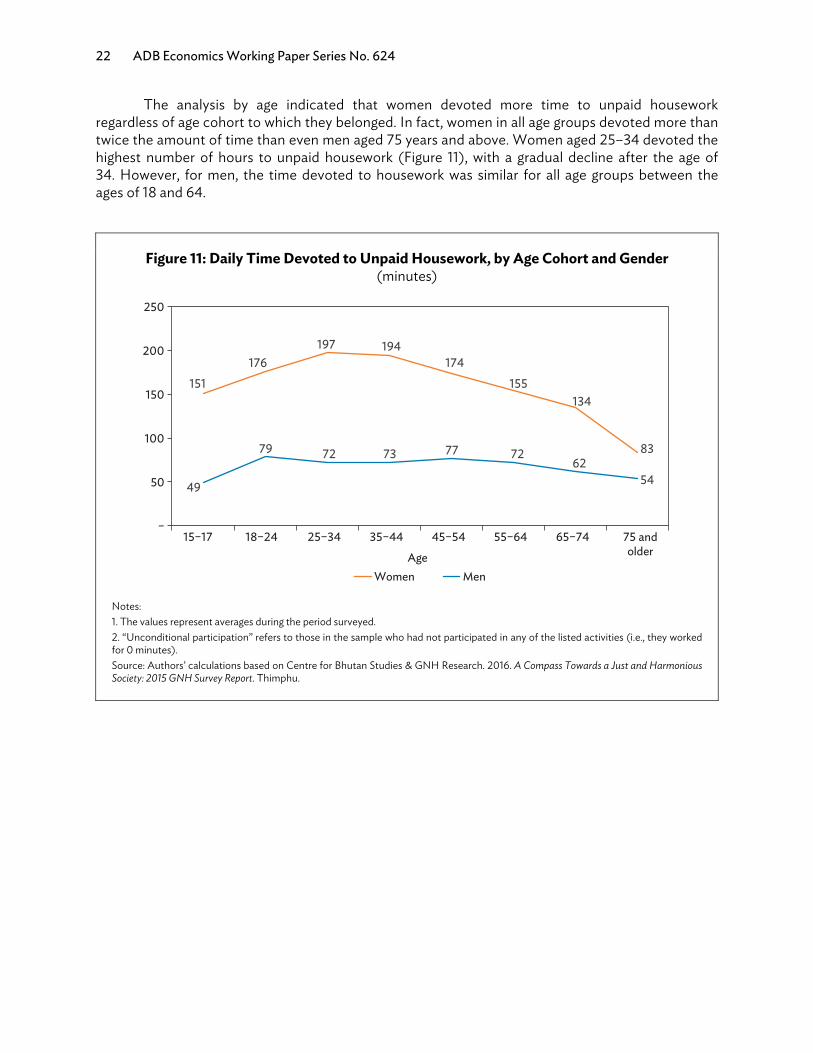
The analysis by age indicated that women devoted more time to unpaid housework regardless of age cohort to which they belonged. In fact, women in all age groups devoted more than twice the amount of time than even men aged 75 years and above. Women aged 25–34 devoted the highest number of hours to unpaid housework (Figure 11), with a gradual decline after the age of 34. However, for men, the time devoted to housework was similar for all age groups between the ages of 18 and 64.
Figure 11: Daily Time Devoted to Unpaid Housework, by Age Cohort and Gender(minutes)
Notes: 1. The values represent averages during the period surveyed. 2. “Unconditional participation” refers to those in the sample who had not participated in any of the listed activities (i.e., they worked for 0 minutes). Source: Authors’ calculations based on Centre for Bhutan Studies & GNH Research. 2016. A Compass Towards a Just and Harmonious Society: 2015 GNH Survey Report. Thimphu.
–
50
100
150
200
250
15–17 18–24 25–34 35–44 45–54 55–64 65–74 75 andolderAge
Women Men
49
79
72
73
77
72
62 54
151 176
197 194 174
155 134
83
Valuing Unpaid Care Work in Bhutan 23
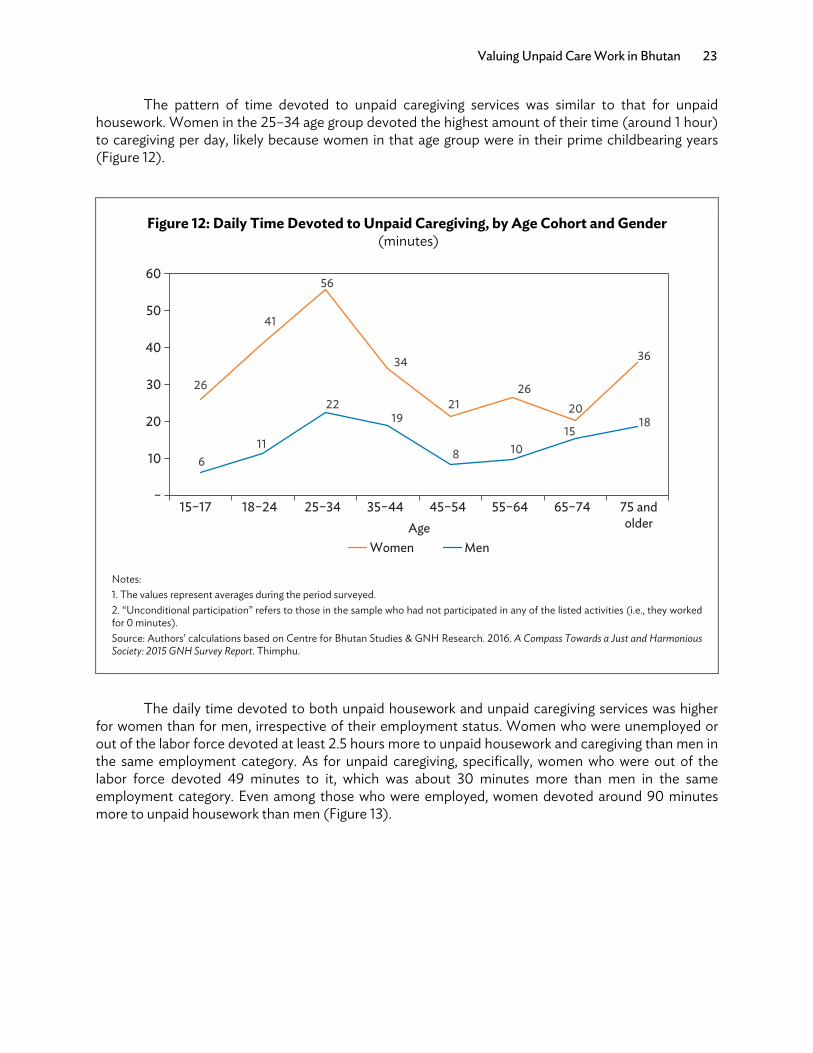
The pattern of time devoted to unpaid caregiving services was similar to that for unpaid housework. Women in the 25–34 age group devoted the highest amount of their time (around 1 hour) to caregiving per day, likely because women in that age group were in their prime childbearing years (Figure 12).
Figure 12: Daily Time Devoted to Unpaid Caregiving, by Age Cohort and Gender (minutes)
Notes: 1. The values represent averages during the period surveyed. 2. “Unconditional participation” refers to those in the sample who had not participated in any of the listed activities (i.e., they worked for 0 minutes). Source: Authors’ calculations based on Centre for Bhutan Studies & GNH Research. 2016. A Compass Towards a Just and Harmonious Society: 2015 GNH Survey Report. Thimphu.
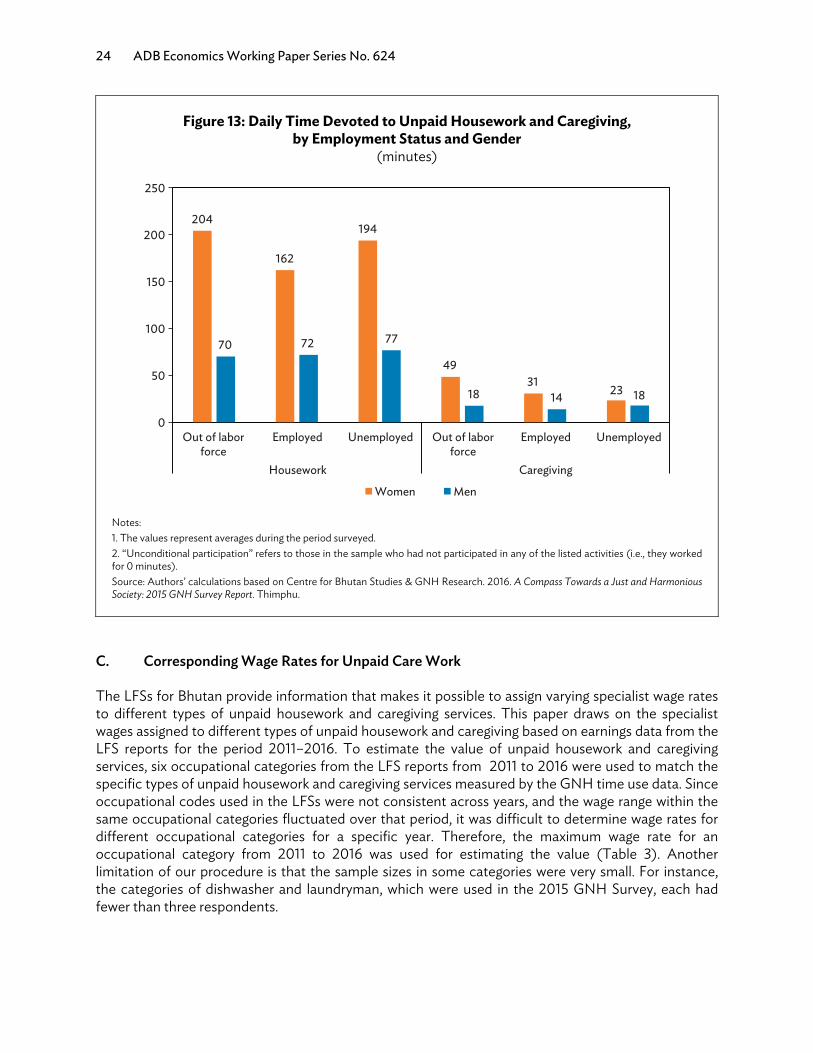
The daily time devoted to both unpaid housework and unpaid caregiving services was higher for women than for men, irrespective of their employment status. Women who were unemployed or out of the labor force devoted at least 2.5 hours more to unpaid housework and caregiving than men in the same employment category. As for unpaid caregiving, specifically, women who were out of the labor force devoted 49 minutes to it, which was about 30 minutes more than men in the same employment category. Even among those who were employed, women devoted around 90 minutes more to unpaid housework than men (Figure 13).
–
10
20
30
40
50
60
15–17 18–24 25–34 35–44 45–54 55–64 65–74 75 andolderAge
Women Men
26
41
56
34
21
26
20
36
6
11
22
19
8
10
15
18
24 ADB Economics Working Paper Series No. 624
Figure 13: Daily Time Devoted to Unpaid Housework and Caregiving, by Employment Status and Gender
(minutes)
Notes: 1. The values represent averages during the period surveyed. 2. “Unconditional participation” refers to those in the sample who had not participated in any of the listed activities (i.e., they worked for 0 minutes). Source: Authors’ calculations based on Centre for Bhutan Studies & GNH Research. 2016. A Compass Towards a Just and Harmonious Society: 2015 GNH Survey Report. Thimphu.
C. Corresponding Wage Rates for Unpaid Care Work
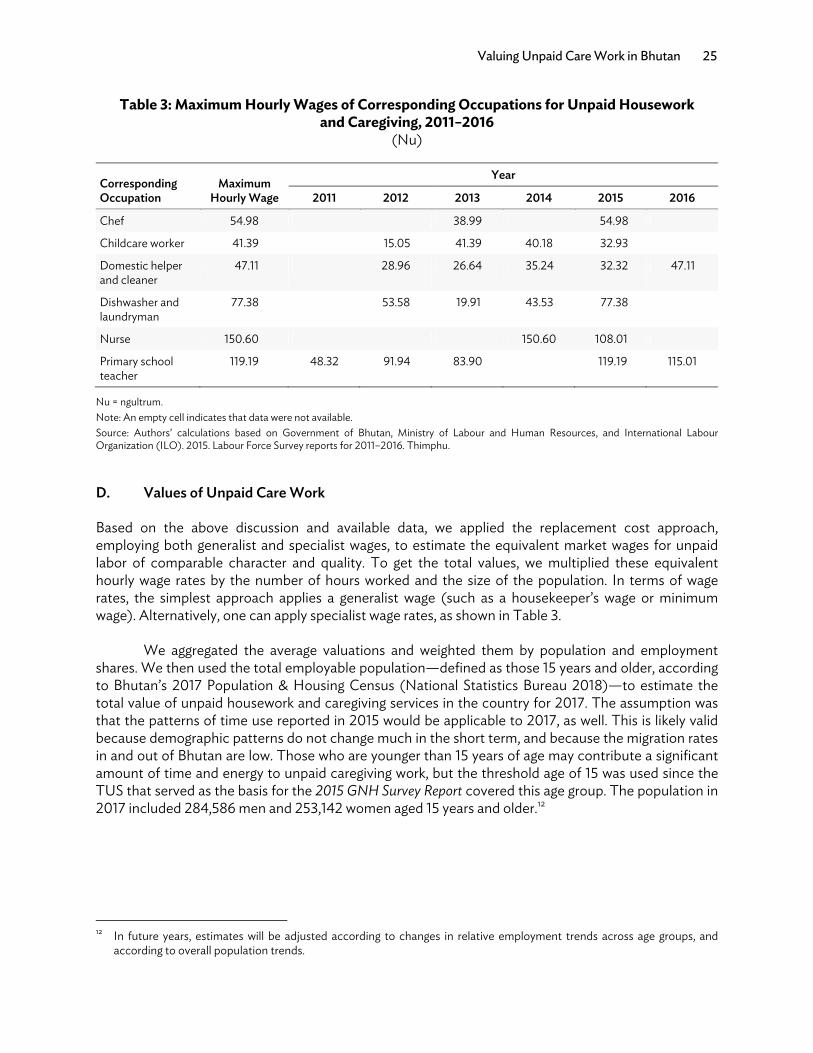
The LFSs for Bhutan provide information that makes it possible to assign varying specialist wage rates to different types of unpaid housework and caregiving services. This paper draws on the specialist wages assigned to different types of unpaid housework and caregiving based on earnings data from the LFS reports for the period 2011–2016. To estimate the value of unpaid housework and caregiving services, six occupational categories from the LFS reports from 2011 to 2016 were used to match the specific types of unpaid housework and caregiving services measured by the GNH time use data. Since occupational codes used in the LFSs were not consistent across years, and the wage range within the same occupational categories fluctuated over that period, it was difficult to determine wage rates for different occupational categories for a specific year. Therefore, the maximum wage rate for an occupational category from 2011 to 2016 was used for estimating the value (Table 3). Another limitation of our procedure is that the sample sizes in some categories were very small. For instance, the categories of dishwasher and laundryman, which were used in the 2015 GNH Survey, each had fewer than three respondents.
204
162
194
49 31
23
70 72 77
18 14 18
0
50
100
150
200
250
Out of laborforce
Employed Unemployed Out of laborforce
Employed Unemployed
Housework Caregiving
Women Men
Valuing Unpaid Care Work in Bhutan 25
Table 3: Maximum Hourly Wages of Corresponding Occupations for Unpaid Housework and Caregiving, 2011–2016
(Nu)
Corresponding Occupation
Maximum Hourly Wage
Year
2011 2012 2013 2014 2015 2016
Chef 54.98 38.99 54.98
Childcare worker 41.39 15.05 41.39 40.18 32.93
Domestic helper and cleaner
47.11 28.96 26.64 35.24 32.32 47.11
Dishwasher and laundryman
77.38 53.58 19.91 43.53 77.38
Nurse 150.60 150.60 108.01
Primary school teacher
119.19 48.32 91.94 83.90 119.19 115.01
Nu = ngultrum. Note: An empty cell indicates that data were not available. Source: Authors’ calculations based on Government of Bhutan, Ministry of Labour and Human Resources, and International Labour Organization (ILO). 2015. Labour Force Survey reports for 2011–2016. Thimphu.
D. Values of Unpaid Care Work
Based on the above discussion and available data, we applied the replacement cost approach, employing both generalist and specialist wages, to estimate the equivalent market wages for unpaid labor of comparable character and quality. To get the total values, we multiplied these equivalent hourly wage rates by the number of hours worked and the size of the population. In terms of wage rates, the simplest approach applies a generalist wage (such as a housekeeper’s wage or minimum wage). Alternatively, one can apply specialist wage rates, as shown in Table 3.
We aggregated the average valuations and weighted them by population and employment shares. We then used the total employable population—defined as those 15 years and older, according to Bhutan’s 2017 Population & Housing Census (National Statistics Bureau 2018)—to estimate the total value of unpaid housework and caregiving services in the country for 2017. The assumption was that the patterns of time use reported in 2015 would be applicable to 2017, as well. This is likely valid because demographic patterns do not change much in the short term, and because the migration rates in and out of Bhutan are low. Those who are younger than 15 years of age may contribute a significant amount of time and energy to unpaid caregiving work, but the threshold age of 15 was used since the TUS that served as the basis for the 2015 GNH Survey Report covered this age group. The population in 2017 included 284,586 men and 253,142 women aged 15 years and older.12
12 In future years, estimates will be adjusted according to changes in relative employment trends across age groups, and
according to overall population trends.
26 ADB Economics Working Paper Series No. 624
The gender gap is more pronounced in the aggregate. Estimates based on TUS data show that in 2017 women aged 15 and older in Bhutan spent about 310 million hours on unpaid housework and caregiving, while men aged 15 and older spent about 150 million hours. Of the time spent on unpaid work, women devoted about 90% to housework, compared with 83% for men. The gender gap in time spent on household maintenance and management was more significant than that for unpaid caregiving work. In other words, not only was the time spent on unpaid caregiving by both women and men relatively small compared with the time spent on household maintenance and management, the gender gap for unpaid caregiving was smaller—29 million hours for women versus 25 million hours for men.
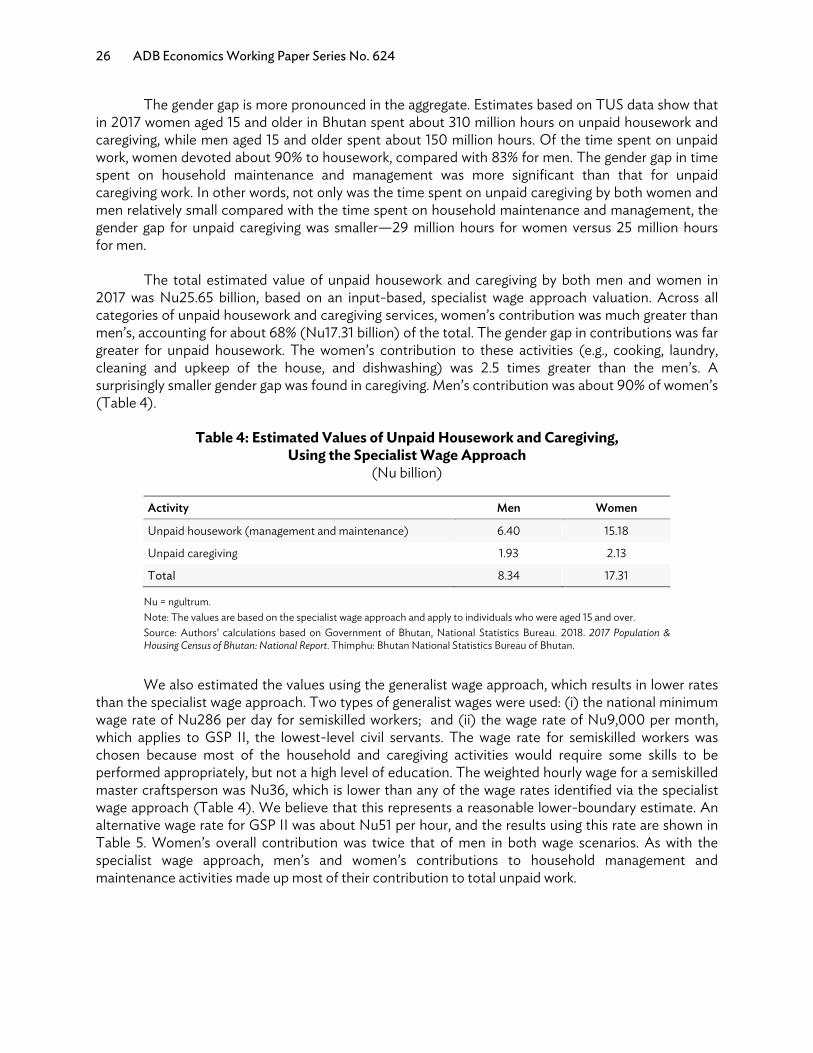
The total estimated value of unpaid housework and caregiving by both men and women in 2017 was Nu25.65 billion, based on an input-based, specialist wage approach valuation. Across all categories of unpaid housework and caregiving services, women’s contribution was much greater than men’s, accounting for about 68% (Nu17.31 billion) of the total. The gender gap in contributions was far greater for unpaid housework. The women’s contribution to these activities (e.g., cooking, laundry, cleaning and upkeep of the house, and dishwashing) was 2.5 times greater than the men’s. A surprisingly smaller gender gap was found in caregiving. Men’s contribution was about 90% of women’s (Table 4).
Table 4: Estimated Values of Unpaid Housework and Caregiving, Using the Specialist Wage Approach
(Nu billion)
Activity Men Women
Unpaid housework (management and maintenance) 6.40 15.18
Unpaid caregiving 1.93 2.13
Total 8.34 17.31
Nu = ngultrum. Note: The values are based on the specialist wage approach and apply to individuals who were aged 15 and over. Source: Authors’ calculations based on Government of Bhutan, National Statistics Bureau. 2018. 2017 Population & Housing Census of Bhutan: National Report. Thimphu: Bhutan National Statistics Bureau of Bhutan.
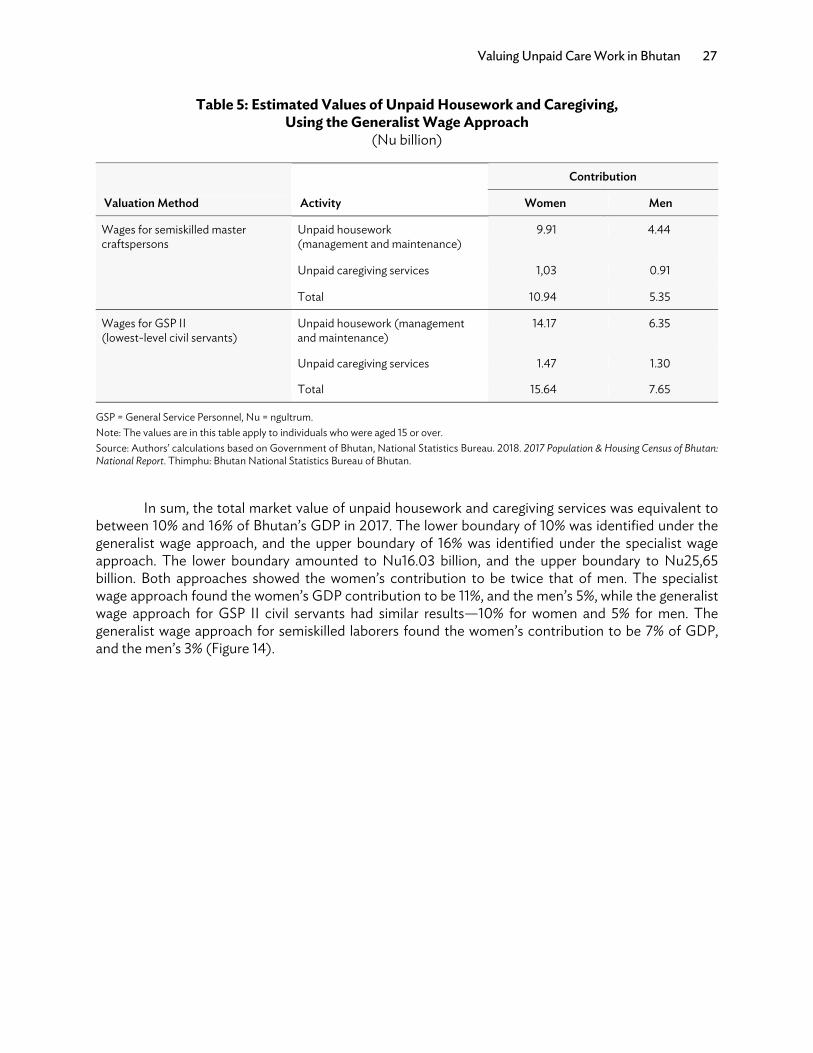
We also estimated the values using the generalist wage approach, which results in lower rates than the specialist wage approach. Two types of generalist wages were used: (i) the national minimum wage rate of Nu286 per day for semiskilled workers; and (ii) the wage rate of Nu9,000 per month, which applies to GSP II, the lowest-level civil servants. The wage rate for semiskilled workers was chosen because most of the household and caregiving activities would require some skills to be performed appropriately, but not a high level of education. The weighted hourly wage for a semiskilled master craftsperson was Nu36, which is lower than any of the wage rates identified via the specialist wage approach (Table 4). We believe that this represents a reasonable lower-boundary estimate. An alternative wage rate for GSP II was about Nu51 per hour, and the results using this rate are shown in Table 5. Women’s overall contribution was twice that of men in both wage scenarios. As with the specialist wage approach, men’s and women’s contributions to household management and maintenance activities made up most of their contribution to total unpaid work.
Valuing Unpaid Care Work in Bhutan 27
Table 5: Estimated Values of Unpaid Housework and Caregiving, Using the Generalist Wage Approach
(Nu billion)
Valuation Method Activity
Contribution
Women Men
Wages for semiskilled master craftspersons
Unpaid housework (management and maintenance)
9.91 4.44
Unpaid caregiving services 1,03 0.91
Total 10.94 5.35
Wages for GSP II (lowest-level civil servants)
Unpaid housework (management and maintenance)
14.17 6.35
Unpaid caregiving services 1.47 1.30
Total 15.64 7.65
GSP = General Service Personnel, Nu = ngultrum. Note: The values are in this table apply to individuals who were aged 15 or over. Source: Authors’ calculations based on Government of Bhutan, National Statistics Bureau. 2018. 2017 Population & Housing Census of Bhutan: National Report. Thimphu: Bhutan National Statistics Bureau of Bhutan.
In sum, the total market value of unpaid housework and caregiving services was equivalent to between 10% and 16% of Bhutan’s GDP in 2017. The lower boundary of 10% was identified under the generalist wage approach, and the upper boundary of 16% was identified under the specialist wage approach. The lower boundary amounted to Nu16.03 billion, and the upper boundary to Nu25,65 billion. Both approaches showed the women’s contribution to be twice that of men. The specialist wage approach found the women’s GDP contribution to be 11%, and the men’s 5%, while the generalist wage approach for GSP II civil servants had similar results—10% for women and 5% for men. The generalist wage approach for semiskilled laborers found the women’s contribution to be 7% of GDP, and the men’s 3% (Figure 14).
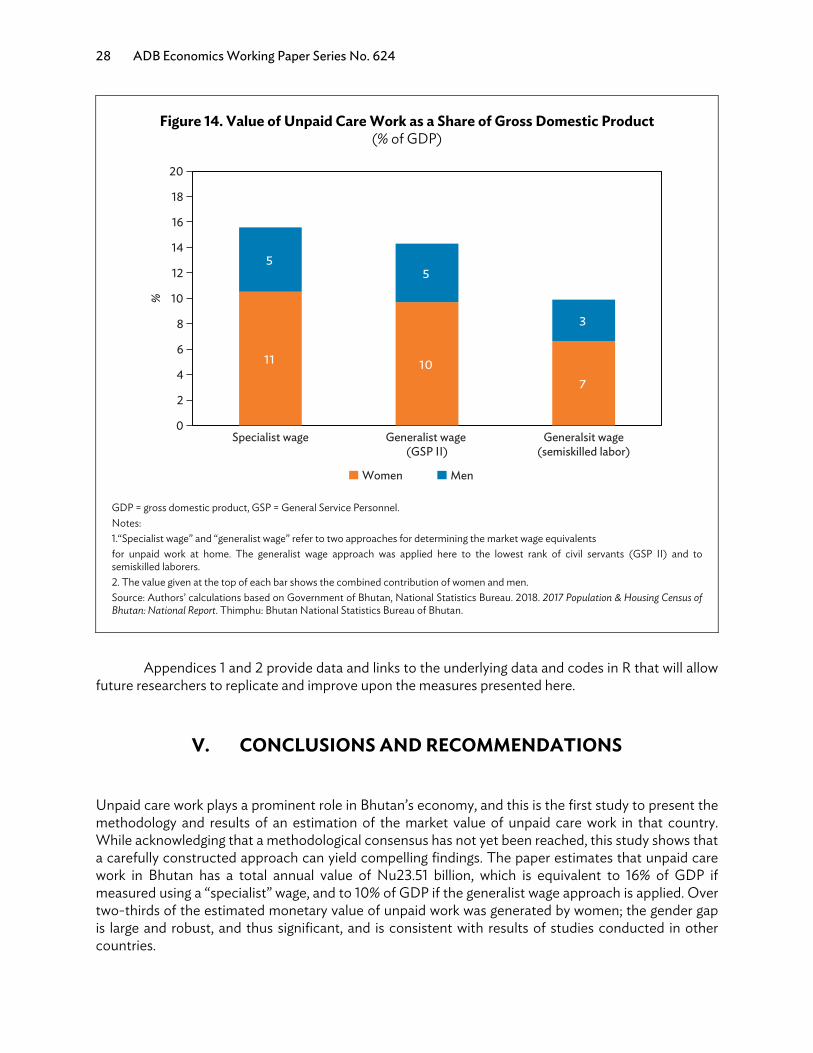
28 ADB Economics Working Paper Series No. 624
Figure 14. Value of Unpaid Care Work as a Share of Gross Domestic Product (% of GDP)
GDP = gross domestic product, GSP = General Service Personnel. Notes: 1.“Specialist wage” and “generalist wage” refer to two approaches for determining the market wage equivalents for unpaid work at home. The generalist wage approach was applied here to the lowest rank of civil servants (GSP II) and to semiskilled laborers. 2. The value given at the top of each bar shows the combined contribution of women and men. Source: Authors’ calculations based on Government of Bhutan, National Statistics Bureau. 2018. 2017 Population & Housing Census of Bhutan: National Report. Thimphu: Bhutan National Statistics Bureau of Bhutan.
Appendices 1 and 2 provide data and links to the underlying data and codes in R that will allow
future researchers to replicate and improve upon the measures presented here.
V. CONCLUSIONS AND RECOMMENDATIONS
Unpaid care work plays a prominent role in Bhutan’s economy, and this is the first study to present the methodology and results of an estimation of the market value of unpaid care work in that country. While acknowledging that a methodological consensus has not yet been reached, this study shows that a carefully constructed approach can yield compelling findings. The paper estimates that unpaid care work in Bhutan has a total annual value of Nu23.51 billion, which is equivalent to 16% of GDP if measured using a “specialist” wage, and to 10% of GDP if the generalist wage approach is applied. Over two-thirds of the estimated monetary value of unpaid work was generated by women; the gender gap is large and robust, and thus significant, and is consistent with results of studies conducted in other countries.
11 10 7
5 5
3
0
2
4
6
8
10
12
14
16
18
20
Specialist wage Generalist wage (GSP II)
Generalsit wage(semiskilled labor)
Women Men
%
Valuing Unpaid Care Work in Bhutan 29
The Government of Bhutan is committed to recognizing and reducing the disparities in unpaid work. Consequently, it is also committed to improving its methods of measurement. The objective should not be to eliminate unpaid work, as much of it is necessary for the functioning of society, but to set up an institutional structure that recognizes its value and ensures that it is equitably earmarked across the population. High-quality housework and caregiving are a social good. However, GDP only accounts for the value of goods and services bought and sold in the market, so it gives an incomplete picture of the actual value of the goods and services provided. The government’s National Commission for Women and Children (2019) set out a series of medium-term policy recommendations. But the first step toward achieving the goal of an equitable recognition of unpaid care work is to measure it as frequently and as accurately as possible.
In the short term, we recommend the following actions to improve the measurement of unpaid care work in Bhutan:
(i) Add new questions to the TUS, starting in 2020. The government could add questions regarding typical unpaid housework and caregiving activities to cross-classify with existing occupations for future exercises. It could also include a direct question on supervisory care, which usually represents a constraint on the caregiver’s time. Furthermore, it would be prudent to include questions to assess long-term attitudes toward certain standard types of unpaid work.
(ii) Maintain consistency of employment categories across years. In the LFS, the accuracy of wage rates for different occupations in the dataset could be improved by making the categories consistent across years. This could begin during the next LFS annual exercise.
(iii) Significantly bolster the data on wages. Consider a pilot survey on wages in the service sector that could later be incorporated into the LFSs. The ILO is leading many advances on this. Technical assistance in this area could also help.
(iv) Use international comparisons with India and Nepal to cross-check the value of informal jobs. We encourage the use of data from other countries with similar labor market situations to compare the value of informal jobs. One example is India’s LFSs, which provide detailed information on occupations. Bhutan’s strong economic ties with India, as well as its fixed exchange rate and high dependence on India when determining prices, all imply that the wages reported in the Indian LFSs could be used for Bhutan, assuming a bilateral adjustment is made to account for purchasing power parity. Actually, only one (base) adjustment would be required. It may be necessary to use some Nepalese data on agricultural activities in mountainous and other rural areas (if available).
(v) Use formal or informal volunteer programs to pilot a study on the distribution of volunteer work for men and women. We recommend a satellite survey to gather in-depth information on voluntary activities and the distribution of male and female volunteers. Two important pieces of information are required in the data collection, in addition to information on each activity—why volunteering is carried out, and who benefits from the volunteer work.
(vi) Use technology to broaden social protection systems and make them better targeted. For the short to medium term, we recommend decentralizing, expanding coverage, and digitalizing (through biometrics) certain public and social services. This should tie in with social protection systems and be guided by the results of the unpaid work measurements.
30 ADB Economics Working Paper Series No. 624
In the long term, we recommend the following actions to improve the measurement of unpaid care work in Bhutan:
(i) Generate labor productivity statistics that measure the value of work in services—whether paid of unpaid. Then incorporate them into the GNH Index.
(ii) Include measures of unpaid care work in the national accounts, first as a satellite account and then incorporated as part of the calculations.
(iii) Starting with the 2020 TUS design, assess the long-term attitudes toward certain standard types of unpaid care work.
Our estimates of the value of unpaid care work were based on data from the TUS carried out quinquennially for the GNH Index, as well as on wage rate findings by the LFSs, and population size determined by the 2017 Bhutan Living Standards Survey (Bhutan National Statistics Bureau and the World Bank 2017) and the 2017 Population & Housing Census. These data sources are of high quality and are well suited to providing economywide estimates of the value of unpaid care work. However, the estimates could be much more accurate if the following conceptual issues were addressed in the future:
(i) Wage data might not reflect society’s marginal product of labor. Using wage data to make these calculations implies that the results are sensitive to the structure of labor market institutions. For example, if preschool education were provided for free, the unpaid care of preschool children would be valued at a lower relative cost. Given the large informal labor market in the country, wages used for replacement cost calculations may underestimate the value if compared internationally. Some adjustments are needed before an international comparison can be made.
(ii) There is a need for human capital factor adjustment. Some types of unpaid care have more value than others—for example, unpaid care that increases the human capital of the recipient, such as teaching a child to read, teaching a trade to young people, or providing preventive therapy. Such work not only provides the short-term benefit of care, but also the long-term benefit of transmitting skills and healthy habits that will increase future welfare. Such an adjustment would be desirable. Therefore, we recommend considering the addition of a “human capital adjuster” for activities that involve strong interactions between two people for the benefit of one of them or both.
(iii) Within the family unit, inequality in the time spent on unpaid care should also be measured and reported. Unpaid care work exacerbates inequalities in society because it may prevent those who are involved in the work from obtaining paid employment. The TUS should thus require that respondents state in their diary entries whom they are with; also, if possible, the TUS should include interviews with more than one adult per household.
Beyond measurement, these results have important implications for the quality of life and welfare of women and all citizens of Bhutan, in the short and long term. By spending more time on unpaid care work, given that the supply of time is limited to 24 hours (1,440 minutes) a day, women are necessarily spending less time on two important areas—paid work and self-care, the latter defined as personal care and leisure activities (Figure 15). We know that dependent care is crucial for children. Not only do they directly benefit from the care, everyone benefits if these children grow up to become well-adjusted, healthy, and responsible citizens who can contribute to society. However, by doing this work, women have less time for themselves, including for leisure, and are thus more “time poor” than men. In fact, women have 30 minutes less time for themselves each day than men. This constrains
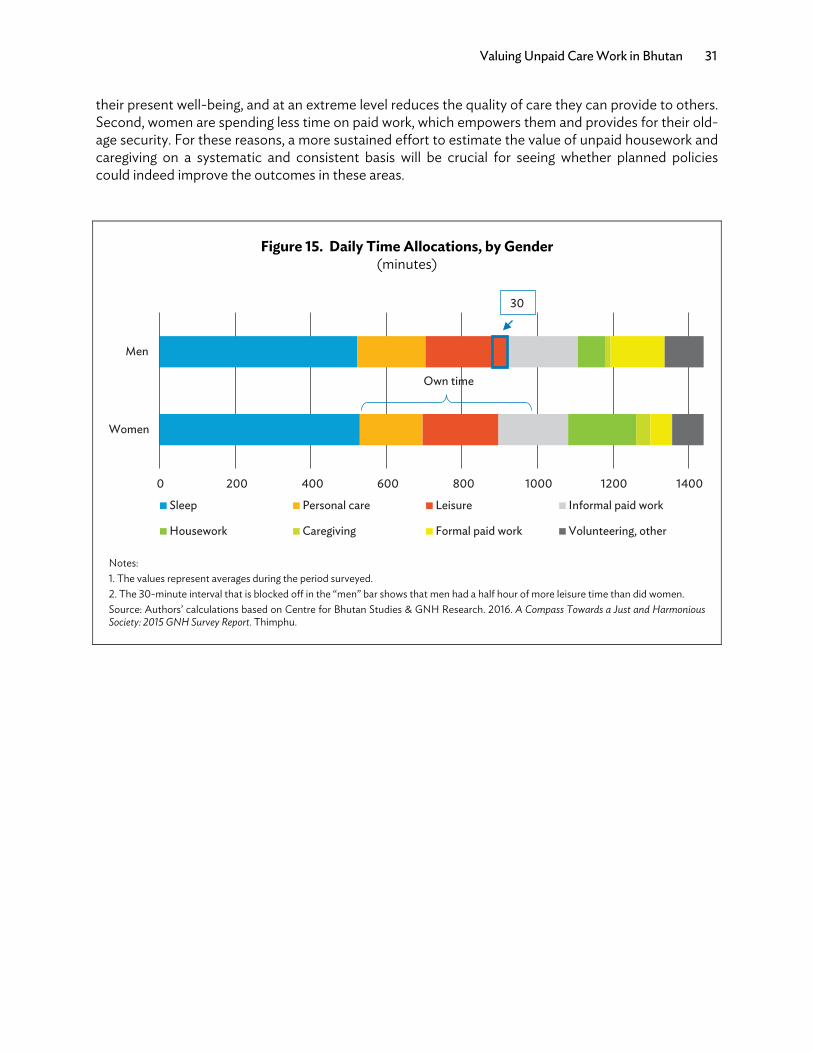
Valuing Unpaid Care Work in Bhutan 31
their present well-being, and at an extreme level reduces the quality of care they can provide to others. Second, women are spending less time on paid work, which empowers them and provides for their old-age security. For these reasons, a more sustained effort to estimate the value of unpaid housework and caregiving on a systematic and consistent basis will be crucial for seeing whether planned policies could indeed improve the outcomes in these areas.
Figure 15. Daily Time Allocations, by Gender (minutes)
Notes: 1. The values represent averages during the period surveyed. 2. The 30-minute interval that is blocked off in the “men” bar shows that men had a half hour of more leisure time than did women. Source: Authors’ calculations based on Centre for Bhutan Studies & GNH Research. 2016. A Compass Towards a Just and Harmonious Society: 2015 GNH Survey Report. Thimphu.
0 200 400 600 800 1000 1200 1400
Women
Men
Sleep Personal care Leisure Informal paid work
Housework Caregiving Formal paid work Volunteering, other
Own time
30
REFERENCES
Abraham, Katherine G., and Christopher Mackie, eds. 2005. Beyond the Market: Designing Nonmarket Accounts for the United States. Washington, DC: The National Academies Press.
Acharya, Meena. 1993. “The Household Economy and Women’s Work in Nepal.” In Women and Work in South Asia: Regional Patterns and Perspectives, edited by Saraswati Raju and Deipica Bagchi, 121–36. New York and Abingdon, UK: Routledge.
Amarante, Veronica and Cecilia Rossel. 2018. “Unfolding Patterns of Unpaid Household Work in Latin America.” Feminist Economics 24(1): 1-34.
Asian Development Bank (ADB). 2014. Bhutan: Gender Equality Diagnostic of Selected Sectors. Manila: ADB. https://www.adb.org/sites/default/files/institutional-document/149350/gender-equality-diagnostic-bhutan.pdf.
————. 2020. Asia’s Journey to Prosperity: Policy, Market, and Technology Over 50 Years. Manila: ADB. https://www.adb.org/sites/default/files/publication/549191/asias-journey-prosperity.pdf
Benería, Lourdes. 2003. Gender, Development, and Globalization: Economics as if All People Mattered. New York and Abingdon, UK: Routledge.
Bianchi, Suzanne M., John P. Robinson, and Melissa A. Milkie. 2006. Changing Rhythms of American Family Life. New York: Russell Sage Foundation.
Blackden, C. Mark, and Quentin Wodon, eds. 2006. “Gender, Time Use, and Poverty in Sub-Saharan Africa.” World Bank Working Papers 73. World Bank, Washington, DC. http://siteresources.worldbank.org/INTAFRREGTOPGENDER/Resources/gender_time_use_pov.pdf.
Centre for Bhutan & GNH Studies (CBS). 2016. A Compass Towards a Just and Harmonious Society: 2015 GNH Survey Report. Thimphu: CBS.
Chadeau, Ann. 1985. “Measuring Household Activities: Some International Comparisons.” The Review of Income and Wealth 31(3): 237-253.
Craig, Lyn, and Michael Bittman. 2008. “The Incremental Time Costs of Children: An Analysis of Children’s Impact on Adult Time Use in Australia.” Feminist Economics 14 (2): 59–88.
Durán, María Ángeles, and Vivian Milosavljevic. 2012. “Unpaid Work, Time Use Surveys, and Care Demand Forecasting in Latin America.” BBVA Foundation Working Papers 7, BBVA Foundation, Bilbao, Spain, May. https://www.fbbva.es/wp-content/uploads/2017/05/dat/DT_07_2012_21052012_ FINAL.pdf
Ferrant, Gaele, and Annelise Thim. 2019. “Measuring Women’s Economic Empowerment: Time Use Data and Gender Inequality.” OECD Development Policy Papers 16, Organisation of Economic Cooperation and Development (OECD), Paris, February.
34 References
Floro, Maria S., and Anant Pichetpongsa. 2010. “Gender, Work Intensity, and Well-Being of Thai Home-Based Workers.” Feminist Economics 16 (3): 5–44.
Folbre, Nancy. 2008. Valuing Children: Rethinking the Economics of the Family. Cambridge, MA: Harvard University Press.
Folbre, Nancy, and Jayoung Yoon. 2008. “Economic Development and Time Devoted to Direct Unpaid Care Activities: An Analysis of the Harmonized European Time Use Survey (HETUS).” Background paper commissioned for the United Nations Research Institute for Social Development (UNRISD), Geneva, August. http://www.unrisd.org/unrisd/website/document.nsf/ ab82a6805797760f80256b4f005da1ab/7783ff26a4dc0c83c12574e2002f53f3/$FILE/folbreyoonDRAFT.pdf.
Government of Hungary, Hungarian Central Statistical Office. 2016. Value of Domestic Work and Household Satellite Account in Hungary. Budapest: Government of Hungary.
Gronau, Reuben, and Daniel S. Hamermesh. 2006. “Time vs. Goods: The Value of Measuring Household Production Technologies.” Review of Income and Wealth 52 (1): 1–16.
Haddad, Lawrence, John Hoddinott, and Harold Alderman, eds. 1997. Intrahousehold Resource Allocation in Developing Countries: Models, Methods, and Policy (for the International Food Policy Research Institute). Baltimore, MD: The Johns Hopkins University Press.
Hirway, Indira. 2016. “Unpaid Work: An Obstacle to Gender Equality and Economic Empowerment including Women’s Labour Force Participation.” Expert Trigger Presentation at the “Sex-Disaggregated Data for the SDG Indicators in Asia and the Pacific: What and How?” workshop, organized by the United Nations Economic and Social Commission for Asia and the Pacific (ESCAP), Bangkok, 25-27 May. https://www.unescap.org/sites/default/files/Session_2Ab_Unpaid_Work_and_Domestic_ Care_Indira_Hirway.pdf.
Holloway, Sue, Sandra Short, and Sarah Tamplin. 2002. Household Satellite Account Methodology. London: Government of the United Kingdom, Office for National Statistics. https://vdocuments.mx/document/web-view-a-number-of-sensitivity-tests-have-been-calculated-to-see-the-effect-of.html
International Food Policy Research Institute (IFPRI). 2017. “Pakistan Rural Household Panel Survey (PRHPS) 2014, Round 3”, https://doi.org/10.7910/DVN/JWMCXY, Harvard Dataverse, V3, UNF:6:dZYny3jUvFWI7Ng4QBHMIw== [fileUNF].
International Labour Organization (ILO) and United Nations Development Programme (UNDP). 2018. Time-Use Surveys and Statistics in Asia and the Pacific: A Review of Challenges and Future Directions. Geneva and New York: ILO and UNDP. https://www.ilo.org/wcmsp5/groups/public/---asia/---ro-bangkok/documents/publication/wcms_630892.pdf.
Ironmonger, Duncan. 1989. “Households and the Household Economy.” In Households Work: Productive Activities, Women and Income in the Household Economy, edited by Duncan Ironmonger, 3–17. Sydney: Allen and Unwin.
References 35
Janvry, Alain de, Marcel Fafchamps, and Elizabeth Sadoulet. 1991. “Peasant Household Behavior with Missing Markets: Some Paradoxes Explained.” The Economic Journal 101 (409): 1400-1417.
Juster, F. Thomas and Frank P. Stafford. 1985. Time, Goods, and Well-Being. Ann Arbor, MI: University of Michigan Press.
Kennedy, Eileen, Howarth Bouis, and Joachim Von Braun. 1992. “Health and Nutrition Effects of Cash Crop Production in Developing Countries: A Comparative Analysis.” Social Science and Medicine 35(5): 679-687.
Landefeld, J. Steven, Barbara M. Fraumeni, and Cindy M. Vojtech. 2009. “Accounting for Household Production: A Prototype Satellite Account Using the American Time Use Survey.” Review of Income and Wealth 55 (2): 205–25.
Landefeld, J. Steven, and Stephanie H. McCulla. 2000. “Accounting for Nonmarket Household Production within a National Accounts Framework.” Review of Income and Wealth 46 (3): 289–307.
Levine, Carol, ed. 2004. Always on Call: When Illness Turns Families into Caregivers. Nashville, TN: Vanderbilt University Press.
Mazzucato, Mariana. 2018. “The Value of Everything.” A BBS Public Affairs Publication, New York.
Office for National Statistics (ONS), United Kingdom (UK). 2018. “Household Satellite Account, UK: 2015 and 2016.” New Port. https://www.ons.gov.uk/economy/nationalaccounts/satelliteaccounts/ articles/householdsatelliteaccounts/latest.
Organisation for Economic Co-operation and Development (OECD). 2004. “Unpaid Care Work: The Missing Link in the Analysis of Gender Gaps in Labour Outcomes.” Issues Paper, OECD Development Centre, Paris, December.
————. 2011. Society at a Glance 2011: OECD Social Indicators. OECD Publishing, Paris. https://www.oecd.org/social/soc/47571423.pdf.
Pigou, Arthur. 1932. The Economics of Welfare. London: Macmillan.
Reid, Margaret. 1934. Economics of Household Production. New York: John Wiley and Sons.
Government of Bhutan, Bhutan National Statistics Bureau and the World Bank. 2017. Bhutan Living Standards Survey Report 2017. Thimpu: Bhutan National Statistics Bureau. http://www.nsb.gov. bt/publication/files/pub2yo10667rb.pdf
Government of Bhutan, Ministry of Labour and Human Resources, Department of Employment, Labour Market Information and Research Division; and the International Labour Organization (ILO). 2015. Labour Force Survey Report 2015. Thimphu: Ministry of Labour and Human Resources and the ILO.
Government of Bhutan, National Commission for Women and Children. 2019. Accounting for Unpaid Care Work in Bhutan. Thimphu: NCWC. https://www.ncwc.gov.bt/publications/UNPAID_ CARE_WORK_IN_BHUTAN%20_20191570788312.pdf.
36 References
Government of Bhutan, National Statistics Bureau. 2018. 2017 Population & Housing Census of Bhutan: National Report. Thimphu: Bhutan National Statistics Bureau.
Suh, Jooyeoun, and Nancy Folbre . 2016. “Valuing Unpaid Child Care in the U.S.: A Prototype Satellite Account Using the American Time Use Survey.” Review of Income and Wealth 62 (4): 668–84.
UNDP. 2019. Human Development Report 2019. New York: UNDP.
United Nations (UN) Women. 2019. Progress of the World’s Women 2019-2020: Families in Changing World. New York: UN.
Varjonen, Johanna and Kristiina Aalto. 2006. Household Production and Consumption in Finland 2001: Household Satellite Account. Helsinki: Statistics Finland and National Consumer Research Centre. https://helda.helsinki.fi/bitstream/handle/10138/152276/Household_production_and_consumption_in_Finland_2001.pdf?sequence=1.
ASIAN DEVELOPMENT BANK
ASIAN DEVELOPMENT BANK6 ADB Avenue, Mandaluyong City1550 Metro Manila, Philippineswww.adb.org
Valuing Unpaid Care Work in Bhutan
This paper estimates the value of unpaid care work in Bhutan. It finds that, as in other countries, women spend more than twice as much time as men performing unpaid care work regardless of their income, age, residency, and household size. Bhutan has been ahead of its time in incorporating a measure of welfare—the Gross National Happiness Index—to better formulate social policy. This paper is the first to estimate the value of unpaid care work in the country and discusses the pros and cons of various approaches. It adds to the growing body of scholarly literature scrutinizing the importance of properly measuring the value of unpaid care work.
About the Asian Development Bank
ADB is committed to achieving a prosperous, inclusive, resilient, and sustainable Asia and the Pacific, while sustaining its efforts to eradicate extreme poverty. Established in 1966, it is owned by 68 members —49 from the region. Its main instruments for helping its developing member countries are policy dialogue, loans, equity investments, guarantees, grants, and technical assistance. VALUING UNPAID
CARE WORK IN BHUTAN Jooyeoun Suh, Changa Dorji, Valerie Mercer-Blackman, and Aimee Hampel-Milagrosa
ADB ECONOMICSWORKING PAPER SERIES
NO. 624
November 2020


![Himalayan Kingdom Marathon Bhutan Information 2015[1].pdfHimalayan Kingdom Marathon Bhutan Bhutan Information 31st May, 2015 . Bhutan Bhutan, the land of the Thunder Dragon is mystical,](https://img.pdfslide.net/doc/110x75/5f11fd557037e051160106f9/himalayan-kingdom-marathon-bhutan-information-20151pdf-himalayan-kingdom-marathon.jpg)