Embed Size (px)
Citation preview

VampirTrace 5.12.1
User Manual

TU DresdenCenter for Information Services andHigh Performance Computing (ZIH)01062 DresdenGermany
http://www.tu-dresden.de/zihhttp://www.tu-dresden.de/zih/vampirtrace
Contact: [email protected]
ii

Contents
Contents
1. Introduction 1
2. Instrumentation 52.1. Compiler Wrappers . . . . . . . . . . . . . . . . . . . . . . . . . . . 52.2. Instrumentation Types . . . . . . . . . . . . . . . . . . . . . . . . . 72.3. Automatic Instrumentation . . . . . . . . . . . . . . . . . . . . . . . 7
2.3.1. Supported Compilers . . . . . . . . . . . . . . . . . . . . . 82.3.2. Notes for Using the GNU, Intel, PathScale, or Open64 Com-
piler . . . . . . . . . . . . . . . . . . . . . . . . . . . . . . . 82.3.3. Notes on Instrumentation of Inline Functions . . . . . . . . 92.3.4. Instrumentation of Loops with OpenUH Compiler . . . . . . 9
2.4. Manual Instrumentation . . . . . . . . . . . . . . . . . . . . . . . . 92.4.1. Using the VampirTrace API . . . . . . . . . . . . . . . . . . 92.4.2. Measurement Controls . . . . . . . . . . . . . . . . . . . . . 10
2.5. Source Instrumentation Using PDT/TAU . . . . . . . . . . . . . . . 122.6. Binary Instrumentation Using Dyninst . . . . . . . . . . . . . . . . 13
2.6.1. Static Binary Instrumentation . . . . . . . . . . . . . . . . . 132.7. Runtime Instrumentation Using VTRun . . . . . . . . . . . . . . . . 142.8. Tracing Java Applications Using JVMTI . . . . . . . . . . . . . . . . 142.9. Tracing Calls to 3rd-Party Libraries . . . . . . . . . . . . . . . . . . 15
3. Runtime Measurement 173.1. Trace File Name and Location . . . . . . . . . . . . . . . . . . . . . 173.2. Environment Variables . . . . . . . . . . . . . . . . . . . . . . . . . 173.3. Influencing Trace Buffer Size . . . . . . . . . . . . . . . . . . . . . 213.4. Profiling an Application . . . . . . . . . . . . . . . . . . . . . . . . . 223.5. Unification of Local Traces . . . . . . . . . . . . . . . . . . . . . . . 223.6. Synchronized Buffer Flush . . . . . . . . . . . . . . . . . . . . . . . 223.7. Enhanced Timer Synchronization . . . . . . . . . . . . . . . . . . . 233.8. Environment Configuration Using VTSetup . . . . . . . . . . . . . 24
4. Recording Additional Events and Counters 254.1. Hardware Performance Counters . . . . . . . . . . . . . . . . . . . 254.2. Resource Usage Counters . . . . . . . . . . . . . . . . . . . . . . 264.3. Memory Allocation Counter . . . . . . . . . . . . . . . . . . . . . . 264.4. CPU ID Counter . . . . . . . . . . . . . . . . . . . . . . . . . . . . 27
iii

Contents
4.5. NVIDIA CUDA Runtime API and Kernels . . . . . . . . . . . . . . . 274.6. Pthread API Calls . . . . . . . . . . . . . . . . . . . . . . . . . . . 324.7. Plugin Counter Metrics . . . . . . . . . . . . . . . . . . . . . . . . . 324.8. I/O Calls . . . . . . . . . . . . . . . . . . . . . . . . . . . . . . . . . 334.9. fork/system/exec Calls . . . . . . . . . . . . . . . . . . . . . . . . . 334.10.MPI Correctness Checking Using UniMCI . . . . . . . . . . . . . . 344.11.User-defined Counters . . . . . . . . . . . . . . . . . . . . . . . . . 354.12.User-defined Markers . . . . . . . . . . . . . . . . . . . . . . . . . 374.13.User-defined Communcation . . . . . . . . . . . . . . . . . . . . . 37
5. Filtering & Grouping 395.1. Function Filtering . . . . . . . . . . . . . . . . . . . . . . . . . . . . 395.2. Java Specific Filtering . . . . . . . . . . . . . . . . . . . . . . . . . 405.3. Function Grouping . . . . . . . . . . . . . . . . . . . . . . . . . . . 40
A. VampirTrace Installation 43A.1. Basics . . . . . . . . . . . . . . . . . . . . . . . . . . . . . . . . . . 43A.2. Configure Options . . . . . . . . . . . . . . . . . . . . . . . . . . . 43A.3. Cross Compilation . . . . . . . . . . . . . . . . . . . . . . . . . . . 50A.4. Environment Set-Up . . . . . . . . . . . . . . . . . . . . . . . . . . 51A.5. Notes for Developers . . . . . . . . . . . . . . . . . . . . . . . . . . 51
B. Command Reference 53B.1. Compiler Wrappers (vtcc,vtcxx,vtf77,vtf90) . . . . . . . . . . . . . . 53B.2. Local Trace Unifier (vtunify) . . . . . . . . . . . . . . . . . . . . . . 55B.3. Binary Instrumentor (vtdyn) . . . . . . . . . . . . . . . . . . . . . . 57B.4. Trace Filter Tool (vtfilter) . . . . . . . . . . . . . . . . . . . . . . . . 58B.5. Library Wrapper Generator (vtlibwrapgen) . . . . . . . . . . . . . . 60B.6. Application Execution Wrapper (vtrun) . . . . . . . . . . . . . . . . 62
C. Counter Specifications 65C.1. PAPI . . . . . . . . . . . . . . . . . . . . . . . . . . . . . . . . . . . 65C.2. CPC . . . . . . . . . . . . . . . . . . . . . . . . . . . . . . . . . . . 67C.3. NEC SX Hardware Performance Counter . . . . . . . . . . . . . . 68C.4. Resource Usage . . . . . . . . . . . . . . . . . . . . . . . . . . . . 69
D. FAQ 71D.1. Can I use different compilers for VampirTrace and my application? 71D.2. Why does my application need such a long time for starting? . . . 71D.3. Fortran file I/O is not accounted properly? . . . . . . . . . . . . . . 72D.4. There is no *.otf file. What can I do? . . . . . . . . . . . . . . . . . 73D.5. What limitations are associated with ”on/off” and buffer rewind? . . 73D.6. VampirTrace warns that it “cannot lock file a.lock”, what’s wrong? . 73D.7. Can I relocate my VampirTrace installation? . . . . . . . . . . . . . 74
iv
Contents
D.8. What are the byte counts in collective communication records? . . 74D.9. I get “error: unknown asm constraint letter” . . . . . . . . . . . . . 74D.10.I have a question that is not answered in this document! . . . . . . 75D.11.I need support for additional features so I can trace application xyz. 75
This documentation describes how to apply VampirTrace to an application inorder to generate trace files at execution time. This step is called instrumentation.It furthermore explains how to control the runtime measurement system duringexecution (tracing). This also includes performance counter sampling as well asselective filtering and grouping of functions.
v


1 Introduction
1. Introduction
VampirTrace consists of a tool set and a runtime library for instrumentation andtracing of software applications. It is particularly tailored to parallel and dis-tributed High Performance Computing (HPC) applications.
The instrumentation part modifies a given application in order to inject addi-tional measurement calls during runtime. The tracing part provides the actualmeasurement functionality used by the instrumentation calls. By this means, avariety of detailed performance properties can be collected and recorded dur-ing runtime. This includes function enter and leave events, MPI communication,OpenMP events, and performance counters.
After a successful tracing run, VampirTrace writes all collected data to a tracefile in the Open Trace Format (OTF)1. As a result, the information is available forpost-mortem analysis and visualization by various tools. Most notably, Vampir-Trace provides the input data for the Vampir analysis and visualization tool 2.
VampirTrace is included in Open MPI 1.3 and later versions. If not disabledexplicitly, VampirTrace is built automatically when installing Open MPI 3.
Trace files can quickly become very large, especially with automatic instru-mentation. Tracing applications for only a few seconds can result in trace filesof several hundred megabytes. To protect users from creating trace files of sev-eral gigabytes, the default behavior of VampirTrace limits the internal buffer to 32MB per process. Thus, even for larger scale runs the total trace file size will bemoderate. Please read Section 3.3 on how to remove or change this limit.
VampirTrace supports various Unix and Linux platforms that are common inHPC nowadays. It is available as open source software under a BSD License.
The following list shows a summary of all instrumentation and tracing featuresthat VampirTrace offers. Note that not all features are supported on all platforms.
1http://www.tu-dresden.de/zih/otf2http://www.vampir.eu3http://www.open-mpi.org/faq/?category=vampirtrace
1
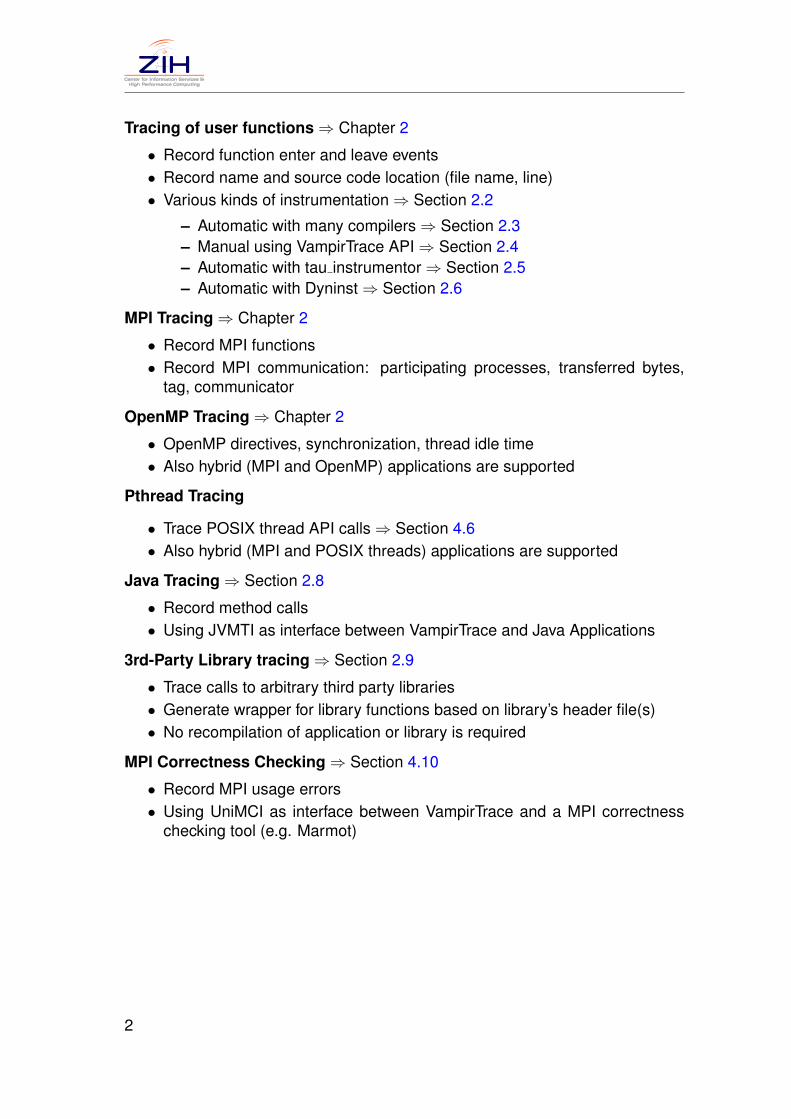
Tracing of user functions⇒ Chapter 2
• Record function enter and leave events• Record name and source code location (file name, line)• Various kinds of instrumentation⇒ Section 2.2
– Automatic with many compilers⇒ Section 2.3– Manual using VampirTrace API⇒ Section 2.4– Automatic with tau instrumentor⇒ Section 2.5– Automatic with Dyninst⇒ Section 2.6
MPI Tracing⇒ Chapter 2
• Record MPI functions• Record MPI communication: participating processes, transferred bytes,
tag, communicator
OpenMP Tracing⇒ Chapter 2
• OpenMP directives, synchronization, thread idle time• Also hybrid (MPI and OpenMP) applications are supported
Pthread Tracing
• Trace POSIX thread API calls⇒ Section 4.6• Also hybrid (MPI and POSIX threads) applications are supported
Java Tracing⇒ Section 2.8
• Record method calls• Using JVMTI as interface between VampirTrace and Java Applications
3rd-Party Library tracing⇒ Section 2.9
• Trace calls to arbitrary third party libraries• Generate wrapper for library functions based on library’s header file(s)• No recompilation of application or library is required
MPI Correctness Checking⇒ Section 4.10
• Record MPI usage errors• Using UniMCI as interface between VampirTrace and a MPI correctness
checking tool (e.g. Marmot)
2
1 Introduction
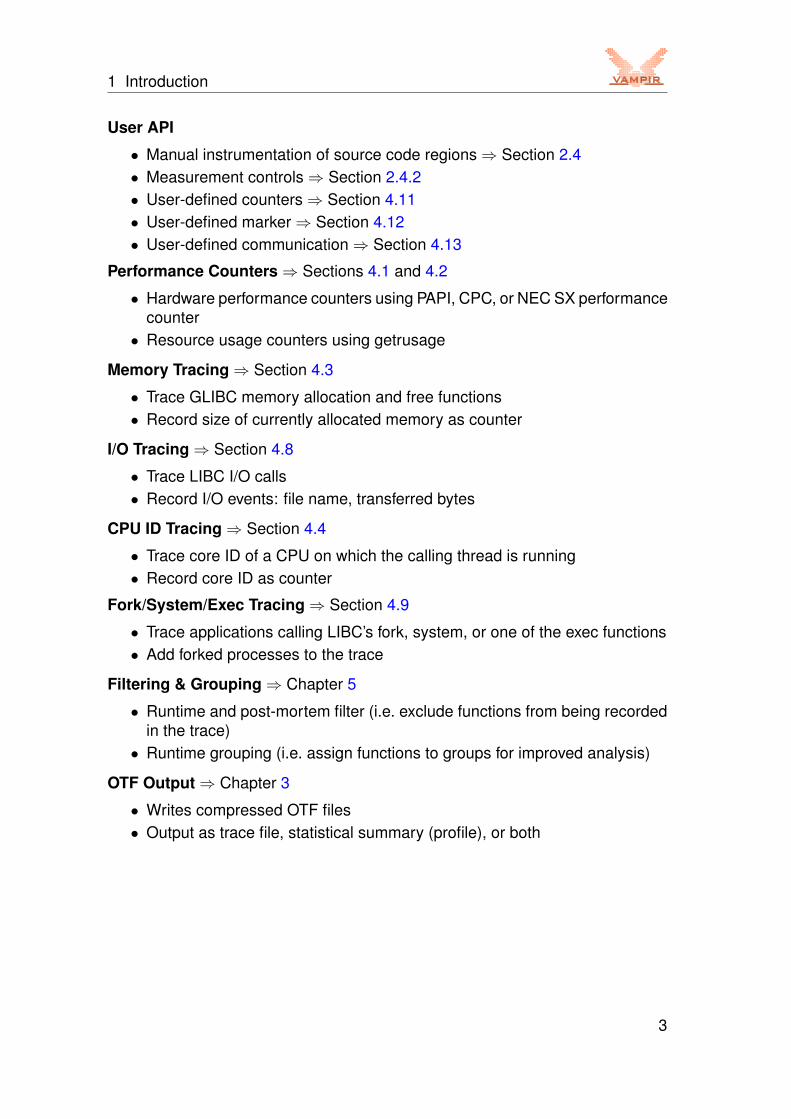
User API
• Manual instrumentation of source code regions⇒ Section 2.4• Measurement controls⇒ Section 2.4.2• User-defined counters⇒ Section 4.11• User-defined marker⇒ Section 4.12• User-defined communication⇒ Section 4.13
Performance Counters⇒ Sections 4.1 and 4.2
• Hardware performance counters using PAPI, CPC, or NEC SX performancecounter• Resource usage counters using getrusage
Memory Tracing⇒ Section 4.3
• Trace GLIBC memory allocation and free functions• Record size of currently allocated memory as counter
I/O Tracing⇒ Section 4.8
• Trace LIBC I/O calls• Record I/O events: file name, transferred bytes
CPU ID Tracing⇒ Section 4.4
• Trace core ID of a CPU on which the calling thread is running• Record core ID as counter
Fork/System/Exec Tracing⇒ Section 4.9
• Trace applications calling LIBC’s fork, system, or one of the exec functions• Add forked processes to the trace
Filtering & Grouping⇒ Chapter 5
• Runtime and post-mortem filter (i.e. exclude functions from being recordedin the trace)• Runtime grouping (i.e. assign functions to groups for improved analysis)
OTF Output⇒ Chapter 3
• Writes compressed OTF files• Output as trace file, statistical summary (profile), or both
3

2 Instrumentation
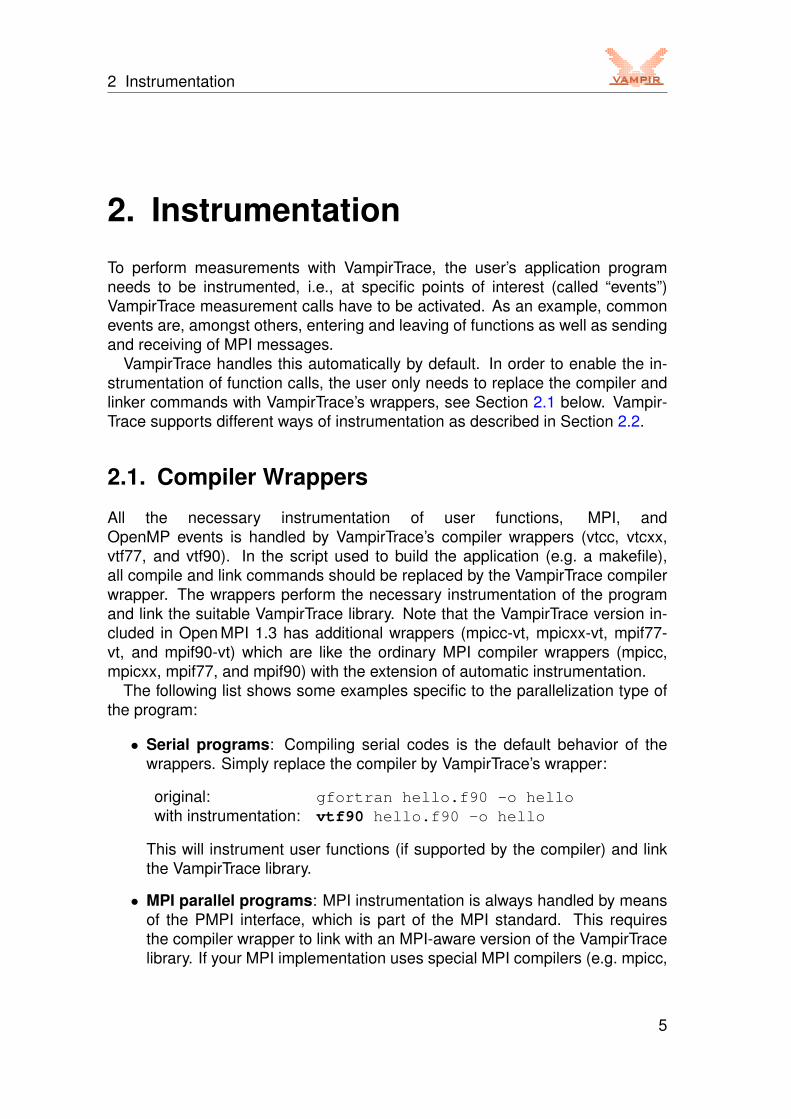
2. InstrumentationTo perform measurements with VampirTrace, the user’s application programneeds to be instrumented, i.e., at specific points of interest (called “events”)VampirTrace measurement calls have to be activated. As an example, commonevents are, amongst others, entering and leaving of functions as well as sendingand receiving of MPI messages.
VampirTrace handles this automatically by default. In order to enable the in-strumentation of function calls, the user only needs to replace the compiler andlinker commands with VampirTrace’s wrappers, see Section 2.1 below. Vampir-Trace supports different ways of instrumentation as described in Section 2.2.
2.1. Compiler Wrappers
All the necessary instrumentation of user functions, MPI, andOpenMP events is handled by VampirTrace’s compiler wrappers (vtcc, vtcxx,vtf77, and vtf90). In the script used to build the application (e.g. a makefile),all compile and link commands should be replaced by the VampirTrace compilerwrapper. The wrappers perform the necessary instrumentation of the programand link the suitable VampirTrace library. Note that the VampirTrace version in-cluded in Open MPI 1.3 has additional wrappers (mpicc-vt, mpicxx-vt, mpif77-vt, and mpif90-vt) which are like the ordinary MPI compiler wrappers (mpicc,mpicxx, mpif77, and mpif90) with the extension of automatic instrumentation.
The following list shows some examples specific to the parallelization type ofthe program:
• Serial programs: Compiling serial codes is the default behavior of thewrappers. Simply replace the compiler by VampirTrace’s wrapper:
original: gfortran hello.f90 -o hellowith instrumentation: vtf90 hello.f90 -o hello
This will instrument user functions (if supported by the compiler) and linkthe VampirTrace library.
• MPI parallel programs: MPI instrumentation is always handled by meansof the PMPI interface, which is part of the MPI standard. This requiresthe compiler wrapper to link with an MPI-aware version of the VampirTracelibrary. If your MPI implementation uses special MPI compilers (e.g. mpicc,
5

2.1 Compiler Wrappers
mpxlf90), you will need to tell VampirTrace’s wrapper to use this compilerinstead of the serial one:
original: mpicc hello.c -o hellowith instrumentation: vtcc -vt:cc mpicc hello.c -o hello
MPI implementations without own compilers require the user to link the MPIlibrary manually. In this case, simply replace the compiler by VampirTrace’scompiler wrapper:
original: icc hello.c -o hello -lmpiwith instrumentation: vtcc hello.c -o hello -lmpi
If you want to instrument MPI events only (this creates smaller trace filesand less overhead) use the option -vt:inst manual to disable auto-matic instrumentation of user functions (see also Section 2.4).
• Threaded parallel programs: When VampirTrace detects OpenMP orPthread flags on the command line, special instrumentation calls are in-voked. For OpenMP events OPARI is invoked for automatic source codeinstrumentation.
original: ifort <-openmp|-pthread> hello.f90-o hello
with instrumentation: vtf90 <-openmp|-pthread> hello.f90-o hello
For more information about OPARI read the documentation available inVampirTrace’s installation directory at: share/vampirtrace/doc/opari/Readme.html
• Hybrid MPI/Threaded parallel programs: With a combination of theabove mentioned approaches, hybrid applications can be instrumented:
original: mpif90 <-openmp|-pthread> hello.F90-o hello
with instrumentation: vtf90 -vt:f90 mpif90<-openmp|-pthread> hello.F90-o hello
The VampirTrace compiler wrappers automatically try to detect which paral-lelization method is used by means of the compiler flags (e.g. -lmpi, -openmpor -pthread) and the compiler command (e.g. mpif90). If the compiler wrap-per failed to detect this correctly, the instrumentation could be incomplete andan unsuitable VampirTrace library would be linked to the binary. In this case, youshould tell the compiler wrapper which parallelization method your program uses
6
2 Instrumentation
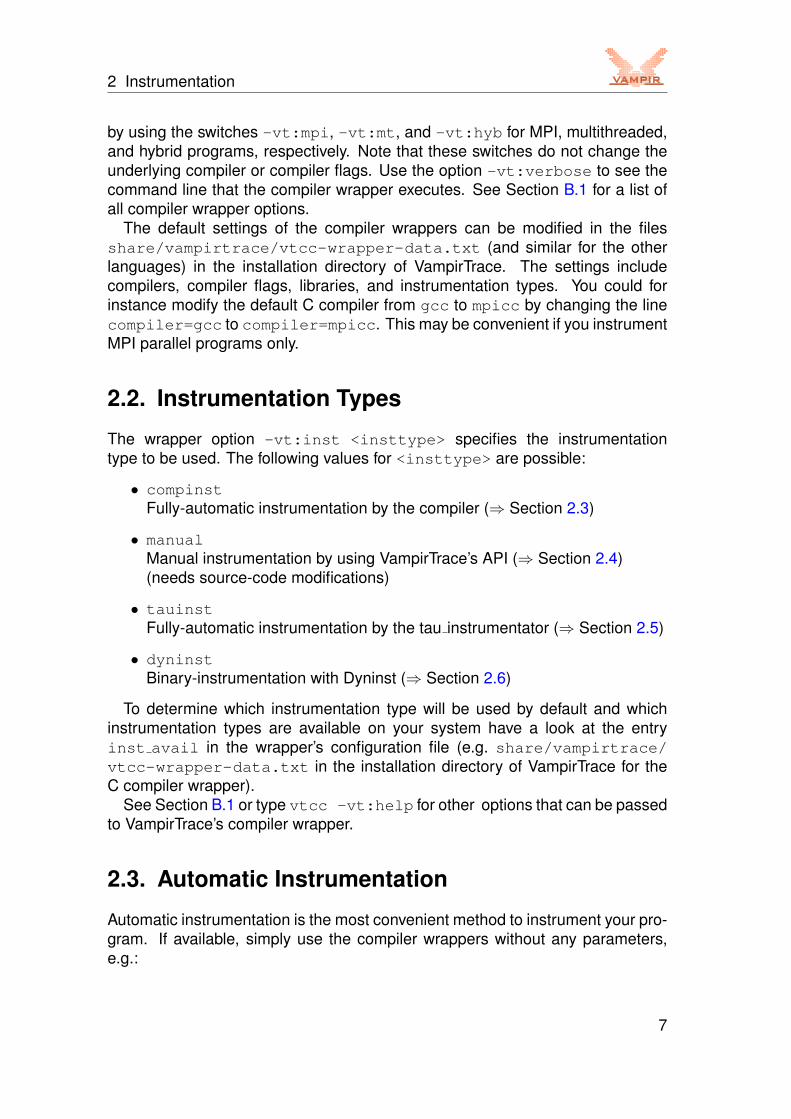
by using the switches -vt:mpi, -vt:mt, and -vt:hyb for MPI, multithreaded,and hybrid programs, respectively. Note that these switches do not change theunderlying compiler or compiler flags. Use the option -vt:verbose to see thecommand line that the compiler wrapper executes. See Section B.1 for a list ofall compiler wrapper options.
The default settings of the compiler wrappers can be modified in the filesshare/vampirtrace/vtcc-wrapper-data.txt (and similar for the otherlanguages) in the installation directory of VampirTrace. The settings includecompilers, compiler flags, libraries, and instrumentation types. You could forinstance modify the default C compiler from gcc to mpicc by changing the linecompiler=gcc to compiler=mpicc. This may be convenient if you instrumentMPI parallel programs only.
2.2. Instrumentation Types
The wrapper option -vt:inst <insttype> specifies the instrumentationtype to be used. The following values for <insttype> are possible:
• compinstFully-automatic instrumentation by the compiler (⇒ Section 2.3)
• manualManual instrumentation by using VampirTrace’s API (⇒ Section 2.4)(needs source-code modifications)
• tauinstFully-automatic instrumentation by the tau instrumentator (⇒ Section 2.5)
• dyninstBinary-instrumentation with Dyninst (⇒ Section 2.6)
To determine which instrumentation type will be used by default and whichinstrumentation types are available on your system have a look at the entryinst avail in the wrapper’s configuration file (e.g. share/vampirtrace/vtcc-wrapper-data.txt in the installation directory of VampirTrace for theC compiler wrapper).
See Section B.1 or type vtcc -vt:help for other options that can be passedto VampirTrace’s compiler wrapper.
2.3. Automatic Instrumentation
Automatic instrumentation is the most convenient method to instrument your pro-gram. If available, simply use the compiler wrappers without any parameters,e.g.:
7
2.3 Automatic Instrumentation
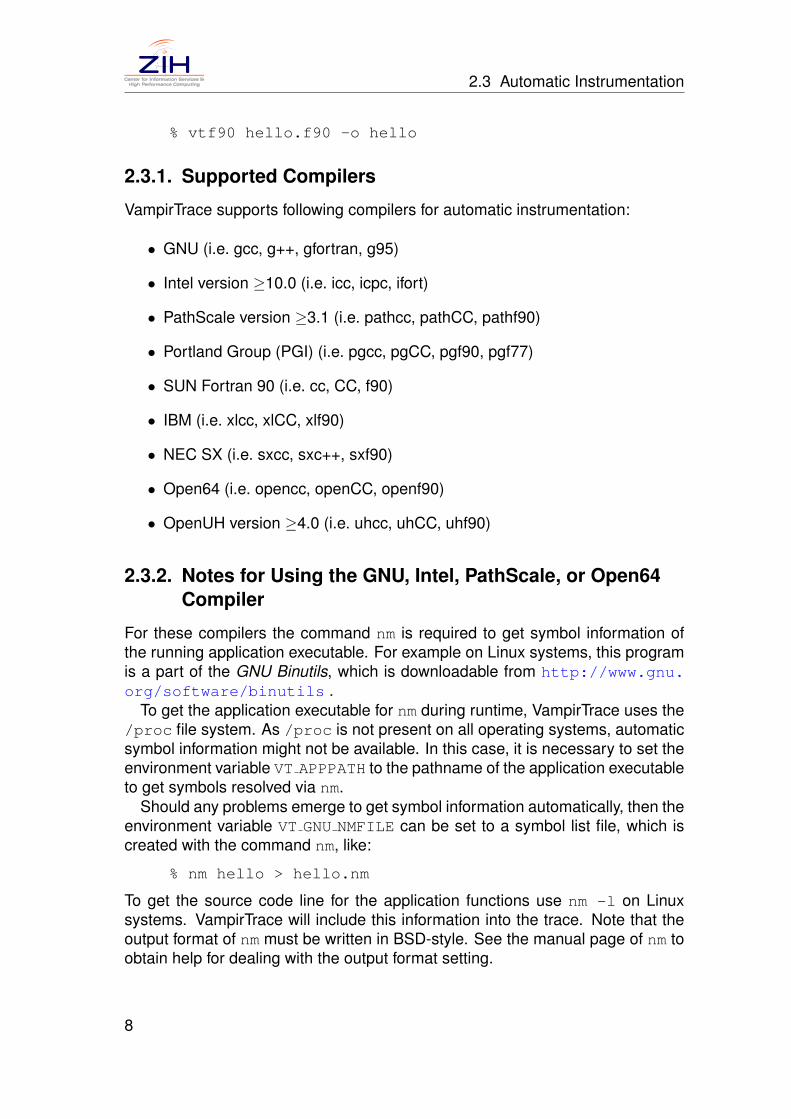
% vtf90 hello.f90 -o hello
2.3.1. Supported Compilers
VampirTrace supports following compilers for automatic instrumentation:
• GNU (i.e. gcc, g++, gfortran, g95)
• Intel version ≥10.0 (i.e. icc, icpc, ifort)
• PathScale version ≥3.1 (i.e. pathcc, pathCC, pathf90)
• Portland Group (PGI) (i.e. pgcc, pgCC, pgf90, pgf77)
• SUN Fortran 90 (i.e. cc, CC, f90)
• IBM (i.e. xlcc, xlCC, xlf90)
• NEC SX (i.e. sxcc, sxc++, sxf90)
• Open64 (i.e. opencc, openCC, openf90)
• OpenUH version ≥4.0 (i.e. uhcc, uhCC, uhf90)
2.3.2. Notes for Using the GNU, Intel, PathScale, or Open64Compiler
For these compilers the command nm is required to get symbol information ofthe running application executable. For example on Linux systems, this programis a part of the GNU Binutils, which is downloadable from http://www.gnu.org/software/binutils .
To get the application executable for nm during runtime, VampirTrace uses the/proc file system. As /proc is not present on all operating systems, automaticsymbol information might not be available. In this case, it is necessary to set theenvironment variable VT APPPATH to the pathname of the application executableto get symbols resolved via nm.
Should any problems emerge to get symbol information automatically, then theenvironment variable VT GNU NMFILE can be set to a symbol list file, which iscreated with the command nm, like:
% nm hello > hello.nm
To get the source code line for the application functions use nm -l on Linuxsystems. VampirTrace will include this information into the trace. Note that theoutput format of nm must be written in BSD-style. See the manual page of nm toobtain help for dealing with the output format setting.
8
2 Instrumentation
2.3.3. Notes on Instrumentation of Inline Functions
Compilers behave differently when they automatically instrument inlined func-tions. The GNU and Intel ≥10.0 compilers instrument all functions by defaultwhen they are used with VampirTrace. They therefore switch off inlining com-pletely, disregarding the optimization level chosen. One can prevent these par-ticular functions from being instrumented by appending the following attribute tofunction declarations, hence making them able to be inlined (this works only forC/C++):
__attribute__ ((__no_instrument_function__))
The PGI and IBM compilers prefer inlining over instrumentation when com-piling with enabled inlining. Thus, one needs to disable inlining to enable theinstrumentation of inline functions and vice versa.
The bottom line is that a function cannot be inlined and instrumented at thesame time. For more information on how to inline functions read your compiler’smanual.
2.3.4. Instrumentation of Loops with OpenUH Compiler
The OpenUH compiler provides the possibility of instrumenting loops in additionto functions. To use this functionality add the compiler flag -OPT:instr loop.In this case loops induce additional events including the type of loop (e.g. for,while, or do) and the source code location.
2.4. Manual Instrumentation
2.4.1. Using the VampirTrace API
The VT USER START, VT USER END calls can be used to instrument any user-defined sequence of statements.
Fortran:#include "vt_user.inc"VT_USER_START(’name’)...VT_USER_END(’name’)
C:#include "vt_user.h"VT_USER_START("name");...VT_USER_END("name");
9
2.4 Manual Instrumentation
If a block has several exit points (as it is often the case for functions), all exitpoints have to be instrumented with VT USER END, too.
For C++ it is simpler as is demonstrated in the following example. Only entrypoints into a scope need to be marked. The exit points are detected automaticallywhen C++ deletes scope-local variables.
C++:#include "vt_user.h"{
VT_TRACER("name");...
}
The instrumented sources have to be compiled with -DVTRACE for all threelanguages, otherwise the VT * calls are ignored. Note that Fortran source filesinstrumented this way have to be preprocessed, too.
In addition, you can combine this particular instrumentation type with all othertypes. In such a way, all user functions can be instrumented by a compiler whilespecial source code regions (e.g. loops) can be instrumented by VT’s API.
Use VT’s compiler wrapper (described above) for compiling and linking theinstrumented source code, such as:
• combined with automatic compiler instrumentation:
% vtcc -DVTRACE hello.c -o hello
• without compiler instrumentation:
% vtcc -vt:inst manual -DVTRACE hello.c -o hello
Note that you can also use the option -vt:inst manual with non-instru-mented sources. Binaries created in this manner only contain MPI and OpenMPinstrumentation, which might be desirable in some cases.
2.4.2. Measurement Controls
Switching tracing on/off: In addition to instrumenting arbitrary blocks of code,one can use the VT ON/ VT OFF instrumentation calls to start and stop the record-ing of events. These constructs can be used to stop recording of events for a partof the application and later resume recording. For example, as is demonstratedin the following C/C++ code snippet, one could not collect trace events duringthe initialization phase of an application and turn on tracing for the computationpart.
10
2 Instrumentation
int main() {...VT_OFF();initialize();VT_ON();compute();...
}
Furthermore the ”on/off” functionality can be used to control the tracing behaviorof VampirTrace and allows to trace only parts of interests. Therefore the amountof trace data can be reduced essentially. To check whether if tracing is enabledor not use the call VT IS ON.
For further information about limitations have a look at the FAQ D.5.
Trace buffer rewind: An alternative to the ”on/off” functionality is the bufferrewind approach. It is useful when the program should decide dynamically aftera specific code section (i.e. a time step or iteration) if this section has beeninteresting (i.e. anomalous/slow behavior) and should be recorded to the tracefile. The key difference to ”on/off” is that you do not need to know a priori if asection should be recorded.
Use the instrumentation call VT SET REWIND MARK at the beginning of a (pos-sibly not interesting) code section. Later, you can decide to rewind the tracebuffer to the mark with the call VT REWIND. All recorded trace data between themark and the rewind call will be dropped. Note, that only one mark can be set ata time. The last call to VT SET REWIND MARK will be considered when rewindingthe trace buffer. This simplified Fortran code example sketches how the rewindapproach can be used:
do step=1,number_of_time_stepsVT_SET_REWIND_MARK()call compute_time_step(step)if(finished_as_expected) VT_REWIND()
end do
Refer to FAQ D.5 for limitations associated with this method.
Intermediate buffer flush: In addition to an automated buffer flush when thebuffer is filled, it is possible to flush the buffer at any point of the application. Thisway you can guarantee that after a manual buffer flush there will be a sequenceof the program with no automatic buffer flush interrupting. To flush the buffer youcan use the call VT BUFFER FLUSH.
11
2.5 Source Instrumentation Using PDT/TAU
Intermediate time synchronisation: VampirTrace provides several mecha-nisms for timer synchronization (⇒ Section 3.7). In addition it is also possi-ble to initiate a timer synchronization at any point of the application by callingVT TIMESYNC. Please note that the user has to ensure that all processes areactual at a synchronized point in the program (e.g. at a barrier). To use this callmake sure that the enhanced timer synchronization is activated (set the environ-ment variable VT ETIMESYNC⇒ Section 3.2).
Intermediate counter update: VampirTrace provides the functionality to col-lect the values of arbitrary hardware counters. Chosen counter values are au-tomatically recorded whenever an event occurs. Sometimes (e.g. within a long-lasting function) it is desirable to get the counter values at an arbitrary pointwithin the program. To record the counter values at any given point you can callVT UPDATE COUNTER.
Note: For all three languages the instrumented sources have to be compiledwith -DVTRACE. Otherwise the VT * calls are ignored.In addition, if the sources contains further VampirTrace API calls and only thecalls for measurement controls shall be disabled, then the sources have to becompiled with -DVTRACE NO CONTROL, too.
2.5. Source Instrumentation Using PDT/TAU
TAU instrumentation combines the advantages of compiler and manual instru-mentation and has further advantages. Like compiler instrumentation it worksautomatically, like on manual instrumentation you have a filtered set of events,this is especially recommended for C++, because STL-constructor calls are sup-pressed. Unlike with compiler instrumentation you get an optimized binary – thissolves the issue described in Section 2.3.3. In the simpliest case you just runthe compiler wrappers with -vt:inst tauinst option:
% vtcc -vt:inst tauinst hello.c -o hello
There is a known issue with the TAU instrumentation in the⇒ FAQ D.9
Requirements for TAU instrumentation: To work with TAU instrumenationyou need the Program Database Toolkit. You have to make sure, to have cparseand tau instrumentor in your $PATH. The PDToolkit can be downloaded fromhttp://www.cs.uoregon.edu/research/pdt/home.php .
Include/Exclude Lists: tau instrumentor provides a mechanism to includeand exclude files or functions from instrumenation. The lists are deposed
12
2 Instrumentation
in a single file, that is announced to tau instrumentor via the option-f <filename>. This file contains up to four lists which begin withBEGIN[ FILE] <INCLUDE|EXCLUDE> LIST. The names in between may con-tain wildcards as “?”, “*’, and “#”, each entry gets a new line. The lists end withEND[ FILE] <INCLUDE|EXCLUDE> LIST. For further information on selectiveprofiling have a look at the TAU documentation 1. To announce the file throughthe compiler wrapper use the option -vt:tau:
% vtcc -vt:inst tauinst hello.c -o hello \-vt:tau ’-f <filename>’
2.6. Binary Instrumentation Using Dyninst
The option -vt:inst dyninst is used with the compiler wrapper to instru-ment the application during runtime (binary instrumentation), by using Dyninst 2.Recompiling is not necessary for this kind of instrumentation, but relinking:
% vtf90 -vt:inst dyninst hello.o -o hello
The compiler wrapper dynamically links the library libvt-dynatt.so to theapplication. This library attaches the mutator -program vtdyn during runtimewhich invokes the instrumentation by using Dyninst.
To prevent certain functions from being instrumented you can use the runtimefunction filtering as explained in Section 5.1. All additional overhead, due toinstrumentation of these functions, will be removed.
VampirTrace also allows binary instrumentation of functions located in sharedlibraries. For this to work a colon-separated list of shared library names has tobe given in the environment variable VT DYN SHLIBS:
VT_DYN_SHLIBS=libsupport.so:libmath.so
2.6.1. Static Binary Instrumentation
In order to avoid the overhead introduced by Dyninst during runtime, the toolvtdyn can be used for binary instrumentation before application launch. To ac-complish this, the -o or --output switch can be used to specify the output bi-nary. Note that the application must be linked to the corresponding VampirTracelibrary.
1http://www.cs.uoregon.edu/research/tau/docs/newguide/ch03s03.html#ManualSelectiveProfiling
2http://www.dyninst.org
13
2.7 Runtime Instrumentation Using VTRun
Example To apply binary instrumentation to the executable a.out the follow-ing command is nescessary:
% vtdyn -o dyninst_a.out ./a.out
2.7. Runtime Instrumentation Using VTRun
Besides the already described instrumentation at compile-time, VampirTrace alsosupports runtime instrumention using the vtrun command. Prepending the ac-tual call to the application will transparently add instrumentation support andlaunch the application. This includes support function instrumentation by Dyninst(Section 2.6) as well as MPI communication tracing. In order to enable instru-mentation for user functions the user has to specify the --dyninst commandline switch.
Example In order to add tracing support to an already existing executable, onlya small change to the startup command has to be made. Assuming the usualway of calling the application looks like:
% mpirun -np 4 ./a.out
By putting the call to vtrun directly before the actual application call, instru-mention support will be enabled at runtime:
% mpirun -np 4 vtrun ./a.out
For more information about the tool vtrun see Section B.6.
2.8. Tracing Java Applications Using JVMTI
In addition to C, C++, and Fortran, VampirTrace is capable of tracing Java appli-cations. This is accomplished by means of the Java Virtual Machine Tool Inter-face (JVMTI) which is part of JDK versions 5 and later. If VampirTrace was builtwith Java tracing support, the library libvt-java.so can be used as follows totrace any Java program:
% java -agentlib:vt-java ...
Or more easier, by replacing the usal Java application launcher java by thecommand vtjava:
% vtjava ...
When tracing Java applications, you probably want to filter out dispensablefunction calls. Please have a look at Sections 5.1 and 5.2 to learn about differentways for excluding parts of the application from tracing.
14
2 Instrumentation
2.9. Tracing Calls to 3rd-Party Libraries
VampirTrace is also capable to trace calls to third party libraries, which come withat least one C header file even without the library’s source code. If VampirTracewas built with support for library tracing (the CTool library is required), the toolvtlibwrapgen can be used to generate a wrapper library to intercept eachcall to the actual library functions. This wrapper library can be linked to theapplication or used in combination with the LD PRELOAD mechanism providedby Linux. The generation of a wrapper library is done using the vtlibwrapgencommand and consists of two steps. The first step generates a C source file,providing the wrapped functions of the library header file:
% vtlibwrapgen -g SDL -o SDLwrap.c /usr/include/SDL/*.h
This generates the source file SDLwrap.c that contains wrapper-functions forall library functions found in the header-files located in /usr/include/SDL/ andinstructs VampirTrace to assign these functions to the new group SDL.
The generated wrapper source file can be edited in order to add manual in-strumentation or alter attributes of the library wrapper. A detailed description canbe found in the generated source file or in the header file vt libwrap.h whichcan be found in the include directory of VampirTrace.
To adapt the library instrumentation it is possible to pass a filter file to the gen-eration process. The rules are like these for normal VampirTrace instrumenta-tion (see Section 5.1), where only 0 (exclude functions) and -1 (generally includefunctions) are allowed.
The second step is to compile the generated source file:
% vtlibwrapgen --build --shared -o libSDLwrap SDLwrap.c
This builds the shared library libSDLwrap.so which can be linked to theapplication or preloaded by using the environment variable LD PRELOAD:
% LD_PRELOAD=$PWD/libSDLwrap.so <executable>
For more information about the tool vtlibwrapgen see Section B.5.
15

3 Runtime Measurement
3. Runtime MeasurementRunning a VampirTrace instrumented application should normally result in anOTF trace file in the current working directory where the application was exe-cuted. If a problem occurs, set the environment variable VT VERBOSE to 2 beforeexecuting the instrumented application in order to see control messages of theVampirTrace runtime system which might help tracking down the problem.
The internal buffer of VampirTrace is limited to 32 MB per process. Use theenvironment variables VT BUFFER SIZE and VT MAX FLUSHES to increase thislimit. Section 3.3 contains further information on how to influence trace file size.
3.1. Trace File Name and Location
The default name of the trace file depends on the operating system where theapplication is run. On Linux, MacOS and Sun Solaris the trace file will be namedlike the application, e.g. hello.otf for the executable hello. For other sys-tems, the default name is a.otf. Optionally, the trace file name can be definedmanually by setting the environment variable VT FILE PREFIX to the desiredname. The suffix .otf will be added automatically.
To prevent overwriting of trace files by repetitive program runs, one can enableunique trace file naming by setting VT FILE UNIQUE to yes. In this case, Vam-pirTrace adds a unique number to the file names as soon as a second trace filewith the same name is created. A *.lock file is used to count up the number oftrace files in a directory. Be aware that VampirTrace potentially overwrites an ex-isting trace file if you delete this lock file. The default value of VT FILE UNIQUEis no. You can also set this variable to a number greater than zero, which will beadded to the trace file name. This way you can manually control the unique filenaming.
The default location of the final trace file is the working directory at applicationstart time. If the trace file shall be stored in another place, use VT PFORM GDIRas described in Section 3.2 to change the location of the trace file.
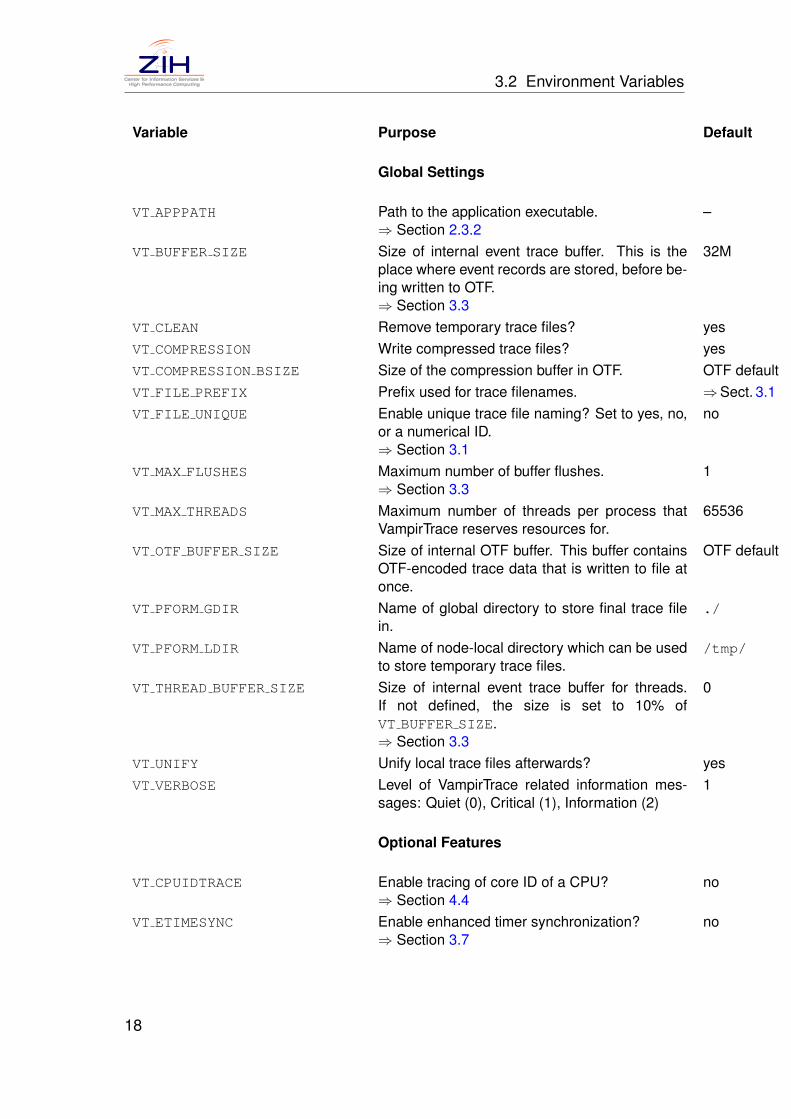
3.2. Environment Variables
The following environment variables can be used to control the measurement ofa VampirTrace instrumented executable:
17
3.2 Environment Variables
Variable Purpose Default
Global Settings
VT APPPATH Path to the application executable.⇒ Section 2.3.2
–
VT BUFFER SIZE Size of internal event trace buffer. This is theplace where event records are stored, before be-ing written to OTF.⇒ Section 3.3
32M
VT CLEAN Remove temporary trace files? yesVT COMPRESSION Write compressed trace files? yesVT COMPRESSION BSIZE Size of the compression buffer in OTF. OTF defaultVT FILE PREFIX Prefix used for trace filenames. ⇒Sect. 3.1VT FILE UNIQUE Enable unique trace file naming? Set to yes, no,
or a numerical ID.⇒ Section 3.1
no
VT MAX FLUSHES Maximum number of buffer flushes.⇒ Section 3.3
1
VT MAX THREADS Maximum number of threads per process thatVampirTrace reserves resources for.
65536
VT OTF BUFFER SIZE Size of internal OTF buffer. This buffer containsOTF-encoded trace data that is written to file atonce.
OTF default
VT PFORM GDIR Name of global directory to store final trace filein.
./
VT PFORM LDIR Name of node-local directory which can be usedto store temporary trace files.
/tmp/
VT THREAD BUFFER SIZE Size of internal event trace buffer for threads.If not defined, the size is set to 10% ofVT BUFFER SIZE.⇒ Section 3.3
0
VT UNIFY Unify local trace files afterwards? yesVT VERBOSE Level of VampirTrace related information mes-
sages: Quiet (0), Critical (1), Information (2)1
Optional Features
VT CPUIDTRACE Enable tracing of core ID of a CPU?⇒ Section 4.4
no
VT ETIMESYNC Enable enhanced timer synchronization?⇒ Section 3.7
no
18
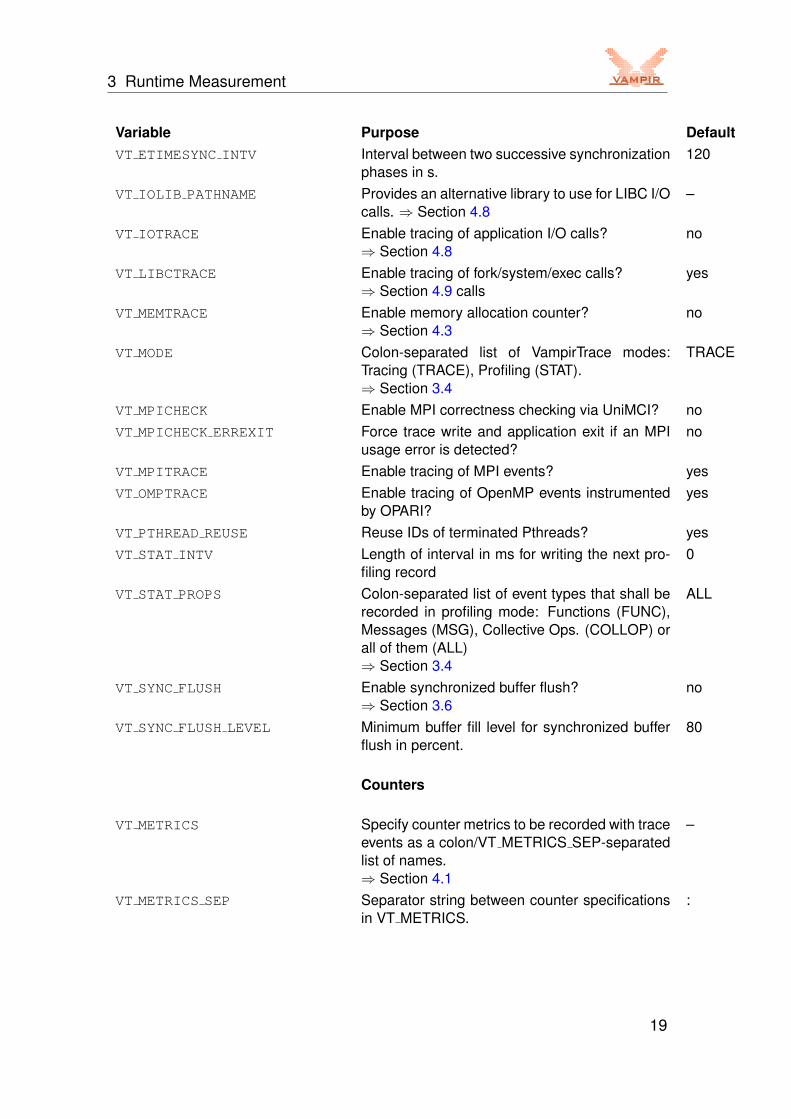
3 Runtime Measurement
Variable Purpose DefaultVT ETIMESYNC INTV Interval between two successive synchronization
phases in s.120
VT IOLIB PATHNAME Provides an alternative library to use for LIBC I/Ocalls. ⇒ Section 4.8
–
VT IOTRACE Enable tracing of application I/O calls?⇒ Section 4.8
no
VT LIBCTRACE Enable tracing of fork/system/exec calls?⇒ Section 4.9 calls
yes
VT MEMTRACE Enable memory allocation counter?⇒ Section 4.3
no
VT MODE Colon-separated list of VampirTrace modes:Tracing (TRACE), Profiling (STAT).⇒ Section 3.4
TRACE
VT MPICHECK Enable MPI correctness checking via UniMCI? noVT MPICHECK ERREXIT Force trace write and application exit if an MPI
usage error is detected?no
VT MPITRACE Enable tracing of MPI events? yesVT OMPTRACE Enable tracing of OpenMP events instrumented
by OPARI?yes
VT PTHREAD REUSE Reuse IDs of terminated Pthreads? yesVT STAT INTV Length of interval in ms for writing the next pro-
filing record0
VT STAT PROPS Colon-separated list of event types that shall berecorded in profiling mode: Functions (FUNC),Messages (MSG), Collective Ops. (COLLOP) orall of them (ALL)⇒ Section 3.4
ALL
VT SYNC FLUSH Enable synchronized buffer flush?⇒ Section 3.6
no
VT SYNC FLUSH LEVEL Minimum buffer fill level for synchronized bufferflush in percent.
80
Counters
VT METRICS Specify counter metrics to be recorded with traceevents as a colon/VT METRICS SEP-separatedlist of names.⇒ Section 4.1
–
VT METRICS SEP Separator string between counter specificationsin VT METRICS.
:
19

3.2 Environment Variables
Variable Purpose DefaultVT RUSAGE Colon-separated list of resource usage counters
which shall be recorded.⇒ Section 4.2
–
VT RUSAGE INTV Sample interval for recording resource usagecounters in ms.
100
VT PLUGIN CNTR METRICS Colon-separated list of plugin counter metricswhich shall be recorded.⇒ Section 4.7
–
Filtering, Grouping
VT DYN SHLIBS Colon-separated list of shared libraries forDyninst instrumentation.⇒ Section 2.6
–
VT DYN IGNORE NODBG Disable instrumentation of functions which haveno debug information?
no
VT DYN DETACH Detach Dyninst mutator-program vtdyn fromapplication process?
yes
VT FILTER SPEC Name of function/region filter file.⇒ Section 5.1
–
VT GROUPS SPEC Name of function grouping file.⇒ Section 5.3
–
VT JAVA FILTER SPEC Name of Java specific filter file.⇒ Section 5.2
–
VT GROUP CLASSES Create a group for each Java class automati-cally?
yes
VT ONOFF CHECK STACK BALANCE Check stack level balance when switching trac-ing on/off.⇒ Section 2.4.2
yes
VT MAX STACK DEPTH Maximum number of stack level to be traced.(0 = unlimited)
0
Symbol List
VT GNU NM Command to list symbols from object files.⇒ Section 2.3
nm
VT GNU NMFILE Name of file with symbol list information.⇒ Section 2.3
–
The variables VT PFORM GDIR, VT PFORM LDIR, VT FILE PREFIX may con-tain (sub)strings of the form $XYZ or ${XYZ} where XYZ is the name of another
20

3 Runtime Measurement
environment variable. Evaluation of the environment variable is done at mea-surement runtime.
When you use these environment variables, make sure that they have thesame value for all processes of your application on all nodes of your cluster.Some cluster environments do not automatically transfer your environment whenexecuting parts of your job on remote nodes of the cluster, and you may need toexplicitly set and export them in batch job submission scripts.
3.3. Influencing Trace Buffer Size
The default values of the environment variables VT BUFFER SIZE andVT MAX FLUSHES limit the internal buffer of VampirTrace to 32 MB per processand the number of times that the buffer is flushed to 1, respectively. Events thatare to be recorded after the limit has been reached are no longer written into thetrace file. The environment variables apply to every process of a parallel appli-cation, meaning that applications with n processes will typically create trace filesn times the size of a serial application.
To remove the limit and get a complete trace of an application, setVT MAX FLUSHES to 0. This causes VampirTrace to always write the buffer todisk when it is full. To change the size of the buffer, use the environment variableVT BUFFER SIZE. The optimal value for this variable depends on the applicationwhich is to be traced. Setting a small value will increase the memory availableto the application, but will trigger frequent buffer flushes by VampirTrace. Thesebuffer flushes can significantly change the behavior of the application. On theother hand, setting a large value, like 2G, will minimize buffer flushes by Vam-pirTrace, but decrease the memory available to the application. If not enoughmemory is available to hold the VampirTrace buffer and the application data,parts of the application may be swapped to disk, leading to a significant changein the behavior of the application.
In multi-threaded applications a single buffer cannot be shared across a pro-cess and the associated threads for performance reasons. Thus independentbuffers are created for every process and thread, at which the process buffer sizeis 70% and the thread buffer size is 10% of the value set in VT BUFFER SIZE.The buffer size of processes and threads can be explicitly specified setting theenvironment variable VT THREAD BUFFER SIZE, which defines the buffer sizeof a thread, whereas the buffer size of a process is then defined by the value ofVT BUFFER SIZE.
Note that you can decrease the size of trace files significantly by using theruntime function filtering as explained in Section 5.1.
21
3.4 Profiling an Application
3.4. Profiling an Application
Profiling an application collects aggregated information about certain events dur-ing a program run, whereas tracing records information about individual events.Profiling can therefore be used to get a summary of the program activity and todetect events that are called very often. The profiling information can also beused to generate filter rules to reduce the trace file size (⇒ Section 5.1).
To profile an application set the variable VT MODE to STAT. Setting VT MODE toSTAT:TRACE tells VampirTrace to perform tracing and profiling at the same time.By setting the variable VT STAT PROPS the user can influence whether functions,messages, and/or collective operations shall be profiled. See Section 3.2 forinformation about these environment variables.
3.5. Unification of Local Traces
After a run of an instrumented application the traces of the single processes needto be unified in terms of timestamps and event IDs. In most cases, this happensautomatically. If the environment variable VT UNIFY is set to no or under certaincircumstances it is necessary to perform unification of local traces manually. Todo this, use the following command:
% vtunify <prefix>
If VampirTrace was built with support for OpenMP and/or MPI, it is possible tospeedup the unification of local traces significantly. To distribute the unificationon multible processes the MPI parallel version vtunify-mpi can be used asfollow:
% mpirun -np <nranks> vtunify-mpi <prefix>
Furthermore, both tools vtunify and vtunify-mpi are capable to open ad-ditional OpenMP threads for unification. The number of threads can be specifiedby the OMP NUM THREADS environment variable.
3.6. Synchronized Buffer Flush
When tracing an application, VampirTrace temporarily stores the recorded eventsin a trace buffer. Typically, if a buffer of a process or thread has reached its maxi-mum fill level, the buffer has to be flushed and other processes or threads maybehave to wait for this process or thread. This will result in an asynchronous run-time behavior.To avoid this problem, VampirTrace provides a buffer flush in a synchronized
22
3 Runtime Measurement
manner. That means, if one buffer has reached its minimum buffer fill levelVT SYNC FLUSH LEVEL (⇒ Section 3.2), all buffers will be flushed. This bufferflush is only available at appropriate points in the program flow. Currently, Vam-pirTrace makes use of all MPI collective functions associated withMPI COMM WORLD. Use the environment variable VT SYNC FLUSH to enable syn-chronized buffer flush.
3.7. Enhanced Timer Synchronization
Especially on cluster environments, where each process has its own local timer,tracing relies on precisely synchronized timers. Therefore, VampirTrace pro-vides several mechanisms for timer synchronization. The default synchroniza-tion scheme is a linear synchronization at the very begin and the very end of atrace run with a master-slave communication pattern.However, this way of synchronization can become to imprecise for long traceruns. Therefore, we recommend the usage of the enhanced timer synchroniza-tion scheme of VampirTrace. This scheme inserts additional synchronizationphases at appropriate points in the program flow. Currently, VampirTrace makesuse of all MPI collective functions associated with MPI COMM WORLD.To enable this synchronization scheme, a LAPACK library with C wrapper sup-port has to be provided for VampirTrace and the environment variableVT ETIMESYNC (⇒ Section 3.2) has to be set before the tracing.The length of the interval between two successive synchronization phases canbe adjusted with VT ETIMESYNC INTV.The following LAPACK libraries provide a C-LAPACK API that can be used byVampirTrace for the enhanced timer synchronization:
• CLAPACK CLAPACK1
• AMD ACML
• IBM ESSL
• Intel MKL
• SUN Performance Library
Note: Systems equipped with a global timer do not need timer synchronization.
Note: It is recommended to combine enhanced timer synchronization and syn-chronized buffer flush.
1www.netlib.org/clapack
23
3.8 Environment Configuration Using VTSetup
Note: Be aware that the asynchronous behavior of the application will be dis-turbed since VampirTrace makes use of asynchronous MPI collective functionsfor timer synchronization and synchronized buffer flush.Only make use of these approaches, if your application does not rely on anasynchronous behavior! Otherwise, keep this fact in mind during the process ofperformance analysis.
3.8. Environment Configuration Using VTSetup
In order to ease the process of configuring the runtime environment, the graphi-cal tool vtsetup has been added to the VampirTrace toolset. With the help of agraphical user interface, required environment variables can be configured. Thefollowing option categories can be managed:
• General Trace Settings: Configre the name of the executable as well asthe trace filename and set the trace buffer size.
• Optional Trace Features: Activate optional trace features, e.g. I/O tracingand tracing of memory usage.
• Counters: Activate PAPI counter and resource usage counter.
• Filtering and Grouping: Guided setup of filters and function group defini-tions.
Furthermore, the user is granted more fine-grained control by activating theAdvanced View button. The configuration can be saved to an XML file. Aftersuccessfull configuration, the application can be launched directly or a script canbe generated for manual execution.
24
4 Recording Additional Events and Counters
4. Recording Additional Eventsand Counters
4.1. Hardware Performance Counters
If VampirTrace has been built with hardware counter support (⇒ Appendix A),it is capable of recording hardware counter information as part of the eventrecords. To request the measurement of certain counters, the user is required toset the environment variable VT METRICS. The variable should contain a colon-separated list of counter names or a predefined platform-specific group.
The user can leave the environment variable unset to indicate that no countersare requested. If any of the requested counters are not recognized or the fulllist of counters cannot be recorded due to hardware resource limits, programexecution will be aborted with an error message.
PAPI Hardware Performance Counters
If the PAPI library is used to access hardware performance counters, metricnames can be any PAPI preset names or PAPI native counter names. For exam-ple, set
VT_METRICS=PAPI_FP_OPS:PAPI_L2_TCM:!CPU_TEMP1
to record the number of floating point instructions and level 2 cache misses (PAPIpreset counters), cpu temperature from the lm sensors component. The leadingexclamation mark let CPU TEMP1 be interpreted as absolute value counter. SeeSection C.1 for a full list of PAPI preset counters.
CPC Hardware Performance Counters
On Sun Solaris operating systems VampirTrace can make use of the CPC perfor-mance counter library to query the processor’s hardware performance counters.The counters which are actually available on your platform can be queried withthe tool vtcpcavail. The listed names can then be used within VT METRICSto tell VampirTrace which counters to record.
25
4.2 Resource Usage Counters
NEC SX Hardware Performance Counters
On NEC SX machines VampirTrace uses special register calls to query the pro-cessor’s hardware counters. Use VT METRICS to specify the counters that haveto be recorded. See Section C.3 for a full list of NEC SX hardware performancecounters.
4.2. Resource Usage Counters
The Unix system call getrusage provides information about consumed re-sources and operating system events of processes such as user/system time,received signals, and context switches.
If VampirTrace has been built with resource usage support, it is able to recordthis information as performance counters to the trace. You can enable tracing ofspecific resource counters by setting the environment variable VT RUSAGE to acolon-separated list of counter names, as specified in Section C.4. For example,set
VT_RUSAGE=ru_stime:ru_majflt
to record the system time consumed by each process and the number of pagefaults. Alternatively, one can set this variable to the value all to enable recordingof all 16 resource usage counters. Note that not all counters are supported by allUnix operating systems. Linux 2.6 kernels, for example, support only resourceinformation for six of them. See Section C.4 and the manual page of getrusagefor details.
The resource usage counters are not recorded at every event. They areonly read if 100 ms have passed since the last sampling. The interval can bechanged by setting VT RUSAGE INTV to the number of desired milliseconds.Setting VT RUSAGE INTV to zero leads to sampling resource usage countersat every event, which may introduce a large runtime overhead. Note that inmost cases the operating system does not update the resource usage informa-tion at the same high frequency as the hardware performance counters. SettingVT RUSAGE INTV to a value less than 10 ms does usually not improve the gran-ularity.
Be aware that, when using the resource usage counters for multi-threadedprograms, the information displayed is valid for the whole process and not foreach single thread.
4.3. Memory Allocation Counter
The GNU LIBC implementation provides a special hook mechanism that al-lows intercepting all calls to memory allocation and free functions (e.g. malloc,
26

4 Recording Additional Events and Counters
realloc, free). This is independent from compilation or source code access,but relies on the underlying system library.
If VampirTrace has been built with memory-tracing support (⇒ Appendix A),VampirTrace is capable of recording memory allocation information as part ofthe event records. To request the measurement of the application’s allocatedmemory, the user must set the environment variable VT MEMTRACE to yes.
Note: This approach to get memory allocation information requires changinginternal function pointers in a non-thread-safe way, so VampirTrace currentlydoes not support memory tracing for thread-able programs, e.g., programs par-allelized with OpenMP or Pthreads!
4.4. CPU ID Counter
The GNU LIBC implementation provides a function to determine the core id of aCPU on which the calling thread is running. VampirTrace uses this functionalityto record the current core identifier as counter. This feature can be activated bysetting the environment variable VT CPUIDTRACE to yes.
Note: To use this feature you need the GNU LIBC implementation at least inversion 2.6.
4.5. NVIDIA CUDA Runtime API and Kernels
When tracing CUDA applications, only user events and functions are recorded,which are automatically or manually instrumented. CUDA-Runtime API func-tions will not be traced by default. To enable tracing of CUDA runtime API func-tions and asynchronous CUDA tasks (like kernel execution and asynchronousmemory copies), build VampirTrace with CUDA support and set the environmentvariable VT CUDARTTRACE to yes.Every CUDA stream, which is executed on a cuda-capable device and usedduring program execution, creates an own thread. “CUDA-Threads” can containcommunication and kernel events and have the following notation:CUDA[device] process:thread
To ensure measurement of correct data rates for synchronous CUDA memorycopies, VampirTrace inserts a CUDA synchronization before. Otherwise theCUDA memory copy call would do the synchronization and it was not possible toget correct transfer rates.As kernel execution and asynchronous memory copies are not executed directly,they will be buffered until a synchronizing CUDA Runtime API function call or the
27
4.5 NVIDIA CUDA Runtime API and Kernels
programs exit. The buffer size can be specified in bytes (default: 8192) with theenvironment variable VT CUDATRACE BUFFER SIZE.Several new region groups have been introduced:
CUDART API CUDA runtime API callsCUDA SYNC CUDA synchronizationCUDA KERNEL CUDA kernels/functions can only appear on
“CUDA-Threads”CUDA IDLE GPU idle time – the CUDA device does not run any
kernel currently (can only appear in one stream ofthe device)
VT CUDA VampirTrace overhead (write CUDA events, checkcurrent device, etc.)
Additional feature switches (environment variables) to customize CUDA runtimetracing:
VT CUDATRACE KERNEL (default: yes)Tracing of CUDA kernels is enabled/disabled.
VT CUDATRACE MEMCPYASYNC (default: yes)Tracing of asynchronous CUDA memory copies is enabled/disabled.
VT CUDATRACE IDLE (default: no)Show the GPU idle time on a CUDA stream, if set to yes.
VT CUDATRACE GPUMEMUSAGE (default: no)Visualize GPU memory usage as counter “gpu mem usage“, if set to yes.
VT CUDATRACE SYNC (default: yes or 3)Controls how VampirTrace handles synchronizing CUDA API calls, espe-cially cudaMemcpy and cudaThreadSynchronize. At level 0 only the CUDAcalls will be executed, messages will be displayed from the beginning to theend of the cudaMemcpy, regardless how long the cudaMemcpy call has towait for a kernel until the actual data transfer starts. At level 1 the cu-daMemcpy will be split into an additional synchronization and the actualdata transfer in order to monitor the data transfer correctly. The additionalsynchronization does not affect the program execution significantly and willnot be shown in the trace. At level 2 the additional synchronization will beexposed to the user. This allows a better view on the application execution,showing how much time is actually spent waiting for a kernel to completeduring synchronization. Level 3 will further use the synchronization to flushthe internal task buffer and perform a timer synchronization between GPUund and host. This introduces a minimal overhead but increases timer pre-cision and prevents flushes elsewhere in the trace.
28

4 Recording Additional Events and Counters
VT CUPTI METRICS (default: "")Capture CUDA CUPTI counters. Metrics are separated by default with ”:“or user specified by VT METRICS SEP.Example: VT CUPTI METRICS=local store:local load
VT CUPTI SAMPLING (default: no)Poll for CUPTI counter values during kernel execution, if set to yes.
VT CUPTI API CALLBACK (default: no)Use CUPTI callback API to intercept CUDA runtime calls.
VT GPUTRACE ERROR (default: no)Print out an error message and exit the program, if a function call to a GPUlibrary does not return succesfully. The default is just a warning messagewithout program exit.
VT GPUTRACE DEBUG (default: no)Do not cleanup all GPU ressources (profiling events, contexts, event groups),as they might have been already implicitly cleaned up by the GPU runtime.
Until CUDA Runtime Version 4.0 and CUDA Driver for Linux 270.41.19 the usageof CUDA events between asynchronous tasks serializes their on-device execu-tion. This seems to be a bug, which has already been reported to NVIDIA. AsVampirTrace uses CUDA events for time measurement and asynchronous tasksmay overlap (depends on the CUDA device capability), there might be a sensibleimpact on the program flow. The current workaround is to disable tracing of ker-nels and/or asynchronous memory copies via the given environment variables.
CUDA runtime API Counter
If VT CUDATRACE GPUMEMUSAGE is enabled, cudaMalloc and cudaFree func-tions will be tracked to write the GPU memory usage counter gpu mem usage.
There are three counters, which provide some information about the kernelgrid, block and thread compostion (blocks per grid, threads per block,threads per kernel).
CUDA Performance Counters – CUPTI Events
To capture performance counters in CUDA applications, CUPTI metrics can bespecified with the environment variable VT CUPTI METRICS. Metrics are sep-arated by default with ”:“ or user specified by VT METRICS SEP. The CUPTIUser’s Guide provides information about the available counters. Alternativelyset VT CUPTI METRICS=help to show a list of available counters (help longto print the counter description as well).
29
4.5 NVIDIA CUDA Runtime API and Kernels
Tracing CUDA runtime API via CUPTI Callbacks
As there are systems, that does not support dynamic libraries, the CUDA runtimeAPI can be traced via the CUPTI callback interface, implemented in VampirTrace.
If tracing via CUPTI callbacks is enabled (VT CUPTI API CALLBACK=yes)and the CUDA runtime wrapper has been configured into the VampirTrace li-braries, the CUDA runtime library should be preloaded to reduce tracing over-head (LD PRELOAD=libcudart.so).
Currently CUPTI does not support tracing of asynchronous tasks. If tracing ofkernels or asynchronous memory copies is enabled, they will be synchronizeddirectly after the call to retrieve their runtime. This may be improved in futurereleases.
Compile and Link CUDA applications
Use the VampirTrace compiler wrapper vtnvcc instead of nvcc to compile theCUDA application, which does automatic source code instrumenation.
GCC4.3 and OpenMP:Use the flags -vt:opari -nodecl -Xcompiler=-fopenmp with vtnvcc tocompile the OpenMP CUDA application.
CUDA 3.1:The CUDA runtime library 3.1 creates a conflict with zlib. A workaround is to re-place all gcc/g++ calls with the VampirTrace compiler wrappers (vtcc/vtc++)and pass the following additional flags to nvcc for compilation of the kernels:
-I$VT_INSTALL_PATH/include/vampirtrace-L$VT_INSTALL_PATH/lib-Xcompiler=-g,-finstrument-functions,-pthread-lvt -lotf -lcudart -lz -ldl -lm
$VT INSTALL PATH is the path to the VampirTrace installation directory. It is not necessary tospecify the VampirTrace include and library path, if it is installed in the default directory.
This uses automatic compiler instrumentation (-finstrument-functions)and the standard VampirTrace library. Replace the -lvt with -lvt-mt for multi-threaded, -lvt-mpi for MPI and -lvt-hyb for multithreaded MPI applications.In this case the CUDA runtime library is linked before the zlib.
If the application is linked with gcc/g++, the linking command has to ensure,that the respective VampirTrace library is linked before the CUDA runtime librarylibcudart.so (check e.g. with “ldd executable”). Using the VampirTrace com-piler wrappers (vtcc/vtc++) for linking is the easiest way to ensure correctlinking of the VampirTrace library.
30

4 Recording Additional Events and Counters
With the library tracing mechanism described in section 2.9, it is possible totrace CUDA applications without recompiling or relinking. There are only eventswritten for Runtime API calls, kernels and communication between host and de-vice.
Tracing the NVIDIA CUDA SDK 3.x and 4.0
To get some example traces, replace the compiler commands in the commonMakefile include file (common/common.mk) with the corresponding VampirTracecompiler wrappers (⇒2.1) for automatic instrumentation:
# CompilersNVCC := vtnvccCXX := vtc++CC := vtccLINK := vtc++ #-vt:mt
Use the compiler switches for MPI, multithreaded and hybrid programs, if nec-essary (e.g. the CUDA SDK example simpleMultiGPU is a multithreaded pro-gram, which needs to be linked with a multithreaded VampirTrace library – un-comment the compiler switch in the linker command to use the multithreadedVampirTrace library).
Multithreaded CUDA applications
If threads are used to invoke asynchronous CUDA tasks, make sure to call asynchronizing CUDA function to get the tasks flushed before the thread exits.Otherwise tasks may not be flushed and will be missing in the trace file.
Mixed Use of CUDA runtime and driver API
As CUDA runtime API may implicitly create and destroy CUDA contexts, theremight occur problems during CUDA event flushing. To workaround such an is-sue use only one API for interaction (memory copies, kernel execution) with theCUDA device. If you have to mix both APIs, make a clean exit for the API, whichused the asynchronous tasks, before the other API closes its thread or context– cudaThreadExit() for runtime API and cuCtxDestroy() for driver API. Otherwisenot yet flushed, asynchronous tasks will be missing in the final trace.
31

4.6 Pthread API Calls
Note:For 32-bit systems VampirTrace has to be configured with the 32-bit versionof cuda runtime library. If the link test fails, use the following configure option(⇒A.2):
--with-cuda-lib-dir=$CUDA_INSTALL_PATH/lib
VampirTrace CUDA has been succesfully tested with the CUDA runtime version3.x and 4.0.
4.6. Pthread API Calls
When tracing applications with Pthreads, only user events and functions arerecorded which are automatically or manually instrumented. Pthread API func-tions will not be traced by default.To enable tracing of all C-Pthread API functions include the header vt user.hand compile the instrumented sources with -DVTRACE PTHREAD.
C/C++:#include "vt_user.h"
% vtcc -DVTRACE PTHREAD hello.c -o hello
Note: Currently, Pthread instrumentation is only available for C/C++.
4.7. Plugin Counter Metrics
Plugin Counter add additional metrics to VampirTrace. They highly depend onthe plugins, which are installed on your system. Every plugin should providea README, which should be checked for available metrics. Once you havedownloaded and compiled a plugin, copy the resulting library to a folder, whichis part of your LD LIBRARY PATH. To enable the tracing of a specific metric, youshould set the environment variable VT PLUGIN CNTR METRICS. It is set in thefollowing manner
export VT_PLUGIN_CNTR_METRICS=<library_name>_<event_name>
If you have for example a library named libKswEvents.so with the eventpage faults, the you can set it with
export VT_PLUGIN_CNTR_METRICS=KswEvents_page_faults
Visit http://www.tu-dresden.de/zih/vampirtrace/plugin_counterfor documentation and examples.
32

4 Recording Additional Events and Counters
Note: Multiple events can be concatenated by using colons.
4.8. I/O Calls
Calls to functions which reside in external libraries can be intercepted by imple-menting identical functions and linking them before the external library. Such“wrapper functions” can record the parameters and return values of the libraryfunctions.
If VampirTrace has been built with I/O tracing support, it uses this techniquefor recording calls to I/O functions of the standard C library, which are executedby the application. The following functions are intercepted by VampirTrace:
close creat creat64 dupdup2 fclose fcntl fdopenfgetc fgets flockfile fopenfopen64 fprintf fputc fputsfread fscanf fseek fseekofseeko64 fsetpos fsetpos64 ftrylockfilefunlockfile fwrite getc getslockf lseek lseek64 openopen64 pread pread64 putcputs pwrite pwrite64 readreadv rewind unlink writewritev
The gathered information will be saved as I/O event records in the trace file.This feature has to be activated for each tracing run by setting the environmentvariable VT IOTRACE to yes.
This works for both dynamically and statically linked executables. Note thatwhen linking statically, a warning like the following may be issued: Using ’dlopen’in statically linked applications requires at runtime the shared libraries from theglibc version used for linking. This is ok as long as the mentioned libraries areavailable for running the application.
If you’d like to experiment with some other I/O library, set the environmentvariable VT IOLIB PATHNAME to the alternative one. Beware that this librarymust provide all I/O functions mentioned above otherwise VampirTrace will abort.
4.9. fork/system/exec Calls
If VampirTrace has been built with LIBC trace support (⇒ Appendix A), it is capa-ble of tracing programs which call functions from the LIBC exec family (execl,execlp, execle, execv, execvp, execve), system, and fork. VampirTrace
33

4.10 MPI Correctness Checking Using UniMCI
records the call of the LIBC function to the trace. This feature works for sequen-tial (i.e. no MPI or threaded parallelization) programs only. It works for bothdynamically and statically linked executables. Note that when linking statically, awarning like the following may be issued: Using ’dlopen’ in statically linked ap-plications requires at runtime the shared libraries from the glibc version used forlinking. This is ok as long as the mentioned libraries are available for running theapplication.
When VampirTrace detects a call of an exec function, the current trace fileis closed before executing the new program. If the executed program is alsoinstrumented with VampirTrace, it will create a different trace file. Note that Vam-pirTrace aborts if the exec function returns unsuccessfully.
Calling fork in an instrumented program creates an additional process in thesame trace file.
4.10. MPI Correctness Checking Using UniMCI
VampirTrace supports the recording of MPI correctness events, e.g., usage of in-valid MPI requests. This is implemented by using the Universal MPI CorrectnessInterface (UniMCI), which provides an interface between tools like VampirTraceand existing runtime MPI correctness checking tools. Correctness events arestored as markers in the trace file and are visualized by Vampir.
If VampirTrace is built with UniMCI support, the user only has to enable MPIcorrectness checking. This is done by merely setting the environment variableVT MPICHECK to yes. Further, if your application crashes due to an MPI erroryou should set VT MPICHECK ERREXIT to yes. This environmental variableforces VampirTrace to write its trace to disk and exit afterwards. As a result, thetrace with the detected error is stored before the application might crash.
To install VampirTrace with correctness checking support it is necessary tohave UniMCI installed on your system. UniMCI in turn requires you to have asupported MPI correctness checking tool installed, currently only the tool Marmotis known to have UniMCI support. So all in all you should use the following orderto install with correctness checking support:
1. Marmot(see http://www.hlrs.de/organization/av/amt/research/marmot)
2. UniMCI(see http://www.tu-dresden.de/zih/unimci)
3. VampirTrace(see http://www.tu-dresden.de/zih/vampirtrace)
Information on how to install Marmot and UniMCI is given in their respec-tive manuals. VampirTrace will automatically detect an UniMCI installation if theunimci-config tool is in path.
34
4 Recording Additional Events and Counters
4.11. User-defined Counters
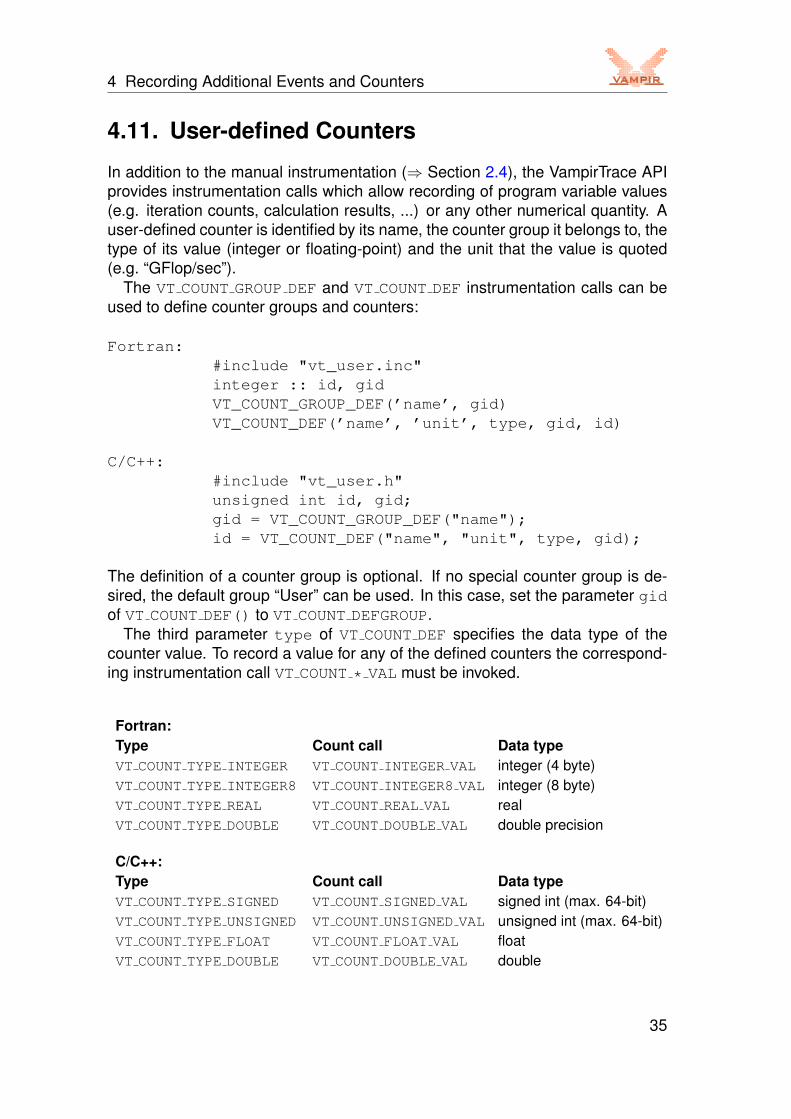
In addition to the manual instrumentation (⇒ Section 2.4), the VampirTrace APIprovides instrumentation calls which allow recording of program variable values(e.g. iteration counts, calculation results, ...) or any other numerical quantity. Auser-defined counter is identified by its name, the counter group it belongs to, thetype of its value (integer or floating-point) and the unit that the value is quoted(e.g. “GFlop/sec”).
The VT COUNT GROUP DEF and VT COUNT DEF instrumentation calls can beused to define counter groups and counters:
Fortran:#include "vt_user.inc"integer :: id, gidVT_COUNT_GROUP_DEF(’name’, gid)VT_COUNT_DEF(’name’, ’unit’, type, gid, id)
C/C++:#include "vt_user.h"unsigned int id, gid;gid = VT_COUNT_GROUP_DEF("name");id = VT_COUNT_DEF("name", "unit", type, gid);
The definition of a counter group is optional. If no special counter group is de-sired, the default group “User” can be used. In this case, set the parameter gidof VT COUNT DEF() to VT COUNT DEFGROUP.
The third parameter type of VT COUNT DEF specifies the data type of thecounter value. To record a value for any of the defined counters the correspond-ing instrumentation call VT COUNT * VAL must be invoked.
Fortran:Type Count call Data typeVT COUNT TYPE INTEGER VT COUNT INTEGER VAL integer (4 byte)VT COUNT TYPE INTEGER8 VT COUNT INTEGER8 VAL integer (8 byte)VT COUNT TYPE REAL VT COUNT REAL VAL realVT COUNT TYPE DOUBLE VT COUNT DOUBLE VAL double precision
C/C++:Type Count call Data typeVT COUNT TYPE SIGNED VT COUNT SIGNED VAL signed int (max. 64-bit)VT COUNT TYPE UNSIGNED VT COUNT UNSIGNED VAL unsigned int (max. 64-bit)VT COUNT TYPE FLOAT VT COUNT FLOAT VAL floatVT COUNT TYPE DOUBLE VT COUNT DOUBLE VAL double
35
4.11 User-defined Counters
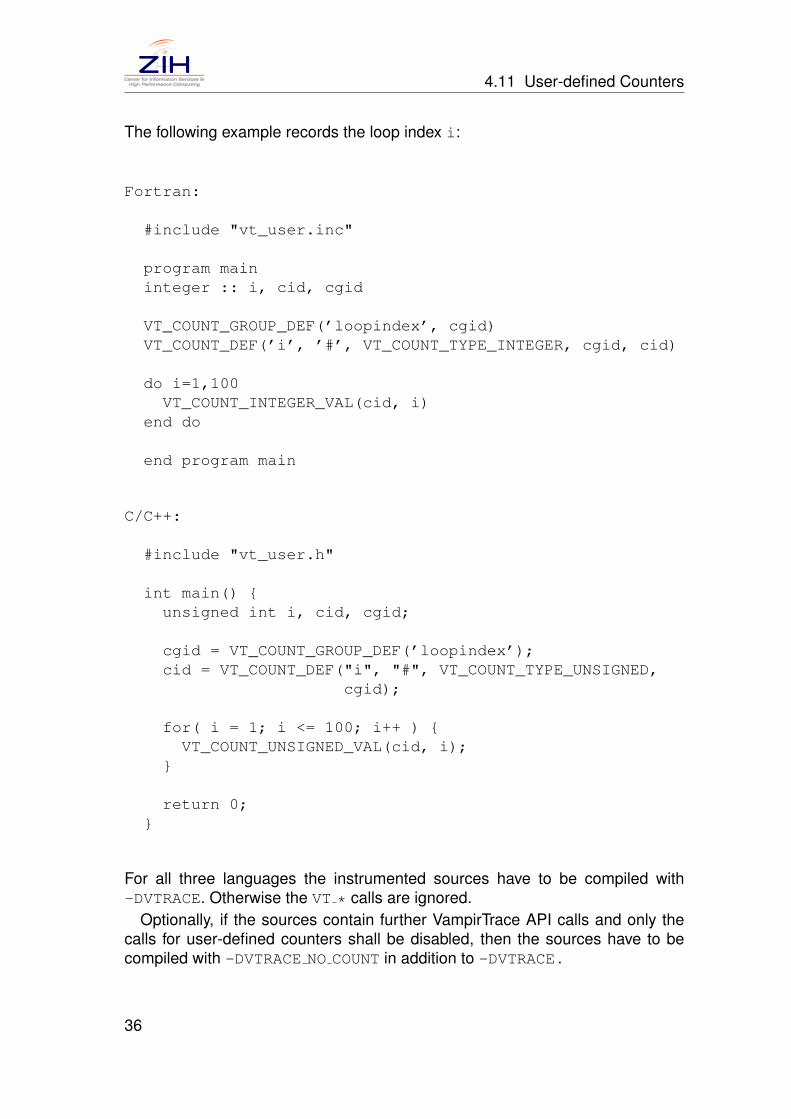
The following example records the loop index i:
Fortran:
#include "vt_user.inc"
program maininteger :: i, cid, cgid
VT_COUNT_GROUP_DEF(’loopindex’, cgid)VT_COUNT_DEF(’i’, ’#’, VT_COUNT_TYPE_INTEGER, cgid, cid)
do i=1,100VT_COUNT_INTEGER_VAL(cid, i)
end do
end program main
C/C++:
#include "vt_user.h"
int main() {unsigned int i, cid, cgid;
cgid = VT_COUNT_GROUP_DEF(’loopindex’);cid = VT_COUNT_DEF("i", "#", VT_COUNT_TYPE_UNSIGNED,
cgid);
for( i = 1; i <= 100; i++ ) {VT_COUNT_UNSIGNED_VAL(cid, i);
}
return 0;}
For all three languages the instrumented sources have to be compiled with-DVTRACE. Otherwise the VT * calls are ignored.
Optionally, if the sources contain further VampirTrace API calls and only thecalls for user-defined counters shall be disabled, then the sources have to becompiled with -DVTRACE NO COUNT in addition to -DVTRACE .
36
4 Recording Additional Events and Counters
4.12. User-defined Markers
In addition to the manual instrumentation (⇒ Section 2.4), the VampirTrace APIprovides instrumentation calls which allow recording of special user information,which can be used to better identify parts of interest. A user-defined marker isidentified by its name and type.
Fortran:#include "vt_user.inc"integer :: midVT_MARKER_DEF(’name’, type, mid)VT_MARKER(mid, ’text’)
C/C++:#include "vt_user.h"unsigned int mid;mid = VT_MARKER_DEF("name",type);VT_MARKER(mid, "text");
Types for Fortran/C/C++:VT_MARKER_TYPE_ERRORVT_MARKER_TYPE_WARNINGVT_MARKER_TYPE_HINT
For all three languages the instrumented sources have to be compiled with-DVTRACE. Otherwise the VT * calls are ignored.
Optionally, if the sources contain further VampirTrace API calls and only thecalls for user-defined markers shall be disabled, then the sources have to becompiled with -DVTRACE NO MARKER in addition to -DVTRACE .
4.13. User-defined Communcation
In addition to the manual instrumentation (⇒ Section 2.4), the VampirTrace APIprovides instrumentation calls which allow recording of special user information,which can be used to better identify parts of interest. A user-defined commu-nication operation is defined by a communicator and a tag. The default com-municator is VT COMM WORLD. Additionally, a user-defined communicator can becreated using VT COMM DEF:
Fortran:#include "vt_user.inc"integer :: cidVT_COMM_DEF(’name’, cid)
37
4.13 User-defined Communcation
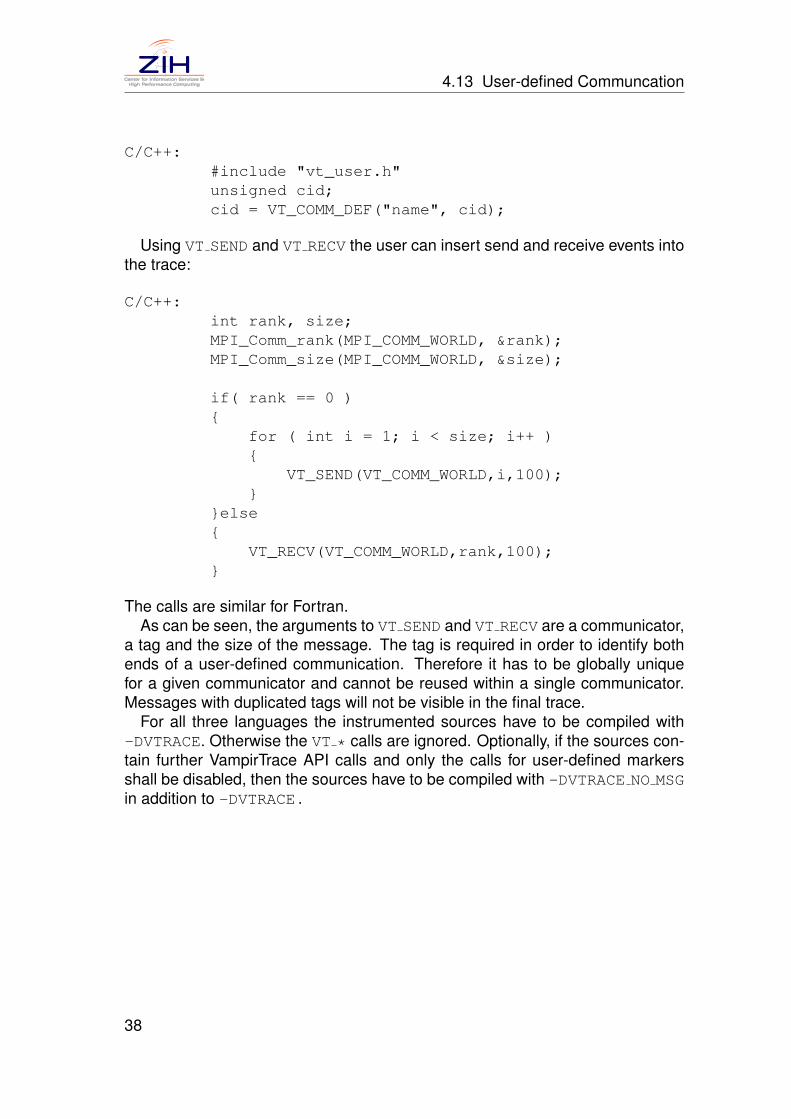
C/C++:#include "vt_user.h"unsigned cid;cid = VT_COMM_DEF("name", cid);
Using VT SEND and VT RECV the user can insert send and receive events intothe trace:
C/C++:int rank, size;MPI_Comm_rank(MPI_COMM_WORLD, &rank);MPI_Comm_size(MPI_COMM_WORLD, &size);
if( rank == 0 ){
for ( int i = 1; i < size; i++ ){
VT_SEND(VT_COMM_WORLD,i,100);}
}else{
VT_RECV(VT_COMM_WORLD,rank,100);}
The calls are similar for Fortran.As can be seen, the arguments to VT SEND and VT RECV are a communicator,
a tag and the size of the message. The tag is required in order to identify bothends of a user-defined communication. Therefore it has to be globally uniquefor a given communicator and cannot be reused within a single communicator.Messages with duplicated tags will not be visible in the final trace.
For all three languages the instrumented sources have to be compiled with-DVTRACE. Otherwise the VT * calls are ignored. Optionally, if the sources con-tain further VampirTrace API calls and only the calls for user-defined markersshall be disabled, then the sources have to be compiled with -DVTRACE NO MSGin addition to -DVTRACE .
38
5 Filtering & Grouping
5. Filtering & Grouping
5.1. Function Filtering
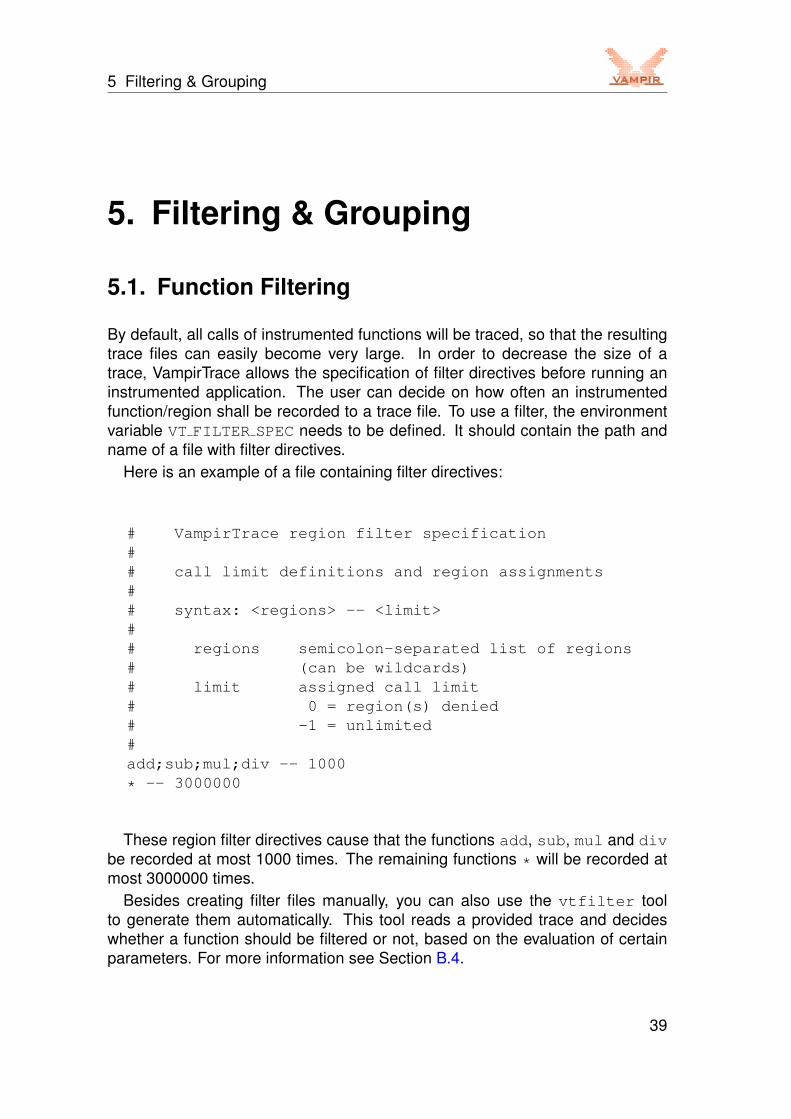
By default, all calls of instrumented functions will be traced, so that the resultingtrace files can easily become very large. In order to decrease the size of atrace, VampirTrace allows the specification of filter directives before running aninstrumented application. The user can decide on how often an instrumentedfunction/region shall be recorded to a trace file. To use a filter, the environmentvariable VT FILTER SPEC needs to be defined. It should contain the path andname of a file with filter directives.
Here is an example of a file containing filter directives:
# VampirTrace region filter specification## call limit definitions and region assignments## syntax: <regions> -- <limit>## regions semicolon-separated list of regions# (can be wildcards)# limit assigned call limit# 0 = region(s) denied# -1 = unlimited#add;sub;mul;div -- 1000
* -- 3000000
These region filter directives cause that the functions add, sub, mul and divbe recorded at most 1000 times. The remaining functions * will be recorded atmost 3000000 times.
Besides creating filter files manually, you can also use the vtfilter toolto generate them automatically. This tool reads a provided trace and decideswhether a function should be filtered or not, based on the evaluation of certainparameters. For more information see Section B.4.
39
5.2 Java Specific Filtering
Rank Specific Filtering
An experimental extension allows rank specific filtering. Use @ clauses to restrictall following filters to the given ranks. The rank selection must be given as a listof <from> - <to> pairs or single values. Note that all rank specific rules areonly effective after MPI Init because the ranks is unknown before. The optionalargument -- OFF disables the given ranks completely, regardless of followingfilter rules.
@ 35 - 42 -- OFF@ 4 - 10, 20 - 29, 34foo;bar -- 2000
* -- 0
The example defines two limits for the ranks 4 - 10, 20 - 29, and 34. The firstline disables the ranks 35 - 42 completely.
Attention: The rank specific rules are activated later than usual at MPI Init,because the ranks are not available earlier. The special MPI routines MPI Init,MPI Init thread, and MPI Initialized cannot be filtered in this way.
5.2. Java Specific Filtering
For Java tracing there are additional possibilities of filtering. Firstly, there is a de-fault filter applied. The rules can be found in the filter file <vt-install>/etc/vt-java-default-filter.spec . Secondly, user-defined filters can be ap-plied additionally by setting VT JAVA FILTER SPEC to a file containing the rules.
The syntax of the filter rules is as follows:
<method|thread> <include|exclude> <filter string[;fs]...>
Filtering can be done on thread names and method names, defined by the firstparameter. The second parameter determines whether the matching item shallbe included for tracing or excluded from it. Multiple filter strings on a line have tobe separated by ; and may contain occurences of * for wildcard matching.
The user-supplied filter rules will be applied before the default filter and thefirst match counts so it is possible to include items that would be excluded by thedefault filter otherwise.
5.3. Function Grouping
VampirTrace allows assigning functions/regions to a group. Groups can, for in-stance, be highlighted by different colors in Vampir displays. The following stan-dard groups are created by VampirTrace:
40

5 Filtering & Grouping
Group name Contained functions/regionsMPI MPI functionsOMP OpenMP API function callsOMP SYNC OpenMP barriersOMP PREG OpenMP parallel regionsPthreads Pthread API function callsMEM Memory allocation functions (⇒ Section 4.3)I/O I/O functions (⇒ Section 4.8)LIBC LIBC fork/system/exec functions (⇒ Section 4.9)Application remaining instrumented functions and source code regions
Additionally, you can create your own groups, e.g., to better distinguish differ-ent phases of an application. To use function/region grouping set the environ-ment variable VT GROUPS SPEC to the path of a file which contains the groupassignments. Below, there is an example of how to use group assignments:
# VampirTrace region groups specification## group definitions and region assignments## syntax: <group>=<regions>## group group name# regions semicolon-separated list of regions# (can be wildcards)#CALC=add;sub;mul;divUSER=app_*
These group assignments associate the functions add, sub, mul and div withgroup “CALC”, and all functions with the prefix app are associated with group“USER”.
41

A VampirTrace Installation
A. VampirTrace Installation
A.1. Basics
Building VampirTrace is typically a combination of running configure andmake. Execute the following commands to install VampirTrace from the direc-tory at the top of the tree:
% ./configure --prefix=/where/to/install[...lots of output...]% make all install
If you need special access for installing, you can execute make all as a userwith write permissions in the build tree and a separate make install as a userwith write permissions to the install tree.
However, for more details, also read the following instructions. Sometimes itmight be necessary to provide ./configure with options, e.g., specificationsof paths or compilers.
VampirTrace comes with example programs written in C, C++, and Fortran.They can be used to test different instrumentation types of the VampirTrace in-stallation. You can find them in the directory examples of the VampirTrace pack-age.
Note that you should compile VampirTrace with the same compiler you use forthe application to trace, see D.1.
A.2. Configure Options
Compilers and Options
Some systems require unusual options for compiling or linking which theconfigure script does not know. Run ./configure --help for details onsome of the pertinent environment variables.
You can pass initial values for configuration parameters to configure by set-ting variables in the command line or in the environment. Here is an example:
% ./configure CC=c89 CFLAGS=-O2 LIBS=-lposix
43

A.2 Configure Options
Installation Names
By default, make install will install the package’s files in /usr/local/bin,/usr/local/include, etc. You can specify an installation prefix other than/usr/local by giving configure the option --prefix=PATH.
Optional Features
This a summary of the most important optional features. For a full list of allavailable features run ./configure --help.
--enable-compinst=TYPEenable support for compiler instrumentation, e.g. gnu,pgi,pgi9,sundefault: automatically by configure. Note: Use pgi9 for PGI compiler ver-sion 9.0 or higher.
--enable-dyninstenable support for Dyninst instrumentation, default: enable if found by con-figure. Note: Requires Dyninst 1 version 6.1 or higher!
--enable-dyninst-attlibbuild shared library which attaches Dyninst to the running application, de-fault: enable if Dyninst found by configure and system supports sharedlibraries
--enable-tauinstenable support for automatic source code instrumentation by using TAU,default: enable if found by configure. Note: Requires PDToolkit 2 or TAU 3!
--enable-memtraceenable memory tracing support, default: enable if found by configure
--enable-cpuidtraceenable CPU ID tracing support, default: enable if found by configure
--enable-libtrace=LISTenable library tracing support (gen,libc,io), default: automatically by config-ure
--enable-rutraceenable resource usage tracing support, default: enable if found by config-ure
1http://www.dyninst.org2http://www.cs.uoregon.edu/research/pdt/home.php3http://tau.uoregon.edu
44

A VampirTrace Installation
--enable-metrics=TYPEenable support for hardware performance counter (papi,cpc,necsx),default: automatically by configure
--enable-zlibenable ZLIB trace compression support, default: enable if found by config-ure
--enable-mpienable MPI support, default: enable if MPI found by configure
--enable-fmpi-libbuild the MPI Fortran support library, in case your system does not havea MPI Fortran library. default: enable if no MPI Fortran library found byconfigure
--enable-fmpi-handle-convertdo convert MPI handles, default: enable if MPI conversion functions foundby configure
--enable-mpi2-threadenable MPI-2 Thread support, default: enable if found by configure
--enable-mpi2-1sidedenable MPI-2 One-Sided Communication support, default: enable if foundby configure
--enable-mpi2-extcollenable MPI-2 Extended Collective Operation support, default: enable iffound by configure
--enable-mpi2-ioenable MPI-2 I/O support, default: enable if found configure
--enable-mpicheckenable support for Universal MPI Correctness Interface (UniMCI), default:enable if unimci-config found by configure
--enable-etimesyncenable enhanced timer synchronization support, default: enable ifC-LAPACK found by configure
--enable-threads=LISTenable support for threads (pthread, omp), default: automatically by con-figure
--enable-javaenable Java support, default: enable if JVMTI found by configure
45
A.2 Configure Options
Important Optional Packages
This a summary of the most important optional features. For a full list of allavailable features run ./configure --help.
--with-platform=PLATFORMconfigure for given platform (altix,bgl,bgp,crayt3e,crayx1,crayxt,ibm,linux,macos,necsx,origin,sicortex,sun,generic), default:automatically by configure
--with-bitmode=32|64specify bit mode
--with-options=FILEload options from FILE, default: configure searches for a config file in con-fig/defaults based on given platform and bitmode
--with-local-tmp-dir=DIRgive the path for node-local temporary directory to store local traces to,default: /tmp
If you would like to use an external version of OTF library, set:
--with-extern-otfuse external OTF library, default: not set
--with-extern-otf-dir=OTFDIRgive the path for OTF, default: /usr
--with-otf-flags=FLAGSpass FLAGS to the OTF distribution configuration (only for internal OTFversion)
--with-otf-lib=OTFLIBuse given otf lib, default: -lotf -lz
If the supplied OTF library was built without zlib support then OTFLIB will be setto -lotf.
--with-dyninst-dir=DYNIDIRgive the path for DYNINST, default: /usr
--with-dyninst-inc-dir=DYNIINCDIRgive the path for Dyninst-include files, default: DYNIDIR/include
--with-dyninst-lib-dir=DYNILIBDIRgive the path for Dyninst-libraries, default: DYNIDIR/lib
46
A VampirTrace Installation
--with-dyninst-lib=DYNILIBuse given Dyninst lib, default: -ldyninstAPI
--with-tau-instrumentor=TAUINSTUMENTORgive the command for the TAU instrumentor, default: tau instrumentor
--with-pdt-cparse=PDTCPARSEgive the command for PDT C source code parser, default: cparse
--with-pdt-cxxparse=PDTCXXPARSEgive the command for PDT C++ source code parser, default: cxxparse
--with-pdt-fparse=PDTFPARSEgive the command for PDT Fortran source code parser, default: f95parse,f90parse, or gfparse
--with-papi-dir=PAPIDIRgive the path for PAPI, default: /usr
--with-cpc-dir=CPCDIRgive the path for CPC, default: /usr
If you have not specified the environment variable MPICC (MPI compiler com-mand) use the following options to set the location of your MPI installation:
--with-mpi-dir=MPIDIRgive the path for MPI, default: /usr/
--with-mpi-inc-dir=MPIINCDIRgive the path for MPI-include files,default: MPIDIR/include/
--with-mpi-lib-dir=MPILIBDIRgive the path for MPI-libraries, default: MPIDIR/lib/
--with-mpi-libuse given mpi lib
--with-pmpi-libuse given pmpi lib
If your system does not have an MPI Fortran library set --enable-fmpi-lib(see above), otherwise set:
--with-fmpi-libuse given fmpi lib
Use the following options to specify your MPI-implementation
47
A.2 Configure Options
--with-hpmpiset MPI-libs for HP MPI
--with-intelmpiset MPI-libs for Intel MPI
--with-intelmpi2set MPI-libs for Intel MPI2
--with-lamset MPI-libs for LAM/MPI
--with-mpibglset MPI-libs for IBM BG/L
--with-mpibgpset MPI-libs for IBM BG/P
--with-mpichset MPI-libs for MPICH
--with-mpich2set MPI-libs for MPICH2
--with-mvapichset MPI-libs for MVAPICH
--with-mvapich2set MPI-libs for MVAPICH2
--with-mpisxset MPI-libs for NEC MPI/SX
--with-mpisx-ewset MPI-libs for NEC MPI/SX with 8 Byte Fortran Integer
--with-openmpiset MPI-libs for Open MPI
--with-sgimptset MPI-libs for SGI MPT
--with-sunmpiset MPI-libs for SUN MPI
--with-sunmpi-mtset MPI-libs for SUN MPI-MT
48
A VampirTrace Installation
To enable enhanced timer synchronization a LAPACK library with C wrappersupport is needed:
--with-clapack-dir=LAPACKDIRset the path for CLAPACK, default: /usr
--with-clapack-libset CLAPACK-libs, default: -lclapack -lcblas -lf2c
--with-clapack-acmlset CLAPACK-libs for ACML
--with-clapack-esslset CLAPACK-libs for ESSL
--with-clapack-mklset CLAPACK-libs for MKL
--with-clapack-sunperfset CLAPACK-libs for SUN Performance Library
To enable Java support the JVM Tool Interface (JVMTI) version 1.0 or higher isrequired:
--with-jvmti-dir=JVMTIDIRgive the path for JVMTI, default: $JAVA HOME
--with-jvmti-inc-dir=JVMTIINCDIRgive the path for JVMTI-include files, default: JVMTI/include
To enable support for generating wrapper for 3th-Party libraries the C code parserCTool is needed:
--with-ctool-dir=CTOOLDIRgive the path for CTool, default: /usr
--with-ctool-inc-dir=CTOOLINCDIRgive the path for CTool-include files, default: CTOOLDIR/include
--with-ctool-lib-dir=CTOOLLIBDIRgive the path for CTool-libraries, default: CTOOLDIR/lib
--with-ctool-lib=CTOOLLIBuse given CTool lib, default: automatically by configure
To enable support for CUDA runtime API wrapping, the CUDA-Toolkit install pathis needed:
49

A.3 Cross Compilation
--with-cuda-dir=CUDATKDIRgive the path for CUDA Toolkit, default: /usr/local/cuda
--with-cuda-inc-dir=CUDATKINCDIRgive the path for CUDA Toolkit-include files, default: CUDATKDIR/include
--with-cuda-lib-dir=CUDATKLIBDIRgive the path for CUDA Toolkit-libraries, default: CUDATKDIR/lib64
--with-cudart-lib=CUDARTLIBuse given cudart lib, default: -lcudart
--with-cudart-shlib=CUDARTSHLIBgive the pathname for the shared CUDA runtime library, default: automati-cally by configure
To enable support for CUPTI counter capturing during CUDA runtime tracing, theCUPTI install path is needed:
--with-cupti-dir=CUPTIDIRgive the path for CUPTI, default: /usr
--with-cupti-inc-dir=CUPTIINCDIRgive the path for CUPTI-include files, default: CUPTIDIR/include
--with-cupti-lib-dir=CUPTILIBDIRgive the path for CUPTI-libraries, default: CUPTIDIR/lib
--with-cupti-lib=CUPTILIBuse given cupti lib, default: -lcupti
A.3. Cross Compilation
Building VampirTrace on cross compilation platforms needs some special at-tention. The compiler wrappers, OPARI, and the Library Wrapper Generatorare built for the front-end (build system) whereas the the VampirTrace libraries,vtdyn, vtunify, and vtfilter are built for the back-end (host system). Someconfigure options which are of interest for cross compilation are shown below:
• Set CC, CXX, F77, and FC to the cross compilers installed on the front-end.
• Set CC FOR BUILD and CXX FOR BUILD to the native compilers of thefront-end.
• Set --host= to the output of config.guess on the back-end.
50
A VampirTrace Installation
• Set --with-cross-prefix= to a prefix which will be prepended to theexecutables of the compiler wrappers and OPARI (default: “cross-”)
• Maybe you also need to set additional commands and flags for the back-end (e.g. RANLIB, AR, MPICC, CXXFLAGS).
For example, this configure command line works for an NEC SX6 system withan X86 64 based front-end:
% ./configure CC=sxcc CXX=sxc++ F77=sxf90 FC=sxf90 MPICC=sxmpiccAR=sxar RANLIB="sxar st" CC_FOR_BUILD=cc CXX_FOR_BUILD=c++--host=sx6-nec-superux14.1--with-cross-prefix=sx--with-otf-lib=-lotf
A.4. Environment Set-Up
Add the bin subdirectory of the installation directory to your $PATH environmentvariable. To use VampirTrace with Dyninst, you will also need to add the libsubdirectory to your LD LIBRARY PATH environment variable:
for csh and tcsh:
> setenv PATH <vt-install>/bin:$PATH> setenv LD_LIBRARY_PATH <vt-install>/lib:$LD_LIBRARY_PATH
for bash and sh:
% export PATH=<vt-install>/bin:$PATH% export LD_LIBRARY_PATH=<vt-install>/lib:$LD_LIBRARY_PATH
A.5. Notes for Developers
Build from SVN
If you have checked out a developer’s copy of VampirTrace (i.e. checked outfrom CVS), you should first run:
% ./bootstrap [--otf-package <package>][--version <version>]
Note that GNU Autoconf ≥2.60 and GNU Automake ≥1.9.6 are required. Youcan download them from http://www.gnu.org/software/autoconf andhttp://www.gnu.org/software/automake.
51


B Command Reference
B. Command Reference
B.1. Compiler Wrappers (vtcc,vtcxx,vtf77,vtf90)
vtcc,vtcxx,vtf77,vtf90 - compiler wrappers for C, C++,Fortran 77, Fortran 90
Syntax: vt<cc|cxx|f77|f90> [options] ...
options:-vt:help Show this help message.-vt:version Show VampirTrace version.-vt:<cc|cxx|f77|f90> <cmd>
Set the underlying compiler command.
-vt:inst <insttype> Set the instrumentation type.
possible values:
compinst fully-automatic by compilermanual manual by using VampirTrace’s APIdyninst binary by using Dyninst (www.dyninst.org)tauinst automatic source code instrumentation by
using PDT/TAU
-vt:opari <!args> Set options for OPARI command. (seeshare/vampirtrace/doc/opari/Readme.html)
-vt:opari-rcfile <file>Set pathname of the OPARI resource file.(default: opari.rc)
-vt:opari-table <file>Set pathname of the OPARI runtime table file.(default: opari.tab.c)
-vt:noopari Disable instrumentation of OpenMP contructsby OPARI.
-vt:<seq|mpi|mt|hyb>
53
B.1 Compiler Wrappers (vtcc,vtcxx,vtf77,vtf90)
Enforce application’s parallelization type.It’s only necessary if it could not be determinedautomatically based on underlying compiler and flags.seq = sequentialmpi = parallel (uses MPI)mt = parallel (uses OpenMP/POSIX threads)hyb = hybrid parallel (MPI + Threads)(default: automatically)
-vt:tau <!args> Set options for the TAU instrumentorcommand.
-vt:pdt <!args> Set options for the PDT parse command.
-vt:preprocess Preprocess the source files before parsingby OPARI and/or PDT.
-vt:cpp <cmd> Set C preprocessor command.
-vt:cppflags <[!]flags>Set/add flags for the C preprocessor.
-vt:verbose Enable verbose mode.
-vt:show[me] Do not invoke the underlying compiler.Instead, show the command line that would beexecuted to compile and link the program.
-vt:showme-compile Do not invoke the underlying compiler.Instead, show the compiler flags that would besupplied to the compiler.
-vt:showme-link Do not invoke the underlying compiler.Instead, show the linker flags that would besupplied to the compiler.
See the man page for your underlying compiler for otheroptions that can be passed through ’vt<cc|cxx|f77|f90>’.
Environment variables:VT_INST Equivalent to ’-vt:inst’VT_CC Equivalent to ’-vt:cc ’VT_CXX Equivalent to ’-vt:cxx ’VT_F77 Equivalent to ’-vt:f77’VT_F90 Equivalent to ’-vt:f90’VT_CFLAGS C compiler flags
54
B Command Reference
VT_CXXFLAGS C++ compiler flagsVT_F77FLAGS Fortran 77 compiler flagsVT_FCFLAGS Fortran 90 compiler flagsVT_LDFLAGS Linker flagsVT_LIBS Libraries to pass to the linker
The corresponding command line options overwrite theenvironment variables setting.
Examples:automatically instrumentation by compiler:
vtcc -vt:cc gcc -vt:inst compinst -c foo.c -o foo.ovtcc -vt:cc gcc -vt:inst compinst -c bar.c -o bar.ovtcc -vt:cc gcc -vt:inst compinst foo.o bar.o -o foo
manually instrumentation by using VT’s API:
vtf90 -vt:inst manual foobar.F90 -o foobar -DVTRACE
IMPORTANT: Fortran source files instrumented by VT’s APIhave to be preprocessed by CPP.
B.2. Local Trace Unifier (vtunify)
vtunify[-mpi] - local trace unifier for VampirTrace.
Syntax: vtunify[-mpi] <input trace prefix> [options]
options:-h, --help Show this help message.
-V, --version Show VampirTrace version.
-o PREFIX Prefix of output trace filename.
-f FILE Function profile output filename.(default=PREFIX.prof.txt)
-k, --keeplocal Don’t remove input trace files.
-p, --progress Show progress.
-v, --verbose Increase output verbosity.(can be used more than once)
55
B.2 Local Trace Unifier (vtunify)
-q, --quiet Enable quiet mode.(only emergency output)
--stats Unify only summarized information (*.stats), no events
--nocompress Don’t compress output trace files.
--nomsgmatch Don’t match messages.
--droprecvs Drop message receive events, if msg. matchingis enabled.
56
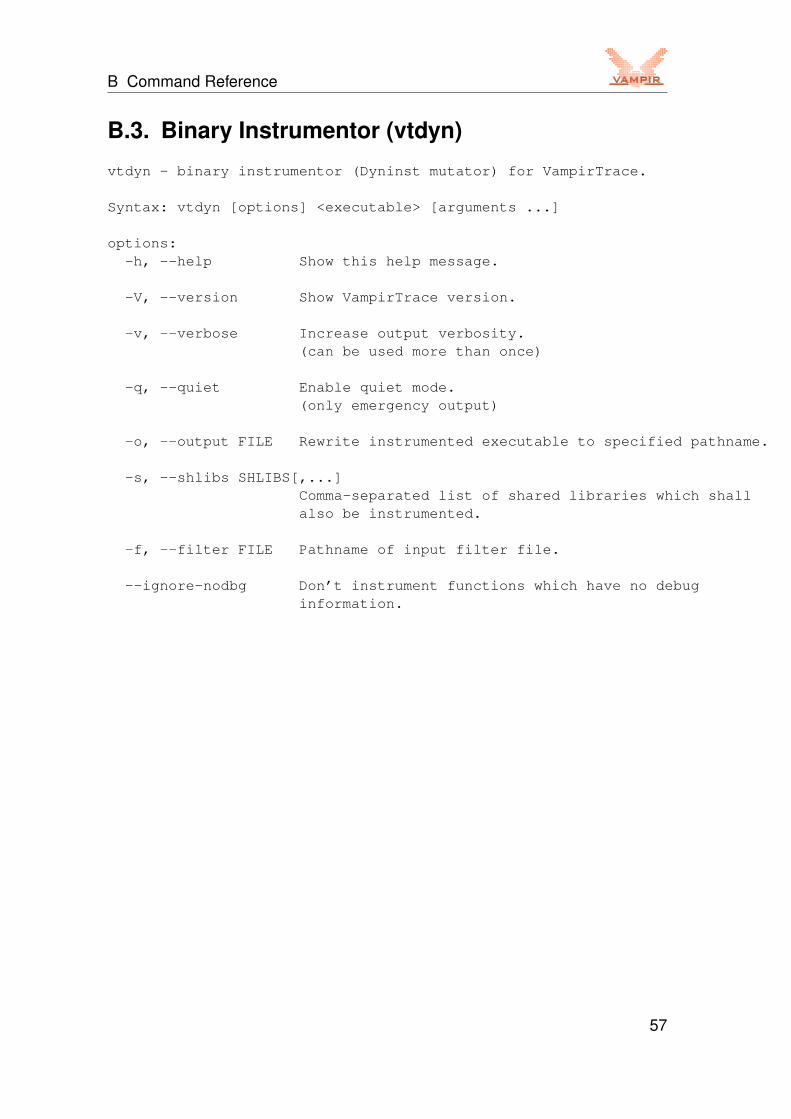
B Command Reference
B.3. Binary Instrumentor (vtdyn)
vtdyn - binary instrumentor (Dyninst mutator) for VampirTrace.
Syntax: vtdyn [options] <executable> [arguments ...]
options:-h, --help Show this help message.
-V, --version Show VampirTrace version.
-v, --verbose Increase output verbosity.(can be used more than once)
-q, --quiet Enable quiet mode.(only emergency output)
-o, --output FILE Rewrite instrumented executable to specified pathname.
-s, --shlibs SHLIBS[,...]Comma-separated list of shared libraries which shallalso be instrumented.
-f, --filter FILE Pathname of input filter file.
--ignore-nodbg Don’t instrument functions which have no debuginformation.
57

B.4 Trace Filter Tool (vtfilter)
B.4. Trace Filter Tool (vtfilter)
vtfilter[-mpi] - filter tool for VampirTrace.
Syntax:Generate a filter file:
vtfilter[-mpi] --gen [gen-options] <input trace file>
Filter a trace using an already existing filter file:vtfilter[-mpi] [--filt] [filt-options]
--filter=<input filter file> <input trace file>
options:--gen Generate a filter file.
See ’gen-options’ below for valid options.
--filt Filter a trace using an already existingfilter file. (default)See ’filt-options’ below for valid options.
-h, --help Show this help message.
-V, --version Show VampirTrace version.
-p, --progress Show progress.
-v, --verbose Increase output verbosity.(can be used more than once)
gen-options:-o, --output=FILE Pathname of output filter file.
-r, --reduce=N Reduce the trace size to N percent of theoriginal size. The program relies on thefact that the major part of the trace arefunction calls. The approximation of sizewill get worse with a rising percentage ofcommunication and other non functioncalling or performance counter records.
-l, --limit=N Limit the number of calls for filteredfunction to N.(default: 0)
-s, --stats Prints out the desired and the expectedpercentage of file size.
58

B Command Reference
-e, --exclude=FUNC[;FUNC;...]Exclude certain functions from filtering.A function name may contain wildcards.
--exclude-file=FILE Pathname of file containing a list offunctions to be excluded from filtering.
-i, --include=FUNC[;FUNC;...]Force to include certain functions intothe filter. A function name may containwildcards.
--include-file=FILE Pathname of file containing a list offunctions to be included into the filter.
--include-callees Automatically include callees of includedfunctions as well into the filter.
filt-options:-o, --output=FILE Pathname of output trace file.
-f, --filter=FILE Pathname of input filter file.
-s, --max-streams=N Maximum number of output streams.(default: 0)
vtfilter: Set this to 0 to get the same number ofoutput streams as input streams.
vtfilter-mpi: Set this to 0 to get the same number ofoutput streams as MPI processes used, butat least the number of input streams.
--max-file-handles=NMaximum number of files that are allowedto be open simultaneously.(default: 256)
--nocompress Don’t compress output trace files.
59
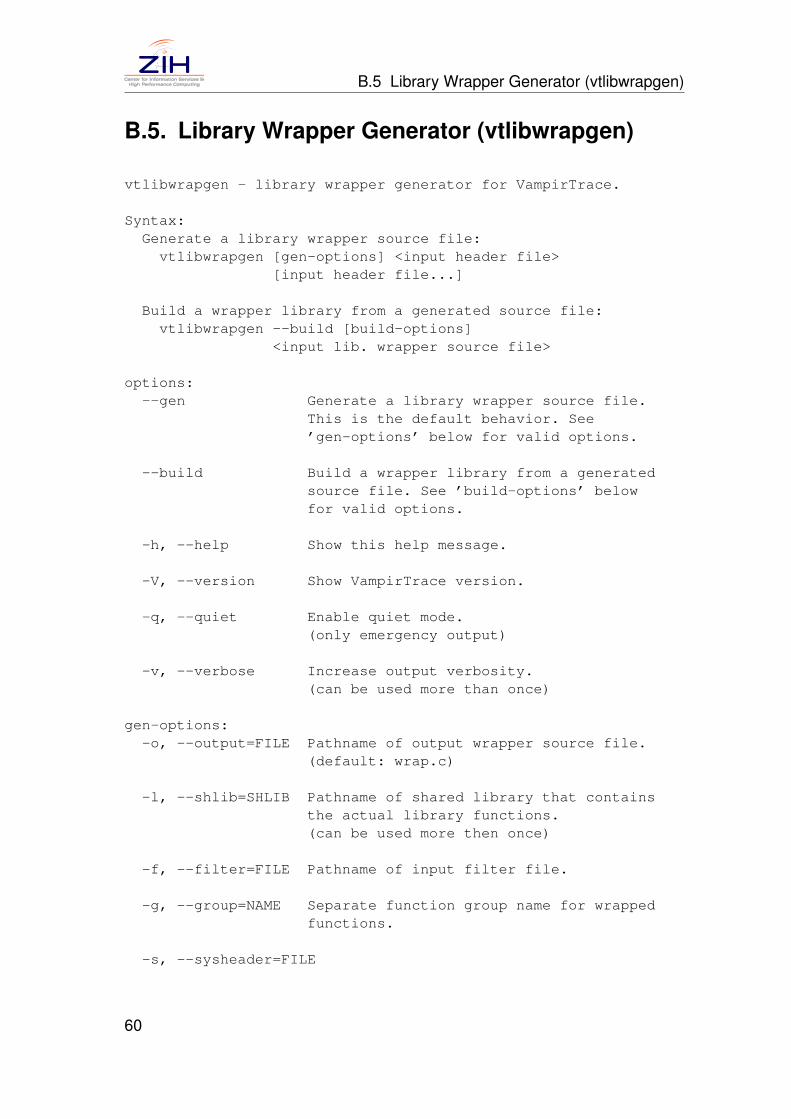
B.5 Library Wrapper Generator (vtlibwrapgen)
B.5. Library Wrapper Generator (vtlibwrapgen)
vtlibwrapgen - library wrapper generator for VampirTrace.
Syntax:Generate a library wrapper source file:
vtlibwrapgen [gen-options] <input header file>[input header file...]
Build a wrapper library from a generated source file:vtlibwrapgen --build [build-options]
<input lib. wrapper source file>
options:--gen Generate a library wrapper source file.
This is the default behavior. See’gen-options’ below for valid options.
--build Build a wrapper library from a generatedsource file. See ’build-options’ belowfor valid options.
-h, --help Show this help message.
-V, --version Show VampirTrace version.
-q, --quiet Enable quiet mode.(only emergency output)
-v, --verbose Increase output verbosity.(can be used more than once)
gen-options:-o, --output=FILE Pathname of output wrapper source file.
(default: wrap.c)
-l, --shlib=SHLIB Pathname of shared library that containsthe actual library functions.(can be used more then once)
-f, --filter=FILE Pathname of input filter file.
-g, --group=NAME Separate function group name for wrappedfunctions.
-s, --sysheader=FILE
60
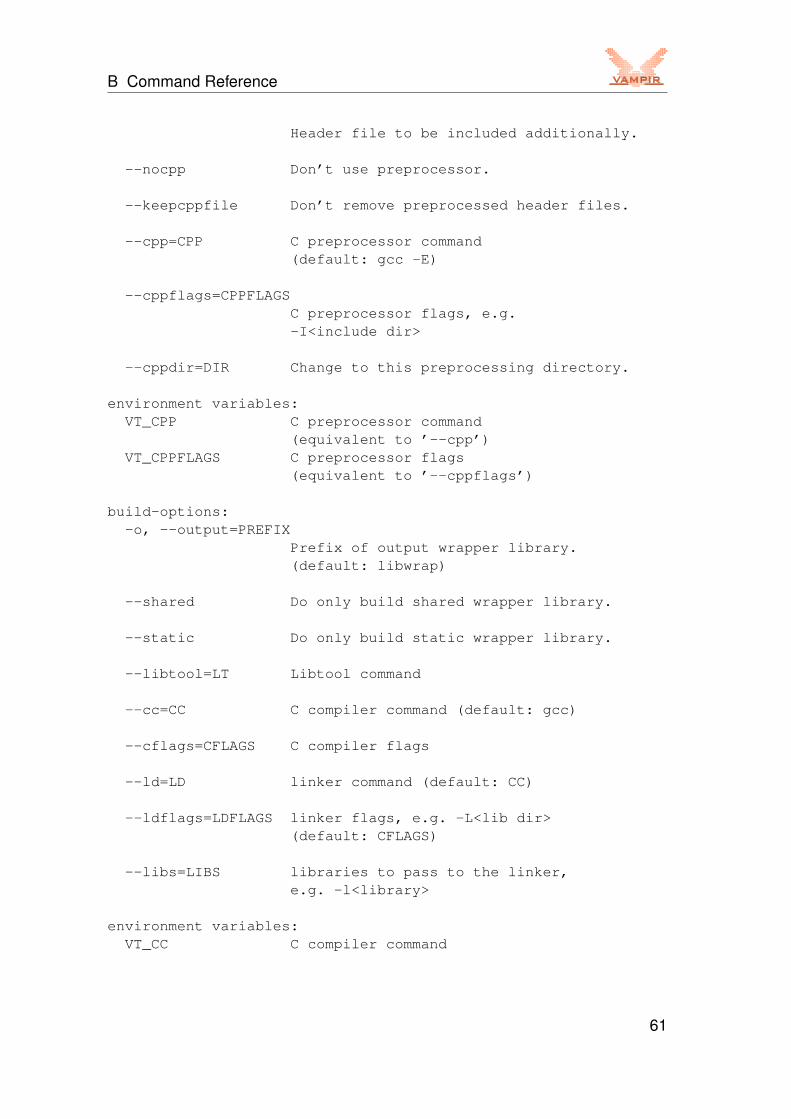
B Command Reference
Header file to be included additionally.
--nocpp Don’t use preprocessor.
--keepcppfile Don’t remove preprocessed header files.
--cpp=CPP C preprocessor command(default: gcc -E)
--cppflags=CPPFLAGSC preprocessor flags, e.g.-I<include dir>
--cppdir=DIR Change to this preprocessing directory.
environment variables:VT_CPP C preprocessor command
(equivalent to ’--cpp’)VT_CPPFLAGS C preprocessor flags
(equivalent to ’--cppflags’)
build-options:-o, --output=PREFIX
Prefix of output wrapper library.(default: libwrap)
--shared Do only build shared wrapper library.
--static Do only build static wrapper library.
--libtool=LT Libtool command
--cc=CC C compiler command (default: gcc)
--cflags=CFLAGS C compiler flags
--ld=LD linker command (default: CC)
--ldflags=LDFLAGS linker flags, e.g. -L<lib dir>(default: CFLAGS)
--libs=LIBS libraries to pass to the linker,e.g. -l<library>
environment variables:VT_CC C compiler command
61

B.6 Application Execution Wrapper (vtrun)
(equivalent to ’--cc’)VT_CFLAGS C compiler flags
(equivalent to ’--cflags’)VT_LD linker command
(equivalent to ’--ld’)VT_LDFLAGS linker flags
(equivalent to ’--ldflags’)VT_LIBS libraries to pass to the linker
(equivalent to ’--libs’)
examples:Generating wrapper library ’libm_wrap’ for the Math library’libm.so’:
vtlibwrapgen -l libm.so -g MATH -o mwrap.c \/usr/include/math.hvtlibwrapgen --build -o libm_wrap mwrap.cexport LD_PRELOAD=$PWD/libm_wrap.so:libvt.so
B.6. Application Execution Wrapper (vtrun)
vtrun - application execution wrapper for VampirTrace.
Syntax: vtrun [options] <executable> [arguments]
options:-h, --help Show this help message.
-V, --version Show VampirTrace version.
-v, --verbose Increase output verbosity.(can be used more than once)
-q, --quiet Enable quiet mode.(only emergency output)
-<seq|mpi|mt|hyb> Set application’s parallelization type.It’s only necessary if it could notbe determined automatically.seq = sequentialmpi = parallel (uses MPI)mt = parallel (uses OpenMP/POSIX threads)hyb = hybrid parallel (MPI + Threads)(default: automatically)
62
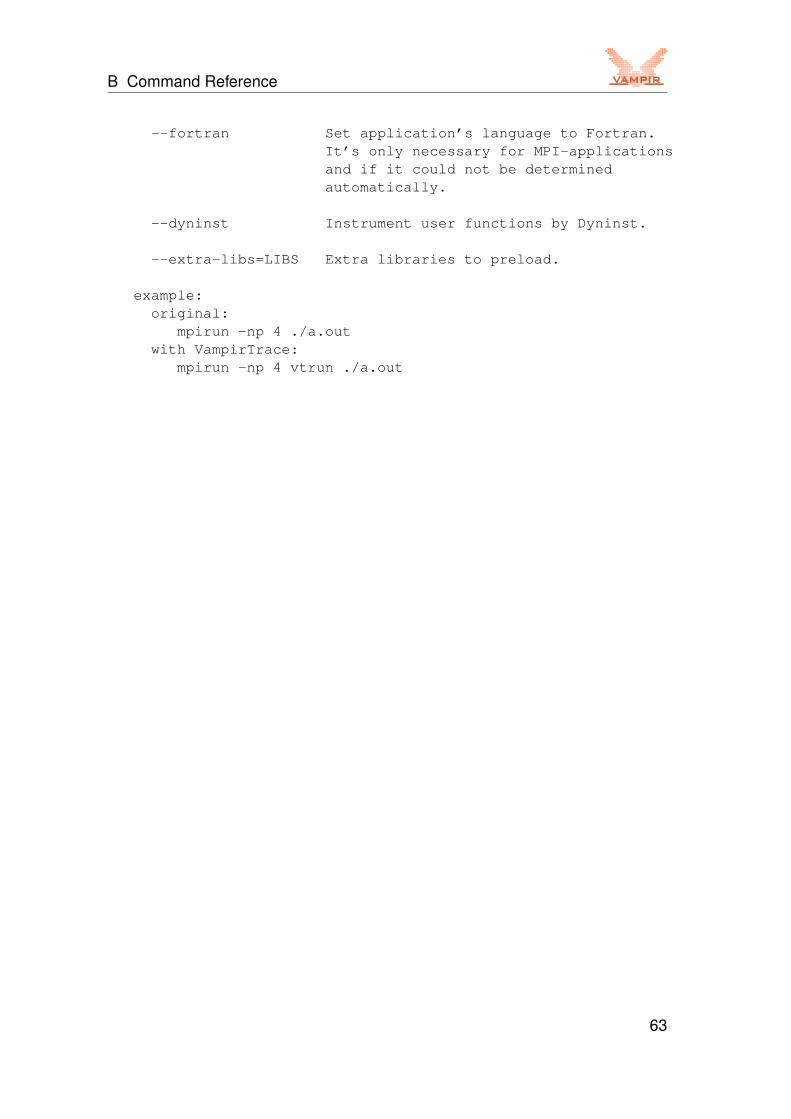
B Command Reference
--fortran Set application’s language to Fortran.It’s only necessary for MPI-applicationsand if it could not be determinedautomatically.
--dyninst Instrument user functions by Dyninst.
--extra-libs=LIBS Extra libraries to preload.
example:original:
mpirun -np 4 ./a.outwith VampirTrace:
mpirun -np 4 vtrun ./a.out
63


C Counter Specifications
C. Counter Specifications
C.1. PAPI
Available counter names can be queried with the PAPI commands papi availand papi native avail. Depending on the hardware there are limitationsin the combination of different counters. To check whether your choice worksproperly, use the command papi event chooser.
PAPI_L[1|2|3]_[D|I|T]C[M|H|A|R|W]Level 1/2/3 data/instruction/total cachemisses/hits/accesses/reads/writes
PAPI_L[1|2|3]_[LD|ST]MLevel 1/2/3 load/store misses
PAPI_CA_SNP Requests for a snoopPAPI_CA_SHR Requests for exclusive access to shared cache linePAPI_CA_CLN Requests for exclusive access to clean cache linePAPI_CA_INV Requests for cache line invalidationPAPI_CA_ITV Requests for cache line intervention
PAPI_BRU_IDL Cycles branch units are idlePAPI_FXU_IDL Cycles integer units are idlePAPI_FPU_IDL Cycles floating point units are idlePAPI_LSU_IDL Cycles load/store units are idle
PAPI_TLB_DM Data translation lookaside buffer missesPAPI_TLB_IM Instruction translation lookaside buffer missesPAPI_TLB_TL Total translation lookaside buffer misses
PAPI_BTAC_M Branch target address cache missesPAPI_PRF_DM Data prefetch cache missesPAPI_TLB_SD Translation lookaside buffer shootdowns
PAPI_CSR_FAL Failed store conditional instructionsPAPI_CSR_SUC Successful store conditional instructionsPAPI_CSR_TOT Total store conditional instructions
PAPI_MEM_SCY Cycles Stalled Waiting for memory accesses
65
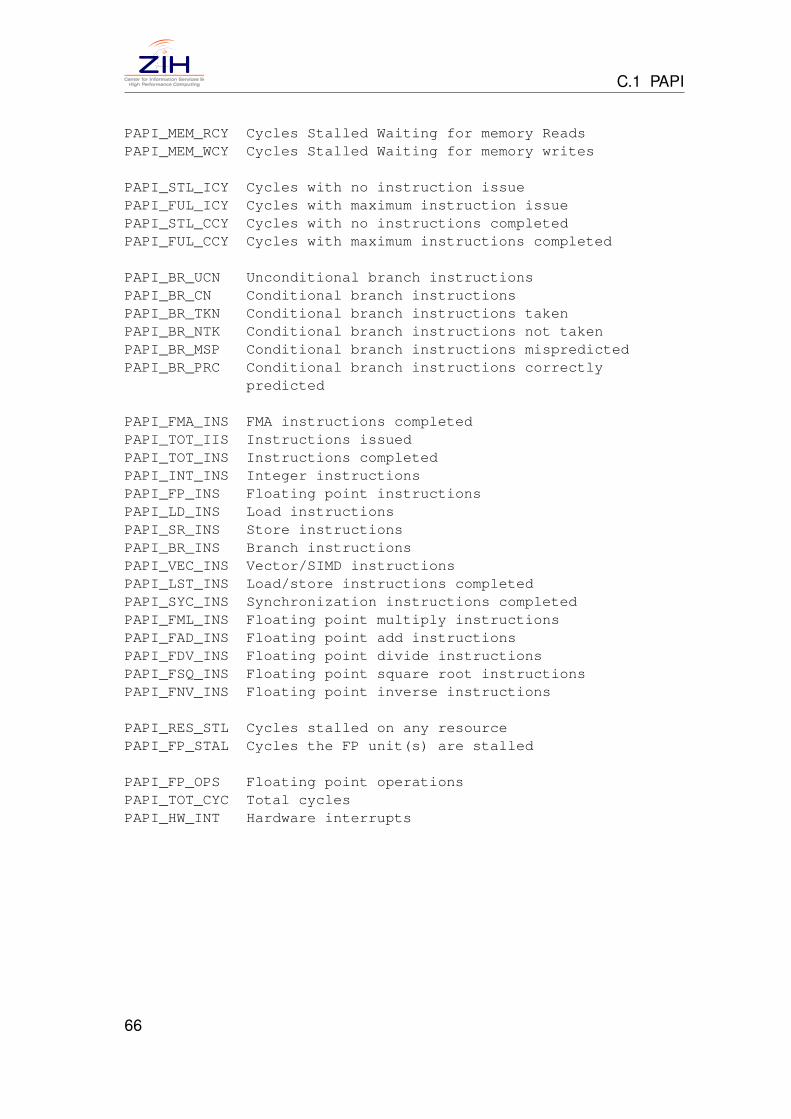
C.1 PAPI
PAPI_MEM_RCY Cycles Stalled Waiting for memory ReadsPAPI_MEM_WCY Cycles Stalled Waiting for memory writes
PAPI_STL_ICY Cycles with no instruction issuePAPI_FUL_ICY Cycles with maximum instruction issuePAPI_STL_CCY Cycles with no instructions completedPAPI_FUL_CCY Cycles with maximum instructions completed
PAPI_BR_UCN Unconditional branch instructionsPAPI_BR_CN Conditional branch instructionsPAPI_BR_TKN Conditional branch instructions takenPAPI_BR_NTK Conditional branch instructions not takenPAPI_BR_MSP Conditional branch instructions mispredictedPAPI_BR_PRC Conditional branch instructions correctly
predicted
PAPI_FMA_INS FMA instructions completedPAPI_TOT_IIS Instructions issuedPAPI_TOT_INS Instructions completedPAPI_INT_INS Integer instructionsPAPI_FP_INS Floating point instructionsPAPI_LD_INS Load instructionsPAPI_SR_INS Store instructionsPAPI_BR_INS Branch instructionsPAPI_VEC_INS Vector/SIMD instructionsPAPI_LST_INS Load/store instructions completedPAPI_SYC_INS Synchronization instructions completedPAPI_FML_INS Floating point multiply instructionsPAPI_FAD_INS Floating point add instructionsPAPI_FDV_INS Floating point divide instructionsPAPI_FSQ_INS Floating point square root instructionsPAPI_FNV_INS Floating point inverse instructions
PAPI_RES_STL Cycles stalled on any resourcePAPI_FP_STAL Cycles the FP unit(s) are stalled
PAPI_FP_OPS Floating point operationsPAPI_TOT_CYC Total cyclesPAPI_HW_INT Hardware interrupts
66
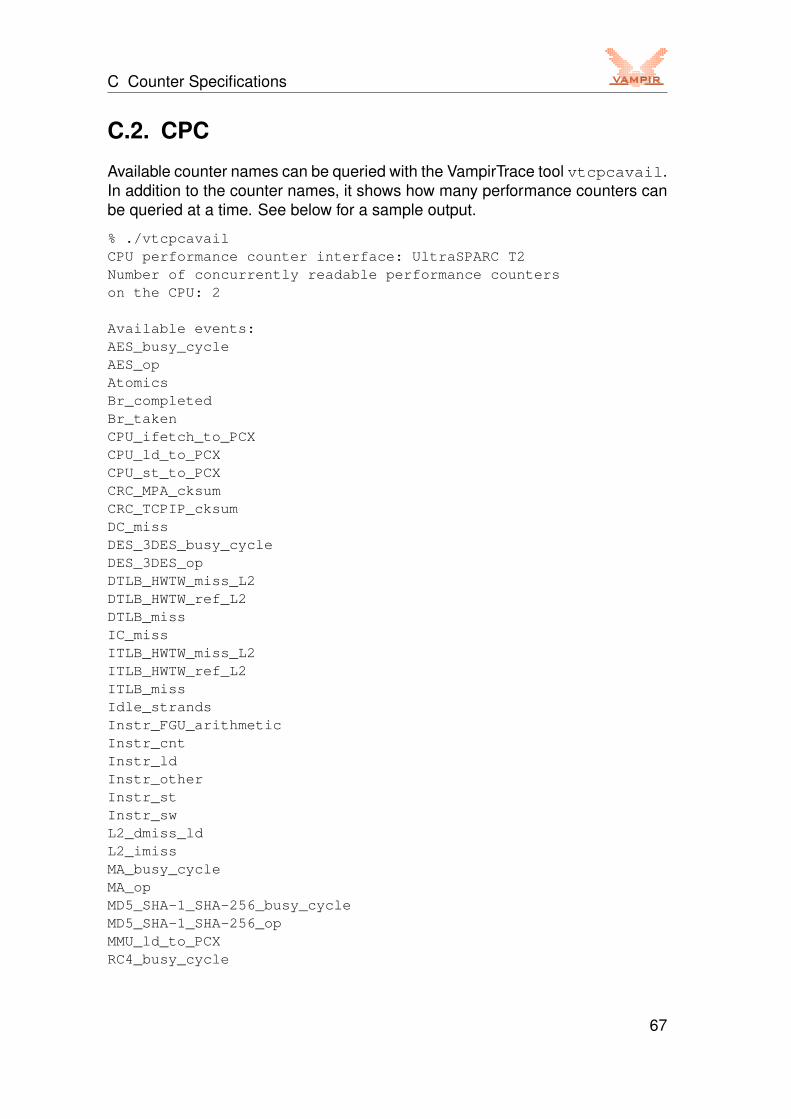
C Counter Specifications
C.2. CPC
Available counter names can be queried with the VampirTrace tool vtcpcavail.In addition to the counter names, it shows how many performance counters canbe queried at a time. See below for a sample output.
% ./vtcpcavailCPU performance counter interface: UltraSPARC T2Number of concurrently readable performance counterson the CPU: 2
Available events:AES_busy_cycleAES_opAtomicsBr_completedBr_takenCPU_ifetch_to_PCXCPU_ld_to_PCXCPU_st_to_PCXCRC_MPA_cksumCRC_TCPIP_cksumDC_missDES_3DES_busy_cycleDES_3DES_opDTLB_HWTW_miss_L2DTLB_HWTW_ref_L2DTLB_missIC_missITLB_HWTW_miss_L2ITLB_HWTW_ref_L2ITLB_missIdle_strandsInstr_FGU_arithmeticInstr_cntInstr_ldInstr_otherInstr_stInstr_swL2_dmiss_ldL2_imissMA_busy_cycleMA_opMD5_SHA-1_SHA-256_busy_cycleMD5_SHA-1_SHA-256_opMMU_ld_to_PCXRC4_busy_cycle
67
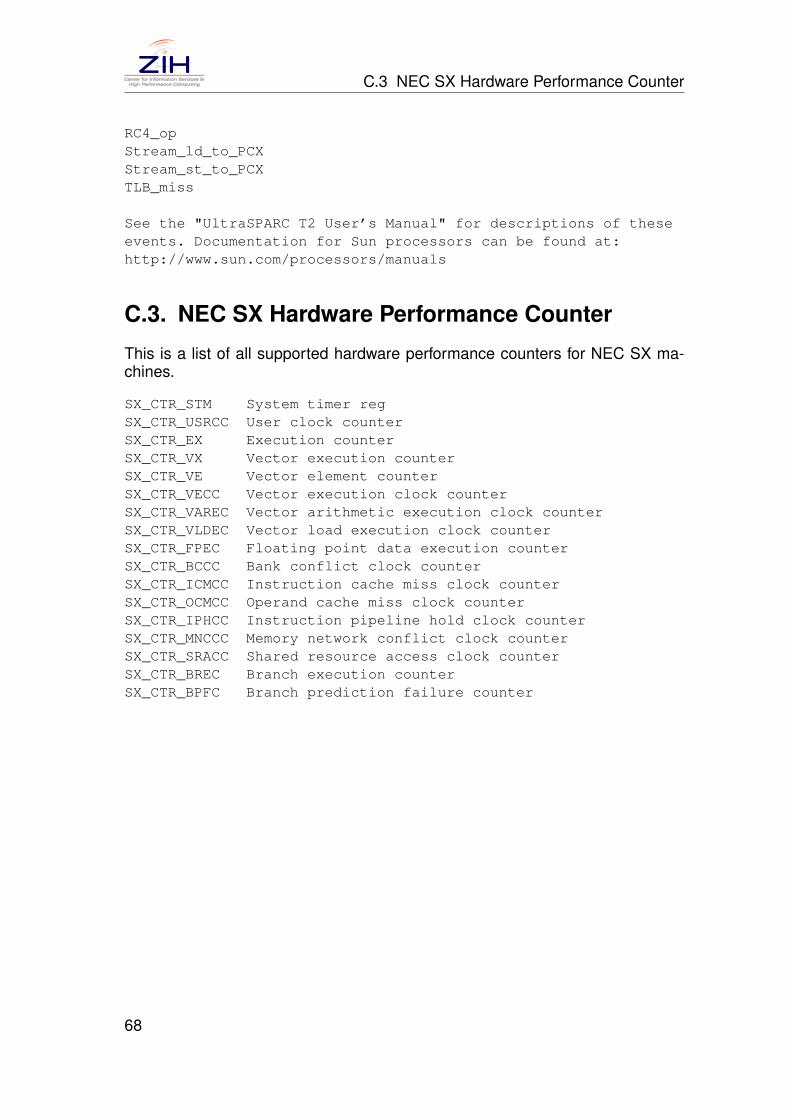
C.3 NEC SX Hardware Performance Counter
RC4_opStream_ld_to_PCXStream_st_to_PCXTLB_miss
See the "UltraSPARC T2 User’s Manual" for descriptions of theseevents. Documentation for Sun processors can be found at:http://www.sun.com/processors/manuals
C.3. NEC SX Hardware Performance Counter
This is a list of all supported hardware performance counters for NEC SX ma-chines.
SX_CTR_STM System timer regSX_CTR_USRCC User clock counterSX_CTR_EX Execution counterSX_CTR_VX Vector execution counterSX_CTR_VE Vector element counterSX_CTR_VECC Vector execution clock counterSX_CTR_VAREC Vector arithmetic execution clock counterSX_CTR_VLDEC Vector load execution clock counterSX_CTR_FPEC Floating point data execution counterSX_CTR_BCCC Bank conflict clock counterSX_CTR_ICMCC Instruction cache miss clock counterSX_CTR_OCMCC Operand cache miss clock counterSX_CTR_IPHCC Instruction pipeline hold clock counterSX_CTR_MNCCC Memory network conflict clock counterSX_CTR_SRACC Shared resource access clock counterSX_CTR_BREC Branch execution counterSX_CTR_BPFC Branch prediction failure counter
68
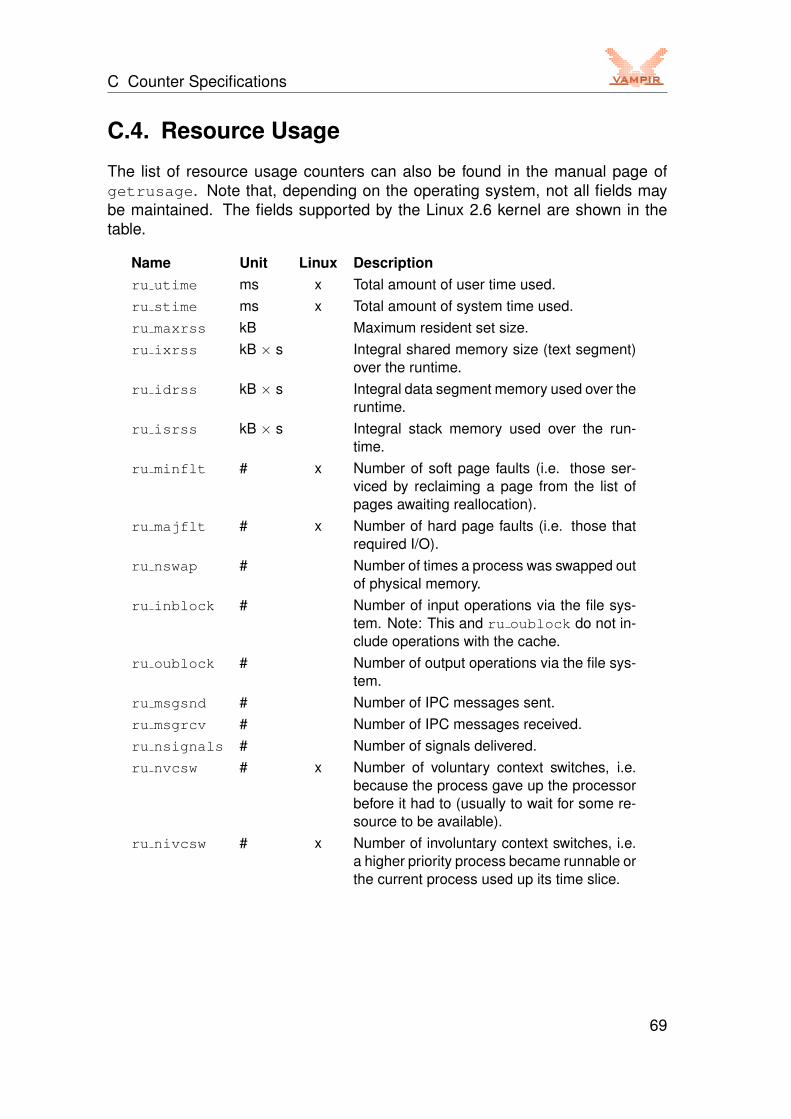
C Counter Specifications
C.4. Resource Usage
The list of resource usage counters can also be found in the manual page ofgetrusage. Note that, depending on the operating system, not all fields maybe maintained. The fields supported by the Linux 2.6 kernel are shown in thetable.
Name Unit Linux Descriptionru utime ms x Total amount of user time used.ru stime ms x Total amount of system time used.ru maxrss kB Maximum resident set size.ru ixrss kB × s Integral shared memory size (text segment)
over the runtime.ru idrss kB × s Integral data segment memory used over the
runtime.ru isrss kB × s Integral stack memory used over the run-
time.ru minflt # x Number of soft page faults (i.e. those ser-
viced by reclaiming a page from the list ofpages awaiting reallocation).
ru majflt # x Number of hard page faults (i.e. those thatrequired I/O).
ru nswap # Number of times a process was swapped outof physical memory.
ru inblock # Number of input operations via the file sys-tem. Note: This and ru oublock do not in-clude operations with the cache.
ru oublock # Number of output operations via the file sys-tem.
ru msgsnd # Number of IPC messages sent.ru msgrcv # Number of IPC messages received.ru nsignals # Number of signals delivered.ru nvcsw # x Number of voluntary context switches, i.e.
because the process gave up the processorbefore it had to (usually to wait for some re-source to be available).
ru nivcsw # x Number of involuntary context switches, i.e.a higher priority process became runnable orthe current process used up its time slice.
69

D FAQ
D. FAQ
D.1. Can I use different compilers for VampirTraceand my application?
There are several limitations which make this generally a bad idea:
• Using different compilers when tracing OpenMP applications does not work.
• Both compilers should have the same naming style for Fortran symbols(i.e. uppercase/lowercase, appending underscores) when tracing FortranMPI applications.
• VampirTrace must be built to support the instrumentation type of the com-piler you use for the application.
For example, the combination of a GCC compiled VampirTrace with an Intel com-piled application will work except for OpenMP. But to avoid any trouble it is ad-visable to compile both VampirTrace and the application with the same compiler.
D.2. Why does my application need such a longtime for starting?
If subroutines have been instrumented with automatic instrumentation by GNU,Intel, or PathScale compilers, VampirTrace needs to look-up the function namesand their source code line before program start. In certain cases, this may takevery long. To accelerate this process prepare a file with symbol informationusing the command nm as explained in Section 2.3 and set VT GNU NMFILE tothe pathname of this file. This method prevents VampirTrace from getting thefunction names from the binary.
71
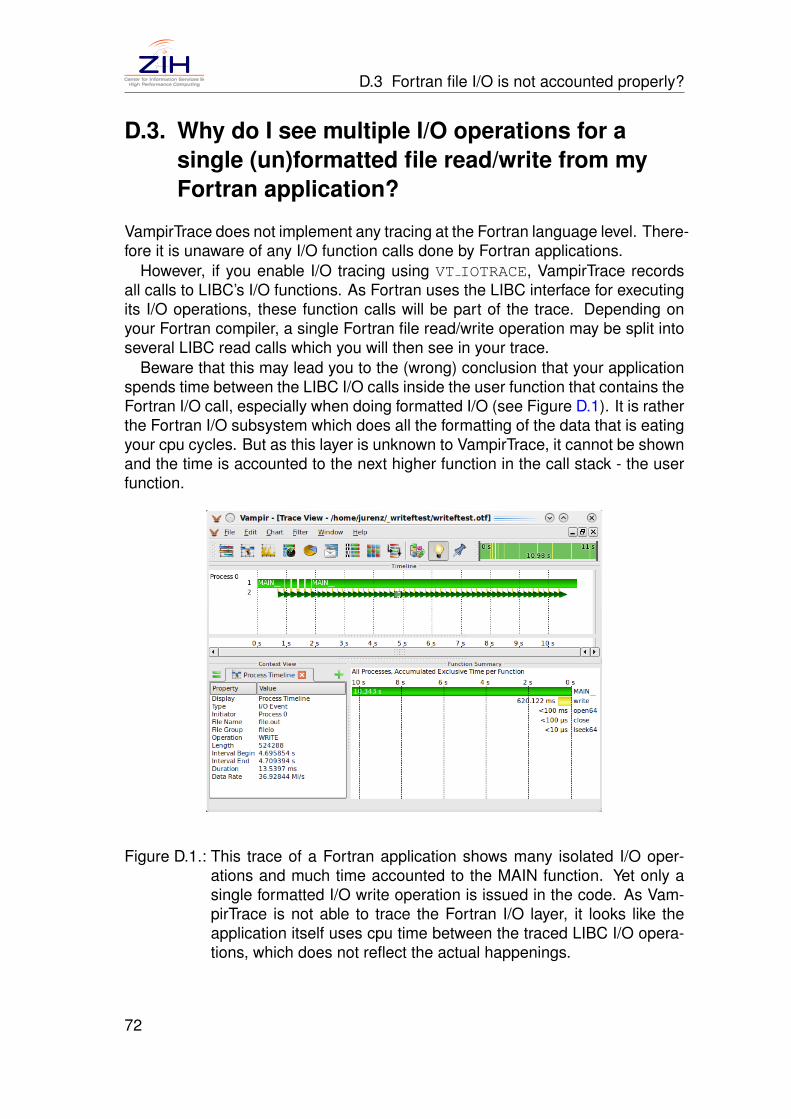
D.3 Fortran file I/O is not accounted properly?
D.3. Why do I see multiple I/O operations for asingle (un)formatted file read/write from myFortran application?
VampirTrace does not implement any tracing at the Fortran language level. There-fore it is unaware of any I/O function calls done by Fortran applications.
However, if you enable I/O tracing using VT IOTRACE, VampirTrace recordsall calls to LIBC’s I/O functions. As Fortran uses the LIBC interface for executingits I/O operations, these function calls will be part of the trace. Depending onyour Fortran compiler, a single Fortran file read/write operation may be split intoseveral LIBC read calls which you will then see in your trace.
Beware that this may lead you to the (wrong) conclusion that your applicationspends time between the LIBC I/O calls inside the user function that contains theFortran I/O call, especially when doing formatted I/O (see Figure D.1). It is ratherthe Fortran I/O subsystem which does all the formatting of the data that is eatingyour cpu cycles. But as this layer is unknown to VampirTrace, it cannot be shownand the time is accounted to the next higher function in the call stack - the userfunction.
Figure D.1.: This trace of a Fortran application shows many isolated I/O oper-ations and much time accounted to the MAIN function. Yet only asingle formatted I/O write operation is issued in the code. As Vam-pirTrace is not able to trace the Fortran I/O layer, it looks like theapplication itself uses cpu time between the traced LIBC I/O opera-tions, which does not reflect the actual happenings.
72
D FAQ
D.4. The application has run to completion, butthere is no *.otf file. What can I do?
The absence of an *.otf file usually means that the trace was not unified. Thisis the case on certain platforms, e.g. when using DYNINST or when the localtraces are not available when the application ends and VampirTrace performstrace unification.
In those cases, a *.uctl file can be found in the directory of the trace file andthe user needs to perform trace unification manually. See Sections 3.5 and B.2to learn more about using vtunify.
D.5. What limitations are associated with ”on/off”and buffer rewind?
Starting and stopping tracing by using the VT ON/VT OFF calls as well as thebuffer rewind method are considered advanced usage of VampirTrace and shouldbe performed with care. When restarting the recording of events, the call stack ofthe application has to have the same depth as when the recording was stopped.The same applies for the rewind call, which has to be at the same stack level asthe rewind mark. If this is not the case, an error message will be printed duringruntime and VampirTrace will abort execution. A safe method is to call VT OFFand VT ON in the same function.
It is allowed to use ”on/off” in a section between a rewind mark and a bufferrewind call. But it is not allowed to call VT SET REWIND MARK or VT REWINDduring a section deactivated by the ”on/off” functionality.
Buffer flushes interfere with the rewind method: If the trace buffer is flushedafter the call to VT SET REWIND MARK, the mark is removed and a subsequentcall to VT REWIND will not work and issue a warning message.
In addition, stopping or rewinding tracing while waiting for MPI messages cancause those MPI messages not to be recorded in the trace. This can causeproblems when analyzing the OTF trace afterwards, e.g., with Vampir.
D.6. VampirTrace warns that it “cannot lock filea.lock”, what’s wrong?
For unique naming of multiple trace files in the same directory, a file *.lockis created and locked for exclusive access if VT FILE UNIQUE is set to yes(⇒ Section 3.1). Some file systems do not implement file locking. In this case,VampirTrace still tries to name the trace files uniquely, but this may fail in certain
73
D.7 Can I relocate my VampirTrace installation?
cases. Alternatively, you can manually control the unique file naming by settingVT FILE UNIQUE to a different numerical ID for each program run.
D.7. Can I relocate my VampirTrace installationwithout rebuilding from source?
VampirTrace hard-codes some directory paths in its executables and librariesbased on installation paths specified by the configure script. However, it’spossible to move an existing VampirTrace installation to another location and useit without rebuild from source. Therefore it’s necessary to set the environmentvariable VT PREFIX to the new installation prefix before using VampirTrace’sCompiler Wrappers (⇒ Section 2.1) or launching an instrumented application.For example:
./configure --prefix=/opt/vampirtracemake installmv /opt/vampirtrace $HOME/vampirtraceexport VT_PREFIX=$HOME/vampirtrace
D.8. What are the byte counts in collectivecommunication records?
The byte counts in collective communication records changed with version 5.10.From 5.10 on, the byte counts of collective communication records show the
bytes per rank given to the MPI call or returned by the MPI call. This is the MPIAPI perspective. It is next to impossible to find out how many bytes are actuallysent or received during a collective operation by any other MPI implementation.
In the past (until VampirTrace version 5.9), the byte count in collective oper-ation records was defined differently. It used a simple and naive hypotheticalimplementation of collectives based on point-to-point messages and derived thebyte counts from that. This might have been more confusing than helpful andwas therefore changed.
Thanks to Eugene Loh for pointing this out!
D.9. I get “error: unknown asm constraint letter”
It is a known issue with the tau instrumentor that it doesn’t support inline assem-bler code. At the moment there is no other solution than using another kind ofinstrumentation like compiler instrumenation (⇒ Section 2.3) or manual instru-menation (⇒ Section 2.4).
74
D FAQ
D.10. I have a question that is not answered in thisdocument!
You may contact us at [email protected] for support on installingand using VampirTrace.
D.11. I need support for additional features so I cantrace application xyz.
Suggestions are always welcome (contact: [email protected])but there is a chance that we can not implement all your wishes as our resourcesare limited.
Anyways, the source code of VampirTrace is open to everybody so you mayimplement support for new stuff yourself. If you provide us with your additionsafterwards we will consider merging them into the official VampirTrace package.
75