Embed Size (px)
Citation preview

VanEck ViewPoint TM
Be on guard
October 2021

VanEck ViewPoint™ Be on guard 1
COVID returned with a vengeance during the quarter as authorities struggled to contain the delta strain. Governments are promoting that the path out of lockdowns is vaccines, but pace and acceptance varies. This is the theme of economic growth now – everything varies – within nations, and around the world. The pace of economic growth is diverging. Some emerging markets are tightening, Europe and the US are heading toward tapering, growth in Australia has all but faltered and China has its own set of problems.
It was just four short years ago, we wrote about synchronised growth. “For the first time in the ten years since the crisis (the GFC) began, all 45 countries tracked by the Organisation for Economic Co-Operation and Development (OECD) experienced GDP growth at the same time. This had a number of knock-on impacts, most notably the announcement by the US Federal Reserve (the Fed) that it would begin to reduce the size of its balance sheet.”
Four years on and it looks like we are as far from synchronised as possible, and the way the Fed Chairman speaks, it could be another decade before the Fed starts to reduce the size of its balance sheet. It will not be that long this time, possibly as soon as next year. For a start, inflation was non-existent despite the flood of liquidity after the GFC. This time it has been a feature.
Because of the Fed’s dovishness, growth has continued its dominance over value. Sectors such as technology continue to outpace cyclical, value sectors such as utilities. Valuations continue to hit new highs and during the quarter the ASX hit all-time highs. We do note divergence between the months of the quarter. In July and August, quality companies thrived. In September, there has been a notable rotation to value.
Japan powered ahead during the September rotation to value, up 7% so far. Elsewhere, the US has had a strong quarter, though there has been a pullback in September.
Some economies are following the textbook recovery from a deflationary shock and subsequent accumulation of debt, which is low growth. Others have falling growth, while others power ahead. Within sectors, demand is outweighing supply, especially in industries that have experienced supply disruption. Up until August’s non-farm payrolls, employment numbers were ‘strong’. There is divergence in employment: employers continue to have trouble filling jobs, but those looking for work cannot find roles.
The Evergrande saga has put markets on their toes, concerned that the global growth engine of the past twenty years, China, may contract. Real estate is a significant contributor to China GDP. The Fed officials have kept rates unchanged but indicated rate hikes could be coming sooner than expected in 2022. The Fed also announced that as economic progress continues, it could start to taper its monthly US$120 billion asset purchases as early as November. This quarter we warn, don’t fight the Fed, which is not changing course yet, but be on guard. Stay true to long-term investing principles.
Chart 1: Mainstream asset class returns for the quarter
-4.17%-2.25%
-0.07%0.01%0.05%
0.25%0.37%
0.92%1.49%
2.18%2.69%
3.35%4.68%
5.34%8.42%
-6% -4% -2% 0% 2% 4% 6% 8% 10%
EM EquitiesChina EquitiesEM Fixed IncomeAustralian Bank BillsGlobal Fixed IncomeUSA Small CapsAustralian Fixed IncomeAustralian EquitiesGoldEuropean EquitiesUK EquitiesAustralian Small CapsGlobal EquitiesUS EquitiesJapanese Equities
Source: Bloomberg, 1 July 2021 to 28 September 2021, returns in Australian dollars. European Equities is MSCI Europe Index, US Equities is S&P 500 Index, International Equities is MSCI World ex Australia Index, Australian Equities is S&P/ASX 200 Accumulation Index, Australian Small Caps is S&P/ASX Small Ordinaries Index, UK Equities is FTSE 100 Index, China equities is CSI 300 Index, USA Small Caps is Russell 2000 Index, Gold is Gold Spot US$/oz, EM Equities is MSCI Emerging Markets Index, EM Fixed Income is 50% J.P. Morgan Emerging Market Bond Index Global Diversified Hedged AUD and 50% J.P. Morgan Government Bond-Emerging Market Index Global Diversified, Australian Fixed Income is Bloomberg AusBond Composite 0+ yrs Index, Global Fixed Income is Bloomberg Global Aggregate Bond Hedged AUD Index, Japanese Equities is Nikkei 225 Index, Australian Bank Bills is Bloomberg AusBond Bank Bill Index.
Chart 2: Global and Australian equity sectors quarterly performance
-11.09%
1.72%
4.62%5.47%
1.63%
3.87%5.38%
2.47%
9.07%
6.58%
3.97%
-0.73%
2.20%3.07% 3.28% 3.60% 3.99% 4.06%
4.81%5.73% 6.10% 6.59%
EnergyMaterials ConsumerDiscretionary
FinancialsConsumerStaples
Industrials Telecomm-unications
Utilities RealEstate
HealthCare
InformationTechnology
-15%
-10%
-5%
0%
5%
10%
Source: Bloomberg, 1 July 2021 to 28 September 2021, returns in Australian dollars. Utilities is MSCI World Utilities Index / S&P/ASX 200 Utilities Index, Industrials is MSCI World Industrials Index / S&P/ASX 200 Industrials Index, Materials is MSCI World Materials Index / S&P/ASX 200 Materials Index, Consumer Staples is MSCI World Consumer Staples Index / S&P/ASX 200 Consumer Staples Index, Consumer Discretionary is MSCI World Consumer Discretionary Index / S&P/ASX 200 Consumer Discretionary Index, Financials is MSCI World Financials Index / S&P/ASX 200 Financials Index, Energy is MSCI World Energy Index / S&P/ASX 200 Energy Index, Healthcare is MSCI World Heath care Index / S&P/ASX200 Heath care Index, Telecommunications is MSCI World Telecommunications Index / S&P/ASX 200 Telecommunications Index, Information Technology is MSCI World Information Technology Index / S&P/ASX 200 Information Technology Index, Real Estate is MSCI World REIT Index / S&P/ASX 200 AREIT Index.
“Investing isn’t about beating others at their game. It’s about controlling yourself at your own game.”Benjamin Graham

VanEck ViewPoint™ Be on guard 2
Be on guardA quarter ago, we warned against ‘inflacency’, a new economic scourge. Inflacency is inflation complacency, built on a belief that this year’s surge in global inflation was a short-term phenomenon caused by post-COVID reopening.
Inflacency remains rampant despite most measures of inflation pressure continuing to disappoint the doves that seem intent on avoiding aggressive tightening actions. To be fair, central bankers everywhere have continued cheering the belief that inflation is short-term as the Delta variant (perhaps, temporarily) hampers growth.
Consequently, over the first two months of the quarter, growth stocks have continued to outperform value, as bond yields remain startlingly low. Indeed, to a significant degree, US growth stocks have become bond proxies, with a duration exceeding even a 30-year Treasury bond.
It is sage advice to not fight the Fed. At the same time don’t trust it either. So be on guard.
It will take a lot for the Fed to change its mind. However, over time expect a shift, for as long as the longer economic outcomes do not match their benign view, the more that view will come under pressure. Rather than abating, cost pressures continue to press higher and labour markets continue to appear tight.
The US dollar will also weigh on the Fed’s view. The US dollar has benefited from investment returns, not deficits, dominating currency flows in a convergent world over the past few years. But as the reopening, and reclosing, of economies around the world is showing us, growth rates are now diverging. European growth currently looks, at least as, robust as US growth, emerging markets are doing well as exports soar except for China which had downside surprises during the quarter. With a bit of room, it is possible the growth spigots will open again there. Growth in Australia lags the rest of the world.
Chart 3: Bonds lead the growth to value ratioRussell 2000 Value/Russell 2000 Growth (LHS) and US 10 Year Treasury Spread (RHS)
Source: VanEck, Bloomberg.
0
0.5
1.0
1.5
2.0
1.5
1.6
1.7
1.8
1.9
2.0
2.1
2.2
2.3
2.4
Sep
2019
Oct
201
9
Nov
201
9
Dec
201
9
Jan
2020
Feb
2020
Mar
202
0
Apr
202
0
May
202
0
Jun
2020
Jul 2
020
Aug
202
0
Sep
2020
Oct
202
0
Nov
202
0
Dec
202
0
Jan
2021
Feb
2021
Mar
202
1
Apr
202
1
May
202
1
Jun
2021
Jul 2
021
Aug
202
1
Sep
2021
Russell 2000 Growth:Value ratio US10 yield (inverted)
% %
Source: VanEck, Factset, S&P, Duration is similar to a Dividend Discount Model valuation: it measures the average time to receive dividends, weighted by present values. The longer the duration, the more sensitive price is to discount (interest) rate change.
Chart 4: US growth stocks are the new bond proxyDuration of S&P 500 is nearing tech bubble peak
0
5
10
15
20
25
30
35
40
45
50
Jan
1980
Jan
1981
Jan
1982
Jan
1983
Jan
1984
Jan
1985
Jan
1986
Jan
1987
Jan
1988
Jan
1989
Jan
1990
Jan
1991
Jan
1992
Jan
1993
Jan
1994
Jan
1995
Jan
1996
Jan
1997
Jan
1998
Jan
1999
Jan
2000
Jan
2001
Jan
2002
Jan
2003
Jan
2004
Jan
2005
Jan
2006
Jan
2007
Jan
2008
Jan
2009
Jan
2010
Jan
2011
Jan
2012
Jan
2013
Jan
2014
Jan
2015
Jan
2016
Jan
2017
Jan
2018
Jan
2019
Jan
2020
Jan
2021
Year
s

VanEck ViewPoint™ Be on guard 3
Chart 5: US bond yields are low on growth fears, not inflationUS 10 year treasuries real and nominal breakeven inflation
Divergence puts pressure on the US dollarSo what happens if the European Central Bank (ECB) decides to start hauling in the sails, while the Fed sails on? If investors believe the Fed is falling behind the game, we should see pressure on the US dollar.
The ECB has started pulling the spinnaker. While the market does currently expect that the ECB will be slower than the Fed to raise rates, it has already announced a de facto taper. In addition, internal ECB inflation forecasts are rising, albeit still to benign levels.
The US dollar appears to be moving into a phase of negative correlation to equities. This is driven by the Fed’s behaviour to inflation prints: soft growth data see bonds and equities rally and the US dollar fall, this implies the Fed is correctly staying lower for longer. The problem is if strong inflation data is ignored by bonds and equities, and the US dollars falls, it would be a vote of diminishing confidence in the Fed.
The Jackson Hole conference made it clear that Fed Chair Jerome Powell, and the rest of the Federal Open Market Committee (FOMC), seem determined to keep rates low for as long as possible, even if the regional Presidents are increasingly restive.
In September Fed officials kept rates unchanged but indicated rate hikes could be coming sooner than expected in 2022. The most recent dot plot projections showed nine of the eighteen FOMC members expecting a rate hike in 2022, which is up from seven in June’s projections. The Fed also announced that as economic progress continues, it could start to taper its monthly US$120 billion asset purchases as early as November.
It may be that the US dollar casts the deciding vote. If investors have faith that the Fed is on the job, higher rate expectations will greet strong growth/inflation, a higher US dollar and, on balance, lower equities. On the other hand, if the dollar falls out of bed, it is a signal that Fed credibility is out the window.
Source: Federal Reserve Bank of St. Louis.
%
-1.50
-1.00
-0.50
0.00
0.50
1.00
1.50
2.00
2.50
3.00
3.50US10yr TIPS Breakeven Inflation US10yr Treasury
Jan
2016
Mar
201
6
May
201
6
July
201
6
Sept
201
6
Nov
201
6
Jan
2017
Mar
201
7
May
201
7
July
201
7
Sept
201
7
Nov
201
7
Jan
2018
Mar
201
8
May
201
8
July
201
8
Sept
201
8
Nov
201
8
Jan
2019
Mar
201
9
May
201
9
July
201
9
Sept
201
9
Nov
201
9
Jan
2020
Mar
202
0
May
202
0
July
202
0
Sept
202
0
Nov
202
0
Jan
2021
Mar
202
1
May
202
1
July
202
1
Sept
202
1
Chart 6: Rate hikes could come sooner than expectedFOMC participants’ assessment of appropriate monetary policy: Midpoint of target range or target level for the federal funds rate
Source: Federal Reserve Monetary Policy Files 22 September 2021.
0
0.5
1.5
2.0
1.0
4.0
3.5
3.0
2.5
2021
Up from 7 in June
2022 2023 2024 Longer run
%

VanEck ViewPoint™ Be on guard 4
Chart 7: Lookout semiconductor chipsSemiconductor chips delivery time (weeks)
Source: Susquehanna Capital.
The recovery in the USThe hardest thing for the markets to get their collective heads around are “inflection points”, when the rate of change accelerates or decelerates but without reversing.
US growth ‘Chicken Littles’ claim ‘the sky is falling’ because third quarter growth is slowing compared to the break-neck speed of the first half of 2021. This has been signalled, in part, by sagging diffusion indices like PMIs (Purchasing Managers Indices).
It is worth noting how these indices are constructed. PMIs show the net difference between businesses seeing improving conditions and those seeing softer conditions compared to the current period. Any number over 50 indicates more businesses see improving conditions than deteriorating conditions compared to the current period. That means a fall in US Manufacturing ISM PMIs from 63.4 to 61.1 still signals well above trend growth, not collapse.
Driving the slowdown seems to be two factors:
1. The Delta variant is driving consumer hesitancy and resulting in shutdowns; and
2. Supply disruptions, which many assumed would be a short-term issue, are increasing.
Semiconductor chip shortages continue to blight the global auto industry, along with many others. Embedded chips are everywhere, from phones to household appliances. The slashing of production schedules is occurring across the globe. In turn, inventories are so low they are restraining sales, in turn holding back overall consumption.
More broadly, global shipping is overwhelmed; container-shipping rates continue to skyrocket, now up around 400% on a year ago.
New ships are on order, but shipyard capacity has fallen over the past decade. Keep in mind a new ship takes about three years to deliver. Falling freight rates will have to await slackening demand. There is no chance of that near-term as businesses face the seasonal run-up to Christmas.
10
15
20
25
Jul 2
017
Jul 2
018
Jul 2
019
Jul 2
020
Jul 2
021
Chart 8: Container costs continue to skyrocketWorld Container Index US$ per 40ft container
Source: Drewry.
1,000
2,000
3,000
4,000
5,000
6,000
7,000
8,000
9,000
10,000
11,000
13 D
ec 1
8
13 J
an 1
9
13 F
eb 1
9
13 M
ar 1
9
13 A
pr 1
9
13 M
ay 1
9
13 J
un 1
9
13 J
ul 1
9
13 A
ug 1
9
13 S
ep 1
9
13 O
ct 1
9
13 N
ov 1
9
13 D
ec 1
9
13 J
an 2
0
13 F
eb 2
0
13 M
ar 2
0
13 A
pr 2
0
13 M
ay 2
0
13 J
un 2
0
13 J
ul 2
0
13 A
ug 2
0
13 S
ep 2
0
13 O
ct 2
0
13 N
ov 2
0
13 D
ec 2
0
13 J
an 2
1
13 F
eb 2
1
13 M
ar 2
1
13 A
pr 2
1
13 M
ay 2
1
13 J
un 2
1
13 J
ul 2
1
13 A
ug 2
1
13 S
ep 2
1

VanEck ViewPoint™ Be on guard 5
Chart 9: Manufacturers can’t supply – so retailers can’t sell! ISM Manufacturers backlogs and ISM customer inventories (inverted)
Source: Bloomberg.
Inventory building will continueOnce seasonal/cyclical demand abates, we expect inventory building to continue. The ‘just-in-time’ inventory model has been under pressure since the beginning of the US/China trade feud. Now COVID has all but killed it. Businesses will run bigger inventories for the near future.
So, in our view, the softer, but still above trend, quarter three signals a longer economic surge, not the end of the cycle.
Of course, fiscal stimulus has flattened out in year-on-year terms. However, consumers, and businesses, are sitting on plenty of cash. We still expect consumers to spend as Delta restriction ease, with rising wages to add further to household incomes.
Furthermore, capacity constraints and post-COVID economic restructuring could kick off a wave of business investment that tax cuts failed to encourage.
Finally, while negotiations around President Biden’s infrastructure package will likely drag on and also result in an outcome well short of the initial US$3.5 trillion hopes, it will still be big and timely enough offset a 2023 fiscal cliff. A US$2 trillion package would still represent another 10 per cent of GDP.
25
30
35
40
45
5035
40
45
50
55
60
65
70
75
Feb
19
Mar
19
Apr
19
May
19
Jun
19
Jul 1
9
Aug
19
Sep
19
Oct
19
Nov
19
Dec
19
Jan
20
Feb
20
Mar
20
Apr
20
May
20
Jun
20
Jul 2
0
Aug
20
Sep
20
Oct
20
Nov
20
Dec
20
Jan-
21
Feb
21
Mar
21
Apr
21
May
21
Jun
21
Jul 2
1
Aug
21
ISM Manufacturers Backlogs (LHS) ISM Customer Inventories (RHS - inverted)
Source: National Bureau of Economic Research.
Chart 10: The need for Biden’s infrastructure packageChange in US Fiscal thrust pre-infrastructure package
-6.0
-4.0
-2.0
0.0
2.0
4.0
6.0
8.0
2019 2020 2021 2022 2023 2024
%

VanEck ViewPoint™ Be on guard 6
Chart 11: Transitorians may have overlooked Owners Equivalent Rent COVID temporarily depressed rents and now they are soaring
Transitorians sniff a victoryDespite inflation measures continuing to surprise on the upside and, as mentioned above, pressures extending beyond earlier expectations, Fed Chair Jerome Powell has continued to reassure believers in the “it’s all transitory” view of inflation.
Ironically, the one inflation indicator to surprise on the downside, this month’s Consumer Price Index (CPI), was mostly driven by downwards transitory Delta-variant impacts: airfares, hotels, car hire and insurance and some easing of used car price pressures.
There is no dispute that there are transitory price pressures however it is worth considering what else is going on under the hood of CPI. How much of current inflation is transitory and how much will be long-lasting by the time transitory washes through?
The more stable components of inflation are in the services sector, with services almost 60% of CPI, with the biggest influences housing cost and wages.
The biggest housing weight in the US CPI is Owners Equivalent Rent (OER), which represents a quarter of the entire CPI, and it has picked up modestly. Early in the pandemic, rent freezes and falling household formation pushed rents down. However, market rents are now rising and look set to continue. We expect OER to follow sooner rather than later.
More broadly, wage pressures are picking up. In the latest quarter, average weekly earnings growth has picked up to an annualised 4.4%, already above a pace consistent with the Fed’s 2% core Personal Consumption Expenditures (PCE) deflator target. This may seem surprising, given the unemployment rate remains well above pre-COVID lows. But employers are complaining of hiring difficulties, visible in surveys, across the board in the FOMC’s Beige book comments. Some of the difficulty probably reflects skills mismatch in a re-shaped economy as well as transient issues like childcare affecting supply.
It may also be that COVID has permanently crimped the labour force. Both Fed surveys and participation rates since the recovery suggest that a proportion of older workers, the backbone of job growth since the GFC, may have permanently left the workforce.
Source: US Bureau of Labor Statistics, Apartment Listings.
-2.0%
0.0%
2.0%
4.0%
6.0%
8.0%
10.0%
12.0%
14.0%
2.0%
2.5%
3.0%
3.5%
4.0%
4.5%
5.0%
5.5%
6.0%
6.5%
7.0% National Rent Proxy - leading by four months (RHS)CPI - Owners Equivalent Rent (LHS)
May
201
8
Jul 2
018
Sep
2018
Nov
201
8
Jan
2019
Mar
201
9
May
201
9
Jul 2
019
Sep
2019
Nov
201
9
Jan
2020
Mar
202
0
May
202
0
Jul 2
020
Sep
2020
Nov
202
0
Jan
2021
Mar
202
1
May
202
1
Jul 2
021
Sep
2021
Nov
202
1
Chart 12: Will older workers return?Labour force participation rate: 25–54 years and 55 years and over
Source: Federal Reserve Bank of St. Louis.
38.0
38.5
39.0
39.5
40.0
40.5
41.0
79.5
80.0
80.5
81.0
81.5
82.0
82.5
83.0
83.5
Sept
200
6
Jan
2007
Sept
200
7
Jan
2008
Sept
200
8
Jan
2009
Sept
200
9
Jan
2010
Sept
201
0
Jan
2011
Sept
201
1
Jan
2012
Sept
201
2
Jan
2013
Sept
201
3
Jan
2014
Sept
201
4
Jan
2015
Sept
201
5
Jan
2016
Sept
201
6
Jan
2017
Sept
201
7
Jan
2018
Sept
201
8
Jan
2019
Sept
201
9
Jan
2020
Sept
202
0
Jan
2021
Sept
202
1
25–54 years 55 & above
GlobalFinancial
Crisis
COVID-19

VanEck ViewPoint™ Be on guard 7
Chart 13: China’s PMIs surprised on the downsideDesynchronised composite PMIs in China, US, and Eurozone
Source: Bloomberg, Morningstar Direct. 1 July 2021 to 28 September 2021. MarketGrader China New Economy Index is an index of 120 A-Shares within technology, health care, consumer staples and consumer discretionary sectors. FTSE China 50 Index comprises 50 of the largest and most liquid Chinese stocks (H Shares, Red Chips and P Chips) listed and trading on the Hong Kong Exchange. Returns in Australian dollars. Past performance is not a reliable indicator of future performance.
Chart 14: China’s mainland shares have held up better over the quarterNew economy A-shares v offshore shares
China WobblesBefore we tie the strands together, it is worth fitting in another big piece of the jigsaw: China.
We’ve been warning since the start of the year that China credit growth had turned and growth would inevitably follow. China was first in, and hence first out, of the COVID dip last year; once it was clear that growth was ok, China policymakers turned their guns.
China’s days as the post-COVID recovery/policy normalisation trailblazer seem to be in the past. The latest activity gauges were outright shocking. This and the never-ending “default-or-no-default” drama involving a major property developer raised legitimate questions not only about China’s near-term growth outlook, but also about wider implications for emerging markets (EM) and commodity prices.
A few of China’s August PMIs, including composite, services and new orders, unexpectedly slipped into the contraction zone. The manufacturing PMI managed to stay in expansion territory, but only barely. Some of the reasons were related to the Delta virus outbreak in several cities, and the ensuing movement restrictions hit services. The supply chain issues and high freight prices also affect China, particularly the impact on exports and manufacturing. These factors were damaging, but their impact can be alleviated with additional policy support. However, there were other reasons behind weaker activity numbers, the regulatory overhaul and tech crackdown. This could be a different and longer-lasting story, because there are political and ideological considerations involved. State media has described the overhaul a “profound revolution” – so the overall impact on the labour market, income, and consumption, as well as on the private sector investments is yet to be fully understood.
First off, we don’t expect to see the economy overall crushed, so policy easing will be arriving. Some sectors will thrive, while others will stay under pressure.
Sectors aimed at domestic consumption should prosper, while property and export sectors will likely stay squeezed. Within technology there will be winners and losers: capacity constraints mean that high tech will be favoured over low, e.g. gaming etc.
Source: Bloomberg.
10
20
30
40
50
60
70
Sep
2018
Nov
201
8
Jan
2019
Mar
201
9
May
201
9
Jul 2
019
Sep
2019
Nov
201
9
Jan
2020
Mar
202
0
May
202
0
Jul 2
020
Sep
2020
Nov
202
0
Jan
2021
Mar
202
1
May
202
1
Jul 2
021
China Composite PMI US Composite PMI EU Composite PMI
-18
-16
-14
-12
-10
-8
-6
-4
-2
0
2
4
1 Ju
l 202
1
8 Ju
l 202
1
15 J
ul 2
021
22 J
ul20
21
29 J
ul 2
021
5 A
ug 2
021
12 A
ug 2
021
19 A
ug 2
021
26 A
ug 2
1
2 Se
p 20
21
9 Se
p 20
21
16 S
ep 2
021
23 S
ep 2
021
28 S
ep 2
021
%
MarketGrader China New Ecomony Index FTSE China 50 Index

VanEck ViewPoint™ Be on guard 8
Source: Bloomberg.
Chart 16: Adopting a more cautious policy stance makes senseChina Economic Surprise Index
Common prosperityShould Xi succeed in his “common prosperity” goals, we should expect income redistribution from rich to poor. In turn, this would see Chinese savings rate decline – an important factor in rebalancing China’s growth model away from exports towards domestic spending. Further, declining Chinese savings would be a further nail in the secular stagnation coffin.
So far China’s unexpectedly weak activity surveys has not led to a more aggressive policy response. August’s credit and money aggregates looked subdued, there was the expected increase in government bond issuance in line with the Politburo’s call for more fiscal support, and shadow lending continued to shrink. The central bank’s latest statement signaled the policy support will be targeted, with primary focus on small and medium enterprises (SMEs) and “low profile” policy tools. Authorities realise that they have a leverage problem, and ignoring it, even for the sake of near-term growth gains, would only make things worse in the future. In addition, China’s economic surprises might be bottoming out, so adopting a more cautious policy stance makes sense from this point of view as well.
This needs to be considered with the common prosperity policy which has a very long time horizon. Near-term implications include increased support for SMEs, which account for approximately 85% of urban employment and are essential for getting the economy out of the recent growth slump.
While a China shift away from exports would further pressure global supply, every cloud has a silver lining: EM exports ex-China have been growing strongly, in turn allowing a strong EM rebound, even with less fiscal support than developing nations.
One thing that is overlooked in regards to EM is that they have a lot of strengths. First and foremost, the proliferation of orthodox monetary policies in EM has paved the way for textbook adjustments of current accounts during the COVID crisis. EM ended up the last year with an aggregate current account surplus of 1.08% of GDP (vs. 0.25% of GDP in 2019). And this process is still on-going in many places, the consensus currently sees another large surplus this year (0.93% of GDP). Orthodox policies and the ensuing current account adjustments is the major reason why most EMs managed to preserve and/or boost their international reserves in the past year and a half.
Chart 15: China’s savings a further nail in the secular stagnation coffinChina Inequality Drives Savings Ratio
Source: Bloomberg.
0.4
0.4
0.5
0.5
0.6
0.6
5
10
15
20
25
30
35
40
Jan
1982
Jan
1984
Jan
1986
Jan
1988
Jan
1990
Jan
1992
Jan
1994
Jan
1996
Jan
1998
Jan
2000
Jan
2002
Jan
2004
Jan
2006
Jan
2008
Jan
2010
Jan
2012
Jan
2014
Jan
2016
Jan
2018
China Household Savings Rate (LHS) Gini Coefficient (RHS)
-100
-80
-60
-40
-20
0
20
40
60
80
Sep
2020
Oct
202
0
Nov
202
0
Dec
202
0
Jan
2021
Feb
2021
Mar
202
1
Apr
202
1
May
202
1
Jun
2021
Jul 2
021
Aug
202
1
Sep
2021

VanEck ViewPoint™ Be on guard 9
Stagflation a possibilityEmerging markets’ overseas remittances will probably normalise at some point, but right now, they look incredible. These are not insignificant numbers, these represent something like 8-8.5% of GDP in the Philippines and 3.8% of GDP in Mexico. This is a major supporting factor in regards to domestic consumption and growth in the recipient countries, especially against headwinds created by the COVID outbreaks, limited room for additional fiscal support, and potentially more growth moderation in China.
Emerging markets are considered ‘risky assets’ so it is worth noting a possible “stagflation” scenario. This scenario speaks for itself, high inflation and low growth are problematic for risky assets. There have been upside surprises to inflation and downside surprises to growth in both the developed markets and EM. The August non-farm-payroll number out of the US of 235,000, against a 725,000 consensus could catalyse greater worry about this scenario.
The other factor is China, which has been driving global economic growth, but has recently become a potential risk due to the collapse of Evergrande. Evergrande is China’s largest property developer by bond market issuance. There has been plenty of speculation about the future of Evergrande and its assets. We would make the point that is not a financial institution, on the other hand, real estate and construction account for about 20% of China’s GDP, and property’s share in household assets is north of 50%. So, the sector can have a major impact both of the near-term growth trajectory and growth rebalancing towards consumption. Some in the market worry about contagion.
Chart 17: Going strongEmerging markets overseas Remittances
Source: Moody’s.
2020 vs 2019 (%) 2021 YTD (%) yoy
Philippines -0.8 5.8
Colombia -2.5 31.2
El Salvador 4.8 39.5
Guatemala 7.9 38.5
Kenya 10.6 20.0
Mexico 11.4 23.5
Dominican Republic 16.0 38.6
Pakistan 17.2 23.9
Bangladesh 18.6 16.1
Chart 18 & 19: Upside surprises to inflation and downside surprises to growthUS economic and inflation surprises EM economic and inflation surprises in EM
Source: Bloomberg, Citi as of end of August.
-60
-40
-20
0
20
40
60
80
100
-200
-100
0
100
200
300
400
500
Mar
201
0
Sep
201
0
Mar
201
1
Sep
201
1
Mar
201
2
Sep
201
2
Mar
201
3
Sep
201
3
Mar
201
4
Sep
201
4
Mar
201
5
Sep
201
5
Mar
201
6
Sep
201
6
Mar
201
7
Sep
201
7
Mar
201
8
Sep
201
8
Mar
201
9
Sep
201
9
Mar
202
0
Sep
202
0
Mar
202
1
Aug
202
1
US Economic Surprises US Inflation Surprises
-60
-40
-20
0
20
40
60
80
100
-30-25-20-15-10-505
10152025
Aug
201
8
Oct
201
8
Dec
201
8
Feb
2019
Apr
201
9
Jun
2019
Aug
201
9
Oct
201
9
Dec
201
9
Feb
2020
Apr
202
0
Jun
2020
Aug
202
0
Oct
202
0
Dec
202
0
Feb
2021
Apr
202
1
Jun
2021
Aug
202
1
Citi Inflation Surprise Index EM Citi EM Economic Surprise Index

VanEck ViewPoint™ Be on guard 10
Chart 20: It took a while for the rest of China’s developers to be impacted by EvergrandeBond Price Chart: Evergrande vs Peers
Source: Bloomberg, 1 January 2020 to 16 September 2021.
A weaker CNY on the cardsChina’s property sector woes may just be starting. Our proximate concern remains contagion to other property sector bonds, not the broader global economy. The proximate problem at the beginning of September was that all the other Chinese property bonds were not reflecting Evergrande risks. Almost all other offshore property bonds were trading at par/100 cents. Why own a bond at par when Evergrande is telling you 70 cent losses, or more, are possible. Those other bond markets have finally begun to be hit, but this could just be the start. Figure 20 shows Evergrande bonds against those of some key issuers in the property sector as of 16 September.
The market is speculating that the Chinese government will ‘save’ the situation, that this could enter into Fed thinking, and that this is the usual back-and-forth of Chinese regulation. A government ‘save’ is not aligned to recent policy moves from Beijing. Policy is focused on lower housing prices and delivery of more units. It is also too early to expect the Fed to notice Evergrande, and now that China is USA’s number one adversary, boosting Chinese growth is not a good line for the Fed to pursue.
In terms of the contagion impact in China, the most obvious sector would be lenders, i.e. banks. The Chinese government also basically owns its banks. As a result, a typical contagion event into the financial system can be mitigated. It is likely that the authorities will ensure that whatever combination of bank forbearance is used, from write-downs to term-outs, bank financing will not be an obvious weak spot. As a result, we would not at all be surprised by support for the banking system. But don’t confuse such support with support for the property sector, which is still in play.
This could impact Chinese growth and its currency. Evergrande has come at a time when Chinese growth was already faltering. This saga in the property sector could enhance trends that point to a Chinese downturn. And the Chinese currency could be the key adjustment valve.
Chinese currency weakness is a bigger risk than realised, though it will materialise over months and quarters. It is reasonable to assume that China’s capital account is not going to be conducting the normal amount of US dollars into China’s financial assets. Further, it is also reasonable to see a global economic slowdown limiting the normal amount of US dollars into the Chinese economy for its exported goods. The only real solution for this setup is a weaker currency. The great thing about this scenario is that nobody seems to expect it. And CNY is up 10% in the past two years.
0
20
40
60
80
100
120
Jan
2020
1 Fe
b 20
20
1 M
ar 2
020
1 A
pr 2
020
1 M
ay 2
020
1 Ju
n 20
20
1 Ju
l 202
0
1 A
ug 2
020
1 Se
p 20
20
1 O
ct 2
020
1 N
ov 2
020
1 D
ec 2
020
1 Ja
n 20
21
1 Fe
b 20
21
1 M
a 20
21
1 A
p 20
21
1 M
ay 2
021
1 Ju
n 20
21
1 Ju
l 202
1
1 A
ug 2
021
1 Se
p 20
21
Evergrande 8.25% 2022 Kaisa 8.5% 2022 Cogard 4.75% 2022 Fantasia Holdings 7.95% 2022
Chart 21: China growth was already facing a downturnCNY and China’s Balance of Payments
Source: HSBC, Bloomberg.
6
6.2
6.4
6.6
6.8
7
7.2
7.4-4
-3
-2
-1
0
1
2
3
4
5
6
Dec
201
1
Jun
2012
Dec
201
2
Jun
2013
Dec
201
3
Jun
2014
Dec
201
4
Jun
2015
Dec
201
5
Jun
2016
Dec
201
6
Jun
2017
Dec
201
7
Jun
2018
Dec
201
8
Jun
2019
Dec
201
9
Jun
2020
Dec
202
0
CN
Y/$
(inve
rted
)
Sum
of C
urre
nt A
ccou
nt, N
et F
DI,
and
Net
Port
folio
Inflo
ws
(% G
DP)
Sum of Current Account, Net FDI, Net Portfolio Inflows (% GDP)USDCNY Curncy

VanEck ViewPoint™ Be on guard 11
Gold poised to shineMeanwhile, gold has been consolidating its gains since reaching all-time highs of US$2,075 per ounce a year ago. It nearly broke out a couple of times this year but failed and, in early August, dipped below its bull market trend bottom of US$1,760. Since the current trend began in 2019, gold has always bounced higher when testing the bottom of its range.
We have been disappointed by the failure of gold to hold at such a critical support level and subsequently believe that, in the shorter term, it may spend longer than anticipated consolidating around the US$1,800-US$1,900 per ounce range. However, the upside is that gold was quick to rebound from this “flash crash” and so a show of continued resilience should help reestablish the bull market trend and allow us to look back on this event as just an insignificant blip.
In the longer-term, once this consolidation has run its course, we still see plenty of tail-risk drivers that have the potential to drive gold to US$2,000 per ounce and beyond. Inflation is a longer-term problem and will persist into 2022. Economic growth is at risk once the massive fiscal spending has run its course and is further threatened by the potential removal of monetary stimulus. Finally, extreme debt levels and asset bubbles may not be sustainable, creating a risk-off environment that favours gold.
When the gold price is declining or consolidating, gold equities tend to underperform. Even when gold rallies, gold stocks can sometimes lag during the early stages of the rally while markets digest the new outlook for the metal. Something similar is happening during this recent bounce back in gold prices. The revenues and earnings generated by the companies at the end of August is essentially the same it was a month ago, yet the stocks are trading at lower prices, creating a value opportunity.
We believe that, in recent years, gold companies have consistently demonstrated a disciplined capital allocation approach focused on delivering attractive return of capital. Gold companies’ operating margins have expanded significantly in recent years. Not only has the gold price reached record highs, but companies have also reduced and controlled costs, allowing margins to increase to record levels.
Chart 22: Gold has been down and up and down while its miners, only downLBMA Gold Price PM and performance of NYSE Arca Gold Miners Index
Source: Bloomberg, 1 July 2021 to 27 September 2021. All figures in US dollars. Past performance is not a reliable indicator of future performance.
1 Ju
ly 2
021
8 Ju
ly 2
021
15 J
uly
2021
22 J
uly
2021
29 J
uly
2021
5 A
ug 2
021
12 A
ug 2
021
19
Aug
202
1
26 A
ug 2
021
2 Se
p 2
021
9 Se
p20
21
16 S
ep 2
021
23 S
ep 2
021
27 S
ep 2
021
-12
-14
-16
-10
-8
-6
-4
-2
0
2
4
$1,700
$1,720
$1,740
$1,760
$1,780
$1,800
$1,820
$1,840
Perf
orm
ance
%
Gol
d pr
ice
US$
LBMA Gold Price LHS NYSE Arca Gold Miners Index RHS
Source: Scotiabank, Federal Reserve Bank of St. Louis, Data as August 2021.
Chart 23: Miners could be a value opportunityGold miners are succeeding at controlling costs, improving operating margins
$0
$200
$400
$600
$800
$1,000
$1,200
$1,400
$1,600
$1,800
1970
1972
1974
1976
1978
1980
1982
1984
1986
1988
1990
1992
1994
1996
1998
2000
2002
2004
2006
2008
2010
2012
2014
2016
2018
2020
Ave
rage
AIS
C /
Ann
ual G
old
Pric
e ($
/oz)
Average All-In Sustaining Costs (AISC)Average Annual Gold Price

VanEck ViewPoint™ Be on guard 12
Chart 24: Equities are at levels associated with zero or negative returns over 10 yearsUS equity cycle adjusted PE and subsequent 10-year return
Source: Standard and Poors, Robert Shiller, BLS, Bloomberg, Barclays.
Pricing and new normalSo how do all these strands tie together for markets?
First, we are highly sceptical of bond pricing. By the time transitory has transited, we expect to see the US, and most other developed market economies, late in their economic cycles, closing in on full employment and with inflation above target. Bonds are nowhere near priced for this, especially if fiscal, China and restructuring private investment are going to close out secular stagnation.
US 10-year Treasuries are pricing an inflation rate of roughly 2.5%, but a real yield below -1%, pretty much the low of the entire COVID event. This seems unsustainable. At the very least, there is little margin for error and no payment for risk. A one-percentage point sell-off in bonds would take seven years to recoup.
This puts equity valuation under strain as well. US earnings have performed strongly in the past year but this seems unrepeatable. A booming fiscal deficit contributed to earnings and that will not repeat. Soaring input prices and rugged wages will also undermine margins. In these environments, companies with strong balance sheets and stable earnings hold up well.
That would be fine if equities had de-rated, but, in the US at least, they’ve barely moved. Cyclically adjusted PEs are at levels that have, historically, been associated with zero or negative returns over 10 years. And, as mentioned above, the S&P has the same duration as a 36-year zero coupon bond – extraordinary sensitivity to interest rate moves.
Of course, valuation might be destiny, but it’s not direction. Other than the Fed and the US dollar two other factors bear watching for investors: the cycle peaking and credit spreads.
While PMIs peaking only signal growth rates peaking, not outright declines, they are associated with peaks in equities. If the Delta crimp goes on too long, expect markets to get nervous.
Currently, credit spreads remain tight, alongside negative real yields on Treasuries, we have the extraordinary situation where 85% of junk bonds have negative real yields. While credit remains so cheap, borrowing and buybacks can underpin equity pricing.
Source: Bloomberg.
Chart 25: Bonds are also riskyYears of coupons to recoup loss from a 1% lift in yield of US 10-year Treasuries
Num
ber o
f yea
rs
0
1
2
3
4
5
6
7
8
Jan
1973
Jan
1975
Jan
1977
Jan
1979
Jan
1981
Jan
198
3
Jan
v85
Jan
1987
Jan
1989
Jan
1991
Jan
19 9
3
Jan
1995
Jan
1997
Jan
1999
Jan
2001
Jan
2003
Jan
2005
Jan
2007
Jan
2009
Jan
2011
Jan
2013
Jan
2015
Jan
2017
Jan
2019
Jan
2021
10yr
real
tota
l ret
urn
US Equity Cycle-Adjusted PE and Subsequent 10 Year Return*
Never lost buying withCAPE below 12
Never profited buyingwith CAPE above 39
-4
-3
-2
-1
0
1
2
3
4
-5
0
5
10
15
20
0 5 10 15 20 25 30 35 40 45 50
Cycle-Adjusted PE (CAPE)
R2 = 0.861997–2008
Full Sample (Monthly from 1900)R2 = 0.33
1974–1984R2 = 0.77
Current CAPE
VanEck ViewPoint™ Be on guard 13
Chart 26: Housing markets continuing to run
Source: Bloomberg, 1 January 2010 to 14 September 2021.
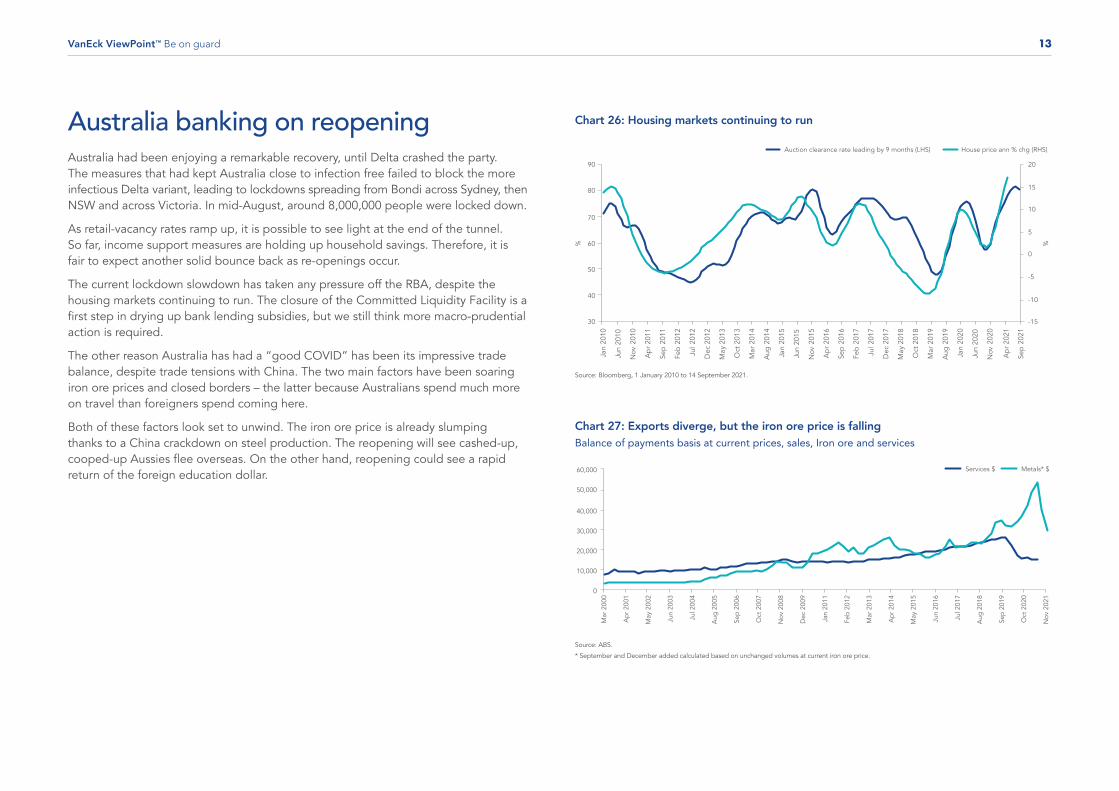
Australia banking on reopeningAustralia had been enjoying a remarkable recovery, until Delta crashed the party. The measures that had kept Australia close to infection free failed to block the more infectious Delta variant, leading to lockdowns spreading from Bondi across Sydney, then NSW and across Victoria. In mid-August, around 8,000,000 people were locked down.
As retail-vacancy rates ramp up, it is possible to see light at the end of the tunnel. So far, income support measures are holding up household savings. Therefore, it is fair to expect another solid bounce back as re-openings occur.
The current lockdown slowdown has taken any pressure off the RBA, despite the housing markets continuing to run. The closure of the Committed Liquidity Facility is a first step in drying up bank lending subsidies, but we still think more macro-prudential action is required.
The other reason Australia has had a “good COVID” has been its impressive trade balance, despite trade tensions with China. The two main factors have been soaring iron ore prices and closed borders – the latter because Australians spend much more on travel than foreigners spend coming here.
Both of these factors look set to unwind. The iron ore price is already slumping thanks to a China crackdown on steel production. The reopening will see cashed-up, cooped-up Aussies flee overseas. On the other hand, reopening could see a rapid return of the foreign education dollar.
Source: ABS.
* September and December added calculated based on unchanged volumes at current iron ore price.
Chart 27: Exports diverge, but the iron ore price is fallingBalance of payments basis at current prices, sales, Iron ore and services
0
10,000
20,000
30,000
40,000
50,000
60,000
Mar
200
0
Apr
200
1
May
200
2
Jun
2003
Jul 2
004
Aug
200
5
Sep
2006
Oct
200
7
Nov
200
8
Dec
200
9
Jan
2011
Feb
2012
Mar
201
3
Apr
201
4
May
201
5
Jun
2016
Jul 2
017
Aug
201
8
Sep
2019
Oct
202
0
Nov
202
1
Services $ Metals* $
%
%
-15
-10
-5
0
5
10
15
20
30
40
50
60
70
80
90
Auction clearance rate leading by 9 months (LHS) House price ann % chg (RHS)
Jan
2010
Jun
2010
Nov
201
0
Ap
r 201
1
Sep
201
1
Feb
201
2
Jul 2
012
Dec
201
2
May
201
3
Oct
201
3
Mar
201
4
Aug
201
4
Jan
2015
Jun
2015
Nov
201
5
Ap
r 201
6
Sep
201
6
Feb
201
7
Jul 2
017
Dec
201
7
May
201
8
Oct
201
8
Mar
201
9
Aug
201
9
Jan
2020
Jun
2020
Nov
202
0
Ap
r 202
1
Sep
202
1

VanEck’s range of Exchange Traded Funds on ASXName ASX code Index Australian Broad BasedAustralian Equal Weight ETF MVW MVISTM Australia Equal Weight Index 0.35%
Australian SectorAustralian Banks ETF MVB MVISTM Australia Banks Index 0.28%
Australian Property ETF MVA MVISTM Australia A-REITs Index 0.35%
Australian Resources ETF MVR MVISTM Australia Resources Index 0.35%
Australian Small and Mid CompaniesSmall Companies Masters ETF MVS MVIS Small-Cap Dividend Payers Index 0.49%
S&P/ASX MidCap ETF MVE S&P/ASX MidCap 50 Index 0.45%
Australian Equity IncomeMorningstar Australian Moat Income ETF DVDY Morningstar® Australia Dividend Yield Focus Index™ 0.35%
Sustainable InvestingMSCI International Sustainable Equity ETF ESGI MSCI World ex Australia ex Fossil Fuel Select SRI and Low Carbon Capped Index 0.55%
MSCI Australian Sustainable Equity ETF GRNV MSCI Australia IMI Select SRI Screened Index 0.35%
InternationalFTSE China A50 ETF CETF FTSE China A50 Index 0.60%
China New Economy ETF CNEW MarketGrader China New Economy Index 0.95%
MSCI Multifactor Emerging Markets Equity ETF EMKT MSCI Emerging Markets Diversified Multiple-Factor Index (AUD) 0.69%
Morningstar Wide Moat ETF MOAT Morningstar® Wide Moat Focus Index™ 0.49%
Morningstar International Wide Moat ETF GOAT Morningstar® Developed Markets ex Australia Wide Moat Focus Index™ 0.55%
MSCI International Quality ETF QUAL MSCI World ex Australia Quality Index 0.40%
MSCI International Quality (Hedged) ETF QHAL MSCI World ex Australia Quality 100% Hedged to AUD Index 0.43%
MSCI International Value ETF VLUE MSCI World ex Australia Enhanced Value Top 250 Select Index 0.40%
MSCI International Small Companies Quality ETF QSML MSCI World ex Australia Small Cap Quality 150 Index 0.59%
Global SectorFTSE Global Infrastructure (Hedged) ETF IFRA FTSE Developed Core Infrastructure 50/50 Hedged into AUD Index 0.52%
FTSE International Property (Hedged) ETF REIT FTSE EPRA Nareit Developed ex Australia Rental Index AUD Hedged 0.43%
Gold Miners ETF GDX NYSE Arca® Gold Miners Index™ 0.53%
Global Healthcare Leaders ETF HLTH MarketGrader Developed Markets (ex-Australia) Health Care AUD Index 0.45%
Australian Fixed IncomeAustralian Corporate Bond Plus ETF PLUS iBoxx AUD Corporates Yield Plus Mid Price Index 0.32%
Australian Floating Rate ETF FLOT Bloomberg AusBond Credit FRN 0+Yr Index 0.22%
ThematicVideo Gaming and Esports ETF ESPO MVISTM Global Video Gaming and eSports Index (AUD) 0.55%
Global Clean Energy ETF CLNE S&P Global Clean Energy Select Index 0.65%
Global Income Performance BenchmarkVanEck Emerging Income Opportunities Active ETF (Managed Fund) EBND 50% J.P. Morgan Emerging Market Bond Index Global Diversified Hedged AUD and
50% J.P. Morgan Government Bond-Emerging Market Index Global Diversified0.95%
Capital Securities Index/BenchmarkVanEck Bentham Global Capital Securities Active ETF (Managed Fund) GCAP RBA Cash Rate + 3% per annum 0.59%
Australian Subordinated Debt ETF SUBD iBoxx AUD Investment Grade Subordinated Debt Mid Price Index 0.29%
*Other fees and costs apply. Please see the respective PDS.
Management costs (% p.a.)*

Important noticeIssued by VanEck Investments Limited ACN 146 596 116 AFSL 416755 (‘VanEck’). This is general advice only, not personal financial advice. It does not take into account any person’s individual objectives, financial situation or needs. Read the relevant PDS and speak with a financial adviser to determine if a fund is appropriate for your circumstances. PDS’ are available here, and detail the key risks. No member of the VanEck group of companies guarantees the repayment of capital, the payment of income, performance, or any particular rate of return from any VanEck fund. Past performance is not a reliable indicator of future performance. VanEck is the responsible entity and issuer of units in VanEck’s range of ETFs traded on ASX. All investments carry some level of risk. Investing in international markets has specific risks that are in addition to the typical risks associated with investing in the Australian market. These include currency/foreign exchange fluctuations, ASX trading time differences and changes in foreign regulatory and tax regulations.
The Index Providers do not sponsor, endorse or promote the funds and do not guarantee the timeliness, accurateness, or completeness of any data or information relating to the indices or accept any liability for any errors, omissions, or interruptions of their index and do not give any assurance that the funds will accurately track the performance of their respective index. The indices and associated trademarks referenced herein are the property of the respective Index Provider and used by VanEck under license. See the relevant PDS for more detailed information on the indices and limited relationship that the Index Provider has with VanEck.
Contact us
vaneck.com.au
+61 2 8038 3300
VanEck-Australia
VanEck_Au
VanEckAus
VanEckAustralia