Embed Size (px)
Citation preview

Vanguard REIT Index Fund
Annual Report | January 31, 2018

Contents
Please note: The opinions expressed in this report are just that—informed opinions. They should not be considered promisesor advice. Also, please keep in mind that the information and opinions cover the period through the date on the front of thisreport. Of course, the risks of investing in your fund are spelled out in the prospectus.
See the Glossary for definitions of investment terms used in this report.About the cover: Nautical images have been part of Vanguard’s rich heritage since its start in 1975. For anincoming ship, a lighthouse offers a beacon and safe path to shore. You can similarly depend on Vanguard to putyou first––and light the way––as you strive to meet your financial goals. Our client focus and low costs,stemming from our unique ownership structure, assure that your interests are paramount.
REIT Index Fund
Vanguard’s Principles for Investing Success
We want to give you the best chance of investment success. Theseprinciples, grounded in Vanguard’s research and experience, can put you onthe right path.
Goals. Create clear, appropriate investment goals.
Balance. Develop a suitable asset allocation using broadly diversified funds.
Cost. Minimize cost.
Discipline. Maintain perspective and long-term discipline.
A single theme unites these principles: Focus on the things you can control.We believe there is no wiser course for any investor.
Your Fund’s Performance at a Glance. . . . . . . . . . . . . . . . . . 1
CEO’s Perspective. . . . . . . . . . . . . . . . . . . . . . . . . . . . . . . . . 3
Results of Proxy Voting. . . . . . . . . . . . . . . . . . . . . . . . . . . . . 6
Fund Profile. . . . . . . . . . . . . . . . . . . . . . . . . . . . . . . . . . . . . . .9
Performance Summary. . . . . . . . . . . . . . . . . . . . . . . . . . . . .10
Financial Statements. . . . . . . . . . . . . . . . . . . . . . . . . . . . . . 13
Your Fund’s After-Tax Returns. . . . . . . . . . . . . . . . . . . . . . . 40
About Your Fund’s Expenses. . . . . . . . . . . . . . . . . . . . . . . . 41
Glossary. . . . . . . . . . . . . . . . . . . . . . . . . . . . . . . . . . . . . . . . 43

Your Fund’s Performance at a Glance
1
Total Returns: Fiscal Year Ended January 31, 2018
TotalReturns
Vanguard REIT Index Fund
Investor Shares 0.45%
ETF Shares
Market Price 0.65
Net Asset Value 0.59
Admiral™ Shares 0.58
Institutional Shares 0.60
MSCI US REIT Index 0.70
Real Estate Funds Average 2.65
Real Estate Funds Average: Derived from data provided by Lipper, a Thomson Reuters Company. Admiral Shares carry lower expenses and are available to investors who meet certain account-balance requirements. Institutional Sharesare available to certain institutional investors who meet specific administrative, service, and account-size criteria. The Vanguard ETF®Shares shown are traded on the NYSE Arca exchange and are available only through brokers. The table provides ETF returns based onboth the NYSE Arca market price and the net asset value for a share. U.S. Pat. Nos. 6,879,964; 7,337,138; 7,720,749; 7,925,573;8,090,646; and 8,417,623.For the ETF Shares, the market price is determined by the midpoint of the bid-offer spread as of the closing time of the New York Stock Exchange (generally 4 p.m., Eastern time). The net asset value is also determined as of the NYSE closing time. For more information about how the ETF Shares' market prices have compared with their net asset value, visit vanguard.com, select your ETF, and then select the Price and Performance tab. The ETF premium/discount analysis there shows the percentages of days on which the ETF Shares' market price was above or below the NAV.
• For the 12 months ended January 31, 2018, Vanguard REIT Index Fund returned
0.45% for Investor Shares. Returns for ETF, Admiral, and Institutional Shares were a bit
higher. The results were in line with those of the fund’s benchmark index but lower than
the average return of peer funds.
• Top-performing subsectors included industrial REITs, hotel and resort REITs,
specialized REITs, and residential REITs.
• The fund’s largest subsector, retail REITs, was the biggest detractor. Health care
REITs also hurt performance, as did office REITs, diversified REITs, mortgage REITs,
and diversified real estate activities.
• On February 1, 2018, the fund changed its name to Vanguard Real Estate Index Fund
and its benchmark from the MSCI US REIT Index to the MSCI US Investable Market
Real Estate 25/50 Transition Index.
• The fund is expected to complete its transition to its destination benchmark, MSCI
US Investable Market Real Estate 25/50 Index, during the third quarter of 2018.

2
Total Returns: Ten Years Ended January 31, 2018
Average
Annual Return
REIT Index Fund Investor Shares 7.08%
REIT Spliced Index 7.21
Real Estate Funds Average 6.09
For a benchmark description, see the Glossary.Real Estate Funds Average: Derived from data provided by Lipper, a Thomson Reuters Company.
The figures shown represent past performance, which is not a guarantee of future results. (Current performance may be lower or higher than the performance data cited. For performance data current to the most recent month-end, visit our website at vanguard.com/performance.) Note, too, that both investment returns and principal value can fluctuate widely, so an investor’s shares, when sold, could be worth more or less than their original cost.
Expense RatiosYour Fund Compared With Its Peer Group
Investor
Shares
ETF
Shares
Admiral
Shares
Institutional
Shares
Peer Group
Average
REIT Index Fund 0.26% 0.12% 0.12% 0.10% 1.25%
The fund expense ratios shown are from the prospectus dated September 26, 2017, and represent estimated costs for the current fiscalyear. For the fiscal year ended January 31, 2018, the fund’s expense ratios were 0.26% for Investor Shares, 0.12% for ETF Shares, 0.12%for Admiral Shares, and 0.10% for Institutional Shares. The peer-group expense ratio is derived from data provided by Lipper, a ThomsonReuters Company, and captures information through year-end 2017.
Peer group: Real Estate Funds.

Dear Shareholder,
When you start a new job, it’s natural
to reflect on both the past and the future.
And so it is in my case, having begun my
service as just the fourth chief executive
in Vanguard’s history.
I feel extremely fortunate to have the
chance to lead a company filled with people
who come to work every day passionate
about Vanguard’s core purpose: to take a
stand for all investors, to treat them fairly,
and to give them the best chance for
investment success.
Making a real difference
When I joined Vanguard in 1991, I found a
mission-driven team focused on improving
lives—helping people retire more com-
fortably, put their children through college,
and achieve financial security. I found
a company with purpose in an industry
ripe for improvement.
It was clear, even early in my career,
that the cards were stacked against most
investors. Hidden fees, performance-
chasing, and poor advice were relentlessly
eroding investors’ dreams.
We knew Vanguard could be different
and, as a result, could make a real
difference. Over the past 25 years, for
example, Vanguard has lowered our funds’
asset-weighted average expense ratio
CEO’s Perspective
Tim Buckley
President and Chief Executive Officer
3

from 0.31% to 0.12%. And over the past
decade, 94% of our funds have beaten
the average annual return of their peers.1
Focused on your success
Vanguard is built for Vanguard investors—
as a client-owned company, we focus
solely on you, our fund shareholders.
Everything we do is designed to give our
clients the best chance for investment
success. In my new role as CEO, I intend
to keep this priority front and center. We’re
proud of what we’ve achieved, but we’re
even more excited about what’s to come.
As I write this, we’ve experienced a
period of pronounced market volatility.
Strong economic growth and budding
signs of inflation have raised concerns
about a more aggressive Federal Reserve.
Although volatility can test investors’
nerves, we sometimes think of this as
“Vanguard weather”—a time when having
a disciplined, low-cost, and long-term
approach to investment management
serves investors well.
Market Barometer
Average Annual Total Returns
Periods Ended January 31, 2018
One Year Three Years Five Years
Stocks
Russell 1000 Index (Large-caps) 25.84% 14.28% 15.72%
Russell 2000 Index (Small-caps) 17.18 12.12 13.33
Russell 3000 Index (Broad U.S. market) 25.16 14.11 15.53
FTSE All-World ex US Index (International) 29.63 10.20 7.48
Bonds
Bloomberg Barclays U.S. Aggregate Bond Index
(Broad taxable market) 2.15% 1.14% 2.01%
Bloomberg Barclays Municipal Bond Index
(Broad tax-exempt market) 3.52 1.97 2.69
Citigroup Three-Month U.S. Treasury Bill Index 0.91 0.41 0.25
CPI
Consumer Price Index 2.07% 1.98% 1.48%
The performance data shown represent past performance, which is not a guarantee of future results.
1 For the ten-year period through December 31, 2017, 9 of 9 Vanguard money market funds, 56 of 60 bond funds, 21 of 22 balanced funds, and 131 of 140 stock funds, or 217 of 231 Vanguard funds, outperformed their peer-group averages. Sources: Vanguard, based on data from Lipper, a Thomson Reuters Company.
4

Steady, time-tested guidance
Our guidance for investors, as always, is
to stay the course, tune out the hyperbolic
headlines, and focus on your goals and
what you can control, such as costs and
how much you save. This time-tested
advice has served our clients well over
the decades.
Regardless of how the markets perform
in the short term, I’m incredibly optimistic
about the future for our investors. We have
a dedicated team serving you, and we will
never stop striving to make Vanguard the
best place for you to invest through our
high-quality funds and services, advice and
guidance to help you meet your financial
goals, and an experience that makes you
feel good about entrusting us with your
hard-earned savings.
Thank you for your continued loyalty.
Sincerely,
Mortimer J. Buckley
President and Chief Executive Officer
February 15, 2018
5

Results of Proxy Voting
At a special meeting of shareholders on November 15, 2017, fund shareholders approved the
following proposals:
Proposal 1—Elect trustees for the fund.*
The individuals listed in the table below were elected as trustees for the fund. All trustees with the
exception of Ms. Mulligan, Ms. Raskin, and Mr. Buckley (each of whom already serves as a director
of The Vanguard Group, Inc.) served as trustees to the funds prior to the shareholder meeting.
Percentage
Trustee For Withheld For
Mortimer J. Buckley 2,503,465,695 87,490,567 96.6%
Emerson U. Fullwood 2,500,061,682 90,894,579 96.5%
Amy Gutmann 2,498,574,662 92,381,600 96.4%
JoAnn Heffernan Heisen 2,502,785,690 88,170,572 96.6%
F. Joseph Loughrey 2,501,562,489 89,393,773 96.6%
Mark Loughridge 2,503,584,454 87,371,807 96.6%
Scott C. Malpass 2,499,755,273 91,200,989 96.5%
F. William McNabb III 2,498,986,712 91,969,550 96.5%
Deanna Mulligan 2,503,553,783 87,402,478 96.6%
André F. Perold 2,453,401,594 137,554,668 94.7%
Sarah Bloom Raskin 2,500,665,258 90,291,004 96.5%
Peter F. Volanakis 2,501,344,074 89,612,188 96.5%
* Results are for all funds within the same trust.
Proposal 2—Approve a manager-of-managers arrangement with third-party investment advisors.
This arrangement enables the fund to enter into and materially amend investment advisory
arrangements with third-party investment advisors, subject to the approval of the fund’s board of
trustees and certain conditions imposed by the Securities and Exchange Commission, while
avoiding the costs and delays associated with obtaining future shareholder approval.
Broker Percentage
Vanguard Fund For Abstain Against Non-Votes For
REIT Index Fund 559,889,574 21,146,116 16,912,120 138,870,970 76.0%
6

Proposal 3—Approve a manager-of-managers arrangement with wholly owned subsidiaries
of Vanguard.
This arrangement enables Vanguard or the fund to enter into and materially amend investment
advisory arrangements with wholly owned subsidiaries of Vanguard, subject to the approval of the
fund’s board of trustees and any conditions imposed by the Securities and Exchange Commission
(SEC), while avoiding the costs and delays associated with obtaining future shareholder approval.
The ability of the fund to operate in this manner is contingent upon the SEC’s approval of a pending
application for an order of exemption.
Broker Percentage
Vanguard Fund For Abstain Against Non-Votes For
REIT Index Fund 562,115,638 20,716,853 15,115,320 138,870,970 76.3%
Proposal 4—Change the investment objective of Vanguard REIT Index Fund.
The revised investment objective will broaden the fund’s investable universe to include real
estate-related investments, such as certain specialized real estate investment trusts (REITs) and
real estate management and development companies. The fund will continue to invest in publicly
traded equity REITs.
Broker Percentage
Vanguard Fund For Abstain Against Non-Votes For
REIT Index Fund 535,225,893 36,724,554 25,921,900 138,946,434 72.6%
Proposal 5—Reclassify the diversification status of the REIT Index Fund to nondiversified.
Reclassifying the fund’s diversification status to nondiversified, as defined by the Investment
Company Act of 1940, aligns the fund’s diversification status with that of Vanguard’s other sector
equity index funds and enables the fund to track its benchmark more closely.
Broker Percentage
Vanguard Fund For Abstain Against Non-Votes For
REIT Index Fund 531,277,052 35,754,603 30,840,692 138,946,434 72.1%
7
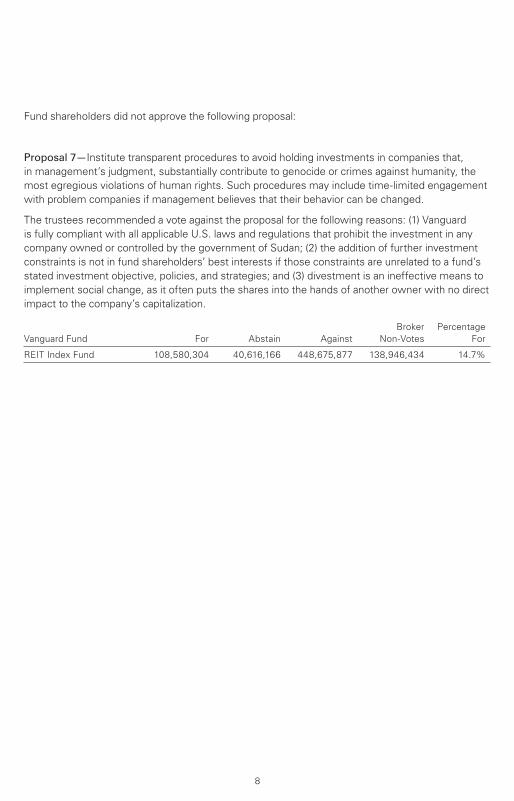
Fund shareholders did not approve the following proposal:
Proposal 7—Institute transparent procedures to avoid holding investments in companies that,
in management’s judgment, substantially contribute to genocide or crimes against humanity, the
most egregious violations of human rights. Such procedures may include time-limited engagement
with problem companies if management believes that their behavior can be changed.
The trustees recommended a vote against the proposal for the following reasons: (1) Vanguard
is fully compliant with all applicable U.S. laws and regulations that prohibit the investment in any
company owned or controlled by the government of Sudan; (2) the addition of further investment
constraints is not in fund shareholders’ best interests if those constraints are unrelated to a fund’s
stated investment objective, policies, and strategies; and (3) divestment is an ineffective means to
implement social change, as it often puts the shares into the hands of another owner with no direct
impact to the company’s capitalization.
Broker Percentage
Vanguard Fund For Abstain Against Non-Votes For
REIT Index Fund 108,580,304 40,616,166 448,675,877 138,946,434 14.7%
8

REIT Index Fund
Fund ProfileAs of January 31, 2018
1 The expense ratios shown are from the prospectus dated September 26, 2017, and represent estimated costs for the current fiscal year. For the fiscal year ended January 31, 2018, the expense ratios were 0.26% for Investor Shares, 0.12% for ETF Shares, 0.12% for Admiral Shares, and 0.10% for Institutional Shares.
9
Share-Class Characteristics
Investor
Shares ETF Shares
Admiral
Shares
Institutional
Shares
Ticker Symbol VGSIX VNQ VGSLX VGSNX
Expense Ratio1 0.26% 0.12% 0.12% 0.10%
Volatility Measures
MSCI US
REIT Index
DJ
U.S. Total
Market
FA Index
R-Squared 1.00 0.20
Beta 1.00 0.58
These measures show the degree and timing of the fund’s fluctuations compared with the indexes over 36 months.
Ten Largest Holdings (% of total net assets)
Vanguard REIT II Index
Fund Other 10.1%
Simon Property Group
Inc. Retail REITs 5.5
Equinix Inc. Specialized REITs 3.9
Prologis Inc. Industrial REITs 3.8
Public Storage Specialized REITs 3.3
AvalonBay Communities
Inc. Residential REITs 2.6
Digital Realty Trust Inc. Specialized REITs 2.5
Equity Residential Residential REITs 2.5
Welltower Inc. Health Care REITs 2.4
Ventas Inc. Health Care REITs 2.2
Top Ten 38.8%
The holdings listed exclude any temporary cash investments andequity index products.
Portfolio Characteristics
Fund
MSCI US
REIT Index
DJ
U.S. Total
Market
FA Index
Number of Stocks 184 152 3,765
Median Market Cap $9.8B $9.8B $73.6B
Price/Earnings Ratio 32.5x 32.5x 23.8x
Price/Book Ratio 2.1x 2.2x 3.2x
Return on Equity 5.9% 5.9% 14.9%
Earnings Growth Rate 18.3% 17.1% 9.1%
Dividend Yield 4.2% 4.2% 1.7%
Foreign Holdings 0.0% 0.0% 0.0%
Turnover Rate 6% — —
Short-Term Reserves 0.1% — —
Dividend Yield: This yield may include some payments that represent a return of capital, capital gains distributions, or both by the underlying REITs. These amounts are determined by each REIT at the end of its fiscal year.
Subindustry Diversification (% of equity exposure)
FundMSCI US
REIT Index
Diversified REITs 7.3% 7.2%
Health Care REITs 11.1 11.2
Hotel & Resort REITs 7.2 7.2
Industrial REITs 7.7 7.8
Office REITs 13.2 13.2
Residential REITs 16.2 16.2
Retail REITs 19.0 19.1
Specialized REITs 18.3 18.1
Sector categories are based on the Global Industry ClassificationStandard (“GICS”), except for the “Other” category (if applicable),which includes securities that have not been provided a GICSclassification as of the effective reporting period.

All of the returns in this report represent past performance, which is not a guarantee of future results that may be achieved by the fund. (Current performance may be lower or higher thanthe performance data cited. For performance data current to the most recent month-end, visitour website at vanguard.com/performance.) Note, too, that both investment returns and principal value can fluctuate widely, so an investor’s shares, when sold, could be worth more or less than their original cost. The returns shown do not reflect taxes that a shareholder would pay
on fund distributions or on the sale of fund shares.
REIT Index Fund
Performance Summary
See Financial Highlights for dividend and capital gains information.
10
Cumulative Performance: January 31, 2008, Through January 31, 2018Initial Investment of $10,000
2018201720162015201420132012201120102009
$28,000
1,000
19,820
Average Annual Total Returns
Periods Ended January 31, 2018
OneYear
FiveYears
TenYears
Final Valueof a $10,000Investment
REIT Index Fund Investor Shares 0.45% 7.38% 7.08% $19,820
• • • • • • • • REIT Spliced Index 0.70 7.62 7.21 20,061
– – – – Real Estate Funds Average 2.65 7.05 6.09 18,068
________ Dow Jones U.S. Total Stock MarketFloat Adjusted Index 25.16 15.48 9.91 25,724
For a benchmark description, see the Glossary.
Real Estate Funds Average: Derived from data provided by Lipper, a Thomson Reuters Company.
OneYear
FiveYears
TenYears
Final Valueof a $10,000Investment
REIT Index Fund ETF Shares Net AssetValue 0.59% 7.52% 7.22% $20,085
REIT Spliced Index 0.70 7.62 7.21 20,061
Dow Jones U.S. Total Stock Market FloatAdjusted Index 25.16 15.48 9.91 25,724

REIT Index Fund
11
Average Annual Total Returns
Periods Ended January 31, 2018
OneYear
FiveYears
TenYears
Final Valueof a $10,000Investment
REIT Index Fund Admiral Shares 0.58% 7.53% 7.23% $20,092
REIT Spliced Index 0.70 7.62 7.21 20,061
Dow Jones U.S. Total Stock Market FloatAdjusted Index 25.16 15.48 9.91 25,724
OneYear
FiveYears
TenYears
Final Valueof a $5,000,000
Investment
REIT Index Fund Institutional Shares 0.60% 7.54% 7.25% $10,065,377
REIT Spliced Index 0.70 7.62 7.21 10,030,667
Dow Jones U.S. Total Stock Market FloatAdjusted Index 25.16 15.48 9.91 12,861,866
Cumulative Returns of ETF Shares: January 31, 2008, Through January 31, 2018
OneYear
FiveYears
TenYears
REIT Index Fund ETF Shares Market Price 0.65% 43.70% 101.23%
REIT Index Fund ETF Shares Net Asset Value 0.59 43.72 100.85
REIT Spliced Index 0.70 44.39 100.61
Fiscal-Year Total Returns (%): January 31, 2008, Through January 31, 2018
–47.82 –47.92
2009
48.51 48.06
2010
40.02 40.23
2011
11.80 12.01
2012
14.45 14.72
2013
2.78 2.99
2014
33.29 33.52
2015
–7.44 –7.18
2016
12.07 12.34
2017
0.45 0.70
2018
REIT Index Fund Investor Shares
REIT Spliced Index
For a benchmark description, see the Glossary.
REIT Index Fund
12
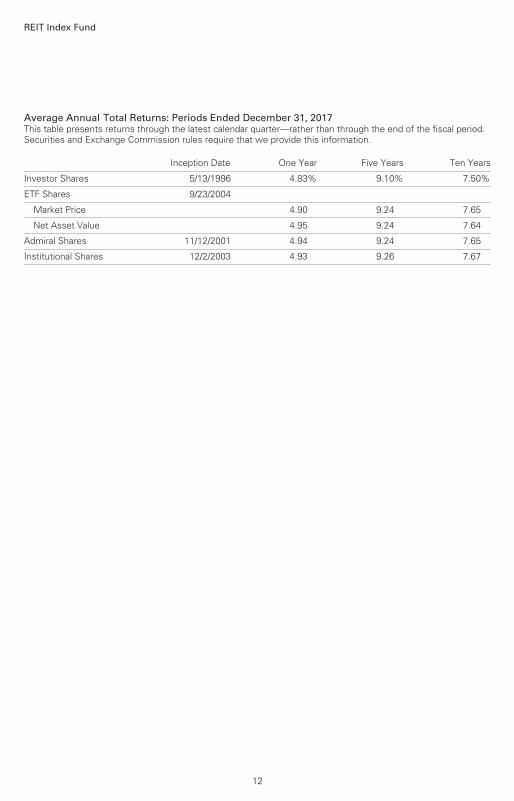
Average Annual Total Returns: Periods Ended December 31, 2017 This table presents returns through the latest calendar quarter—rather than through the end of the fiscal period.
Securities and Exchange Commission rules require that we provide this information.
Inception Date One Year Five Years Ten Years
Investor Shares 5/13/1996 4.83% 9.10% 7.50%
ETF Shares 9/23/2004
Market Price 4.90 9.24 7.65
Net Asset Value 4.95 9.24 7.64
Admiral Shares 11/12/2001 4.94 9.24 7.65
Institutional Shares 12/2/2003 4.93 9.26 7.67

Market
Value•
Shares ($000)
Market
Value•
Shares ($000)
Equity Real Estate Investment Trusts
(REITs) (99.7%)1
Diversified REITs (6.5%) 2 VEREIT Inc. 64,219,038 462,3772 WP Carey Inc. 7,042,783 456,4432 Liberty Property Trust 9,715,589 402,3222 Forest City Realty
Trust Inc. Class A 14,066,431 330,1392 Colony NorthStar Inc.
Class A 34,496,621 309,7802 STORE Capital Corp. 11,268,795 276,1982 Gramercy Property
Trust 10,008,749 252,6212 Spirit Realty Capital Inc. 30,213,620 246,845
Empire State Realty
Trust Inc. 8,833,493 172,695
PS Business Parks Inc. 1,346,490 164,4202 Washington REIT 5,072,246 145,3712 Lexington Realty Trust 14,272,272 128,7362 Alexander & Baldwin Inc. 4,527,983 120,082
Select Income REIT 4,423,132 98,901
American Assets
Trust Inc. 2,330,116 82,1602 Global Net Lease Inc. 4,439,092 81,413*,2 iStar Inc. 4,285,982 45,2172 Investors Real Estate
Trust 7,943,254 45,0382 Armada Hoffler
Properties Inc. 2,968,441 42,7162 Gladstone Commercial
Corp. 1,825,278 34,680
One Liberty Properties
Inc. 923,188 22,5632,3 Winthrop Realty Trust 1,892,511 12,674
3,933,391
Health Care REITs (10.0%) 2 Welltower Inc. 24,309,940 1,457,8672 Ventas Inc. 23,466,917 1,313,4432 HCP Inc. 30,901,425 744,1062 Healthcare Trust of
America Inc. Class A 13,226,106 365,173^,2 Omega Healthcare
Investors Inc. 12,998,348 351,4752 Medical Properties
Trust Inc. 23,996,197 313,8702 Senior Housing
Properties Trust 15,656,540 271,3282 Healthcare Realty
Trust Inc. 8,161,360 243,7802 Sabra Health Care
REIT Inc. 11,584,960 209,6882 Physicians Realty Trust 11,705,534 190,8002 National Health
Investors Inc. 2,702,796 190,6282 LTC Properties Inc. 2,608,825 106,910*,2 Quality Care
Properties Inc. 6,187,006 83,5252 CareTrust REIT Inc. 5,007,883 79,5752 Universal Health Realty
Income Trust 852,760 56,7512 New Senior Investment
Group Inc. 5,415,396 41,482
Community Healthcare
Trust Inc. 823,398 21,935
MedEquities Realty
Trust Inc. 21,942 240
6,042,576
Hotel & Resort REITs (6.4%) 2 Host Hotels & Resorts
Inc. 48,763,141 1,012,323
Financial Statements
Statement of Net AssetsAs of January 31, 2018
The fund reports a complete list of its holdings in regulatory filings four times in each fiscal year, at
the quarter-ends. For the second and fourth fiscal quarters, the lists appear in the fund’s semiannual
and annual reports to shareholders. For the first and third fiscal quarters, the fund files the lists with
the Securities and Exchange Commission on Form N-Q. Shareholders can look up the fund’s Forms
N-Q on the SEC’s website at sec.gov. Forms N-Q may also be reviewed and copied at the SEC’s
Public Reference Room (see the back cover of this report for further information).
REIT Index Fund
13

REIT Index Fund
Market
Value•
Shares ($000)
Market
Value•
Shares ($000)
2 Hospitality Properties
Trust 10,851,373 308,288
Park Hotels & Resorts
Inc. 10,619,284 307,0032 Apple Hospitality REIT
Inc. 13,967,455 272,2262 RLJ Lodging Trust 11,515,062 266,2282 Sunstone Hotel
Investors Inc. 14,856,672 250,3352 Ryman Hospitality
Properties Inc. 3,036,342 232,4322 LaSalle Hotel Properties 7,462,032 227,890^,2 Pebblebrook Hotel Trust 4,545,872 177,2892 Xenia Hotels & Resorts
Inc. 7,038,057 156,2452 DiamondRock
Hospitality Co. 13,203,576 155,274^,2 MGM Growth
Properties LLC Class A 4,559,294 127,9342 Chesapeake Lodging
Trust 3,965,417 108,5332 Summit Hotel
Properties Inc. 6,873,685 106,4732 Chatham Lodging Trust 2,991,303 67,0052 Hersha Hospitality Trust
Class A 2,758,524 51,1712 Ashford Hospitality
Trust Inc. 6,417,798 41,3312 Ashford Hospitality
Prime Inc. 1,683,590 15,186
3,883,166
Industrial REITs (7.0%) 2 Prologis Inc. 35,041,769 2,281,5692 Duke Realty Corp. 23,453,606 619,4102 DCT Industrial Trust Inc. 6,135,346 363,1512 First Industrial Realty
Trust Inc. 7,903,235 243,8942 EastGroup Properties
Inc. 2,261,807 196,3472 STAG Industrial Inc. 6,081,468 153,9832 Rexford Industrial
Realty Inc. 4,688,849 139,2122 Terreno Realty Corp. 3,452,267 122,9012 Monmouth Real Estate
Investment Corp. 4,414,865 75,450
4,195,917
Office REITs (11.8%) 2 Boston Properties Inc. 10,172,751 1,258,4712 Vornado Realty Trust 11,231,751 805,0922 Alexandria Real Estate
Equities Inc. 6,173,438 800,6952 SL Green Realty Corp. 6,520,718 655,4632 Kilroy Realty Corp. 6,480,664 462,2012 Douglas Emmett Inc. 10,195,625 394,265
2 Hudson Pacific
Properties Inc. 10,237,127 327,2812 Highwoods
Properties Inc. 6,808,734 326,0022 Cousins Properties Inc. 27,689,442 249,205*,2 Equity Commonwealth 8,179,351 244,6442 JBG SMITH Properties 6,234,285 210,4072 Brandywine Realty
Trust 11,561,642 207,4162 Paramount Group Inc. 13,361,147 200,8182 Piedmont Office
Realty Trust Inc.
Class A 9,591,447 187,2252 Corporate Office
Properties Trust 6,557,654 179,0242 Columbia Property
Trust Inc. 7,991,890 174,9422 Mack-Cali Realty Corp. 5,626,477 112,9232 Government Properties
Income Trust 6,341,924 108,8272 Franklin Street
Properties Corp. 6,709,340 68,0332 Tier REIT Inc. 3,156,761 61,2732 Easterly Government
Properties Inc. 2,570,960 53,5532 NorthStar Realty
Europe Corp. 3,461,673 41,298^,2 New York REIT Inc. 11,065,751 22,353
City Office REIT Inc. 36,182 423
7,151,834
Other (10.1%)4 5,6 Vanguard REIT II
Index Fund 319,564,620 6,126,412
Residential REITs (14.5%) 2 AvalonBay
Communities Inc. 9,099,460 1,550,5482 Equity Residential 24,219,826 1,492,1842 Essex Property
Trust Inc. 4,351,564 1,013,8272 Mid-America
Apartment
Communities Inc. 7,482,116 713,5702 UDR Inc. 17,632,878 644,1292 Camden Property Trust 6,110,328 528,9102 Equity LifeStyle
Properties Inc. 5,449,307 470,3842 Sun Communities Inc. 5,209,883 462,846
Invitation Homes Inc. 20,523,490 461,5732 Apartment Investment
& Management Co. 10,347,089 432,9222 American Campus
Communities Inc. 8,992,886 345,867
14

REIT Index Fund
Market
Value•
Shares ($000)
Market
Value•
Shares ($000)
American Homes 4
Rent Class A 15,403,655 320,2422 Education Realty
Trust Inc. 4,825,738 159,3942 Independence Realty
Trust Inc. 5,386,855 49,5052 Altisource Residential
Corp. 3,339,861 36,7722 Preferred Apartment
Communities Inc.
Class A 2,128,550 35,4832 NexPoint Residential
Trust Inc. 1,181,115 31,3112 UMH Properties Inc. 1,989,854 26,624
8,776,091
Retail REITs (17.0%) 2 Simon Property
Group Inc. 20,485,745 3,346,7562 Realty Income Corp. 18,085,210 961,952
GGP Inc. 40,692,368 937,1452 Regency Centers Corp. 10,090,461 634,7912 Federal Realty
Investment Trust 4,503,806 544,0602 Macerich Co. 7,923,454 511,6172 Kimco Realty Corp. 27,436,723 436,5182 National Retail
Properties Inc. 9,832,170 390,1402 Brixmor Property
Group Inc. 19,667,407 319,2022 Taubman Centers Inc. 4,000,760 246,6472 Weingarten Realty
Investors 8,047,603 237,8072 Retail Properties of
America Inc. 15,225,560 183,4682 Urban Edge Properties 7,499,839 175,3462 DDR Corp. 20,593,044 167,216^,2 Tanger Factory Outlet
Centers Inc. 6,257,741 157,5702 Acadia Realty Trust 5,512,826 135,3952 Retail Opportunity
Investments Corp. 6,708,521 123,2362 Kite Realty Group Trust 5,640,079 95,0922 Agree Realty Corp. 1,888,563 90,9152 Washington Prime
Group Inc. 12,249,276 80,6002 Ramco-Gershenson
Properties Trust 5,230,075 69,142^,2 Seritage Growth
Properties Class A 1,656,254 68,238^,2 CBL & Associates
Properties Inc. 11,279,589 62,7142 Getty Realty Corp. 2,210,497 58,003
Alexander’s Inc. 151,680 55,114^,2 Pennsylvania REIT 4,604,672 51,388
Saul Centers Inc. 863,796 47,276
Urstadt Biddle
Properties Inc. Class A 1,941,812 37,7102 Whitestone REIT 2,541,312 33,3932 Cedar Realty Trust Inc. 6,016,739 30,746
Urstadt Biddle
Properties Inc. 58,856 1,012
10,290,209
Specialized REITs (16.4%) 2 Equinix Inc. 5,139,614 2,339,5012 Public Storage 10,315,604 2,019,3832 Digital Realty Trust Inc. 13,523,503 1,513,9562 Extra Space Storage Inc. 8,305,266 693,3242 Iron Mountain Inc. 17,463,249 611,7382 Gaming and Leisure
Properties Inc. 11,769,370 428,8762 CyrusOne Inc. 5,719,883 329,9802 CubeSmart 11,879,087 327,0312 EPR Properties 4,857,523 286,8852 Life Storage Inc. 3,070,334 255,145
CoreSite Realty Corp. 2,258,499 244,6412 GEO Group Inc. 8,180,153 184,4622 CoreCivic Inc. 7,790,614 180,8202 QTS Realty Trust
Inc. Class A 3,208,137 159,7652 Four Corners
Property Trust Inc. 4,035,148 95,2302 National Storage
Affiliates Trust 3,250,784 82,472
American Tower Corp. 374,399 55,299
Crown Castle
International Corp. 281,799 31,778
Weyerhaeuser Co. 798,075 29,960
* SBA Communications
Corp. Class A 89,423 15,604
Lamar Advertising Co.
Class A 99,067 7,133
Rayonier Inc. 128,561 4,173
Uniti Group Inc. 205,774 3,257
Outfront Media Inc. 118,763 2,660
Potlatch Corp. 43,144 2,282
CatchMark Timber
Trust Inc. Class A 52,661 694
InfraREIT Inc. 18,868 358
Farmland Partners Inc. 37,658 307
9,906,714
Total Equity Real Estate
Investment Trusts (REITs)
(Cost $56,272,161) 60,306,310
15

16
REIT Index Fund
Market
Value•
Shares ($000)
Amount
($000)
Real Estate Management & Development (0.1%)
Diversified Real Estate Activities (0.0%)
* St. Joe Co. 36,173 680
* Tejon Ranch Co. 13,022 284
RMR Group Inc. Class A 3,774 245
* Five Point Holdings
LLC Class A 13,721 189
1,398
Real Estate Development (0.0%)
* Howard Hughes Corp. 46,590 5,868
* Forestar Group Inc. 7,566 185
6,053
Real Estate Operating Companies (0.0%)
Kennedy-Wilson
Holdings Inc. 119,900 2,128
* FRP Holdings Inc. 1,499 75
2,203
Real Estate Services (0.1%)
* CBRE Group Inc. Class A 339,140 15,495
Jones Lang LaSalle Inc. 33,811 5,287
Realogy Holdings Corp. 180,046 4,953
HFF Inc. Class A 32,816 1,615
RE/MAX Holdings Inc.
Class A 13,887 685
* Marcus & Millichap Inc. 13,511 441
* Altisource Portfolio
Solutions SA 12,757 357
28,833
Total Real Estate Management
& Development (Cost $38,412) 38,487
Temporary Cash Investment (0.3%)1
Money Market Fund (0.3%)7,8 Vanguard Market
Liquidity Fund, 1.545%
(Cost $164,289) 1,642,857 164,286
Total Investments (100.1%)
(Cost $56,474,862) 60,509,083
Other Assets and Liabilities (-0.1%)
Other Assets9 304,722
Liabilities8 (360,433)
(55,711)
Net Assets (100%) 60,453,372
Statement of Assets and Liabilities
Assets
Investments in Securities, at Value
Unaffiliated Issuers 3,167,045
Affiliated Issuers 51,215,626
Vanguard REIT II Index Fund 6,126,412
Total Investments in Securities 60,509,083
Investment in Vanguard 3,508
Receivables for Investment
Securities Sold 174,520
Receivables for Accrued Income 50,300
Receivables for Capital Shares Issued 69,121
Unrealized Appreciation—Swap Contracts 203
Other Assets9 7,070
Total Assets 60,813,805
Liabilities
Payables for Investment Securities
Purchased 191,834
Collateral for Securities on Loan 87,582
Payables for Capital Shares Redeemed 43,105
Payables to Vanguard 30,500
Unrealized Depreciation—Swap Contracts 262
Other Liabilities 7,150
Total Liabilities 360,433
Net Assets 60,453,372

REIT Index Fund
At January 31, 2018, net assets consisted of:
Amount
($000)
Amount
($000)
Paid-in Capital 56,315,907
Undistributed Net Investment Income 103,303
Accumulated Net Realized Gains —
Unrealized Appreciation (Depreciation)
Investment Securities 4,034,221
Swap Contracts (59)
Net Assets 60,453,372
Investor Shares—Net Assets
Applicable to 81,183,890 outstanding
$.001 par value shares of beneficial
interest (unlimited authorization) 2,143,108
Net Asset Value Per Share—
Investor Shares $26.40
ETF Shares—Net Assets
Applicable to 407,429,973 outstanding
$.001 par value shares of beneficial
interest (unlimited authorization) 32,377,223
Net Asset Value Per Share—ETF Shares $79.47
Admiral Shares—Net Assets
Applicable to 157,659,649 outstanding
$.001 par value shares of beneficial
interest (unlimited authorization) 17,756,674
Net Asset Value Per Share—
Admiral Shares $112.63
Institutional Shares—Net Assets
Applicable to 469,046,290 outstanding
$.001 par value shares of beneficial
interest (unlimited authorization) 8,176,367
Net Asset Value Per Share—
Institutional Shares $17.43
• See Note A in Notes to Financial Statements.
* Non-income-producing security.
^ Includes partial security positions on loan to broker-dealers. The total value of securities on loan is $85,635,000.
1 The fund invests a portion of its assets in Real Estate Investment Trusts through the use of swap contracts. After giving effect to swap investments, the fund’s effective Real Estate Investment Trust and temporary cash investment positions represent 100.0% and 0.1%, respectively, of net assets.
2 Considered an affiliated company of the fund as the fund owns more than 5% of the outstanding voting securities of such company.
3 Security value determined using significant unobservable inputs.
4 “Other” represents securities that are not classified by the fund’s benchmark index.
5 Considered an affiliated company of the fund as the issuer is another member of The Vanguard Group.
6 Represents a wholly owned subsidiary of the fund. See Notes to Financial Statements.
7 Affiliated money market fund available only to Vanguard funds and certain trusts and accounts managed by Vanguard. Rate shown is the 7-day yield.
8 Includes $87,582,000 of collateral received for securities on loan.
9 Cash of $7,070,000 has been segregated as collateral for open swap contracts.
REIT—Real Estate Investment Trust.
17
18
REIT Index Fund
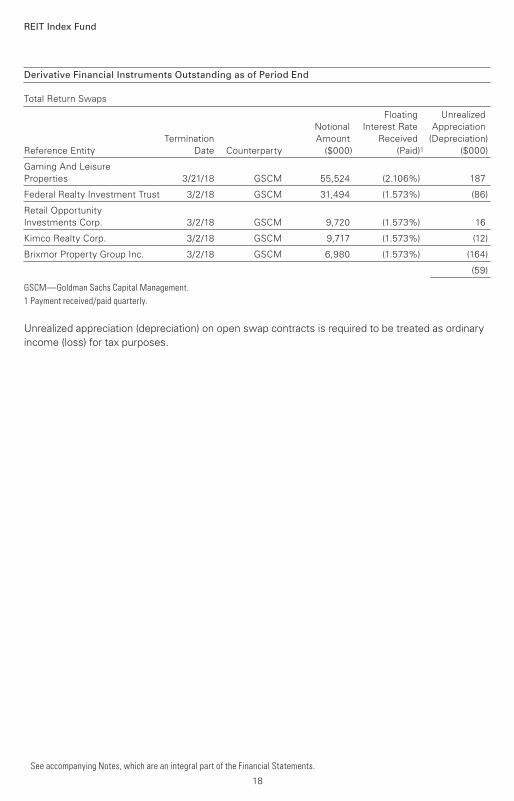
Derivative Financial Instruments Outstanding as of Period End
Total Return Swaps
Floating Unrealized
Notional Interest Rate Appreciation
Termination Amount Received (Depreciation)
Reference Entity Date Counterparty ($000) (Paid)1 ($000)
Gaming And Leisure
Properties 3/21/18 GSCM 55,524 (2.106%) 187
Federal Realty Investment Trust 3/2/18 GSCM 31,494 (1.573%) (86)
Retail Opportunity
Investments Corp. 3/2/18 GSCM 9,720 (1.573%) 16
Kimco Realty Corp. 3/2/18 GSCM 9,717 (1.573%) (12)
Brixmor Property Group Inc. 3/2/18 GSCM 6,980 (1.573%) (164)
(59)
GSCM—Goldman Sachs Capital Management.
1 Payment received/paid quarterly.
Unrealized appreciation (depreciation) on open swap contracts is required to be treated as ordinary
income (loss) for tax purposes.
See accompanying Notes, which are an integral part of the Financial Statements.

19
Year Ended January 31, 2018
($000)
Investment Income
Income
Dividends Received from Unaffiliated Issuers 26,396
Dividends Received from Affiliated Issuers 1,893,522
Dividends Received from Vanguard REIT II Index Fund 70,790
Interest 15
Securities Lending—Net 920
Total Income 1,991,643
Expenses
The Vanguard Group—Note B
Investment Advisory Services 4,269
Management and Administrative—Investor Shares 5,483
Management and Administrative—ETF Shares 31,453
Management and Administrative—Admiral Shares 18,790
Management and Administrative—Institutional Shares 7,123
Marketing and Distribution—Investor Shares 428
Marketing and Distribution—ETF Shares 1,958
Marketing and Distribution—Admiral Shares 1,457
Marketing and Distribution—Institutional Shares 207
Custodian Fees 616
Auditing Fees 42
Shareholders’ Reports and Proxy—Investor Shares 337
Shareholders’ Reports and Proxy—ETF Shares 5,396
Shareholders’ Reports and Proxy—Admiral Shares 857
Shareholders’ Reports and Proxy—Institutional Shares 270
Trustees’ Fees and Expenses 47
Total Expenses 78,733
Net Investment Income 1,912,910
Realized Net Gain (Loss)
Capital Gain Distributions Received from Unaffiliated Issuers 627
Capital Gain Distributions Received from Affiliated Issuers 345,564
Capital Gain Distributions Received from Vanguard REIT II Index Fund 9,589
Investment Securities Sold —Unaffiliated Issuers (15,044)
Investment Securities Sold—Affiliated Issuers 1,959,843
Investment Securities Sold—Vanguard REIT II Index Fund —
Futures Contracts 230
Swap Contracts (12,145)
Realized Net Gain (Loss) 2,288,664
Change in Unrealized Appreciation (Depreciation)
Investment Securities—Unaffiliated Issuers (79,043)
Investment Securities—Affiliated Issuers (3,542,133)
Investment Securities—Vanguard REIT II Index Fund (209,458)
Swap Contracts 810
Change in Unrealized Appreciation (Depreciation) (3,829,824)
Net Increase (Decrease) in Net Assets Resulting from Operations 371,750
Statement of Operations
REIT Index Fund
See accompanying Notes, which are an integral part of the Financial Statements.

Statement of Changes in Net Assets
REIT Index Fund
See accompanying Notes, which are an integral part of the Financial Statements.
Year Ended January 31,
2018 2017
($000) ($000)
Increase (Decrease) in Net Assets
Operations
Net Investment Income 1,912,910 1,637,151
Realized Net Gain (Loss) 2,288,664 2,373,668
Change in Unrealized Appreciation (Depreciation) (3,829,824) 2,177,388
Net Increase (Decrease) in Net Assets Resulting from Operations 371,750 6,188,207
Distributions
Net Investment Income
Investor Shares (69,040) (73,006)
ETF Shares (1,025,920) (913,086)
Admiral Shares (545,730) (491,479)
Institutional Shares (244,477) (213,737)
Realized Capital Gain
Investor Shares (983) (18,164)
ETF Shares (14,088) (218,412)
Admiral Shares (7,496) (117,607)
Institutional Shares (3,343) (50,930)
Return of Capital
Investor Shares (28,709) (33,133)
ETF Shares (426,390) (411,208)
Admiral Shares (226,815) (221,353)
Institutional Shares (101,603) (96,185)
Total Distributions (2,694,594) (2,858,300)
Capital Share Transactions
Investor Shares (383,660) (198,893)
ETF Shares 138,764 4,811,962
Admiral Shares 75,811 2,316,263
Institutional Shares 678,950 564,537
Net Increase (Decrease) from Capital Share Transactions 509,865 7,493,869
Total Increase (Decrease) (1,812,979) 10,823,776
Net Assets
Beginning of Period 62,266,351 51,442,575
End of Period1 60,453,372 62,266,351
1 Net Assets—End of Period includes undistributed (overdistributed) net investment income of $103,303,000 and $87,705,000.
20

Investor Shares
For a Share Outstanding Year Ended January 31,
Throughout Each Period 2018 2017 2016 2015 2014
Net Asset Value, Beginning of Period $27.38 $25.59 $28.73 $22.37 $22.66
Investment Operations
Net Investment Income .7611 .746 .711 .645 .579
Net Realized and Unrealized Gain (Loss)
on Investments (.614) 2.324 (2.851) 6.650 .025
Total from Investment Operations .147 3.070 (2.140) 7.295 .604
Distributions
Dividends from Net Investment Income (.788) (.752) (.695) (.624) (.626)
Distributions from Realized Capital Gains (.011) (.187) — — —
Return of Capital (.328) (.341) (.305) (.311) (.268)
Total Distributions (1.127) (1.280) (1.000) (.935) (.894)
Net Asset Value, End of Period $26.40 $27.38 $25.59 $28.73 $22.37
Total Return2 0.45% 12.07% -7.44% 33.29% 2.78%
Ratios/Supplemental Data
Net Assets, End of Period (Millions) $2,143 $2,603 $2,621 $3,231 $2,482
Ratio of Total Expenses to Average Net Assets 0.26% 0.26% 0.26% 0.26% 0.24%
Ratio of Net Investment Income to
Average Net Assets 2.87% 2.60% 2.66% 2.56% 2.51%
Portfolio Turnover Rate3 6% 7% 11% 8% 11%
1 Calculated based on average shares outstanding.
2 Total returns do not include transaction or account service fees that may have applied in the periods shown. Fund prospectuses provide information about any applicable transaction and account service fees.
3 Excludes the value of portfolio securities received or delivered as a result of in-kind purchases or redemptions of the fund’s capital shares, including ETF Creation Units.
Financial Highlights
See accompanying Notes, which are an integral part of the Financial Statements.
REIT Index Fund
21

Financial Highlights
See accompanying Notes, which are an integral part of the Financial Statements.
REIT Index Fund
ETF Shares
For a Share Outstanding Year Ended January 31,
Throughout Each Period 2018 2017 2016 2015 2014
Net Asset Value, Beginning of Period $82.43 $77.05 $86.49 $67.36 $68.24
Investment Operations
Net Investment Income 2.4991 2.334 2.217 2.011 1.814
Net Realized and Unrealized Gain (Loss)
on Investments (1.945) 7.022 (8.533) 20.038 .097
Total from Investment Operations .554 9.356 (6.316) 22.049 1.911
Distributions
Dividends from Net Investment Income (2.458) (2.353) (2.170) (1.947) (1.955)
Distributions from Realized Capital Gains (.034) (.563) — — —
Return of Capital (1.022) (1.060) (.954) (.972) (.836)
Total Distributions (3.514) (3.976) (3.124) (2.919) (2.791)
Net Asset Value, End of Period $79.47 $82.43 $77.05 $86.49 $67.36
Total Return 0.59% 12.25% -7.31% 33.41% 2.93%
Ratios/Supplemental Data
Net Assets, End of Period (Millions) $32,377 $33,527 $27,007 $29,487 $18,528
Ratio of Total Expenses to Average Net Assets 0.12% 0.12% 0.12% 0.12% 0.10%
Ratio of Net Investment Income to
Average Net Assets 3.01% 2.74% 2.80% 2.70% 2.65%
Portfolio Turnover Rate2 6% 7% 11% 8% 11%
1 Calculated based on average shares outstanding.
2 Excludes the value of portfolio securities received or delivered as a result of in-kind purchases or redemptions of the fund’s capital shares, including ETF Creation Units.
22

Admiral Shares
For a Share Outstanding Year Ended January 31,
Throughout Each Period 2018 2017 2016 2015 2014
Net Asset Value, Beginning of Period $116.83 $109.19 $122.58 $95.46 $96.70
Investment Operations
Net Investment Income 3.5381 3.306 3.142 2.852 2.569
Net Realized and Unrealized Gain (Loss)
on Investments (2.761) 9.966 (12.105) 28.403 .148
Total from Investment Operations .777 13.272 (8.963) 31.255 2.717
Distributions
Dividends from Net Investment Income (3.483) (3.333) (3.076) (2.758) (2.772)
Distributions from Realized Capital Gains (.048) (.798) — — —
Return of Capital (1.447) (1.501) (1.351) (1.377) (1.185)
Total Distributions (4.978) (5.632) (4.427) (4.135) (3.957)
Net Asset Value, End of Period $112.63 $116.83 $109.19 $122.58 $95.46
Total Return2 0.58% 12.23% -7.30% 33.46% 2.94%
Ratios/Supplemental Data
Net Assets, End of Period (Millions) $17,757 $18,337 $15,029 $15,725 $7,987
Ratio of Total Expenses to Average Net Assets 0.12% 0.12% 0.12% 0.12% 0.10%
Ratio of Net Investment Income to
Average Net Assets 3.01% 2.74% 2.80% 2.70% 2.65%
Portfolio Turnover Rate3 6% 7% 11% 8% 11%
1 Calculated based on average shares outstanding.
2 Total returns do not include transaction or account service fees that may have applied in the periods shown. Fund prospectuses provide information about any applicable transaction and account service fees.
3 Excludes the value of portfolio securities received or delivered as a result of in-kind purchases or redemptions of the fund’s capital shares, including ETF Creation Units.
Financial Highlights
See accompanying Notes, which are an integral part of the Financial Statements.
REIT Index Fund
23

Institutional Shares
For a Share Outstanding Year Ended January 31,
Throughout Each Period 2018 2017 2016 2015 2014
Net Asset Value, Beginning of Period $18.08 $16.90 $18.97 $14.78 $14.97
Investment Operations
Net Investment Income .5681 .515 .489 .444 .400
Net Realized and Unrealized Gain (Loss)
on Investments (.444) 1.540 (1.870) 4.390 .025
Total from Investment Operations .124 2.055 (1.381) 4.834 .425
Distributions
Dividends from Net Investment Income (.542) (.519) (.479) (.430) (.431)
Distributions from Realized Capital Gains (.007) (.123) — — —
Return of Capital (.225) (.233) (.210) (.214) (.184)
Total Distributions (.774) (.875) (.689) (.644) (.615)
Net Asset Value, End of Period $17.43 $18.08 $16.90 $18.97 $14.78
Total Return2 0.60% 12.23% -7.27% 33.43% 2.97%
Ratios/Supplemental Data
Net Assets, End of Period (Millions) $8,176 $7,799 $6,785 $6,788 $3,922
Ratio of Total Expenses to Average Net Assets 0.10% 0.10% 0.10% 0.10% 0.08%
Ratio of Net Investment Income to
Average Net Assets 3.03% 2.76% 2.82% 2.72% 2.67%
Portfolio Turnover Rate3 6% 7% 11% 8% 11%
1 Calculated based on average shares outstanding.
2 Total returns do not include transaction fees that may have applied in the periods shown. Fund prospectuses provide information about any applicable transaction fees.
3 Excludes the value of portfolio securities received or delivered as a result of in-kind purchases or redemptions of the fund’s capital shares, including ETF Creation Units.
Financial Highlights
See accompanying Notes, which are an integral part of the Financial Statements.
REIT Index Fund
24

25
Notes to Financial Statements
REIT Index Fund
Vanguard REIT Index Fund is registered under the Investment Company Act of 1940 as an open-end
investment company, or mutual fund. The fund offers four classes of shares: Investor Shares, ETF
Shares, Admiral Shares, and Institutional Shares. Investor Shares are available to any investor who
meets the fund’s minimum purchase requirements. ETF Shares are listed for trading on NYSE Arca;
they can be purchased and sold through a broker. Admiral Shares and Institutional Shares are
designed for investors who meet certain administrative, service, and account-size criteria.
As a part of its principal investment strategy, the fund attempts to replicate its benchmark index by
investing all, or substantially all, of its assets—either directly or indirectly through a wholly owned
subsidiary—in the stocks that make up the index. Vanguard REIT II Index Fund (“REIT II”) is the
wholly owned subsidiary in which the fund has invested a portion of its assets. For additional
financial information about REIT II, refer to the accompanying financial statements.
A. The following significant accounting policies conform to generally accepted accounting principles
for U.S. investment companies. The fund consistently follows such policies in preparing its financial
statements.
1. Security Valuation: Securities are valued as of the close of trading on the New York Stock
Exchange (generally 4 p.m., Eastern time) on the valuation date. Equity securities are valued at
the latest quoted sales prices or official closing prices taken from the primary market in which each
security trades; such securities not traded on the valuation date are valued at the mean of the latest
quoted bid and asked prices. Securities for which market quotations are not readily available, or
whose values have been materially affected by events occurring before the fund’s pricing time but
after the close of the securities’ primary markets, are valued by methods deemed by the board of
trustees to represent fair value. Investments in affiliated Vanguard funds are valued at that fund’s
net asset value. Temporary cash investments are valued using the latest bid prices or using
valuations based on a matrix system (which considers such factors as security prices, yields,
maturities, and ratings), both as furnished by independent pricing services.
2. Futures Contracts: The fund uses index futures contracts to a limited extent, with the objectives
of maintaining full exposure to the stock market, maintaining liquidity, and minimizing transaction
costs. The fund may purchase futures contracts to immediately invest incoming cash in the market,
or sell futures in response to cash outflows, thereby simulating a fully invested position in the
underlying index while maintaining a cash balance for liquidity. The primary risks associated with the
use of futures contracts are imperfect correlation between changes in market values of stocks held
by the fund and the prices of futures contracts, and the possibility of an illiquid market. Counterparty
risk involving futures is mitigated because a regulated clearinghouse is the counterparty instead of
the clearing broker. To further mitigate counterparty risk, the fund trades futures contracts on an
exchange, monitors the financial strength of its clearing brokers and clearinghouse, and has entered
into clearing agreements with its clearing brokers. The clearinghouse imposes initial margin
requirements to secure the fund’s performance and requires daily settlement of variation margin
representing changes in the market value of each contract.
Futures contracts are valued at their quoted daily settlement prices. The aggregate settlement
values of the contracts are not recorded in the Statement of Assets and Liabilities. Fluctuations in
the value of the contracts are recorded in the Statement of Assets and Liabilities as an asset (liability)
and in the Statement of Operations as unrealized appreciation (depreciation) until the contracts are
closed, when they are recorded as realized futures gains (losses).

REIT Index Fund
During the year ended January 31, 2018, the fund’s average investments in long and short futures
contracts represented less than 1% and 0% of net assets, respectively, based on the average of
aggregate settlement values at each quarter-end during the period. The fund had no open futures
contracts at January 31, 2018.
3. Swap Contracts: The fund has entered into equity swap contracts to earn the total return on
selected reference stocks in the fund’s target index. Under the terms of the swaps, the fund
receives the total return on the referenced stock (i.e., receiving the increase or paying the decrease
in value of the selected reference stock and receiving the equivalent of any dividends in respect of
the selected referenced stock) over a specified period of time, applied to a notional amount that
represents the value of a designated number of shares of the selected reference stock at the
beginning of the equity swap contract. The fund also pays a floating rate that is based on short-term
interest rates, applied to the notional amount. At the same time, the fund invests an amount
approximating the notional amount of the swap in high-quality temporary cash investments.
The notional amounts of swap contracts are not recorded in the Statement of Assets and Liabilities.
Swaps are valued daily based on market quotations received from independent pricing services or
recognized dealers and the change in value is recorded in the Statement of Assets and Liabilities as
an asset (liability) and in the Statement of Operations as unrealized appreciation (depreciation) until
termination of the swap, at which time realized gain (loss) is recorded. A risk associated with all
types of swaps is the possibility that a counterparty may default on its obligation to pay net amounts
due to the fund. The fund’s maximum amount subject to counterparty risk is the unrealized
appreciation on the swap contract. The fund mitigates its counterparty risk by entering into swaps
only with a diverse group of prequalified counterparties, monitoring their financial strength, entering
into master netting arrangements with its counterparties, and requiring its counterparties to transfer
collateral as security for their performance. In the absence of a default, the collateral pledged or
received by the fund cannot be repledged, resold, or rehypothecated. In the event of a
counterparty’s default (including bankruptcy), the fund may terminate any swap contracts with that
counterparty, determine the net amount owed by either party in accordance with its master netting
arrangements, and sell or retain any collateral held up to the net amount owed to the fund under the
master netting arrangements. The swap contracts contain provisions whereby a counterparty may
terminate open contracts if the fund net assets decline below a certain level, triggering a payment by
the fund if the fund is in a net liability position at the time of the termination. The payment amount
would be reduced by any collateral the fund has pledged. Any securities pledged as collateral for
open contracts are noted in the Statement of Assets and Liabilities. The value of collateral received
or pledged is compared daily to the value of the swap contracts exposure with each counterparty,
and any difference, if in excess of a specified minimum transfer amount, is adjusted and settled
within two business days.
During the year ended January 31, 2018, the fund’s average amounts of investments in total return
swaps represented less than 1% of net assets, based on the average of notional amounts at each
quarter-end during the period.
4. Federal Income Taxes: The fund intends to continue to qualify as a regulated investment company
and distribute all of its taxable income. Management has analyzed the fund’s tax positions taken for
all open federal income tax years (January 31, 2015–2018), and has concluded that no provision for
federal income tax is required in the fund’s financial statements.
26

27
REIT Index Fund
5. Distributions: Distributions to shareholders are recorded on the ex-dividend date. The portion of
distributions that exceeds a fund’s current and accumulated earnings and profits, as measured on a
tax basis, constitute a non-taxable return of capital.
6. Securities Lending: To earn additional income, the fund lends its securities to qualified institutional
borrowers. Security loans are subject to termination by the fund at any time, and are required to be
secured at all times by collateral in an amount at least equal to the market value of securities loaned.
Daily market fluctuations could cause the value of loaned securities to be more or less than the value
of the collateral received. When this occurs, the collateral is adjusted and settled on the next
business day. The fund further mitigates its counterparty risk by entering into securities lending
transactions only with a diverse group of prequalified counterparties, monitoring their financial
strength, and entering into master securities lending agreements with its counterparties. The master
securities lending agreements provide that, in the event of a counterparty’s default (including
bankruptcy), the fund may terminate any loans with that borrower, determine the net amount owed,
and sell or retain the collateral up to the net amount owed to the fund; however, such actions may
be subject to legal proceedings. While collateral mitigates counterparty risk, in the event of a default,
the fund may experience delays and costs in recovering the securities loaned. The fund invests cash
collateral received in Vanguard Market Liquidity Fund, and records a liability in the Statement of
Assets and Liabilities for the return of the collateral, during the period the securities are on loan.
Securities lending income represents fees charged to borrowers plus income earned on invested
cash collateral, less expenses associated with the loan. During the term of the loan, the fund is
entitled to all distributions made on or in respect of the loaned securities.
7. Credit Facility: The fund and certain other funds managed by The Vanguard Group (“Vanguard”)
participate in a $3.1 billion committed credit facility provided by a syndicate of lenders pursuant to
a credit agreement that may be renewed annually; each fund is individually liable for its borrowings,
if any, under the credit facility. Borrowings may be utilized for temporary and emergency purposes,
and are subject to the fund’s regulatory and contractual borrowing restrictions. The participating
funds are charged administrative fees and an annual commitment fee of 0.10% of the undrawn
amount of the facility; these fees are allocated to the funds based on a method approved by the
fund’s board of trustees and included in Management and Administrative expenses on the fund’s
Statement of Operations. Any borrowings under this facility bear interest at a rate based upon the
higher of the one-month London Interbank Offered Rate, federal funds effective rate, or overnight
bank funding rate plus an agreed-upon spread.
The fund had no borrowings outstanding at January 31, 2018, or at any time during the period
then ended.
8. Other: Distributions received from REITs are recorded on the ex-dividend date. Each REIT
reports annually the tax character of its distributions. Dividend income, capital gain distributions
received, and unrealized appreciation (depreciation) reflect the amounts of taxable income, capital
gain, and return of capital reported by the REITs, and management’s estimates of such amounts
for REIT distributions for which actual information has not been reported. Income, capital gain,
and return of capital distributions received from affiliated Vanguard funds are recorded on
ex-dividend date. Premiums and discounts on debt securities purchased are amortized and
accreted, respectively, to interest income over the lives of the respective securities. Security
transactions are accounted for on the date securities are bought or sold. Costs used to determine
realized gains (losses) on the sale of investment securities are those of the specific securities sold.
Fees assessed on redemptions of capital shares are credited to paid-in capital.

REIT Index Fund
Each class of shares has equal rights as to assets and earnings, except that each class separately
bears certain class-specific expenses related to maintenance of shareholder accounts (included in
Management and Administrative expenses), shareholder reporting, and the proxy. Marketing and
distribution expenses are allocated to each class of shares based on a method approved by the
board of trustees. Income, other non-class-specific expenses, and gains and losses on investments
are allocated to each class of shares based on its relative net assets.
B. In accordance with the terms of a Funds’ Service Agreement (the “FSA”) between Vanguard
and the fund, Vanguard furnishes to the fund investment advisory, corporate management,
administrative, marketing, and distribution services at Vanguard’s cost of operations (as defined
by the FSA). These costs of operations are allocated to the fund based on methods and guidelines
approved by the board of trustees. Vanguard does not require reimbursement in the current period
for certain costs of operations (such as deferred compensation/benefits and risk/insurance costs);
the fund’s liability for these costs of operations is included in Payables to Vanguard on the Statement
of Assets and Liabilities.
Upon the request of Vanguard, the fund may invest up to 0.40% of its net assets as capital in
Vanguard. At January 31, 2018, the fund had contributed to Vanguard capital in the amount of
$3,508,000, representing 0.01% of the fund’s net assets and 1.40% of Vanguard’s capitalization.
The fund’s trustees and officers are also directors and employees, respectively, of Vanguard.
C. Various inputs may be used to determine the value of the fund’s investments. These inputs are
summarized in three broad levels for financial statement purposes. The inputs or methodologies
used to value securities are not necessarily an indication of the risk associated with investing in
those securities.
Level 1—Quoted prices in active markets for identical securities.
Level 2—Other significant observable inputs (including quoted prices for similar securities, interest
rates, prepayment speeds, credit risk, etc.).
Level 3—Significant unobservable inputs (including the fund’s own assumptions used to determine
the fair value of investments). Any investments valued with significant unobservable inputs are
noted on the Statement of Net Assets.
The following table summarizes the market value of the fund’s investments as of January 31, 2018,
based on the inputs used to value them:
Level 1 Level 2 Level 3
Investments ($000) ($000) ($000)
Common Stocks 60,332,123 — 12,674
Temporary Cash Investments 164,286 — —
Swap Contracts—Assets — 203 —
Swap Contracts—Liabilities — (262) —
Total 60,496,409 (59) 12,674
D. Distributions are determined on a tax basis and may differ from net investment income and
realized capital gains for financial reporting purposes. Differences may be permanent or temporary.
Permanent differences are reclassified among capital accounts in the financial statements to reflect
their tax character. Temporary differences arise when certain items of income, expense, gain, or
28

REIT Index Fund
loss are recognized in different periods for financial statement and tax purposes. These differences
will reverse at some time in the future. Differences in classification may also result from the
treatment of short-term gains as ordinary income for tax purposes.
During the year ended January 31, 2018, the fund realized $2,274,899,000 of net capital gains
resulting from in-kind redemptions—in which shareholders exchanged fund shares for securities
held by the fund rather than for cash. Because such gains are not taxable to the fund, and are not
distributed to shareholders, they have been reclassified from accumulated net realized gains to
paid-in capital.
At January 31, 2018, the cost of investment securities for tax purposes was $56,474,862,000. Net
unrealized appreciation of investment securities for tax purposes was $4,034,221,000, consisting
of unrealized gains of $7,363,984,000 on securities that had risen in value since their purchase and
$3,329,763,000 in unrealized losses on securities that had fallen in value since their purchase.
E. During the year ended January 31, 2018, the fund purchased $17,565,462,000 of investment
securities and sold $17,239,938,000 of investment securities, other than temporary cash
investments. Purchases and sales include $11,723,571,000 and $13,354,982,000, respectively,
in connection with in-kind purchases and redemptions of the fund’s capital shares.
F. Capital share transactions for each class of shares were:
Year Ended January 31,
2018 2017
Amount Shares Amount Shares
($000) (000) ($000) (000)
Investor Shares
Issued 362,805 13,160 565,677 20,200
Issued in Lieu of Cash Distributions 92,491 3,378 117,019 4,262
Redeemed (838,956) (30,421) (881,589) (31,830)
Net Increase (Decrease)—Investor Shares (383,660) (13,883) (198,893) (7,368)
ETF Shares
Issued 7,194,688 86,125 9,698,505 115,071
Issued in Lieu of Cash Distributions — — — —
Redeemed (7,055,924) (85,400) (4,886,543) (58,900)
Net Increase (Decrease)—ETF Shares 138,764 725 4,811,962 56,171
Admiral Shares
Issued 3,635,103 30,947 4,651,310 39,078
Issued in Lieu of Cash Distributions 685,946 5,875 737,270 6,295
Redeemed (4,245,238) (36,118) (3,072,317) (26,057)
Net Increase (Decrease)—Admiral Shares 75,811 704 2,316,263 19,316
Institutional Shares
Issued 2,396,349 131,716 1,775,348 96,049
Issued in Lieu of Cash Distributions 324,780 17,972 334,740 18,463
Redeemed (2,042,179) (111,955) (1,545,551) (84,706)
Net Increase (Decrease)—Institutional Shares 678,950 37,733 564,537 29,806
29

30
REIT Index Fund
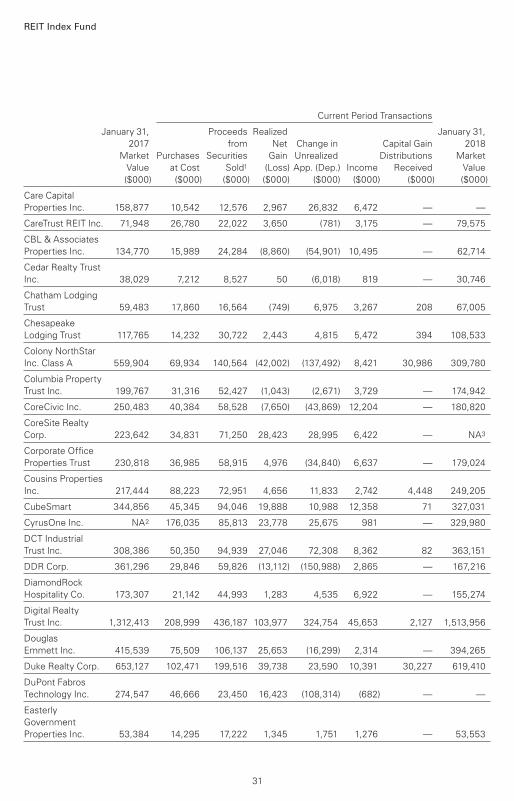
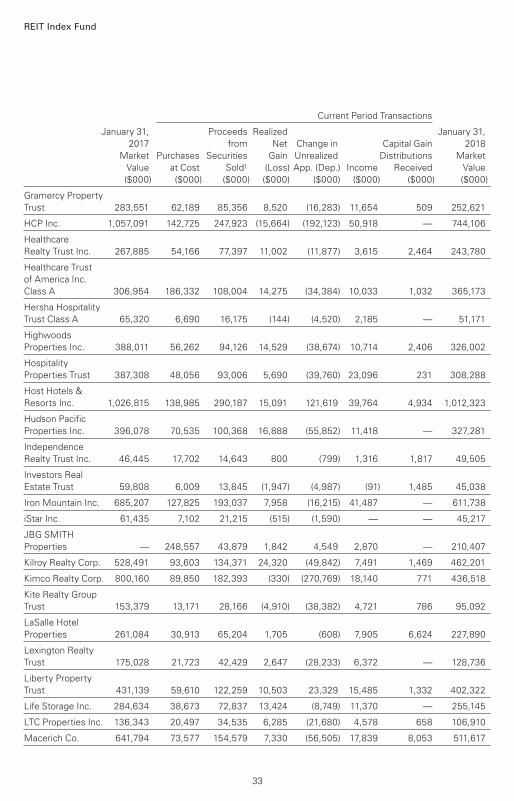
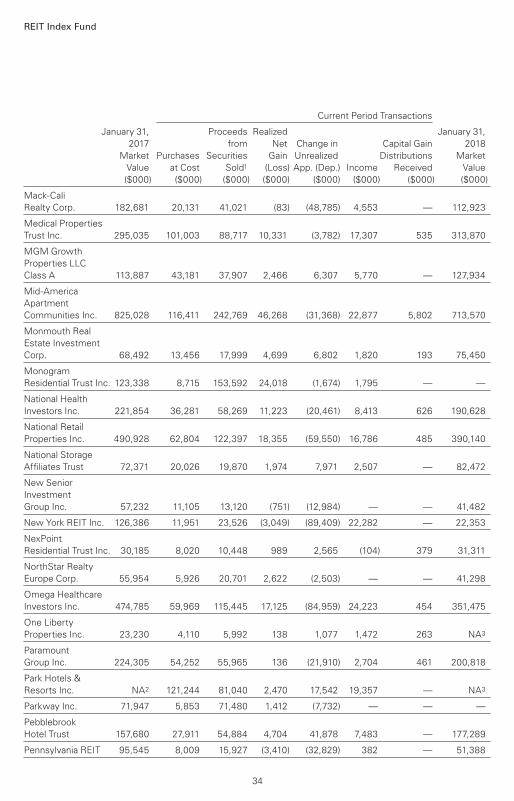
G. Certain of the fund’s investments are in companies that are considered to be affiliated
companies of the fund because the fund owns more than 5% of the outstanding voting securities
of the company or the issuer is another member of The Vanguard Group. Transactions during the
period in securities of these companies were as follows:
Current Period Transactions
January 31, Proceeds Realized January 31,
2017 from Net Change in Capital Gain 2018
Market Purchases Securities Gain Unrealized Distributions Market
Value at Cost Sold1 (Loss) App. (Dep.) Income Received Value
($000) ($000) ($000) ($000) ($000) ($000) ($000) ($000)
Acadia Realty Trust 196,914 28,683 48,242 1,587 (43,547) 4,865 1,382 135,395
Agree Realty Corp. 93,077 20,640 25,664 4,360 (1,498) 3,371 — 90,915
Alexander & Baldwin
Inc. NA2 201,333 25,838 (10) (55,179) 13,447 — 120,082
Alexandria Real
Estate Equities Inc. 661,333 221,376 197,697 37,183 78,500 13,750 2,233 800,695
Altisource
Residential Corp. — 57,067 9,713 (1,311) (9,271) 512 — 36,772
American Assets
Trust Inc. 111,900 14,275 25,124 5,288 (24,180) 2,699 — NA3
American Campus
Communities Inc. 485,474 69,659 112,815 12,718 (109,169) 8,131 — 345,867
American Homes
4 Rent Class A 364,865 77,842 97,853 11,667 (36,279) 1,744 — NA3
Apartment
Investment &
Management Co. 526,976 68,330 138,950 21,720 (45,154) 8,895 7,834 432,922
Apple Hospitality
REIT Inc. 254,259 105,187 78,219 (541) (8,460) 17,170 — 272,226
Armada Hoffler
Properties Inc. 35,538 16,260 11,388 295 2,011 2,373 — 42,716
Ashford Hospitality
Prime Inc. 23,972 6,547 6,863 (1,229) (7,241) 524 180 15,186
Ashford Hospitality
Trust Inc. 56,353 5,923 12,353 1,788 (10,380) (82) — 41,331
AvalonBay
Communities Inc. 1,821,329 257,391 510,044 65,333 (83,461) 41,813 13,938 1,550,548
Boston Properties
Inc. 1,539,727 198,158 394,758 40,443 (125,099) 32,906 549 1,258,471
Brandywine
Realty Trust 215,857 28,404 60,499 6,413 17,241 4,943 3,310 207,416
Brixmor Property
Group Inc. 561,990 56,348 125,897 (20,157) (152,963) 19,381 — 319,202
Camden Property
Trust 559,077 108,646 161,111 23,643 (1,345) 15,285 3,979 528,910
31
REIT Index Fund
Current Period Transactions
January 31, Proceeds Realized January 31,
2017 from Net Change in Capital Gain 2018
Market Purchases Securities Gain Unrealized Distributions Market
Value at Cost Sold1 (Loss) App. (Dep.) Income Received Value
($000) ($000) ($000) ($000) ($000) ($000) ($000) ($000)
Care Capital
Properties Inc. 158,877 10,542 12,576 2,967 26,832 6,472 — —
CareTrust REIT Inc. 71,948 26,780 22,022 3,650 (781) 3,175 — 79,575
CBL & Associates
Properties Inc. 134,770 15,989 24,284 (8,860) (54,901) 10,495 — 62,714
Cedar Realty Trust
Inc. 38,029 7,212 8,527 50 (6,018) 819 — 30,746
Chatham Lodging
Trust 59,483 17,860 16,564 (749) 6,975 3,267 208 67,005
Chesapeake
Lodging Trust 117,765 14,232 30,722 2,443 4,815 5,472 394 108,533
Colony NorthStar
Inc. Class A 559,904 69,934 140,564 (42,002) (137,492) 8,421 30,986 309,780
Columbia Property
Trust Inc. 199,767 31,316 52,427 (1,043) (2,671) 3,729 — 174,942
CoreCivic Inc. 250,483 40,384 58,528 (7,650) (43,869) 12,204 — 180,820
CoreSite Realty
Corp. 223,642 34,831 71,250 28,423 28,995 6,422 — NA3
Corporate Office
Properties Trust 230,818 36,985 58,915 4,976 (34,840) 6,637 — 179,024
Cousins Properties
Inc. 217,444 88,223 72,951 4,656 11,833 2,742 4,448 249,205
CubeSmart 344,856 45,345 94,046 19,888 10,988 12,358 71 327,031
CyrusOne Inc. NA2 176,035 85,813 23,778 25,675 981 — 329,980
DCT Industrial
Trust Inc. 308,386 50,350 94,939 27,046 72,308 8,362 82 363,151
DDR Corp. 361,296 29,846 59,826 (13,112) (150,988) 2,865 — 167,216
DiamondRock
Hospitality Co. 173,307 21,142 44,993 1,283 4,535 6,922 — 155,274
Digital Realty
Trust Inc. 1,312,413 208,999 436,187 103,977 324,754 45,653 2,127 1,513,956
Douglas
Emmett Inc. 415,539 75,509 106,137 25,653 (16,299) 2,314 — 394,265
Duke Realty Corp. 653,127 102,471 199,516 39,738 23,590 10,391 30,227 619,410
DuPont Fabros
Technology Inc. 274,547 46,666 23,450 16,423 (108,314) (682) — —
Easterly
Government
Properties Inc. 53,384 14,295 17,222 1,345 1,751 1,276 — 53,553

32
REIT Index Fund
Current Period Transactions
January 31, Proceeds Realized January 31,
2017 from Net Change in Capital Gain 2018
Market Purchases Securities Gain Unrealized Distributions Market
Value at Cost Sold1 (Loss) App. (Dep.) Income Received Value
($000) ($000) ($000) ($000) ($000) ($000) ($000) ($000)
EastGroup
Properties Inc. 178,153 30,262 52,408 13,138 27,202 6,156 4 196,347
Education Realty
Trust Inc. 224,847 26,208 54,153 5,614 (43,122) 5,053 — 159,394
EPR Properties 360,230 95,698 96,041 13,532 (86,534) 17,502 1,171 286,885
Equinix Inc. 2,094,111 494,513 652,096 121,787 281,186 44,821 — 2,339,501
Equity
Commonwealth 281,565 43,756 72,304 6,515 (14,888) — — 244,644
Equity LifeStyle
Properties Inc. 458,547 71,495 135,905 40,121 36,126 7,184 4,241 470,384
Equity Residential 1,700,169 241,536 486,952 48,329 (10,898) 46,264 8,028 1,492,184
Essex Property
Trust Inc. 1,124,304 164,205 330,384 66,713 (11,011) 27,528 5,253 1,013,827
Extra Space
Storage Inc. 693,628 100,359 206,007 60,821 44,523 28,863 25 693,324
Federal Realty
Investment Trust 767,656 94,894 218,343 21,639 (121,786) 19,955 — 544,060
FelCor Lodging
Trust Inc. 74,919 6,061 77,231 (1,232) (2,517) (603) — —
First Industrial
Realty Trust Inc. 231,273 36,708 68,055 17,763 26,205 5,142 1,916 243,894
First Potomac
Realty Trust 45,915 3,471 4,484 5 (44,907) 894 — —
Forest City Realty
Trust Inc. Class A NA2 62,712 166,364 12,014 3,207 685 6,572 330,139
Four Corners
Property Trust Inc. 95,138 18,960 26,891 4,388 3,635 3,646 — 95,230
Franklin Street
Properties Corp. 98,735 9,909 20,619 (1,397) (18,595) 1,641 — 68,033
Gaming and Leisure
Properties Inc. 451,949 49,441 143,247 5,772 64,961 30,877 499 428,876
GEO Group Inc. 238,351 53,748 62,543 6,100 (51,194) 9,425 — 184,462
Getty Realty Corp. 53,660 17,451 15,834 2,608 118 2,581 — 58,003
GGP Inc. NA2 202,377 270,444 24,203 (112,262) 38,272 — NA3
Gladstone
Commercial Corp. 35,673 9,954 9,684 1,003 (2,266) 1,090 — 34,680
Global Net
Lease Inc. 100,412 28,797 25,196 (1,187) (16,328) 8,013 — 81,413
Government
Properties Income
Trust 105,148 49,947 34,080 668 (12,856) 6,030 — 108,827
33
REIT Index Fund
Current Period Transactions
January 31, Proceeds Realized January 31,
2017 from Net Change in Capital Gain 2018
Market Purchases Securities Gain Unrealized Distributions Market
Value at Cost Sold1 (Loss) App. (Dep.) Income Received Value
($000) ($000) ($000) ($000) ($000) ($000) ($000) ($000)
Gramercy Property
Trust 283,551 62,189 85,356 8,520 (16,283) 11,654 509 252,621
HCP Inc. 1,057,091 142,725 247,923 (15,664) (192,123) 50,918 — 744,106
Healthcare
Realty Trust Inc. 267,885 54,166 77,397 11,002 (11,877) 3,615 2,464 243,780
Healthcare Trust
of America Inc.
Class A 306,954 186,332 108,004 14,275 (34,384) 10,033 1,032 365,173
Hersha Hospitality
Trust Class A 65,320 6,690 16,175 (144) (4,520) 2,185 — 51,171
Highwoods
Properties Inc. 388,011 56,262 94,126 14,529 (38,674) 10,714 2,406 326,002
Hospitality
Properties Trust 387,308 48,056 93,006 5,690 (39,760) 23,096 231 308,288
Host Hotels &
Resorts Inc. 1,026,815 138,985 290,187 15,091 121,619 39,764 4,934 1,012,323
Hudson Pacific
Properties Inc. 396,078 70,535 100,368 16,888 (55,852) 11,418 — 327,281
Independence
Realty Trust Inc. 46,445 17,702 14,643 800 (799) 1,316 1,817 49,505
Investors Real
Estate Trust 59,808 6,009 13,845 (1,947) (4,987) (91) 1,485 45,038
Iron Mountain Inc. 685,207 127,825 193,037 7,958 (16,215) 41,487 — 611,738
iStar Inc. 61,435 7,102 21,215 (515) (1,590) — — 45,217
JBG SMITH
Properties — 248,557 43,879 1,842 4,549 2,870 — 210,407
Kilroy Realty Corp. 528,491 93,603 134,371 24,320 (49,842) 7,491 1,469 462,201
Kimco Realty Corp. 800,160 89,850 182,393 (330) (270,769) 18,140 771 436,518
Kite Realty Group
Trust 153,379 13,171 28,166 (4,910) (38,382) 4,721 786 95,092
LaSalle Hotel
Properties 261,084 30,913 65,204 1,705 (608) 7,905 6,624 227,890
Lexington Realty
Trust 175,028 21,723 42,429 2,647 (28,233) 6,372 — 128,736
Liberty Property
Trust 431,139 59,610 122,259 10,503 23,329 15,485 1,332 402,322
Life Storage Inc. 284,634 38,673 72,837 13,424 (8,749) 11,370 — 255,145
LTC Properties Inc. 136,343 20,497 34,535 6,285 (21,680) 4,578 658 106,910
Macerich Co. 641,794 73,577 154,579 7,330 (56,505) 17,839 8,053 511,617
REIT Index Fund
Current Period Transactions
January 31, Proceeds Realized January 31,
2017 from Net Change in Capital Gain 2018
Market Purchases Securities Gain Unrealized Distributions Market
Value at Cost Sold1 (Loss) App. (Dep.) Income Received Value
($000) ($000) ($000) ($000) ($000) ($000) ($000) ($000)
Mack-Cali
Realty Corp. 182,681 20,131 41,021 (83) (48,785) 4,553 — 112,923
Medical Properties
Trust Inc. 295,035 101,003 88,717 10,331 (3,782) 17,307 535 313,870
MGM Growth
Properties LLC
Class A 113,887 43,181 37,907 2,466 6,307 5,770 — 127,934
Mid-America
Apartment
Communities Inc. 825,028 116,411 242,769 46,268 (31,368) 22,877 5,802 713,570
Monmouth Real
Estate Investment
Corp. 68,492 13,456 17,999 4,699 6,802 1,820 193 75,450
Monogram
Residential Trust Inc. 123,338 8,715 153,592 24,018 (1,674) 1,795 — —
National Health
Investors Inc. 221,854 36,281 58,269 11,223 (20,461) 8,413 626 190,628
National Retail
Properties Inc. 490,928 62,804 122,397 18,355 (59,550) 16,786 485 390,140
National Storage
Affiliates Trust 72,371 20,026 19,870 1,974 7,971 2,507 — 82,472
New Senior
Investment
Group Inc. 57,232 11,105 13,120 (751) (12,984) — — 41,482
New York REIT Inc. 126,386 11,951 23,526 (3,049) (89,409) 22,282 — 22,353
NexPoint
Residential Trust Inc. 30,185 8,020 10,448 989 2,565 (104) 379 31,311
NorthStar Realty
Europe Corp. 55,954 5,926 20,701 2,622 (2,503) — — 41,298
Omega Healthcare
Investors Inc. 474,785 59,969 115,445 17,125 (84,959) 24,223 454 351,475
One Liberty
Properties Inc. 23,230 4,110 5,992 138 1,077 1,472 263 NA3
Paramount
Group Inc. 224,305 54,252 55,965 136 (21,910) 2,704 461 200,818
Park Hotels &
Resorts Inc. NA2 121,244 81,040 2,470 17,542 19,357 — NA3
Parkway Inc. 71,947 5,853 71,480 1,412 (7,732) — — —
Pebblebrook
Hotel Trust 157,680 27,911 54,884 4,704 41,878 7,483 — 177,289
Pennsylvania REIT 95,545 8,009 15,927 (3,410) (32,829) 382 — 51,388
34

35
REIT Index Fund
Current Period Transactions
January 31, Proceeds Realized January 31,
2017 from Net Change in Capital Gain 2018
Market Purchases Securities Gain Unrealized Distributions Market
Value at Cost Sold1 (Loss) App. (Dep.) Income Received Value
($000) ($000) ($000) ($000) ($000) ($000) ($000) ($000)
Physicians
Realty Trust 191,090 90,447 59,565 6,277 (37,449) 5,545 — 190,800
Piedmont Office
Realty Trust Inc.
Class A 241,417 28,305 59,193 2,132 (25,436) 6,685 7,272 187,225
Preferred
Apartment
Communities Inc.
Class A — 47,932 2,452 (259) (9,738) — — 35,483
Prologis Inc. 1,970,078 318,476 650,735 126,565 517,185 48,312 20,269 2,281,569
PS Business
Parks Inc. 174,220 24,745 52,004 13,881 3,578 4,906 197 NA3
Public Storage 2,425,257 442,710 645,270 143,225 (346,539) 90,498 149 2,019,383
QTS Realty Trust
Inc. Class A 184,034 25,906 48,332 8,649 (10,492) 2,679 — 159,765
Quality Care
Properties Inc. 132,027 14,400 29,121 826 (34,607) — — 83,525
RAIT Financial Trust 24,668 1,333 5,546 (41,874) 21,419 (638) 8 —
Ramco-
Gershenson
Properties Trust 98,801 9,517 20,644 (1,297) (17,235) 4,932 206 69,142
Realty Income
Corp. 1,180,027 200,881 298,933 46,545 (166,568) 37,406 752 961,952
Regency Centers
Corp. 557,628 123,899 194,259 25,624 121,899 18,833 2,190 634,791
Retail Opportunity
Investments Corp. 176,709 20,566 53,416 6,764 (27,387) 4,611 — 123,236
Retail Properties
of America Inc. 271,987 29,648 68,019 (3,427) (46,721) 10,864 597 183,468
Rexford Industrial
Realty Inc. 114,769 25,711 35,363 8,548 25,547 2,687 — 139,212
RLJ Lodging Trust 220,888 106,276 69,021 6,294 1,791 10,833 — 266,228
Ryman Hospitality
Properties Inc. 215,012 28,209 58,728 8,551 39,388 9,921 99 232,432
Sabra Health
Care REIT Inc. 126,889 46,304 56,911 4,383 89,023 6,518 — 209,688
Select Income REIT 128,330 15,618 32,192 1,530 (14,385) 4,340 — NA3
Senior Housing
Properties Trust 346,271 45,142 93,919 2,129 (28,295) 23,520 2,971 271,328
Seritage Growth
Properties Class A 70,018 10,867 14,164 901 616 982 681 68,238

36
REIT Index Fund
Current Period Transactions
January 31, Proceeds Realized January 31,
2017 from Net Change in Capital Gain 2018
Market Purchases Securities Gain Unrealized Distributions Market
Value at Cost Sold1 (Loss) App. (Dep.) Income Received Value
($000) ($000) ($000) ($000) ($000) ($000) ($000) ($000)
Silver Bay Realty
Trust Corp. 43,697 1,400 57,224 7,370 5,971 334 — —
Simon Property
Group Inc. 4,419,387 553,903 1,132,181 154,843 (649,196) 166,648 — 3,346,756
SL Green Realty
Corp. 836,650 113,384 230,651 23,531 (87,451) 8,702 13,826 655,463
Spirit Realty Capital
Inc. 386,215 39,893 94,367 (10,216) (74,680) 16,411 2,525 246,845
STAG Industrial Inc. 126,455 58,409 41,597 6,960 3,756 5,837 — 153,983
Starwood
Waypoint Homes — 22,755 46,855 4,381 20,860 1,240 138 —
STORE Capital
Corp. 277,597 67,845 81,421 3,674 8,503 12,125 1,916 276,198
Summit Hotel
Properties Inc. 106,021 34,983 31,567 5,722 (8,686) 4,850 — 106,473
Sun Communities
Inc. 414,680 91,559 96,492 19,044 34,055 4,640 — 462,846
Sunstone Hotel
Investors Inc. 244,027 38,614 66,052 8,823 24,923 8,494 2,689 250,335
Tanger Factory
Outlet Centers Inc. 251,411 25,138 52,995 1,531 (67,515) 8,095 — 157,570
Taubman Centers
Inc. 327,490 34,418 68,064 6,005 (53,202) 6,245 2,808 246,647
Terreno Realty
Corp. 96,103 27,144 29,822 5,144 24,332 2,541 398 122,901
Tier REIT Inc. 66,628 8,218 17,585 2,174 1,838 2,540 — 61,273
UDR Inc. 714,332 101,513 207,782 30,272 5,794 19,840 3,874 644,129
UMH Properties Inc. — 40,829 7,176 (313) (6,716) 47 — 26,624
Universal Health
Realty Income Trust 61,745 7,944 18,036 4,743 355 1,405 1,111 56,751
Urban Edge
Properties 212,935 52,716 54,397 7,114 (43,022) 4,073 2,950 175,346
Vanguard Market
Liquidity Fund 149,286 NA4 NA4 (76) (3) 648 — 164,286
Vanguard REIT II
Index Fund — 6,335,870 — — (209,458) 70,790 9,589 6,126,412
Ventas Inc. 1,658,300 238,126 459,294 56,216 (179,905) 46,633 34,724 1,313,443
VEREIT Inc. 616,630 94,723 159,939 (14,153) (74,884) 25,105 1,041 462,377
Vornado Realty
Trust 1,382,302 151,211 288,246 21,599 (461,774) 30,983 — 805,092

37
REIT Index Fund
Current Period Transactions
January 31, Proceeds Realized January 31,
2017 from Net Change in Capital Gain 2018
Market Purchases Securities Gain Unrealized Distributions Market
Value at Cost Sold1 (Loss) App. (Dep.) Income Received Value
($000) ($000) ($000) ($000) ($000) ($000) ($000) ($000)
Washington Prime
Group Inc. 135,898 13,022 27,821 (6,890) (33,609) 5,896 7,797 80,600
Washington REIT 177,272 27,574 45,663 3,366 (17,178) 5,026 1,666 145,371
Weingarten Realty
Investors 331,196 37,696 77,499 5,074 (58,660) 4,604 15,404 237,807
Welltower Inc. 1,816,108 279,649 495,331 46,594 (189,153) 48,554 42,223 1,457,867
Whitestone REIT 30,721 12,236 8,175 749 (2,138) 494 — 33,393
Winthrop Realty
Trust 15,172 — — — 341 — — 12,674
WP Carey Inc. 476,167 89,383 134,058 6,541 18,410 24,478 1,657 456,443
Xenia Hotels &
Resorts Inc. 148,670 20,520 42,719 2,131 27,643 8,052 — 156,245
59,610,847 17,252,154 17,111,551 1,959,843 (3,751,591) 1,964,312 355,153 57,342,038
1 Does not include adjustments to related return of capital.
2 Not Applicable—at January 31, 2017, the issuer was not an affiliated company of the fund.
3 Not Applicable—at January 31, 2018, the security was still held, but the issuer was no longer an affiliated company of the fund.
4 Not Applicable—purchases and sales are for temporary cash investment purposes.
H. On February 1, 2018, the benchmark index of the fund was changed from the MSCI US
REIT Index to the MSCI US Investable Market Real Estate 25/50 Transition Index. The fund is
expected to complete its transition to its destination benchmark index, MSCI US Investable
Market Real Estate 25/50 Index, during the third quarter of 2018. Additionally, the name of
the fund was changed to Vanguard Real Estate Index Fund.
Management has determined that no other material events or transactions occurred subsequent
to January 31, 2018, that would require recognition or disclosure in these financial statements.

To the Board of Trustees of Vanguard Specialized Funds and Shareholders of Vanguard Real Estate
Index Fund (formerly known as Vanguard REIT Index Fund)
Opinion on the Financial Statements
We have audited the accompanying statement of net assets and statement of assets and liabilities
of Vanguard REIT Index Fund (one of the funds constituting Vanguard Specialized Funds, referred
to hereafter as the “Fund”) as of January 31, 2018, the related statement of operations for the year
ended January 31, 2018, the statement of changes in net assets for each of the two years in the
period ended January 31, 2018, including the related notes, and the financial highlights for each
of the five years in the period ended January 31, 2018 (collectively referred to as the “financial
statements”). In our opinion, the financial statements present fairly, in all material respects, the
financial position of the Fund as of January 31, 2018, the results of its operations for the year then
ended, the changes in its net assets for each of the two years in the period ended January 31, 2018
and the financial highlights for each of the five years in the period ended January 31, 2018 in
conformity with accounting principles generally accepted in the United States of America.
Basis for Opinion
These financial statements are the responsibility of the Fund’s management. Our responsibility
is to express an opinion on the Fund’s financial statements based on our audits. We are a public
accounting firm registered with the Public Company Accounting Oversight Board (United States)
(“PCAOB”) and are required to be independent with respect to the Fund in accordance with the
U.S. federal securities laws and the applicable rules and regulations of the Securities and Exchange
Commission and the PCAOB.
We conducted our audits of these financial statements in accordance with the standards of
the PCAOB. Those standards require that we plan and perform the audit to obtain reasonable
assurance about whether the financial statements are free of material misstatement, whether
due to error or fraud.
Our audits included performing procedures to assess the risks of material misstatement of the
financial statements, whether due to error or fraud, and performing procedures that respond to
those risks. Such procedures included examining, on a test basis, evidence regarding the amounts
and disclosures in the financial statements. Our audits also included evaluating the accounting
principles used and significant estimates made by management, as well as evaluating the overall
presentation of the financial statements. Our procedures included confirmation of securities owned
as of January 31, 2018 by correspondence with the custodian and brokers and by agreement to the
underlying ownership records of the transfer agent; when replies were not received from brokers,
we performed other auditing procedures. We believe that our audits provide a reasonable basis for
our opinion.
/s/PricewaterhouseCoopers LLP
Philadelphia, Pennsylvania
March 15, 2018
We have served as the auditor of one or more investment companies in The Vanguard Group
of Funds since 1975.
Report of Independent Registered Public Accounting Firm
38

Special 2017 tax information (unaudited) for Vanguard REIT Index Fund
This information for the fiscal year ended January 31, 2018, is included pursuant to provisions
of the Internal Revenue Code.
The fund distributed $25,911,000 as capital gain dividends (from net long-term capital gains)
to shareholders during the fiscal year. The fund designated $25,911,000 of its capital gain dividends
as unrecaptured section 1250 gain distributions (25% rate gain).
The fund distributed $101,019,000 of qualified dividend income to shareholders during the
fiscal year.
39

Your Fund’s After-Tax Returns
40
This table presents returns for your fund both before and after taxes. The after-tax returns are
shown in two ways: (1) assuming that an investor owned the fund during the entire period and
paid taxes on the fund’s distributions, and (2) assuming that an investor paid taxes on the fund’s
distributions and sold all shares at the end of each period.
Calculations are based on the highest individual federal income tax and capital gains tax rates in
effect at the times of the distributions and the hypothetical sales. State and local taxes were not
considered. After-tax returns reflect any qualified dividend income, using actual prior-year figures
and estimates for 2018. (In the example, returns after the sale of fund shares may be higher than
those assuming no sale. This occurs when the sale would have produced a capital loss. The
calculation assumes that the investor received a tax deduction for the loss.)
The table shows returns for Investor Shares only; returns for other share classes will differ. Please
note that your actual after-tax returns will depend on your tax situation and may differ from those
shown. Also note that if you own the fund in a tax-deferred account, such as an individual
retirement account or a 401(k) plan, this information does not apply to you. Such accounts are not
subject to current taxes.
Finally, keep in mind that a fund’s performance—whether before or after taxes—does not
guarantee future results.
Average Annual Total Returns: REIT Index Fund Investor Shares Periods Ended January 31, 2018
One
Year
Five
Years
Ten
Years
Returns Before Taxes 0.45% 7.38% 7.08%
Returns After Taxes on Distributions -0.80 6.11 5.84
Returns After Taxes on Distributions and Sale of Fund Shares 0.21 5.18 5.05
About Your Fund’s Expenses
41
As a shareholder of the fund, you incur ongoing costs, which include costs for portfolio management,
administrative services, and shareholder reports (like this one), among others. Operating expenses,
which are deducted from a fund’s gross income, directly reduce the investment return of the fund.
A fund’s expenses are expressed as a percentage of its average net assets. This figure is known as
the expense ratio. The following examples are intended to help you understand the ongoing costs (in
dollars) of investing in your fund and to compare these costs with those of other mutual funds. The
examples are based on an investment of $1,000 made at the beginning of the period shown and held
for the entire period.
The accompanying table illustrates your fund’s costs in two ways:
• Based on actual fund return. This section helps you to estimate the actual expenses that you
paid over the period. The ”Ending Account Value“ shown is derived from the fund‘s actual return,
and the third column shows the dollar amount that would have been paid by an investor who started
with $1,000 in the fund. You may use the information here, together with the amount you invested,
to estimate the expenses that you paid over the period.
To do so, simply divide your account value by $1,000 (for example, an $8,600 account value divided
by $1,000 = 8.6), then multiply the result by the number given for your fund under the heading
”Expenses Paid During Period.“
• Based on hypothetical 5% yearly return. This section is intended to help you compare your
fund‘s costs with those of other mutual funds. It assumes that the fund had a yearly return of 5%
before expenses, but that the expense ratio is unchanged. In this case—because the return used is
not the fund’s actual return—the results do not apply to your investment. The example is useful in
making comparisons because the Securities and Exchange Commission requires all mutual funds to
calculate expenses based on a 5% return. You can assess your fund’s costs by comparing this
hypothetical example with the hypothetical examples that appear in shareholder reports of other
funds.
Note that the expenses shown in the table are meant to highlight and help you compare ongoingcosts only and do not reflect transaction costs incurred by the fund for buying and sellingsecurities. Further, the expenses do not include any purchase, redemption, or account servicefees described in the fund prospectus. If such fees were applied to your account, your costswould be higher. Your fund does not carry a “sales load.”
The calculations assume no shares were bought or sold during the period. Your actual costs may
have been higher or lower, depending on the amount of your investment and the timing of any
purchases or redemptions.
You can find more information about the fund’s expenses, including annual expense ratios, in the
Financial Statements section of this report. For additional information on operating expenses and
other shareholder costs, please refer to your fund’s current prospectus.

42
Six Months Ended January 31, 2018
REIT Index Fund
Beginning
Account Value
7/31/2017
Ending
Account Value
1/31/2018
Expenses
Paid During
Period
Based on Actual Fund Return
Investor Shares $1,000.00 $967.28 $1.29
ETF Shares 1,000.00 967.96 0.60
Admiral Shares 1,000.00 967.85 0.60
Institutional Shares 1,000.00 967.73 0.50
Based on Hypothetical 5% Yearly Return
Investor Shares $1,000.00 $1,023.89 $1.33
ETF Shares 1,000.00 1,024.60 0.61
Admiral Shares 1,000.00 1,024.60 0.61
Institutional Shares 1,000.00 1,024.70 0.51
The calculations are based on expenses incurred in the most recent six-month period. The fund’s annualized six-month expense ratios forthat period are 0.26% for Investor Shares, 0.12% for ETF Shares, 0.12% for Admiral Shares, and 0.10% for Institutional Shares. The dollaramounts shown as “Expenses Paid” are equal to the annualized expense ratio multiplied by the average account value over the period,multiplied by the number of days in the most recent six-month period, then divided by the number of days in the most recent 12-monthperiod (184/365).

Glossary
43
Beta. A measure of the magnitude of a fund’s past share-price fluctuations in relation to the ups
and downs of a given market index. The index is assigned a beta of 1.00. Compared with a given
index, a fund with a beta of 1.20 typically would have seen its share price rise or fall by 12%
when the index rose or fell by 10%. For this report, beta is based on returns over the past 36
months for both the fund and the index. Note that a fund’s beta should be reviewed in conjunction
with its R-squared (see definition). The lower the R-squared, the less correlation there is between
the fund and the index, and the less reliable beta is as an indicator of volatility.
Dividend Yield. Dividend income earned by stocks, expressed as a percentage of the aggregate
market value (or of net asset value, for a fund). The yield is determined by dividing the amount of
the annual dividends by the aggregate value (or net asset value) at the end of the period. For a
fund, the dividend yield is based solely on stock holdings and does not include any income
produced by other investments. This yield may include some payments that represent a return of
capital, capital gains distributions, or both by the underlying stocks.
Earnings Growth Rate. The average annual rate of growth in earnings over the past five years for
the stocks now in a fund.
Expense Ratio. A fund’s total annual operating expenses expressed as a percentage of the fund’s
average net assets. The expense ratio includes management and administrative expenses, but
does not include the transaction costs of buying and selling portfolio securities.
Foreign Holdings. The percentage of a fund represented by securities or depositary receipts of
companies based outside the United States.
Inception Date. The date on which the assets of a fund (or one of its share classes) are first
invested in accordance with the fund’s investment objective. For funds with a subscription period,
the inception date is the day after that period ends. Investment performance is measured from
the inception date.
Median Market Cap. An indicator of the size of companies in which a fund invests; the midpoint
of market capitalization (market price x shares outstanding) of a fund’s stocks, weighted by the
proportion of the fund’s assets invested in each stock. Stocks representing half of the fund’s
assets have market capitalizations above the median, and the rest are below it.
Price/Book Ratio. The share price of a stock divided by its net worth, or book value, per share.
For a fund, the weighted average price/book ratio of the stocks it holds.
Price/Earnings Ratio. The ratio of a stock’s current price to its per-share earnings over the past
year. For a fund, the weighted average P/E of the stocks it holds. P/E is an indicator of market
expectations about corporate prospects; the higher the P/E, the greater the expectations for a
company’s future growth.
R-Squared. A measure of how much of a fund’s past returns can be explained by the returns
from the market in general, as measured by a given index. If a fund’s total returns were precisely
synchronized with an index’s returns, its R-squared would be 1.00. If the fund’s returns bore no
relationship to the index’s returns, its R-squared would be 0. For this report, R-squared is based
on returns over the past 36 months for both the fund and the index.

44
Return on Equity. The annual average rate of return generated by a company during the past five
years for each dollar of shareholder’s equity (net income divided by shareholder’s equity). For a
fund, the weighted average return on equity for the companies whose stocks it holds.
Short-Term Reserves. The percentage of a fund invested in highly liquid, short-term securities
that can be readily converted to cash.
Turnover Rate. An indication of the fund’s trading activity. Funds with high turnover rates incur
higher transaction costs and may be more likely to distribute capital gains (which may be taxable
to investors). The turnover rate excludes in-kind transactions, which have minimal impact on
costs.
Benchmark Information
REIT Spliced Index: MSCI US REIT Index adjusted to include a 2% cash position (Lipper Money
Market Average) through April 30, 2009; MSCI US REIT Index through January 31, 2018; MSCI
US Investable Market Real Estate 25/50 Transition Index thereafter.

The Global Industry Classification Standard (“GICS”) was developed by and is the exclusive property and a service mark
of MSCI Inc. (“MSCI”) and Standard and Poor’s, a division of McGraw-Hill Companies, Inc. (“S&P”), and is licensed for use
by Vanguard. Neither MSCI, S&P nor any third party involved in making or compiling the GICS or any GICS classification
makes any express or implied warranties or representations with respect to such standard or classification (or the results
to be obtained by the use thereof), and all such parties hereby expressly disclaim all warranties of originality, accuracy,
completeness, merchantability or fitness for a particular purpose with respect to any such standard or classification.
Without limiting any of the foregoing, in no event shall MSCI, S&P, any of its affiliates or any third party involved in
making or compiling the GICS or any GICS classification have any liability for any direct, indirect, special, punitive,
consequential or any other damages (including lost profits) even if notified of the possibility of such damages.
45
The People Who Govern Your Fund
The trustees of your mutual fund are there to see that the fund is operated and managed in your
best interests since, as a shareholder, you are a part owner of the fund. Your fund’s trustees also
serve on the board of directors of The Vanguard Group, Inc., which is owned by the Vanguard
funds and provides services to them on an at-cost basis.
A majority of Vanguard’s board members are independent, meaning that they have no affiliation
with Vanguard or the funds they oversee, apart from the sizable personal investments they have
made as private individuals. The independent board members have distinguished backgrounds
in business, academia, and public service. Each of the trustees and executive officers oversees
201 Vanguard funds.
Information for each trustee and executive officer of the fund appears below. The mailing address
of the trustees and officers is P.O. Box 876, Valley Forge, PA 19482. More information about the
trustees is in the Statement of Additional Information, which can be obtained, without charge,
by contacting Vanguard at 800-662-7447, or online at vanguard.com.
Interested Trustees1
F. William McNabb III
Mr. McNabb has served as chairman of the board of
Vanguard and of each of the investment companies
served by Vanguard since January 2010; as a trustee of
each of the investment companies served by Vanguard
since 2009; and as director of Vanguard since 2008.
Mr. McNabb served as chief executive officer and
president of Vanguard and each of the investment
companies served by Vanguard from 2008 to 2017
and as a managing director of Vanguard from 1995
to 2008. Mr. McNabb also serves as a director of
Vanguard Marketing Corporation. He was born in 1957.
Mortimer J. Buckley
Mr. Buckley has served as chief executive officer
of Vanguard since January 2018; as chief executive
officer, president, and trustee of each of the
investment companies served by Vanguard since
January 2018; and as president and director of
Vanguard since 2017. Previous positions held by
Mr. Buckley at Vanguard include chief investment
officer (2013–2017), head of the Retail Investor
Group (2006–2012), and chief information officer
(2001–2006). Mr. Buckley also served as chairman
of the board of the Children’s Hospital of Philadelphia
from 2011 to 2017. He was born in 1969.
Independent Trustees
Emerson U. Fullwood
Mr. Fullwood has served as trustee since July 2008.
Mr. Fullwood is the former executive chief staff and
marketing officer for North America and corporate
vice president (retired 2008) of Xerox Corporation
(document management products and services).
Previous positions held at Xerox by Mr. Fullwood
include president of the Worldwide Channels Group,
president of Latin America, executive chief staff
officer of Developing Markets, and president of
Worldwide Customer Services. Mr. Fullwood is
the executive in residence at the Rochester Institute
of Technology, where he was the 2009–2010
Distinguished Minett Professor. Mr. Fullwood
serves as lead director of SPX FLOW, Inc. (multi-
industry manufacturing); director of the University of
Rochester Medical Center, the Monroe Community
College Foundation, the United Way of Rochester,
North Carolina A&T University, and Roberts Wesleyan
College; and a trustee of the University of Rochester.
He was born in 1948.
Amy Gutmann
Dr. Gutmann has served as trustee since June 2006.
Dr. Gutmann has served as the president of the
University of Pennsylvania since 2004. She is the
Christopher H. Browne Distinguished Professor of
Political Science, School of Arts and Sciences, and
Professor of Communication, Annenberg School for
1 Mr. McNabb and Mr. Buckley are considered “interested persons,” as defined in the Investment Company Act of 1940, because they are officers of the Vanguard funds.
Communication, with secondary faculty appointments
in the Department of Philosophy, School of Arts and
Sciences, and at the Graduate School of Education,
University of Pennsylvania. Dr. Gutmann also serves
as a trustee of the National Constitution Center. She
was born in 1949.
JoAnn Heffernan Heisen
Ms. Heisen has served as trustee since July 1998.
Ms. Heisen is the former corporate vice president
of Johnson & Johnson (pharmaceuticals/medical
devices/consumer products) and a former member
of its executive committee (1997–2008). During her
tenure at Johnson & Johnson, Ms. Heisen held
multiple roles, including: chief global diversity officer
(retired 2008), vice president and chief information
officer (1997–2006), controller (1995–1997), treasurer
(1991–1995), and assistant treasurer (1989–1991).
Ms. Heisen serves as a director of Skytop Lodge
Corporation (hotels) and the Robert Wood Johnson
Foundation and as a member of the advisory board
of the Institute for Women’s Leadership at Rutgers
University. She was born in 1950.
F. Joseph Loughrey
Mr. Loughrey has served as trustee since October
2009. Mr. Loughrey is the former president and chief
operating officer (retired 2009) and vice chairman of
the board (2008–2009) of Cummins Inc. (industrial
machinery). Mr. Loughrey serves as chairman of the
board of Hillenbrand, Inc. (specialized consumer
services), Oxfam America, and the Lumina Foundation
for Education; as a director of the V Foundation for
Cancer Research; and as a member of the advisory
council for the College of Arts and Letters and chair
of the advisory board to the Kellogg Institute for
International Studies, both at the University of Notre
Dame. He was born in 1949.
Mark Loughridge
Mr. Loughridge has served as trustee since March
2012. Mr. Loughridge is the former senior vice
president and chief financial officer (retired 2013) at
IBM (information technology services). Mr. Loughridge
also served as a fiduciary member of IBM’s retirement
plan committee (2004–2013). Previous positions held
by Mr. Loughridge at IBM include senior vice president
and general manager of Global Financing (2002–2004),
vice president and controller (1998–2002), and a
variety of management roles. Mr. Loughridge serves
as a member of the Council on Chicago Booth. He
was born in 1953.
Scott C. Malpass
Mr. Malpass has served as trustee since March 2012.
Mr. Malpass has served as chief investment officer
since 1989 and as vice president since 1996 at the
University of Notre Dame. Mr. Malpass serves as an
assistant professor of finance at the Mendoza College
of Business at the University of Notre Dame and is
a member of the Notre Dame 403(b) investment
committee. Mr. Malpass also serves as chairman
of the board of TIFF Advisory Services, Inc.; as a
member of the board of Catholic Investment Services,
Inc. (investment advisors); as a member of the board
of advisors for Spruceview Capital Partners; and as
a member of the board of superintendence of the
Institute for the Works of Religion. He was born
in 1962.
Deanna Mulligan
Ms. Mulligan has served as trustee since January
2018. Ms. Mulligan has served as president since
2010 and chief executive officer since 2011 at
The Guardian Life Insurance Company of America.
Previous positions held by Ms. Mulligan at The
Guardian Life Insurance Company of America include
chief operating officer (2010–2011) and executive vice
president of Individual Life and Disability (2008–2010).
Ms. Mulligan serves as a board member of The
Guardian Life Insurance Company of America, the
American Council of Life Insurers, the Partnership
for New York City (business leadership), and the
Committee Encouraging Corporate Philanthropy. She
also serves as a trustee of the Economic Club of New
York and the Bruce Museum (arts and science) and
as a member of the Advisory Council for the Stanford
Graduate School of Business. She was born in 1963.
André F. Perold
Dr. Perold has served as trustee since December
2004. Dr. Perold is the George Gund Professor of
Finance and Banking, Emeritus at the Harvard
Business School (retired 2011). Dr. Perold serves
as chief investment officer and co-managing partner
of HighVista Strategies LLC (private investment firm).
Dr. Perold also serves as an overseer of the Museum
of Fine Arts Boston. He was born in 1952.
Sarah Bloom Raskin
Ms. Raskin has served as trustee since January 2018.
Ms. Raskin served as deputy secretary of the United
States Department of the Treasury (2014–2017), as a
governor of the Federal Reserve Board (2010–2014),
and as commissioner of financial regulation of the
State of Maryland (2007–2010). Ms. Raskin also

served as a member of the Neighborhood
Reinvestment Corporation’s board of directors
(2012–2014). Ms. Raskin serves as a director
of i(x) Investments, LLC. She was born in 1961.
Peter F. Volanakis
Mr. Volanakis has served as trustee since July 2009.
Mr. Volanakis is the retired president and chief
operating officer (retired 2010) of Corning Incorporated
(communications equipment) and a former director of
Corning Incorporated (2000–2010) and Dow Corning
(2001–2010). Mr. Volanakis served as a director of
SPX Corporation (multi-industry manufacturing)
(2012) and as an overseer of the Amos Tuck School
of Business Administration at Dartmouth College
(2001–2013). Mr. Volanakis serves as chairman of
the board of trustees of Colby-Sawyer College and is
a member of the board of Hypertherm Inc. (industrial
cutting systems, software, and consumables). He
was born in 1955.
Executive Officers
Glenn Booraem
Mr. Booraem, a principal of Vanguard, has served
as investment stewardship officer of each of the
investment companies served by Vanguard since
February 2017. Mr. Booraem served as treasurer
(2015–2017), controller (2010–2015), and assistant
controller (2001–2010) of each of the investment
companies served by Vanguard. He was born in 1967.
Christine M. Buchanan
Ms. Buchanan, a principal of Vanguard, has served
as treasurer of each of the investment companies
served by Vanguard since November 2017. She
also serves as global head of Fund Administration
at Vanguard. Ms. Buchanan served as a partner at
KPMG LLP (audit, tax, and advisory services)
(2005–2017). She was born in 1970.
Thomas J. Higgins
Mr. Higgins, a principal of Vanguard, has served
as chief financial officer of each of the investment
companies served by Vanguard since 2008.
Mr. Higgins served as treasurer of each of the
investment companies served by Vanguard
(1998–2008). He was born in 1957.
Peter Mahoney
Mr. Mahoney, a principal of Vanguard, has served
as controller of each of the investment companies
served by Vanguard since May 2015. Mr. Mahoney
served as head of International Fund Services at
Vanguard (2008–2014). He was born in 1974.
Anne E. Robinson
Ms. Robinson has served as general counsel
of Vanguard since September 2016; as secretary
of Vanguard and of each of the investment companies
served by Vanguard since September 2016; as director
and senior vice president of Vanguard Marketing
Corporation since September 2016; and as a
managing director of Vanguard since August 2016.
Ms. Robinson served as managing director and
general counsel of Global Cards and Consumer
Services at Citigroup (2014–2016). She served
as counsel at American Express (2003–2014).
She was born in 1970.
Michael Rollings
Mr. Rollings, a managing director of Vanguard since
June 2016, has served as finance director of each
of the investment companies served by Vanguard
since November 2017 and as a director of Vanguard
Marketing Corporation since June 2016. Mr. Rollings
served as treasurer of each of the investment
companies served by Vanguard from February 2017 to
November 2017. He also served as the executive vice
president and chief financial officer of MassMutual
Financial Group (2006–2016). He was born in 1963.
Vanguard Senior Management Team
Mortimer J. Buckley James M. Norris
Gregory Davis Thomas M. Rampulla
John James Karin A. Risi
Martha G. King Anne E. Robinson
John T. Marcante Michael Rollins
Chris D. McIsaac
Chairman Emeritus and Senior Advisor
John J. Brennan
Chairman, 1996–2009
Chief Executive Officer and President, 1996–2008
Founder
John C. Bogle
Chairman and Chief Executive Officer, 1974–1996

P.O. Box 2600
Valley Forge, PA 19482-2600
Connect with Vanguard® > vanguard.com
Fund Information > 800-662-7447
Direct Investor Account Services > 800-662-2739
Institutional Investor Services > 800-523-1036
Text Telephone for PeopleWho Are Deaf or Hard of Hearing > 800-749-7273
This material may be used in conjunctionwith the offering of shares of any Vanguardfund only if preceded or accompanied bythe fund’s current prospectus.
All comparative mutual fund data are from Lipper, aThomson Reuters Company, or Morningstar, Inc., unlessotherwise noted.
You can obtain a free copy of Vanguard’s proxy votingguidelines by visiting vanguard.com/proxyreporting or bycalling Vanguard at 800-662-2739. The guidelines arealso available from the SEC’s website, sec.gov. Inaddition, you may obtain a free report on how your fundvoted the proxies for securities it owned during the 12months ended June 30. To get the report, visit eithervanguard.com/proxyreporting or sec.gov.
You can review and copy information about your fund atthe SEC’s Public Reference Room in Washington, D.C. Tofind out more about this public service, call the SEC at202-551-8090. Information about your fund is alsoavailable on the SEC’s website, and you can receivecopies of this information, for a fee, by sending arequest in either of two ways: via email addressed [email protected] or via regular mail addressed to thePublic Reference Section, Securities and ExchangeCommission, Washington, DC 20549-1520.
Source for Bloomberg Barclays indexes: BloombergIndex Services Limited. Copyright 2017, Bloomberg. Allrights reserved.
The funds or securities referred to herein are notsponsored, endorsed, or promoted by MSCI, and MSCIbears no liability with respect to any such funds orsecurities. The prospectus or the Statement of
Additional Information contains a more detaileddescription of the limited relationship MSCI has withVanguard and any related funds.
© 2018 The Vanguard Group, Inc.All rights reserved.Vanguard Marketing Corporation, Distributor.
Q1230 032018

Vanguard REIT II Index Fund
Annual Report | January 31, 2018

Contents
Please note: The opinions expressed in this report are just that—informed opinions. They should not be considered promisesor advice. Also, please keep in mind that the information and opinions cover the period through the date on the front of thisreport. Of course, the risks of investing in your fund are spelled out in the prospectus.
See the Glossary for definitions of investment terms used in this report.About the cover: Nautical images have been part of Vanguard’s rich heritage since its start in 1975. For anincoming ship, a lighthouse offers a beacon and safe path to shore. You can similarly depend on Vanguard to putyou first––and light the way––as you strive to meet your financial goals. Our client focus and low costs,stemming from our unique ownership structure, assure that your interests are paramount.
REIT II Index Fund
Vanguard’s Principles for Investing Success
We want to give you the best chance of investment success. Theseprinciples, grounded in Vanguard’s research and experience, can put you onthe right path.
Goals. Create clear, appropriate investment goals.
Balance. Develop a suitable asset allocation using broadly diversified funds.
Cost. Minimize cost.
Discipline. Maintain perspective and long-term discipline.
A single theme unites these principles: Focus on the things you can control.We believe there is no wiser course for any investor.
Your Fund’s Performance at a Glance. . . . . . . . . . . . . . . . . . 1
CEO’s Perspective. . . . . . . . . . . . . . . . . . . . . . . . . . . . . . . . . 2
Fund Profile. . . . . . . . . . . . . . . . . . . . . . . . . . . . . . . . . . . . . . .5
Performance Summary. . . . . . . . . . . . . . . . . . . . . . . . . . . . . .6
Financial Statements. . . . . . . . . . . . . . . . . . . . . . . . . . . . . . . 7
Your Fund’s After-Tax Returns. . . . . . . . . . . . . . . . . . . . . . . 20
About Your Fund’s Expenses. . . . . . . . . . . . . . . . . . . . . . . . 21
Trustees Approve Advisory Arrangement. . . . . . . . . . . . . . 23
Glossary. . . . . . . . . . . . . . . . . . . . . . . . . . . . . . . . . . . . . . . . 24

Your Fund’s Performance at a Glance
1
Total Returns: Period Ended January 31, 2018
Since Inception
Vanguard REIT II Index Fund (Inception: 9/26/2017) -2.89%
MSCI US REIT Index -2.86
Real Estate Funds Average -1.11
Real Estate Funds Average: Derived from data provided by Lipper, a Thomson Reuters Company.
Expense RatiosYour Fund Compared With Its Peer Group
Fund
Peer Group
Average
REIT II Index Fund 0.08% 1.25%
The fund expense ratio shown is from the prospectus dated September 26, 2017, and represents estimated costs for the current fiscalyear. For the period from inception through January 31, 2018, the fund’s annualized expense ratio was 0.08%. The peer-group expenseratio is derived from data provided by Lipper, a Thomson Reuters Company, and captures information through year-end 2017.
Peer group: Real Estate Funds.
• Vanguard launched Vanguard REIT II Index Fund on September 26, 2017, to provide
Vanguard REIT Index Fund with additional investment capacity.
• In the limited time the fund has been in existence, it returned –2.89%, in line with
the return of its benchmark index but lower than that of its peer group.
• On February 1, 2018, the fund changed its name to Vanguard Real Estate II Index
Fund and its benchmark from the MSCI US REIT Index to the MSCI US Investable
Market Real Estate 25/50 Transition Index. The new target index will increase exposure
to certain specialized REITs and real estate management development companies.
• The fund is expected to complete its transition to the MSCI US Investable Market
Real Estate 25/50 Index during the third quarter of 2018.
Dear Shareholder,
When you start a new job, it’s natural
to reflect on both the past and the future.
And so it is in my case, having begun my
service as just the fourth chief executive
in Vanguard’s history.
I feel extremely fortunate to have the
chance to lead a company filled with people
who come to work every day passionate
about Vanguard’s core purpose: to take a
stand for all investors, to treat them fairly,
and to give them the best chance for
investment success.
Making a real difference
When I joined Vanguard in 1991, I found a
mission-driven team focused on improving
lives—helping people retire more com-
fortably, put their children through college,
and achieve financial security. I found
a company with purpose in an industry
ripe for improvement.
It was clear, even early in my career,
that the cards were stacked against most
investors. Hidden fees, performance-
chasing, and poor advice were relentlessly
eroding investors’ dreams.
We knew Vanguard could be different
and, as a result, could make a real
difference. Over the past 25 years, for
example, Vanguard has lowered our funds’
asset-weighted average expense ratio
CEO’s Perspective
Tim Buckley
President and Chief Executive Officer
2

from 0.31% to 0.12%. And over the past
decade, 94% of our funds have beaten
the average annual return of their peers.1
Focused on your success
Vanguard is built for Vanguard investors—
as a client-owned company, we focus
solely on you, our fund shareholders.
Everything we do is designed to give our
clients the best chance for investment
success. In my new role as CEO, I intend
to keep this priority front and center. We’re
proud of what we’ve achieved, but we’re
even more excited about what’s to come.
As I write this, we’ve experienced a
period of pronounced market volatility.
Strong economic growth and budding
signs of inflation have raised concerns
about a more aggressive Federal Reserve.
Although volatility can test investors’
nerves, we sometimes think of this as
“Vanguard weather”—a time when having
a disciplined, low-cost, and long-term
approach to investment management
serves investors well.
Market Barometer
Average Annual Total Returns
Periods Ended January 31, 2018
One Year Three Years Five Years
Stocks
Russell 1000 Index (Large-caps) 25.84% 14.28% 15.72%
Russell 2000 Index (Small-caps) 17.18 12.12 13.33
Russell 3000 Index (Broad U.S. market) 25.16 14.11 15.53
FTSE All-World ex US Index (International) 29.63 10.20 7.48
Bonds
Bloomberg Barclays U.S. Aggregate Bond Index
(Broad taxable market) 2.15% 1.14% 2.01%
Bloomberg Barclays Municipal Bond Index
(Broad tax-exempt market) 3.52 1.97 2.69
Citigroup Three-Month U.S. Treasury Bill Index 0.91 0.41 0.25
CPI
Consumer Price Index 2.07% 1.98% 1.48%
The performance data shown represent past performance, which is not a guarantee of future results.
1 For the ten-year period through December 31, 2017, 9 of 9 Vanguard money market funds, 56 of 60 bond funds, 21 of 22 balanced funds, and 131 of 140 stock funds, or 217 of 231 Vanguard funds, outperformed their peer-group averages. Sources: Vanguard, based on data from Lipper, a Thomson Reuters Company.
3

Steady, time-tested guidance
Our guidance for investors, as always, is
to stay the course, tune out the hyperbolic
headlines, and focus on your goals and
what you can control, such as costs and
how much you save. This time-tested
advice has served our clients well over
the decades.
Regardless of how the markets perform
in the short term, I’m incredibly optimistic
about the future for our investors. We have
a dedicated team serving you, and we will
never stop striving to make Vanguard the
best place for you to invest through our
high-quality funds and services, advice and
guidance to help you meet your financial
goals, and an experience that makes you
feel good about entrusting us with your
hard-earned savings.
Thank you for your continued loyalty.
Sincerely,
Mortimer J. Buckley
President and Chief Executive Officer
February 15, 2018
4

REIT II Index Fund
Fund ProfileAs of January 31, 2018
1 The expense ratio shown is from the prospectus dated September 26, 2017, and represents estimated costs for the current fiscal year. For the period from inception through January 31, 2018, the expense ratio was 0.08%.
5
Portfolio Characteristics
Fund
MSCI US
REIT Index
DJ
U.S. Total
Market
FA Index
Number of Stocks 181 152 3,765
Median Market Cap $9.8B $9.8B $73.6B
Price/Earnings Ratio 32.5x 32.5x 23.8x
Price/Book Ratio 2.2x 2.2x 3.2x
Return on Equity 5.9% 5.9% 14.9%
Earnings Growth Rate 18.3% 17.1% 9.1%
Dividend Yield 4.2% 4.2% 1.7%
Foreign Holdings 0.0% 0.0% 0.0%
Turnover Rate 1% — —
Ticker Symbol VRTPX — —
Expense Ratio1
0.08% — —
Short-Term Reserves 0.0% — —
Dividend Yield: This yield may include some payments that represent a return of capital, capital gains distributions, or both by the underlying REITs. These amounts are determined by each REIT at the end of its fiscal year.
Subindustry Diversification (% of equity exposure)
FundMSCI US
REIT Index
Diversified REITs 7.2% 7.2%
Health Care REITs 11.1 11.2
Hotel & Resort REITs 7.2 7.2
Industrial REITs 7.7 7.8
Office REITs 13.2 13.2
Residential REITs 16.2 16.2
Retail REITs 19.1 19.1
Specialized REITs 18.3 18.1
Sector categories are based on the Global Industry Classification Standard ("GICS"), except for the "Other" category (if applicable), which includes securities that have not been provided a GICS classification as of the effective reporting period.
Ten Largest Holdings (% of total net assets)
Simon Property Group
Inc. Retail REITs 6.2%
Equinix Inc. Specialized REITs 4.3
Prologis Inc. Industrial REITs 4.2
Public Storage Specialized REITs 3.7
AvalonBay Communities
Inc. Residential REITs 2.9
Digital Realty Trust Inc. Specialized REITs 2.8
Equity Residential Residential REITs 2.7
Welltower Inc. Health Care REITs 2.7
Ventas Inc. Health Care REITs 2.4
Boston Properties Inc. Office REITs 2.3
Top Ten 34.2%
The holdings listed exclude any temporary cash investments andequity index products.
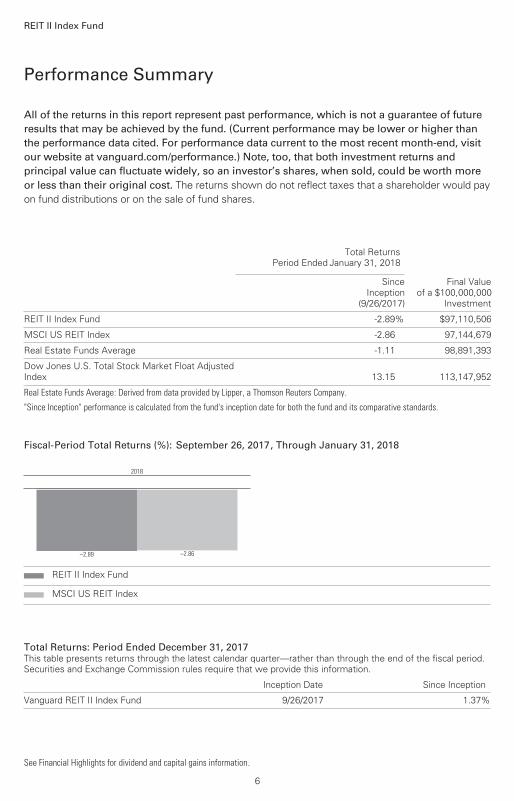
All of the returns in this report represent past performance, which is not a guarantee of future results that may be achieved by the fund. (Current performance may be lower or higher thanthe performance data cited. For performance data current to the most recent month-end, visitour website at vanguard.com/performance.) Note, too, that both investment returns and principal value can fluctuate widely, so an investor’s shares, when sold, could be worth more or less than their original cost. The returns shown do not reflect taxes that a shareholder would pay
on fund distributions or on the sale of fund shares.
REIT II Index Fund
Performance Summary
See Financial Highlights for dividend and capital gains information.
6
Total Returns
Period Ended January 31, 2018
SinceInception
(9/26/2017)
Final Valueof a $100,000,000
Investment
REIT II Index Fund -2.89% $97,110,506
MSCI US REIT Index -2.86 97,144,679
Real Estate Funds Average -1.11 98,891,393
Dow Jones U.S. Total Stock Market Float AdjustedIndex 13.15 113,147,952
Real Estate Funds Average: Derived from data provided by Lipper, a Thomson Reuters Company.
"Since Inception" performance is calculated from the fund's inception date for both the fund and its comparative standards.
Fiscal-Period Total Returns (%): September 26, 2017, Through January 31, 2018
–2.89 –2.86
2018
REIT II Index Fund
MSCI US REIT Index
Total Returns: Period Ended December 31, 2017 This table presents returns through the latest calendar quarter—rather than through the end of the fiscal period.
Securities and Exchange Commission rules require that we provide this information.
Inception Date Since Inception
Vanguard REIT II Index Fund 9/26/2017 1.37%

Market
Value•
Shares ($000)
Market
Value•
Shares ($000)
Equity Real Estate Investment
Trusts (REITs) (99.9%)
Diversified REITs (7.2%)
Alexander & Baldwin Inc. 560,985 14,877
American Assets Trust Inc. 262,891 9,270
Armada Hoffler Properties
Inc. 334,730 4,817
Colony NorthStar Inc.
Class A 3,889,635 34,929
Empire State Realty
Trust Inc. 996,194 19,476
Forest City Realty Trust
Inc. Class A 1,585,972 37,223
Gladstone Commercial
Corp. 206,017 3,914
Global Net Lease Inc. 500,415 9,178
Gramercy Property Trust 1,128,505 28,483
Investors Real Estate
Trust 896,758 5,085* iStar Inc. 483,494 5,101
Lexington Realty Trust 1,610,092 14,523
Liberty Property Trust 1,095,377 45,360
One Liberty Properties
Inc. 104,297 2,549
PS Business Parks Inc. 151,826 18,539
Select Income REIT 498,697 11,151
Spirit Realty Capital Inc. 3,406,544 27,831
STORE Capital Corp. 1,270,514 31,140
VEREIT Inc. 7,240,866 52,134
Washington REIT 571,742 16,386
WP Carey Inc. 794,089 51,465
443,431
Health Care REITs (11.1%)
CareTrust REIT Inc. 564,470 8,969
Community Healthcare
Trust Inc. 94,057 2,506
HCP Inc. 3,484,146 83,898
Healthcare Realty Trust
Inc. 920,159 27,485
Healthcare Trust of
America Inc. Class A 1,491,279 41,174
LTC Properties Inc. 294,208 12,057
MedEquities Realty
Trust Inc. 2,558 28
Medical Properties
Trust Inc. 2,705,512 35,388
National Health
Investors Inc. 304,659 21,488
New Senior Investment
Group Inc. 610,768 4,678^ Omega Healthcare
Investors Inc. 1,465,607 39,630
Physicians Realty Trust 1,320,106 21,518* Quality Care Properties
Inc. 697,473 9,416
Sabra Health Care REIT
Inc. 1,306,522 23,648
Senior Housing
Properties Trust 1,765,255 30,592
Universal Health Realty
Income Trust 96,116 6,397
Ventas Inc. 2,645,891 148,090
Welltower Inc. 2,740,964 164,376
681,338
Hotel & Resort REITs (7.2%)
Apple Hospitality REIT
Inc. 1,574,816 30,693
Ashford Hospitality
Prime Inc. 190,216 1,716
Ashford Hospitality Trust
Inc. 723,642 4,660
Chatham Lodging Trust 337,300 7,555
Chesapeake Lodging Trust 447,156 12,239
DiamondRock Hospitality
Co. 1,488,471 17,504
Financial Statements
Statement of Net AssetsAs of January 31, 2018
The fund reports a complete list of its holdings in regulatory filings four times in each fiscal year, at
the quarter-ends. For the second and fourth fiscal quarters, the lists appear in the fund’s semiannual
and annual reports to shareholders. For the first and third fiscal quarters, the fund files the lists with
the Securities and Exchange Commission on Form N-Q. Shareholders can look up the fund’s Forms
N-Q on the SEC’s website at sec.gov. Forms N-Q may also be reviewed and copied at the SEC’s
Public Reference Room (see the back cover of this report for further information).
REIT II Index Fund
7
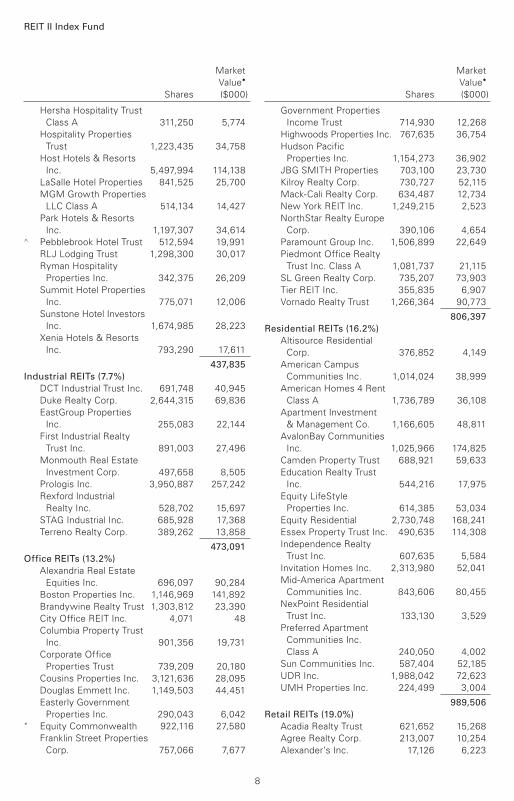
REIT II Index Fund
Market
Value•
Shares ($000)
Market
Value•
Shares ($000)
Hersha Hospitality Trust
Class A 311,250 5,774
Hospitality Properties
Trust 1,223,435 34,758
Host Hotels & Resorts
Inc. 5,497,994 114,138
LaSalle Hotel Properties 841,525 25,700
MGM Growth Properties
LLC Class A 514,134 14,427
Park Hotels & Resorts
Inc. 1,197,307 34,614^ Pebblebrook Hotel Trust 512,594 19,991
RLJ Lodging Trust 1,298,300 30,017
Ryman Hospitality
Properties Inc. 342,375 26,209
Summit Hotel Properties
Inc. 775,071 12,006
Sunstone Hotel Investors
Inc. 1,674,985 28,223
Xenia Hotels & Resorts
Inc. 793,290 17,611
437,835
Industrial REITs (7.7%)
DCT Industrial Trust Inc. 691,748 40,945
Duke Realty Corp. 2,644,315 69,836
EastGroup Properties
Inc. 255,083 22,144
First Industrial Realty
Trust Inc. 891,003 27,496
Monmouth Real Estate
Investment Corp. 497,658 8,505
Prologis Inc. 3,950,887 257,242
Rexford Industrial
Realty Inc. 528,702 15,697
STAG Industrial Inc. 685,928 17,368
Terreno Realty Corp. 389,262 13,858
473,091
Office REITs (13.2%)
Alexandria Real Estate
Equities Inc. 696,097 90,284
Boston Properties Inc. 1,146,969 141,892
Brandywine Realty Trust 1,303,812 23,390
City Office REIT Inc. 4,071 48
Columbia Property Trust
Inc. 901,356 19,731
Corporate Office
Properties Trust 739,209 20,180
Cousins Properties Inc. 3,121,636 28,095
Douglas Emmett Inc. 1,149,503 44,451
Easterly Government
Properties Inc. 290,043 6,042* Equity Commonwealth 922,116 27,580
Franklin Street Properties
Corp. 757,066 7,677
Government Properties
Income Trust 714,930 12,268
Highwoods Properties Inc. 767,635 36,754
Hudson Pacific
Properties Inc. 1,154,273 36,902
JBG SMITH Properties 703,100 23,730
Kilroy Realty Corp. 730,727 52,115
Mack-Cali Realty Corp. 634,487 12,734
New York REIT Inc. 1,249,215 2,523
NorthStar Realty Europe
Corp. 390,106 4,654
Paramount Group Inc. 1,506,899 22,649
Piedmont Office Realty
Trust Inc. Class A 1,081,737 21,115
SL Green Realty Corp. 735,207 73,903
Tier REIT Inc. 355,835 6,907
Vornado Realty Trust 1,266,364 90,773
806,397
Residential REITs (16.2%)
Altisource Residential
Corp. 376,852 4,149
American Campus
Communities Inc. 1,014,024 38,999
American Homes 4 Rent
Class A 1,736,789 36,108
Apartment Investment
& Management Co. 1,166,605 48,811
AvalonBay Communities
Inc. 1,025,966 174,825
Camden Property Trust 688,921 59,633
Education Realty Trust
Inc. 544,216 17,975
Equity LifeStyle
Properties Inc. 614,385 53,034
Equity Residential 2,730,748 168,241
Essex Property Trust Inc. 490,635 114,308
Independence Realty
Trust Inc. 607,635 5,584
Invitation Homes Inc. 2,313,980 52,041
Mid-America Apartment
Communities Inc. 843,606 80,455
NexPoint Residential
Trust Inc. 133,130 3,529
Preferred Apartment
Communities Inc.
Class A 240,050 4,002
Sun Communities Inc. 587,404 52,185
UDR Inc. 1,988,042 72,623
UMH Properties Inc. 224,499 3,004
989,506
Retail REITs (19.0%)
Acadia Realty Trust 621,652 15,268
Agree Realty Corp. 213,007 10,254
Alexander’s Inc. 17,126 6,223
8

REIT II Index Fund
Market
Value•
Shares ($000)
Market
Value•
Shares ($000)
Brixmor Property Group
Inc. 2,264,926 36,760
CBL & Associates
Properties Inc. 1,271,914 7,072
Cedar Realty Trust Inc. 679,026 3,470
DDR Corp. 2,321,439 18,850
Federal Realty
Investment Trust 537,169 64,890
Getty Realty Corp. 249,230 6,540
GGP Inc. 4,588,053 105,663
Kimco Realty Corp. 3,162,303 50,312
Kite Realty Group Trust 619,849 10,450
Macerich Co. 893,405 57,687
National Retail
Properties Inc. 1,108,638 43,991
Pennsylvania REIT 519,417 5,797
Ramco-Gershenson
Properties Trust 589,979 7,799
Realty Income Corp. 2,039,118 108,461
Regency Centers Corp. 1,137,713 71,573
Retail Opportunity
Investments Corp. 815,732 14,985
Retail Properties of
America Inc. 1,717,103 20,691
Saul Centers Inc. 97,473 5,335^ Seritage Growth
Properties Class A 186,798 7,696
Simon Property Group
Inc. 2,309,768 377,347^ Tanger Factory Outlet
Centers Inc. 705,432 17,763
Taubman Centers Inc. 451,092 27,810
Urban Edge Properties 845,457 19,767
Urstadt Biddle Properties
Inc. Class A 221,535 4,302
Washington Prime
Group Inc. 1,381,637 9,091
Weingarten Realty
Investors 907,338 26,812
Whitestone REIT 286,850 3,769
1,166,428
Specialized REITs (18.3%)
American Tower Corp. 41,968 6,199
CatchMark Timber Trust
Inc. Class A 5,939 78
CoreCivic Inc. 878,180 20,383
CoreSite Realty Corp. 254,660 27,585
Crown Castle
International Corp. 31,588 3,562
CubeSmart 1,339,375 36,873
CyrusOne Inc. 644,920 37,205
Digital Realty Trust Inc. 1,524,786 170,700
EPR Properties 547,669 32,345
Equinix Inc. 579,485 263,776
Extra Space Storage Inc. 936,452 78,175
Farmland Partners Inc. 4,397 36
Four Corners Property
Trust Inc. 455,046 10,739
Gaming and Leisure
Properties Inc. 1,499,480 54,641
GEO Group Inc. 922,544 20,803
InfraREIT Inc. 2,132 40
Iron Mountain Inc. 1,969,004 68,974
Lamar Advertising Co.
Class A 11,106 800
Life Storage Inc. 346,207 28,770
National Storage
Affiliates Trust 366,707 9,303
Outfront Media Inc. 13,337 299
Potlatch Corp. 4,856 257
Public Storage 1,163,111 227,691
QTS Realty Trust Inc.
Class A 361,800 18,018
Rayonier Inc. 14,392 467* SBA Communications
Corp. Class A 10,024 1,749
Uniti Group Inc. 23,123 366
Weyerhaeuser Co. 89,445 3,358
1,123,192
Total Equity Real Estate
Investment Trusts (REITs)
(Cost $6,344,988) 6,121,218
Real Estate Management & Development (0.1%)
Diversified Real Estate Activities (0.0%) * Five Point Holdings LLC
Class A 1,550 21
RMR Group Inc. Class A 426 28* St. Joe Co. 4,027 76* Tejon Ranch Co. 1,478 32
157
Real Estate Development (0.0%) * Forestar Group Inc. 834 20* Howard Hughes Corp. 5,210 656
676
Real Estate Operating Companies (0.0%) * FRP Holdings Inc. 171 8
Kennedy-Wilson Holdings
Inc. 13,500 240
248
Real Estate Services (0.1%) * Altisource Portfolio
Solutions SA 1,443 40* CBRE Group Inc. Class A 37,980 1,735
HFF Inc. Class A 3,670 181
Jones Lang LaSalle Inc. 3,789 593* Marcus & Millichap Inc. 1,519 50
9
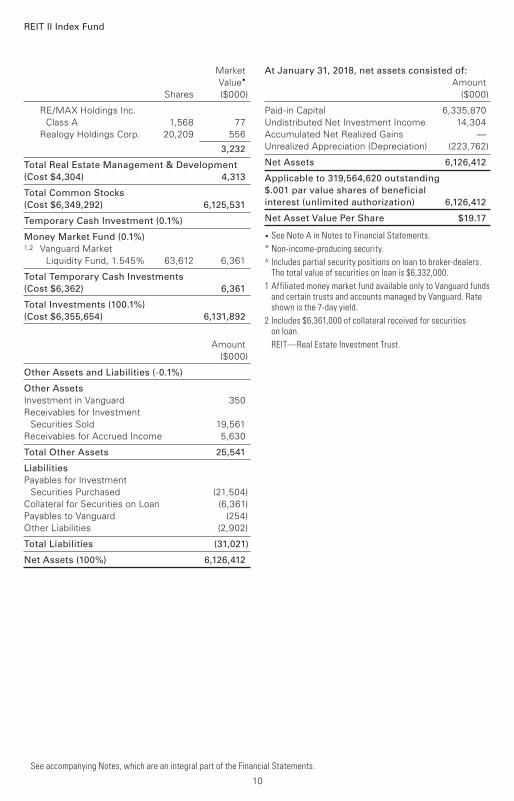
10
REIT II Index Fund
Market
Value•
Shares ($000)
At January 31, 2018, net assets consisted of:
Amount
($000)
RE/MAX Holdings Inc.
Class A 1,568 77
Realogy Holdings Corp. 20,209 556
3,232
Total Real Estate Management & Development
(Cost $4,304) 4,313
Total Common Stocks
(Cost $6,349,292) 6,125,531
Temporary Cash Investment (0.1%)
Money Market Fund (0.1%)1,2 Vanguard Market
Liquidity Fund, 1.545% 63,612 6,361
Total Temporary Cash Investments
(Cost $6,362) 6,361
Total Investments (100.1%)
(Cost $6,355,654) 6,131,892
Amount
($000)
Other Assets and Liabilities (-0.1%)
Other Assets
Investment in Vanguard 350
Receivables for Investment
Securities Sold 19,561
Receivables for Accrued Income 5,630
Total Other Assets 25,541
Liabilities
Payables for Investment
Securities Purchased (21,504)
Collateral for Securities on Loan (6,361)
Payables to Vanguard (254)
Other Liabilities (2,902)
Total Liabilities (31,021)
Net Assets (100%) 6,126,412
Paid-in Capital 6,335,870
Undistributed Net Investment Income 14,304
Accumulated Net Realized Gains —
Unrealized Appreciation (Depreciation) (223,762)
Net Assets 6,126,412
Applicable to 319,564,620 outstanding
$.001 par value shares of beneficial
interest (unlimited authorization) 6,126,412
Net Asset Value Per Share $19.17
• See Note A in Notes to Financial Statements.
* Non-income-producing security.
^ Includes partial security positions on loan to broker-dealers. The total value of securities on loan is $6,332,000.
1 Affiliated money market fund available only to Vanguard funds and certain trusts and accounts managed by Vanguard. Rate shown is the 7-day yield.
2 Includes $6,361,000 of collateral received for securities on loan.
REIT—Real Estate Investment Trust.
See accompanying Notes, which are an integral part of the Financial Statements.

11
September 26, 20171 to
January 31, 2018
($000)
Investment Income
Income
Dividends2 86,840
Securities Lending—Net 13
Total Income 86,853
Expenses
The Vanguard Group—Note B
Investment Advisory Services 123
Management and Administrative 1,467
Marketing and Distribution 129
Custodian Fees 22
Auditing Fees 17
Trustees' Fees and Expenses 1
Total Expenses 1,759
Net Investment Income 85,094
Realized Net Gain (Loss)
Capital Gain Distributions Received 13,700
Investment Securities Sold2 (4,138)
Futures Contracts 27
Realized Net Gain (Loss) 9,589
Change in Unrealized Appreciation (Depreciation) of Investment Securities2 (223,762)
Net Increase (Decrease) in Net Assets Resulting from Operations (129,079)
1 Inception.
2 Interest income, realized net gain (loss), and change in unrealized appreciation (depreciation) from an affiliated company of the fund were $0, ($1,000), and ($1,000) respectively.
Statement of Operations
REIT II Index Fund
See accompanying Notes, which are an integral part of the Financial Statements.

Statement of Changes in Net Assets
REIT II Index Fund
See accompanying Notes, which are an integral part of the Financial Statements.
September 26, 20171 to
January 31, 2018
($000)
Increase (Decrease) in Net Assets
Operations
Net Investment Income 85,094
Realized Net Gain (Loss) 9,589
Change in Unrealized Appreciation (Depreciation) (223,762)
Net Increase (Decrease) in Net Assets Resulting from Operations (129,079)
Distributions
Net Investment Income (70,790)
Realized Capital Gain (9,589)
Return of Capital (2,954)
Total Distributions (83,333)
Capital Share Transactions
Issued 6,255,491
Issued in Lieu of Cash Distributions 83,333
Redeemed —
Net Increase (Decrease) from Capital Share Transactions 6,338,824
Total Increase (Decrease) 6,126,412
Net Assets
Beginning of Period —
End of Period2 6,126,412
1 Inception.
2 Net Assets—End of Period includes undistributed (overdistributed) net investment income of $14,304,000.
12

September 26, 20171 to
For a Share Outstanding Throughout the Period January 31, 2018
Net Asset Value, Beginning of Period $20.00
Investment Operations
Net Investment Income2 .268
Net Realized and Unrealized Gain (Loss) on Investments (.834)
Total from Investment Operations (.566)
Distributions
Dividends from Net Investment Income (.225)
Distributions from Realized Capital Gains (.030)
Return of Capital (.009)
Total Distributions (.264)
Net Asset Value, End of Period $19.17
Total Return -2.89%
Ratios/Supplemental Data
Net Assets, End of Period (Millions) $6,126
Ratio of Total Expenses to Average Net Assets 0.08%3
Ratio of Net Investment Income to Average Net Assets 3.84%3
Portfolio Turnover Rate 1%
1 Inception.
2 Calculated based on average shares outstanding.
3 Annualized.
Financial Highlights
See accompanying Notes, which are an integral part of the Financial Statements.
REIT II Index Fund
13

14
Notes to Financial Statements
REIT II Index Fund
Vanguard REIT II Index Fund is registered under the Investment Company Act of 1940 as an open-
end investment company, or mutual fund. The fund is a wholly owned subsidiary of Vanguard REIT
Index Fund (“REIT”), and at January 31, 2018, REIT was the record or beneficial owner of 100%
of the fund’s net assets. As part of REIT’s principal investment strategy, it attempts to replicate
the benchmark index by investing all, or substantially all, of its assets—either directly or indirectly
through the fund—in the stocks that make up the index.
A. The following significant accounting policies conform to generally accepted accounting principles
for U.S. investment companies. The fund consistently follows such policies in preparing its financial
statements.
1. Security Valuation: Securities are valued as of the close of trading on the New York Stock
Exchange (generally 4 p.m., Eastern time) on the valuation date. Equity securities are valued at
the latest quoted sales prices or official closing prices taken from the primary market in which
each security trades; such securities not traded on the valuation date are valued at the mean of the
latest quoted bid and asked prices. Securities for which market quotations are not readily available,
or whose values have been materially affected by events occurring before the fund’s pricing time
but after the close of the securities’ primary markets, are valued by methods deemed by the board
of trustees to represent fair value. Investments in Vanguard Market Liquidity Fund are valued at that
fund’s net asset value.
2. Futures Contracts: The fund uses index futures contracts to a limited extent, with the objectives
of maintaining full exposure to the stock market, maintaining liquidity, and minimizing transaction
costs. The fund may purchase futures contracts to immediately invest incoming cash in the market,
or sell futures in response to cash outflows, thereby simulating a fully invested position in the
underlying index while maintaining a cash balance for liquidity. The primary risks associated
with the use of futures contracts are imperfect correlation between changes in market values
of stocks held by the fund and the prices of futures contracts, and the possibility of an illiquid
market. Counterparty risk involving futures is mitigated because a regulated clearinghouse is
the counterparty instead of the clearing broker. To further mitigate counterparty risk, the fund
trades futures contracts on an exchange, monitors the financial strength of its clearing brokers
and clearinghouse, and has entered into clearing agreements with its clearing brokers. The
clearinghouse imposes initial margin requirements to secure the fund’s performance and requires
daily settlement of variation margin representing changes in the market value of each contract.
Futures contracts are valued at their quoted daily settlement prices. The aggregate settlement
values of the contracts are not recorded in the Statement of Net Assets. Fluctuations in the value
of the contracts are recorded in the Statement of Net Assets as an asset (liability) and in the
Statement of Operations as unrealized appreciation (depreciation) until the contracts are closed,
when they are recorded as realized futures gains (losses).
During the year ended January 31, 2018, the fund’s average investments in long and short futures
contracts represented less than 1% and 0% of net assets, respectively, based on the average of
aggregate settlement values at each quarter-end during the period. The fund had no open futures
contracts at January 31, 2018.
3. Federal Income Taxes: The fund intends to qualify as a regulated investment company and
distribute all of its taxable income. Management has analyzed the fund’s tax positions taken for
its open federal income tax period ended January 31, 2018, and has concluded that no provision
for federal income tax is required in the fund’s financial statements.

15
REIT II Index Fund
4. Distributions: Distributions to shareholders are recorded on the ex-dividend date. The portion of
distributions that exceeds a fund’s current and accumulated earnings and profits, as measured on a
tax basis, constitute a non-taxable return of capital.
5. Securities Lending: To earn additional income, the fund lends its securities to qualified institutional
borrowers. Security loans are subject to termination by the fund at any time, and are required to
be secured at all times by collateral in an amount at least equal to the market value of securities
loaned. Daily market fluctuations could cause the value of loaned securities to be more or less than
the value of the collateral received. When this occurs, the collateral is adjusted and settled on the
next business day. The fund further mitigates its counterparty risk by entering into securities
lending transactions only with a diverse group of prequalified counterparties, monitoring their
financial strength, and entering into master securities lending agreements with its counterparties.
The master securities lending agreements provide that, in the event of a counterparty’s default
(including bankruptcy), the fund may terminate any loans with that borrower, determine the net
amount owed, and sell or retain the collateral up to the net amount owed to the fund; however,
such actions may be subject to legal proceedings. While collateral mitigates counterparty risk,
in the event of a default, the fund may experience delays and costs in recovering the securities
loaned. The fund invests cash collateral received in Vanguard Market Liquidity Fund, and records a
liability in the Statement of Net Assets for the return of the collateral, during the period the securities
are on loan. Securities lending income represents fees charged to borrowers plus income earned
on invested cash collateral, less expenses associated with the loan. During the term of the loan,
the fund is entitled to all distributions made on or in respect of the loaned securities.
6. Credit Facility: The fund and certain other funds managed by The Vanguard Group (“Vanguard”)
participate in a $3.1 billion committed credit facility provided by a syndicate of lenders pursuant to
a credit agreement that may be renewed annually; each fund is individually liable for its borrowings,
if any, under the credit facility. Borrowings may be utilized for temporary and emergency purposes,
and are subject to the fund’s regulatory and contractual borrowing restrictions. The participating
funds are charged administrative fees and an annual commitment fee of 0.10% of the undrawn
amount of the facility; these fees are allocated to the funds based on a method approved by the
fund’s board of trustees and included in Management and Administrative expenses on the fund’s
Statement of Operations. Any borrowings under this facility bear interest at a rate based upon the
higher of the one-month London Interbank Offered Rate, federal funds effective rate, or overnight
bank funding rate plus an agreed-upon spread.
The fund had no borrowings outstanding at January 31, 2018, or at any time during the period
then ended.
7. Other: Distributions received from REITs are recorded on the ex-dividend date. Each REIT reports
annually the tax character of its distributions. Dividend income, capital gain distributions received,
and unrealized appreciation (depreciation) reflect the amounts of taxable income, capital gain, and
return of capital reported by the REITs, and management’s estimates of such amounts for REIT
distributions for which actual information has not been reported. Premiums and discounts on debt
securities purchased are amortized and accreted, respectively, to interest income over the lives of
the respective securities. Security transactions are accounted for on the date securities are bought
or sold. Costs used to determine realized gains (losses) on the sale of investment securities are
those of the specific securities sold. Fees assessed on redemptions of capital shares are credited
to paid-in capital.

16
REIT II Index Fund
B. In accordance with the terms of a Funds’ Service Agreement (the “FSA”) between Vanguard
and the fund, Vanguard furnishes to the fund investment advisory, corporate management,
administrative, marketing, and distribution services at Vanguard’s cost of operations (as defined
by the FSA). These costs of operations are allocated to the fund based on methods and guidelines
approved by the board of trustees. Vanguard does not require reimbursement in the current period
for certain costs of operations (such as deferred compensation/benefits and risk/insurance costs);
the fund’s liability for these costs of operations is included in Payables to Vanguard on the
Statement of Net Assets.
Upon the request of Vanguard, the fund may invest up to 0.40% of its net assets as capital in
Vanguard. At January 31, 2018, the fund had contributed to Vanguard capital in the amount of
$350,000, representing 0.01% of the fund’s net assets and 0.14% of Vanguard’s capitalization.
The fund’s trustees and officers are also directors and employees, respectively, of Vanguard.
C. Various inputs may be used to determine the value of the fund’s investments. These inputs are
summarized in three broad levels for financial statement purposes. The inputs or methodologies
used to value securities are not necessarily an indication of the risk associated with investing in
those securities.
Level 1—Quoted prices in active markets for identical securities.
Level 2—Other significant observable inputs (including quoted prices for similar securities, interest
rates, prepayment speeds, credit risk, etc.).
Level 3—Significant unobservable inputs (including the fund’s own assumptions used to determine
the fair value of investments). Any investments valued with significant unobservable inputs are
noted on the Statement of Net Assets.
At January 31, 2018, 100% of the market value of the fund’s investments was determined based
on Level 1 inputs.
D. Distributions are determined on a tax basis and may differ from net investment income and
realized capital gains for financial reporting purposes. Differences may be permanent or temporary.
Permanent differences are reclassified among capital accounts in the financial statements to reflect
their tax character. Temporary differences arise when certain items of income, expense, gain, or
loss are recognized in different periods for financial statement and tax purposes. These differences
will reverse at some time in the future. Differences in classification may also result from the
treatment of short-term gains as ordinary income for tax purposes.
At January 31, 2018, the cost of investment securities for tax purposes was $6,355,654,000. Net
unrealized depreciation of investment securities for tax purposes was $223,762,000, consisting of
unrealized gains of $174,893,000 on securities that had risen in value since their purchase and
$398,655,000 in unrealized losses on securities that had fallen in value since their purchase.
E. During the year ended January 31, 2018, the fund purchased $6,433,959,000 of investment
securities and sold $73,351,000 of investment securities, other than temporary cash investments.
Purchases and sales include $6,255,490,000 and $0, respectively, in connection with in-kind
purchases and redemptions of the fund’s capital shares.
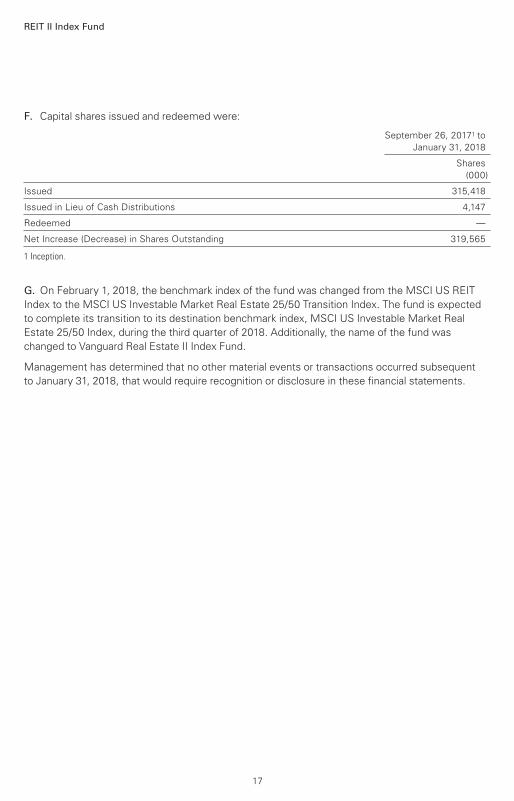
17
REIT II Index Fund
F. Capital shares issued and redeemed were:
September 26, 20171 to
January 31, 2018
Shares
(000)
Issued 315,418
Issued in Lieu of Cash Distributions 4,147
Redeemed —
Net Increase (Decrease) in Shares Outstanding 319,565
1 Inception.
G. On February 1, 2018, the benchmark index of the fund was changed from the MSCI US REIT
Index to the MSCI US Investable Market Real Estate 25/50 Transition Index. The fund is expected
to complete its transition to its destination benchmark index, MSCI US Investable Market Real
Estate 25/50 Index, during the third quarter of 2018. Additionally, the name of the fund was
changed to Vanguard Real Estate II Index Fund.
Management has determined that no other material events or transactions occurred subsequent
to January 31, 2018, that would require recognition or disclosure in these financial statements.

To the Board of Trustees of Vanguard Fixed Income Securities Funds and Shareholders of Vanguard
Real Estate II Index Fund (formerly known as Vanguard REIT II Index Fund)
Opinion on the Financial Statements
We have audited the accompanying statement of net assets of Vanguard REIT II Index Fund
(one of the funds constituting Vanguard Fixed Income Securities Funds, referred to hereafter as
the "Fund”) as of January 31, 2018, and the related statements of operations and changes in net
assets, including the related notes, and the financial highlights for the period September 26, 2017
(commencement of operations) through January 31, 2018 (collectively referred to as the “financial
statements”). In our opinion, the financial statements present fairly, in all material respects, the
financial position of the Fund as of January 31, 2018, and the results of its operations, changes in
its net assets, and the financial highlights for the period September 26, 2017 (commencement of
operations) through January 31, 2018 in conformity with accounting principles generally accepted
in the United States of America.
Basis for Opinion
These financial statements are the responsibility of the Fund’s management. Our responsibility
is to express an opinion on the Fund’s financial statements based on our audit. We are a public
accounting firm registered with the Public Company Accounting Oversight Board (United States)
(“PCAOB”) and are required to be independent with respect to the Fund in accordance with the
U.S. federal securities laws and the applicable rules and regulations of the Securities and Exchange
Commission and the PCAOB.
We conducted our audit of these financial statements in accordance with the standards of the
PCAOB. Those standards require that we plan and perform the audit to obtain reasonable
assurance about whether the financial statements are free of material misstatement, whether
due to error or fraud.
Our audit included performing procedures to assess the risks of material misstatement of the
financial statements, whether due to error or fraud, and performing procedures that respond to
those risks. Such procedures included examining, on a test basis, evidence regarding the amounts
and disclosures in the financial statements. Our audit also included evaluating the accounting
principles used and significant estimates made by management, as well as evaluating the overall
presentation of the financial statements. Our procedures included confirmation of securities owned
as of January 31, 2018 by correspondence with the custodian and brokers and by agreement to the
underlying ownership records of the transfer agent; when replies were not received from brokers,
we performed other auditing procedures. We believe that our audit provides a reasonable basis for
our opinion.
/s/PricewaterhouseCoopers LLP
Philadelphia, Pennsylvania
March 15, 2018
We have served as the auditor of one or more investment companies in The Vanguard Group of
Funds since 1975.
Report of Independent Registered Public Accounting Firm
18

Special 2017 tax information (unaudited) for Vanguard REIT II Index Fund
This information for the fiscal year ended January 31, 2018, is included pursuant to provisions
of the Internal Revenue Code.
The fund distributed $9,589,000 as capital gain dividends (from net long-term capital gains) to
shareholders during the fiscal year. The fund designated $9,589,000 of its capital gain dividends
as unrecaptured section 1250 gain distribution ( 25% rate gain).
The fund distributed $6,184,000 of qualified dividend income to shareholders during the fiscal year.
19
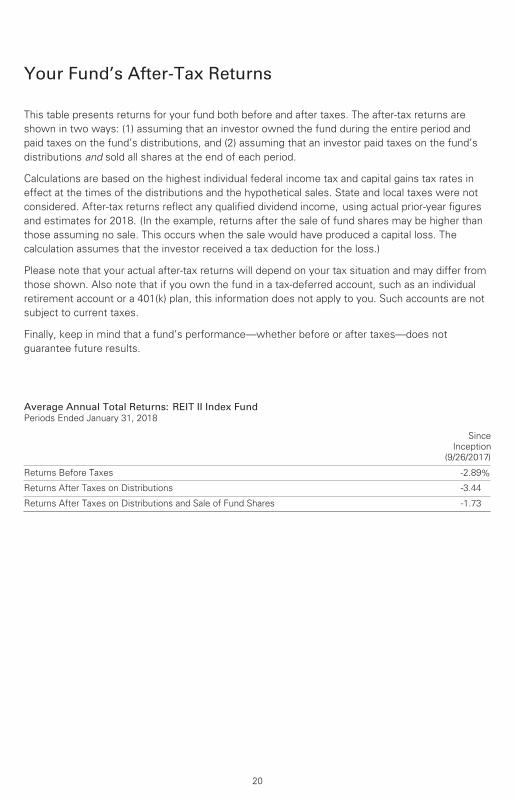
Your Fund’s After-Tax Returns
20
This table presents returns for your fund both before and after taxes. The after-tax returns are
shown in two ways: (1) assuming that an investor owned the fund during the entire period and
paid taxes on the fund’s distributions, and (2) assuming that an investor paid taxes on the fund’s
distributions and sold all shares at the end of each period.
Calculations are based on the highest individual federal income tax and capital gains tax rates in
effect at the times of the distributions and the hypothetical sales. State and local taxes were not
considered. After-tax returns reflect any qualified dividend income, using actual prior-year figures
and estimates for 2018. (In the example, returns after the sale of fund shares may be higher than
those assuming no sale. This occurs when the sale would have produced a capital loss. The
calculation assumes that the investor received a tax deduction for the loss.)
Please note that your actual after-tax returns will depend on your tax situation and may differ from
those shown. Also note that if you own the fund in a tax-deferred account, such as an individual
retirement account or a 401(k) plan, this information does not apply to you. Such accounts are not
subject to current taxes.
Finally, keep in mind that a fund’s performance—whether before or after taxes—does not
guarantee future results.
Average Annual Total Returns: REIT II Index Fund Periods Ended January 31, 2018
Since
Inception
(9/26/2017)
Returns Before Taxes -2.89%
Returns After Taxes on Distributions -3.44
Returns After Taxes on Distributions and Sale of Fund Shares -1.73
About Your Fund’s Expenses
21
As a shareholder of the fund, you incur ongoing costs, which include costs for portfolio management,
administrative services, and shareholder reports (like this one), among others. Operating expenses,
which are deducted from a fund’s gross income, directly reduce the investment return of the fund.
A fund’s expenses are expressed as a percentage of its average net assets. This figure is known as
the expense ratio. The following examples are intended to help you understand the ongoing costs (in
dollars) of investing in your fund and to compare these costs with those of other mutual funds. The
examples are based on an investment of $1,000 made at the beginning of the period shown and held
for the entire period.
The accompanying table illustrates your fund’s costs in two ways:
• Based on actual fund return. This section helps you to estimate the actual expenses that you
paid over the period. The ”Ending Account Value“ shown is derived from the fund‘s actual return,
and the third column shows the dollar amount that would have been paid by an investor who started
with $1,000 in the fund. You may use the information here, together with the amount you invested,
to estimate the expenses that you paid over the period.
To do so, simply divide your account value by $1,000 (for example, an $8,600 account value divided
by $1,000 = 8.6), then multiply the result by the number given for your fund under the heading
”Expenses Paid During Period.“
• Based on hypothetical 5% yearly return. This section is intended to help you compare your
fund‘s costs with those of other mutual funds. It assumes that the fund had a yearly return of 5%
before expenses, but that the expense ratio is unchanged. In this case—because the return used is
not the fund’s actual return—the results do not apply to your investment. The example is useful in
making comparisons because the Securities and Exchange Commission requires all mutual funds to
calculate expenses based on a 5% return. You can assess your fund’s costs by comparing this
hypothetical example with the hypothetical examples that appear in shareholder reports of other
funds.
Note that the expenses shown in the table are meant to highlight and help you compare ongoingcosts only and do not reflect transaction costs incurred by the fund for buying and sellingsecurities. Further, the expenses do not include any purchase, redemption, or account servicefees described in the fund prospectus. If such fees were applied to your account, your costswould be higher. Your fund does not carry a “sales load.”
The calculations assume no shares were bought or sold during the period. Your actual costs may
have been higher or lower, depending on the amount of your investment and the timing of any
purchases or redemptions.
You can find more information about the fund’s expenses, including annual expense ratios, in the
Financial Statements section of this report. For additional information on operating expenses and
other shareholder costs, please refer to your fund’s current prospectus.

22
Period Ended January 31, 2018
REIT II Index Fund
Beginning
Account Value
9/26/2017
Ending
Account Value
1/31/2018
Expenses
Paid During
Period
Based on Actual Fund Return $1,000.00 $971.11 $0.40
Based on Hypothetical 5% Yearly Return 1,000.00 982.20 0.40
The calculations are based on expenses incurred in the most recent period. The fund’s annualized expense ratio for that period is 0.08%.The dollar amounts shown as “Expenses Paid” are equal to the annualized expense ratio multiplied by the average account value over theperiod, multiplied by the number of days in the period since inception September 26, 2017, to January 31, 2018, then divided by thenumber of days in the most recent 12-month period (128/365).

Effective September 2017, the board of Vanguard Fixed Income Securities Funds approved the
launch of Vanguard REIT II Index Fund, which utilizes an internalized management structure
whereby The Vanguard Group, Inc. (Vanguard), through its Equity Index Group, would provide
investment advisory services to the fund. The board determined that the investment advisory
arrangement with Vanguard was in the best interests of the fund and its prospective shareholders.
The board based its decision upon an evaluation of the advisor’s investment staff, portfolio
management process, and performance. This evaluation included information provided to the board
by Vanguard’s Portfolio Review Department, which is responsible for fund and advisor oversight
and product management. The trustees considered the factors discussed below, among others.
However, no single factor determined whether the board approved the arrangement. Rather, it
was the totality of the circumstances that drove the board’s decision.
Nature, extent, and quality of services
The board considered the quality of the investment management services to be provided to the
fund and took into account the organizational depth and stability of the advisor. The board noted
that Vanguard has been managing investments for more than three decades. The Equity Index
Group adheres to a sound, disciplined investment management process; the team has considerable
experience, stability, and depth.
The board concluded that Vanguard’s experience, stability, depth, and performance, among other
factors, warranted approval of the advisory arrangement.
Investment performance
The board determined that the Equity Index Group, in its management of other Vanguard funds,
has a track record of consistent performance and disciplined investment processes. Information
about the fund’s performance since inception can be found in the Performance Summary section
of this report.
Cost
The board concluded that the fund’s expense ratio will be well below the average expense ratio
charged by funds in its peer group. Information about the fund’s expenses appears in the About
Your Fund’s Expenses section as well as in the Financial Statements section.
The board does not conduct a profitability analysis of Vanguard because of Vanguard’s unique
“at-cost” structure. Unlike most other mutual fund management companies, Vanguard is owned
by the funds it oversees and produces “profits” only in the form of reduced expenses for fund
shareholders.
The benefit of economies of scale
The board concluded that Vanguard’s at-cost arrangement with the fund ensures that the fund
will realize economies of scale as it grows, with the cost to shareholders declining as fund assets
increase.
The board will consider whether to renew the advisory arrangement after a one-year period.
Trustees Approve Advisory Arrangement
23

Glossary
24
Dividend Yield. Dividend income earned by stocks, expressed as a percentage of the aggregate
market value (or of net asset value, for a fund). The yield is determined by dividing the amount of
the annual dividends by the aggregate value (or net asset value) at the end of the period. For a
fund, the dividend yield is based solely on stock holdings and does not include any income
produced by other investments. This yield may include some payments that represent a return of
capital, capital gains distributions, or both by the underlying stocks.
Earnings Growth Rate. The average annual rate of growth in earnings over the past five years for
the stocks now in a fund.
Expense Ratio. A fund’s total annual operating expenses expressed as a percentage of the fund’s
average net assets. The expense ratio includes management and administrative expenses, but
does not include the transaction costs of buying and selling portfolio securities.
Foreign Holdings. The percentage of a fund represented by securities or depositary receipts of
companies based outside the United States.
Inception Date. The date on which the assets of a fund (or one of its share classes) are first
invested in accordance with the fund’s investment objective. For funds with a subscription period,
the inception date is the day after that period ends. Investment performance is measured from
the inception date.
Median Market Cap. An indicator of the size of companies in which a fund invests; the midpoint
of market capitalization (market price x shares outstanding) of a fund’s stocks, weighted by the
proportion of the fund’s assets invested in each stock. Stocks representing half of the fund’s
assets have market capitalizations above the median, and the rest are below it.
Price/Book Ratio. The share price of a stock divided by its net worth, or book value, per share.
For a fund, the weighted average price/book ratio of the stocks it holds.
Price/Earnings Ratio. The ratio of a stock’s current price to its per-share earnings over the past
year. For a fund, the weighted average P/E of the stocks it holds. P/E is an indicator of market
expectations about corporate prospects; the higher the P/E, the greater the expectations for a
company’s future growth.
Return on Equity. The annual average rate of return generated by a company during the past five
years for each dollar of shareholder’s equity (net income divided by shareholder’s equity). For a
fund, the weighted average return on equity for the companies whose stocks it holds.
Short-Term Reserves. The percentage of a fund invested in highly liquid, short-term securities
that can be readily converted to cash.
Turnover Rate. An indication of the fund’s trading activity. Funds with high turnover rates incur
higher transaction costs and may be more likely to distribute capital gains (which may be taxable
to investors). The turnover rate excludes in-kind transactions, which have minimal impact on
costs.

The Global Industry Classification Standard (“GICS”) was developed by and is the exclusive property and a service mark
of MSCI Inc. (“MSCI”) and Standard and Poor’s, a division of McGraw-Hill Companies, Inc. (“S&P”), and is licensed for use
by Vanguard. Neither MSCI, S&P nor any third party involved in making or compiling the GICS or any GICS classification
makes any express or implied warranties or representations with respect to such standard or classification (or the results
to be obtained by the use thereof), and all such parties hereby expressly disclaim all warranties of originality, accuracy,
completeness, merchantability or fitness for a particular purpose with respect to any such standard or classification.
Without limiting any of the foregoing, in no event shall MSCI, S&P, any of its affiliates or any third party involved in
making or compiling the GICS or any GICS classification have any liability for any direct, indirect, special, punitive,
consequential or any other damages (including lost profits) even if notified of the possibility of such damages.
25

The People Who Govern Your Fund
The trustees of your mutual fund are there to see that the fund is operated and managed in your
best interests since, as a shareholder, you are a part owner of the fund. Your fund’s trustees also
serve on the board of directors of The Vanguard Group, Inc., which is owned by the Vanguard
funds and provides services to them on an at-cost basis.
A majority of Vanguard’s board members are independent, meaning that they have no affiliation
with Vanguard or the funds they oversee, apart from the sizable personal investments they have
made as private individuals. The independent board members have distinguished backgrounds
in business, academia, and public service. Each of the trustees and executive officers oversees
201 Vanguard funds.
Information for each trustee and executive officer of the fund appears below. The mailing address
of the trustees and officers is P.O. Box 876, Valley Forge, PA 19482. More information about the
trustees is in the Statement of Additional Information, which can be obtained, without charge,
by contacting Vanguard at 800-662-7447, or online at vanguard.com.
Interested Trustees1
F. William McNabb III
Mr. McNabb has served as chairman of the board of
Vanguard and of each of the investment companies
served by Vanguard since January 2010; as a trustee of
each of the investment companies served by Vanguard
since 2009; and as director of Vanguard since 2008.
Mr. McNabb served as chief executive officer and
president of Vanguard and each of the investment
companies served by Vanguard from 2008 to 2017
and as a managing director of Vanguard from 1995
to 2008. Mr. McNabb also serves as a director of
Vanguard Marketing Corporation. He was born in 1957.
Mortimer J. Buckley
Mr. Buckley has served as chief executive officer
of Vanguard since January 2018; as chief executive
officer, president, and trustee of each of the
investment companies served by Vanguard since
January 2018; and as president and director of
Vanguard since 2017. Previous positions held by
Mr. Buckley at Vanguard include chief investment
officer (2013–2017), head of the Retail Investor
Group (2006–2012), and chief information officer
(2001–2006). Mr. Buckley also served as chairman
of the board of the Children’s Hospital of Philadelphia
from 2011 to 2017. He was born in 1969.
Independent Trustees
Emerson U. Fullwood
Mr. Fullwood has served as trustee since July 2008.
Mr. Fullwood is the former executive chief staff and
marketing officer for North America and corporate
vice president (retired 2008) of Xerox Corporation
(document management products and services).
Previous positions held at Xerox by Mr. Fullwood
include president of the Worldwide Channels Group,
president of Latin America, executive chief staff
officer of Developing Markets, and president of
Worldwide Customer Services. Mr. Fullwood is
the executive in residence at the Rochester Institute
of Technology, where he was the 2009–2010
Distinguished Minett Professor. Mr. Fullwood
serves as lead director of SPX FLOW, Inc. (multi-
industry manufacturing); director of the University of
Rochester Medical Center, the Monroe Community
College Foundation, the United Way of Rochester,
North Carolina A&T University, and Roberts Wesleyan
College; and a trustee of the University of Rochester.
He was born in 1948.
Amy Gutmann
Dr. Gutmann has served as trustee since June 2006.
Dr. Gutmann has served as the president of the
University of Pennsylvania since 2004. She is the
Christopher H. Browne Distinguished Professor of
Political Science, School of Arts and Sciences, and
Professor of Communication, Annenberg School for
1 Mr. McNabb and Mr. Buckley are considered “interested persons,” as defined in the Investment Company Act of 1940, because they are officers of the Vanguard funds.

Communication, with secondary faculty appointments
in the Department of Philosophy, School of Arts and
Sciences, and at the Graduate School of Education,
University of Pennsylvania. Dr. Gutmann also serves
as a trustee of the National Constitution Center. She
was born in 1949.
JoAnn Heffernan Heisen
Ms. Heisen has served as trustee since July 1998.
Ms. Heisen is the former corporate vice president
of Johnson & Johnson (pharmaceuticals/medical
devices/consumer products) and a former member
of its executive committee (1997–2008). During her
tenure at Johnson & Johnson, Ms. Heisen held
multiple roles, including: chief global diversity officer
(retired 2008), vice president and chief information
officer (1997–2006), controller (1995–1997), treasurer
(1991–1995), and assistant treasurer (1989–1991).
Ms. Heisen serves as a director of Skytop Lodge
Corporation (hotels) and the Robert Wood Johnson
Foundation and as a member of the advisory board
of the Institute for Women’s Leadership at Rutgers
University. She was born in 1950.
F. Joseph Loughrey
Mr. Loughrey has served as trustee since October
2009. Mr. Loughrey is the former president and chief
operating officer (retired 2009) and vice chairman of
the board (2008–2009) of Cummins Inc. (industrial
machinery). Mr. Loughrey serves as chairman of the
board of Hillenbrand, Inc. (specialized consumer
services), Oxfam America, and the Lumina Foundation
for Education; as a director of the V Foundation for
Cancer Research; and as a member of the advisory
council for the College of Arts and Letters and chair
of the advisory board to the Kellogg Institute for
International Studies, both at the University of Notre
Dame. He was born in 1949.
Mark Loughridge
Mr. Loughridge has served as trustee since March
2012. Mr. Loughridge is the former senior vice
president and chief financial officer (retired 2013) at
IBM (information technology services). Mr. Loughridge
also served as a fiduciary member of IBM’s retirement
plan committee (2004–2013). Previous positions held
by Mr. Loughridge at IBM include senior vice president
and general manager of Global Financing (2002–2004),
vice president and controller (1998–2002), and a
variety of management roles. Mr. Loughridge serves
as a member of the Council on Chicago Booth. He
was born in 1953.
Scott C. Malpass
Mr. Malpass has served as trustee since March 2012.
Mr. Malpass has served as chief investment officer
since 1989 and as vice president since 1996 at the
University of Notre Dame. Mr. Malpass serves as an
assistant professor of finance at the Mendoza College
of Business at the University of Notre Dame and is
a member of the Notre Dame 403(b) investment
committee. Mr. Malpass also serves as chairman
of the board of TIFF Advisory Services, Inc.; as a
member of the board of Catholic Investment Services,
Inc. (investment advisors); as a member of the board
of advisors for Spruceview Capital Partners; and as
a member of the board of superintendence of the
Institute for the Works of Religion. He was born
in 1962.
Deanna Mulligan
Ms. Mulligan has served as trustee since January
2018. Ms. Mulligan has served as president since
2010 and chief executive officer since 2011 at
The Guardian Life Insurance Company of America.
Previous positions held by Ms. Mulligan at The
Guardian Life Insurance Company of America include
chief operating officer (2010–2011) and executive vice
president of Individual Life and Disability (2008–2010).
Ms. Mulligan serves as a board member of The
Guardian Life Insurance Company of America, the
American Council of Life Insurers, the Partnership
for New York City (business leadership), and the
Committee Encouraging Corporate Philanthropy. She
also serves as a trustee of the Economic Club of New
York and the Bruce Museum (arts and science) and
as a member of the Advisory Council for the Stanford
Graduate School of Business. She was born in 1963.
André F. Perold
Dr. Perold has served as trustee since December
2004. Dr. Perold is the George Gund Professor of
Finance and Banking, Emeritus at the Harvard
Business School (retired 2011). Dr. Perold serves
as chief investment officer and co-managing partner
of HighVista Strategies LLC (private investment firm).
Dr. Perold also serves as an overseer of the Museum
of Fine Arts Boston. He was born in 1952.
Sarah Bloom Raskin
Ms. Raskin has served as trustee since January 2018.
Ms. Raskin served as deputy secretary of the United
States Department of the Treasury (2014–2017), as a
governor of the Federal Reserve Board (2010–2014),
and as commissioner of financial regulation of the
State of Maryland (2007–2010). Ms. Raskin also
served as a member of the Neighborhood
Reinvestment Corporation’s board of directors
(2012–2014). Ms. Raskin serves as a director
of i(x) Investments, LLC. She was born in 1961.
Peter F. Volanakis
Mr. Volanakis has served as trustee since July 2009.
Mr. Volanakis is the retired president and chief
operating officer (retired 2010) of Corning Incorporated
(communications equipment) and a former director of
Corning Incorporated (2000–2010) and Dow Corning
(2001–2010). Mr. Volanakis served as a director of
SPX Corporation (multi-industry manufacturing)
(2012) and as an overseer of the Amos Tuck School
of Business Administration at Dartmouth College
(2001–2013). Mr. Volanakis serves as chairman of
the board of trustees of Colby-Sawyer College and is
a member of the board of Hypertherm Inc. (industrial
cutting systems, software, and consumables). He
was born in 1955.
Executive Officers
Glenn Booraem
Mr. Booraem, a principal of Vanguard, has served
as investment stewardship officer of each of the
investment companies served by Vanguard since
February 2017. Mr. Booraem served as treasurer
(2015–2017), controller (2010–2015), and assistant
controller (2001–2010) of each of the investment
companies served by Vanguard. He was born in 1967.
Christine M. Buchanan
Ms. Buchanan, a principal of Vanguard, has served
as treasurer of each of the investment companies
served by Vanguard since November 2017. She
also serves as global head of Fund Administration
at Vanguard. Ms. Buchanan served as a partner at
KPMG LLP (audit, tax, and advisory services)
(2005–2017). She was born in 1970.
Thomas J. Higgins
Mr. Higgins, a principal of Vanguard, has served
as chief financial officer of each of the investment
companies served by Vanguard since 2008.
Mr. Higgins served as treasurer of each of the
investment companies served by Vanguard
(1998–2008). He was born in 1957.
Peter Mahoney
Mr. Mahoney, a principal of Vanguard, has served
as controller of each of the investment companies
served by Vanguard since May 2015. Mr. Mahoney
served as head of International Fund Services at
Vanguard (2008–2014). He was born in 1974.
Anne E. Robinson
Ms. Robinson has served as general counsel
of Vanguard since September 2016; as secretary
of Vanguard and of each of the investment companies
served by Vanguard since September 2016; as director
and senior vice president of Vanguard Marketing
Corporation since September 2016; and as a
managing director of Vanguard since August 2016.
Ms. Robinson served as managing director and
general counsel of Global Cards and Consumer
Services at Citigroup (2014–2016). She served
as counsel at American Express (2003–2014).
She was born in 1970.
Michael Rollings
Mr. Rollings, a managing director of Vanguard since
June 2016, has served as finance director of each
of the investment companies served by Vanguard
since November 2017 and as a director of Vanguard
Marketing Corporation since June 2016. Mr. Rollings
served as treasurer of each of the investment
companies served by Vanguard from February 2017 to
November 2017. He also served as the executive vice
president and chief financial officer of MassMutual
Financial Group (2006–2016). He was born in 1963.
Vanguard Senior Management Team
Mortimer J. Buckley James M. Norris
Gregory Davis Thomas M. Rampulla
John James Karin A. Risi
Martha G. King Anne E. Robinson
John T. Marcante Michael Rollins
Chris D. McIsaac
Chairman Emeritus and Senior Advisor
John J. Brennan
Chairman, 1996–2009
Chief Executive Officer and President, 1996–2008
Founder
John C. Bogle
Chairman and Chief Executive Officer, 1974–1996

P.O. Box 2600
Valley Forge, PA 19482-2600
Connect with Vanguard® > vanguard.com
Fund Information > 800-662-7447
Direct Investor Account Services > 800-662-2739
Institutional Investor Services > 800-523-1036
Text Telephone for PeopleWho Are Deaf or Hard of Hearing > 800-749-7273
This material may be used in conjunctionwith the offering of shares of any Vanguardfund only if preceded or accompanied bythe fund’s current prospectus.
All comparative mutual fund data are from Lipper, aThomson Reuters Company, or Morningstar, Inc., unlessotherwise noted.
You can obtain a free copy of Vanguard’s proxy votingguidelines by visiting vanguard.com/proxyreporting or bycalling Vanguard at 800-662-2739. The guidelines arealso available from the SEC’s website, sec.gov. Inaddition, you may obtain a free report on how your fundvoted the proxies for securities it owned during the 12months ended June 30. To get the report, visit eithervanguard.com/proxyreporting or sec.gov.
You can review and copy information about your fund atthe SEC’s Public Reference Room in Washington, D.C. Tofind out more about this public service, call the SEC at202-551-8090. Information about your fund is alsoavailable on the SEC’s website, and you can receivecopies of this information, for a fee, by sending arequest in either of two ways: via email addressed [email protected] or via regular mail addressed to thePublic Reference Section, Securities and ExchangeCommission, Washington, DC 20549-1520.
Source for Bloomberg Barclays indexes: BloombergIndex Services Limited. Copyright 2017, Bloomberg. Allrights reserved.
© 2018 The Vanguard Group, Inc.All rights reserved.Vanguard Marketing Corporation, Distributor.
Q20230 032018