Embed Size (px)
Citation preview
Vanguard Wholesale International Equities Funds (Unhedged) and ETFs
Interim report for the period ended 31 December 2021
Responsible Entity
Vanguard Investments Australia Ltd. ABN 72 072 881 086 AFSL 227263
Level 13 130 Lonsdale Street Melbourne VIC 3000 Australia
Telephone: (03) 8888 3888 Facsimile: 1300 765 712
vanguard.com.au
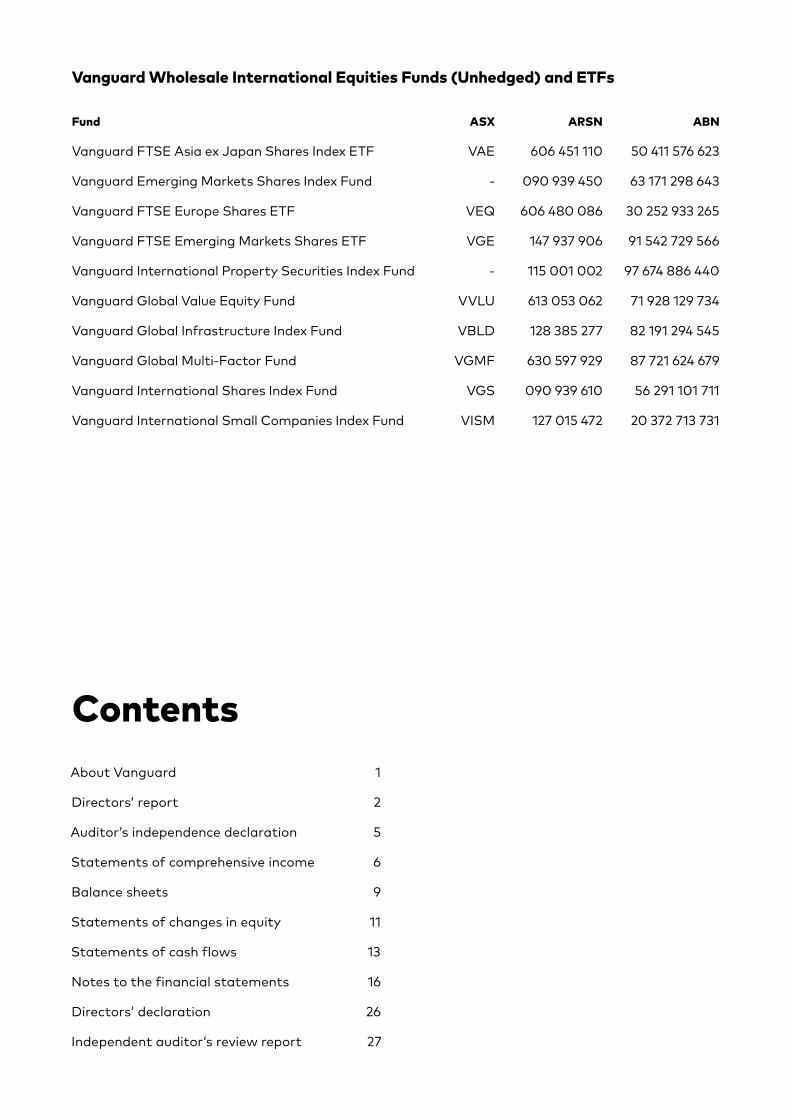
Vanguard Wholesale International Equities Funds (Unhedged) and ETFs
Fund ASX ARSN ABN
Vanguard FTSE Asia ex Japan Shares Index ETF VAE 606 451 110 50 411 576 623
Vanguard Emerging Markets Shares Index Fund - 090 939 450 63 171 298 643
Vanguard FTSE Europe Shares ETF VEQ 606 480 086 30 252 933 265
Vanguard FTSE Emerging Markets Shares ETF VGE 147 937 906 91 542 729 566
Vanguard International Property Securities Index Fund - 115 001 002 97 674 886 440
Vanguard Global Value Equity Fund VVLU 613 053 062 71 928 129 734
Vanguard Global Infrastructure Index Fund VBLD 128 385 277 82 191 294 545
Vanguard Global Multi-Factor Fund VGMF 630 597 929 87 721 624 679
Vanguard International Shares Index Fund VGS 090 939 610 56 291 101 711
Vanguard International Small Companies Index Fund VISM 127 015 472 20 372 713 731
ContentsAbout Vanguard 1
Directors’ report 2
Auditor’s independence declaration 5
Statements of comprehensive income 6
Balance sheets 9
Statements of changes in equity 11
Statements of cash flows 13
Notes to the financial statements 16
Directors’ declaration 26
Independent auditor’s review report 27
About Vanguard
Vanguard Wholesale International Equities Funds (Unhedged) and ETFs 1
Since our establishment in 1975, Vanguard has strived to be the world’s highest-value provider of investment products and services. We have an unwavering focus on our clients with a commitment to champion what’s best for investors by offering outstanding service, while keeping costs low.
Over the years Vanguard has built a reputation as a global leader in client advocacy and earned the trust of millions of investors along the way. Our sole purpose has been to align our interest with those of our investors to ensure they have the best chance for investment success.
With over AUD $11.6 trillion in assets under management globally as of 31 December 2021, including AUD $3 trillion in ETFs, Vanguard is one of the world’s largest global investment management companies.
In Australia, Vanguard has been serving financial advisers, retail clients and institutional investors for 25 years.
Our unique structure — putting investors’ interests firstWhat sets Vanguard apart — and allows Vanguard to put investors first around the world — is the ownership structure of The Vanguard Group, Inc., in the United States.
Rather than being publicly traded or owned by a small group of individuals, the Vanguard Group is owned by Vanguard’s US-domiciled funds and ETFs. Those funds, in turn, are owned by their investors.
This mutual structure aligns our interests with those of our investors and drives the culture, philosophy and policies throughout the Vanguard organisation worldwide. As a result, Australian investors benefit from Vanguard’s stability and experience, low costs and client focus.
Our investment expertiseWhen you invest with Vanguard, you have more than 40 years of investing experience behind you. So no matter which investment products suit your needs, you can feel confident that Vanguard investments are built on a rigorous investment philosophy that stands the test of time.
Low-cost investingWe know we can’t control the markets, but we can control the costs of investing. To that end, providing low-cost investments isn’t a pricing strategy for us. It’s how we do business.
We can keep costs low because of our unique ownership structure in the United States, which allows us to return profits to investors through lower costs.
Directors’ reportThe Responsible Entity of the Vanguard Wholesale International Equities Funds (Unhedged) and ETFs (the “Funds”) for thehalf-year ended 31 December 2021 was Vanguard Investments Australia Ltd (the “Responsible Entity”).
The directors of Vanguard Investments Australia Ltd present their report together with the financial statements for the half-yearended 31 December 2021.
Principal activities
The Funds invest in accordance with the investment policy of the Funds as set out in their respective Product DisclosureStatements (PDSs) and in accordance with the Funds’ Constitution. The Funds (except Vanguard Global Value Equity Fundand Vanguard Global Multi-Factor Fund) seek to track the returns of the Funds’ respective indices, before taking into accountfees, expenses and tax. Vanguard Global Value Equity Fund seeks to provide long term capital appreciation through an activeapproach that invests in global equity securities demonstrating value characteristics. Vanguard Global Multi-Factor Fundseeks to provide long-term capital appreciation and aims to outperform the FTSE Developed All Cap Index.
The ETF Class units of the Funds operate as Exchange Traded Funds (ETFs) listed on the Australian Securities Exchange(ASX).
The Funds did not have any employees during the half-year.
There were no significant changes in the nature of the activities of the Funds during the half-year.
Directors
The following persons held office as directors of the Responsible Entity during the half-year and up to the date of this report:
J Platt (Resigned 21 January 2022)
F Kolimago (Resigned 15 October 2021)
C McIsaac (Resigned 21 January 2022)
C Cosby (Resigned 31 December 2021)
D Shrimski
J Bendl (Appointed 21 January 2022)
C Jacques (Appointed 21 January 2022)
K Petersen (Appointed 21 January 2022)
Review and results of operations
The Funds invest in listed equity securities, listed unit trusts, derivatives and cash and cash equivalents. The investmentpolicy of the Funds continues to be in accordance with the provisions of the Funds’ Constitution.
Results
The results of the operations of the Funds were as follows:
Vanguard FTSE Asiaex Japan Shares
Index ETF
Vanguard EmergingMarkets Shares
Index Fund
VanguardFTSE EuropeShares ETF
Vanguard FTSEEmerging Markets
Shares ETF
31 Dec2021
31 Dec2020
31 Dec2021
31 Dec2020
31 Dec2021
31 Dec2020
31 Dec2021
31 Dec2020
Operating profit/(loss) before finance costsattributable to unitholders ($’000) (27,807) 33,643 (121,202) 194,621 14,783 13,497 (30,155) 50,497
Distributions - Wholesale Class
Distribution paid and payable ($’000) - - 22,332 19,153 - - - -
Distribution (cents per unit) - - 2.9528 3.1640 - - - -
Distributions - ETF Class
Distribution paid and payable ($’000) 4,287 2,720 - - 3,524 1,820 9,577 4,952
Distribution (cents per unit) 85.3096 83.5321 - - 76.9070 47.8914 110.1027 84.8518
2 Vanguard Interim Report
Directors’ report (continued)
Review and results of operations (continued)
Results (continued)
Vanguard InternationalProperty Securities
Index Fund
VanguardGlobal ValueEquity Fund
Vanguard GlobalInfrastructureIndex Fund
31 Dec2021
31 Dec2020
31 Dec2021
31 Dec2020
31 Dec2021
31 Dec2020
Operating profit/(loss) before finance costsattributable to unitholders ($’000) 337,041 54,750 20,814 6,342 157,729 (15,998)
Distributions - Wholesale Class
Distribution paid and payable ($’000) 77,395 25,048 1,093 58 18,710 12,327
Distribution (cents per unit) 3.9221 1.2933 2.8418 0.6840 2.1565 1.7492
Distributions - ETF Class
Distribution paid and payable ($’000) - - 4,861 319 2,034 1,595
Distribution (cents per unit) - - 93.8743 30.3511 58.7635 80.7304
Vanguard GlobalMulti-Factor
Fund
VanguardInternational Shares
Index Fund
Vanguard InternationalSmall Companies
Index Fund
31 Dec2021
31 Dec2020
31 Dec2021
31 Dec2020
31 Dec2021
31 Dec2020
Operating profit/(loss) before finance costsattributable to unitholders ($’000) 3,168 2,058 2,979,268 1,810,816 61,911 206,743
Distributions - Wholesale Class
Distribution paid and payable ($’000) 45 23 206,224 285,475 27,947 28,075
Distribution (cents per unit) 0.8915 0.6712 2.7426 4.1584 3.2850 4.0081
Distributions - ETF Class
Distribution paid and payable ($’000) 287 135 33,376 22,505 2,851 1,285
Distribution (cents per unit) 44.2389 35.3710 77.3757 74.8361 101.0566 104.3712
Distributions - B Class
Distribution paid and payable ($’000) - - 12,958 11,103 - -
Distribution (cents per unit) - - 75.2923 74.0414 - -
Significant changes in state of affairs
Frank Kolimago resigned as a Director of Vanguard Investments Australia Ltd on 15 October 2021.
Caroline Cosby resigned as a Director of Vanguard Investments Australia Ltd on 31 December 2021.
Chris Mclsaac resigned as a Director of Vanguard Investments Australia Ltd on 21 January 2022.
Jo Platt resigned as a Director of Vanguard Investments Australia Ltd on 21 January 2022.
John Bendl appointed as a Director of Vanguard Investments Australia Ltd on 21 January 2022.
Curt Jacques appointed as a Director of Vanguard Investments Australia Ltd on 21 January 2022.
Kim Petersen appointed as a Director of Vanguard Investments Australia Ltd on 21 January 2022.
Market disruptions associated with the COVID-19 pandemic have had a global impact, and uncertainty exists as to the long-term implications. Such disruptions can adversely affect assets of the Funds and thus performance of the Funds.
In the opinion of the directors, there were no other significant changes in the state of affairs of the Funds that occurred duringthe half-year.
Vanguard Wholesale International Equities Funds (Unhedged) and ETFs 3

PricewaterhouseCoopers, ABN 52 780 433 757 2 Riverside Quay, SOUTHBANK VIC 3006, GPO Box 1331, MELBOURNE VIC 3001 T: 61 3 8603 1000, F: 61 3 8603 1999, www.pwc.com.au
Liability limited by a scheme approved under Professional Standards Legislation.
Auditor’s Independence Declaration
Vanguard FTSE Asia ex Japan Shares Index ETF* Vanguard Emerging Markets Shares Index Fund Vanguard FTSE Europe Shares ETF* Vanguard FTSE Emerging Markets Shares ETF* Vanguard International Property Securities Index Fund Vanguard Global Value Equity Fund* Vanguard Global Infrastructure Index Fund* Vanguard Global Multi-Factor Fund* Vanguard International Shares Index Fund* Vanguard International Small Companies Index Fund*
referred to collectively as the Vanguard Wholesale International Equities Funds (Unhedged) and ETFs.
* denotes listed Funds
As lead auditor for the review of the Vanguard Wholesale International Equities Funds (Unhedged) and ETFs for the half-year ended 31 December 2021, I declare that to the best of my knowledge and belief, there have been:
(a) no contraventions of the auditor independence requirements of the Corporations Act 2001 inrelation to the review; and
(b) no contraventions of any applicable code of professional conduct in relation to the review.
Adrian Gut Melbourne Partner PricewaterhouseCoopers
3 March 2022
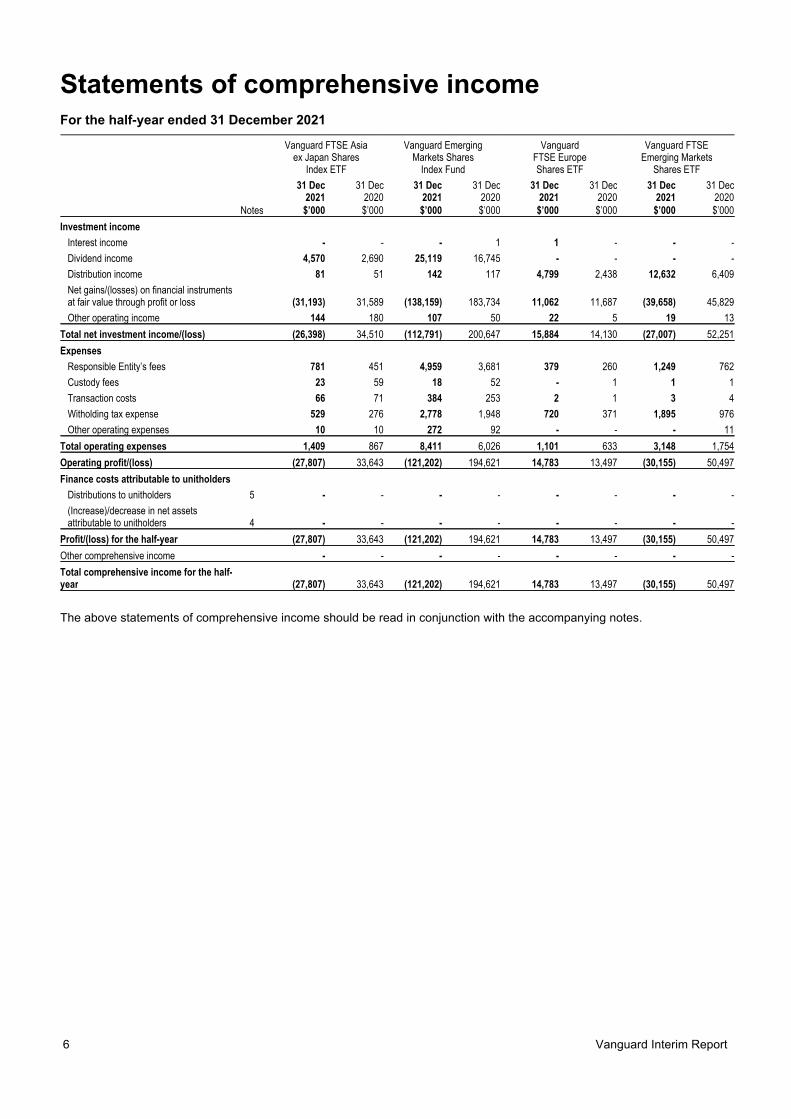
Statements of comprehensive incomeFor the half-year ended 31 December 2021
Vanguard FTSE Asiaex Japan Shares
Index ETF
Vanguard EmergingMarkets Shares
Index Fund
VanguardFTSE EuropeShares ETF
Vanguard FTSEEmerging Markets
Shares ETF
31 Dec2021
31 Dec2020
31 Dec2021
31 Dec2020
31 Dec2021
31 Dec2020
31 Dec2021
31 Dec2020
Notes $’000 $’000 $’000 $’000 $’000 $’000 $’000 $’000
Investment income
Interest income - - - 1 1 - - -
Dividend income 4,570 2,690 25,119 16,745 - - - -
Distribution income 81 51 142 117 4,799 2,438 12,632 6,409
Net gains/(losses) on financial instrumentsat fair value through profit or loss (31,193) 31,589 (138,159) 183,734 11,062 11,687 (39,658) 45,829
Other operating income 144 180 107 50 22 5 19 13
Total net investment income/(loss) (26,398) 34,510 (112,791) 200,647 15,884 14,130 (27,007) 52,251
Expenses
Responsible Entity’s fees 781 451 4,959 3,681 379 260 1,249 762
Custody fees 23 59 18 52 - 1 1 1
Transaction costs 66 71 384 253 2 1 3 4
Witholding tax expense 529 276 2,778 1,948 720 371 1,895 976
Other operating expenses 10 10 272 92 - - - 11
Total operating expenses 1,409 867 8,411 6,026 1,101 633 3,148 1,754
Operating profit/(loss) (27,807) 33,643 (121,202) 194,621 14,783 13,497 (30,155) 50,497
Finance costs attributable to unitholders
Distributions to unitholders 5 - - - - - - - -
(Increase)/decrease in net assetsattributable to unitholders 4 - - - - - - - -
Profit/(loss) for the half-year (27,807) 33,643 (121,202) 194,621 14,783 13,497 (30,155) 50,497
Other comprehensive income - - - - - - - -
Total comprehensive income for the half-year (27,807) 33,643 (121,202) 194,621 14,783 13,497 (30,155) 50,497
The above statements of comprehensive income should be read in conjunction with the accompanying notes.
6 Vanguard Interim Report
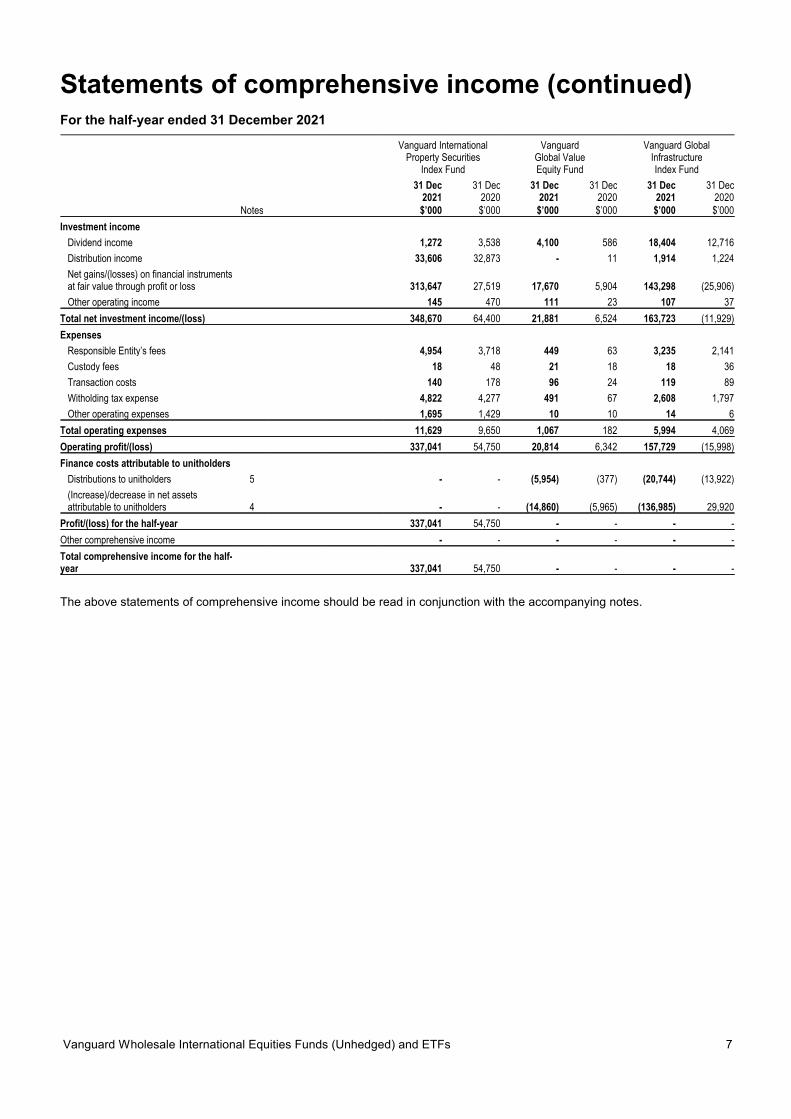
Statements of comprehensive income (continued)For the half-year ended 31 December 2021
Vanguard InternationalProperty Securities
Index Fund
VanguardGlobal ValueEquity Fund
Vanguard GlobalInfrastructureIndex Fund
31 Dec2021
31 Dec2020
31 Dec2021
31 Dec2020
31 Dec2021
31 Dec2020
Notes $’000 $’000 $’000 $’000 $’000 $’000
Investment income
Dividend income 1,272 3,538 4,100 586 18,404 12,716
Distribution income 33,606 32,873 - 11 1,914 1,224
Net gains/(losses) on financial instrumentsat fair value through profit or loss 313,647 27,519 17,670 5,904 143,298 (25,906)
Other operating income 145 470 111 23 107 37
Total net investment income/(loss) 348,670 64,400 21,881 6,524 163,723 (11,929)
Expenses
Responsible Entity’s fees 4,954 3,718 449 63 3,235 2,141
Custody fees 18 48 21 18 18 36
Transaction costs 140 178 96 24 119 89
Witholding tax expense 4,822 4,277 491 67 2,608 1,797
Other operating expenses 1,695 1,429 10 10 14 6
Total operating expenses 11,629 9,650 1,067 182 5,994 4,069
Operating profit/(loss) 337,041 54,750 20,814 6,342 157,729 (15,998)
Finance costs attributable to unitholders
Distributions to unitholders 5 - - (5,954) (377) (20,744) (13,922)
(Increase)/decrease in net assetsattributable to unitholders 4 - - (14,860) (5,965) (136,985) 29,920
Profit/(loss) for the half-year 337,041 54,750 - - - -
Other comprehensive income - - - - - -
Total comprehensive income for the half-year 337,041 54,750 - - - -
The above statements of comprehensive income should be read in conjunction with the accompanying notes.
Vanguard Wholesale International Equities Funds (Unhedged) and ETFs 7

Statements of comprehensive income (continued)For the half-year ended 31 December 2021
Vanguard GlobalMulti-Factor
Fund
VanguardInternational Shares
Index Fund
Vanguard InternationalSmall Companies
Index Fund
31 Dec2021
31 Dec2020
31 Dec2021
31 Dec2020
31 Dec2021
31 Dec2020
Notes $’000 $’000 $’000 $’000 $’000 $’000
Investment income
Dividend income 516 240 207,318 167,074 11,547 7,439
Distribution income - 2 9,013 7,488 2,908 2,472
Net gains/(losses) on financial instrumentsat fair value through profit or loss 2,806 1,905 2,816,862 1,674,983 52,836 200,220
Other operating income 11 2 875 845 463 520
Total net investment income/(loss) 3,333 2,149 3,034,068 1,850,390 67,754 210,651
Expenses
Responsible Entity’s fees 72 36 25,202 17,897 3,454 2,319
Custody fees 15 16 21 54 20 36
Transaction costs 15 8 865 726 187 80
Witholding tax expense 58 28 27,088 20,827 1,657 1,208
Other operating expenses 5 3 1,624 70 525 265
Total operating expenses 165 91 54,800 39,574 5,843 3,908
Operating profit/(loss) 3,168 2,058 2,979,268 1,810,816 61,911 206,743
Finance costs attributable to unitholders
Distributions to unitholders 5 (332) (158) (252,558) (319,083) (30,798) (29,360)
(Increase)/decrease in net assetsattributable to unitholders 4 (2,836) (1,900) (2,726,710) (1,491,733) (31,113) (177,383)
Profit/(loss) for the half-year - - - - - -
Other comprehensive income - - - - - -
Total comprehensive income for the half-year - - - - - -
The above statements of comprehensive income should be read in conjunction with the accompanying notes.
8 Vanguard Interim Report
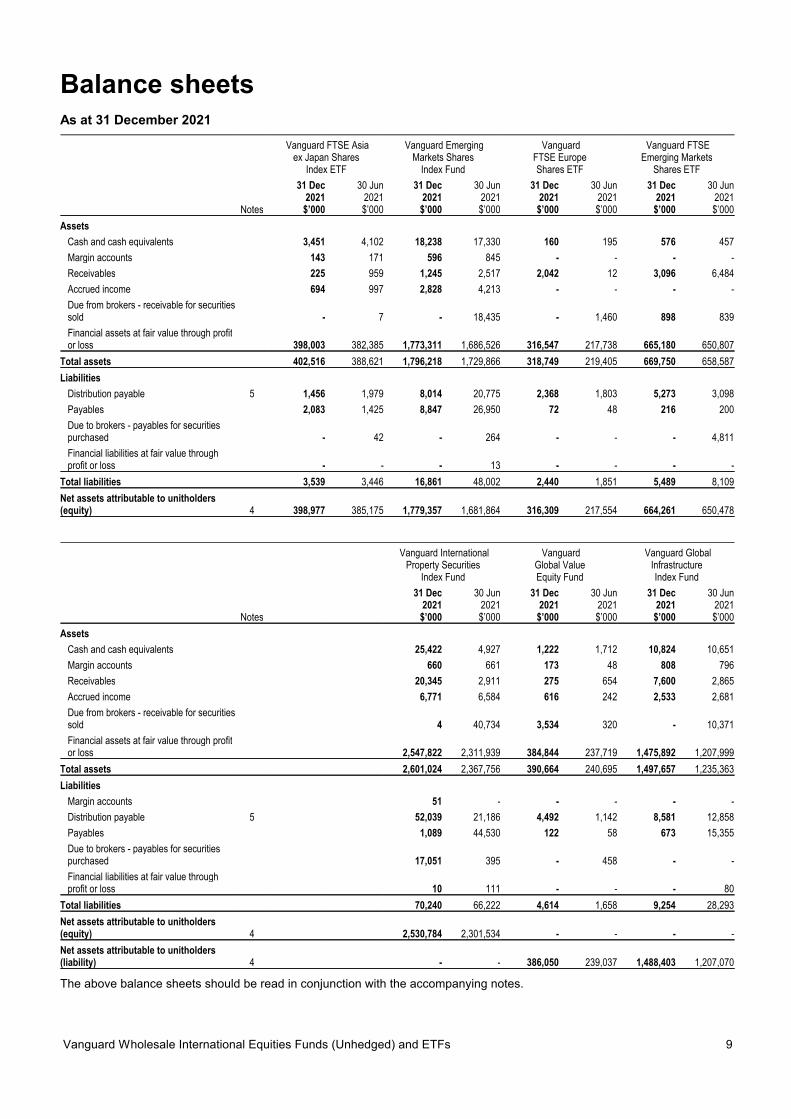
Balance sheetsAs at 31 December 2021
Vanguard FTSE Asiaex Japan Shares
Index ETF
Vanguard EmergingMarkets Shares
Index Fund
VanguardFTSE EuropeShares ETF
Vanguard FTSEEmerging Markets
Shares ETF
31 Dec2021
30 Jun2021
31 Dec2021
30 Jun2021
31 Dec2021
30 Jun2021
31 Dec2021
30 Jun2021
Notes $’000 $’000 $’000 $’000 $’000 $’000 $’000 $’000
Assets
Cash and cash equivalents 3,451 4,102 18,238 17,330 160 195 576 457
Margin accounts 143 171 596 845 - - - -
Receivables 225 959 1,245 2,517 2,042 12 3,096 6,484
Accrued income 694 997 2,828 4,213 - - - -
Due from brokers - receivable for securitiessold - 7 - 18,435 - 1,460 898 839
Financial assets at fair value through profitor loss 398,003 382,385 1,773,311 1,686,526 316,547 217,738 665,180 650,807
Total assets 402,516 388,621 1,796,218 1,729,866 318,749 219,405 669,750 658,587
Liabilities
Distribution payable 5 1,456 1,979 8,014 20,775 2,368 1,803 5,273 3,098
Payables 2,083 1,425 8,847 26,950 72 48 216 200
Due to brokers - payables for securitiespurchased - 42 - 264 - - - 4,811
Financial liabilities at fair value throughprofit or loss - - - 13 - - - -
Total liabilities 3,539 3,446 16,861 48,002 2,440 1,851 5,489 8,109
Net assets attributable to unitholders(equity) 4 398,977 385,175 1,779,357 1,681,864 316,309 217,554 664,261 650,478
Vanguard InternationalProperty Securities
Index Fund
VanguardGlobal ValueEquity Fund
Vanguard GlobalInfrastructureIndex Fund
31 Dec2021
30 Jun2021
31 Dec2021
30 Jun2021
31 Dec2021
30 Jun2021
Notes $’000 $’000 $’000 $’000 $’000 $’000
Assets
Cash and cash equivalents 25,422 4,927 1,222 1,712 10,824 10,651
Margin accounts 660 661 173 48 808 796
Receivables 20,345 2,911 275 654 7,600 2,865
Accrued income 6,771 6,584 616 242 2,533 2,681
Due from brokers - receivable for securitiessold 4 40,734 3,534 320 - 10,371
Financial assets at fair value through profitor loss 2,547,822 2,311,939 384,844 237,719 1,475,892 1,207,999
Total assets 2,601,024 2,367,756 390,664 240,695 1,497,657 1,235,363
Liabilities
Margin accounts 51 - - - - -
Distribution payable 5 52,039 21,186 4,492 1,142 8,581 12,858
Payables 1,089 44,530 122 58 673 15,355
Due to brokers - payables for securitiespurchased 17,051 395 - 458 - -
Financial liabilities at fair value throughprofit or loss 10 111 - - - 80
Total liabilities 70,240 66,222 4,614 1,658 9,254 28,293
Net assets attributable to unitholders(equity) 4 2,530,784 2,301,534 - - - -
Net assets attributable to unitholders(liability) 4 - - 386,050 239,037 1,488,403 1,207,070
The above balance sheets should be read in conjunction with the accompanying notes.
Vanguard Wholesale International Equities Funds (Unhedged) and ETFs 9

Balance sheets (continued)As at 31 December 2021
Vanguard GlobalMulti-Factor
Fund
VanguardInternational Shares
Index Fund
Vanguard InternationalSmall Companies
Index Fund
31 Dec2021
30 Jun2021
31 Dec2021
30 Jun2021
31 Dec2021
30 Jun2021
Notes $’000 $’000 $’000 $’000 $’000 $’000
Assets
Cash and cash equivalents 182 148 193,231 133,116 5,913 17,060
Margin accounts 45 26 2,954 8,448 500 1,163
Receivables 25 18 196,974 58,133 3,087 11,146
Accrued income 77 32 18,284 18,029 1,834 1,345
Due from brokers - receivable for securitiessold 200 173 4 576,545 246 13,298
Financial assets at fair value through profitor loss 50,628 33,308 29,702,490 24,944,008 1,912,105 1,598,251
Total assets 51,157 33,705 30,113,937 25,738,279 1,923,685 1,642,263
Liabilities
Margin accounts - - 125 - - -
Distribution payable 5 193 195 159,730 552,706 23,723 48,724
Payables 29 10 51,298 472,353 1,342 29,533
Due to brokers - payables for securitiespurchased 69 - 154,753 77 - -
Financial liabilities at fair value throughprofit or loss - - 5 379 11 12
Total liabilities 291 205 365,911 1,025,515 25,076 78,269
Net assets attributable to unitholders(liability) 4 50,866 33,500 29,748,026 24,712,764 1,898,609 1,563,994
The above balance sheets should be read in conjunction with the accompanying notes.
10 Vanguard Interim Report
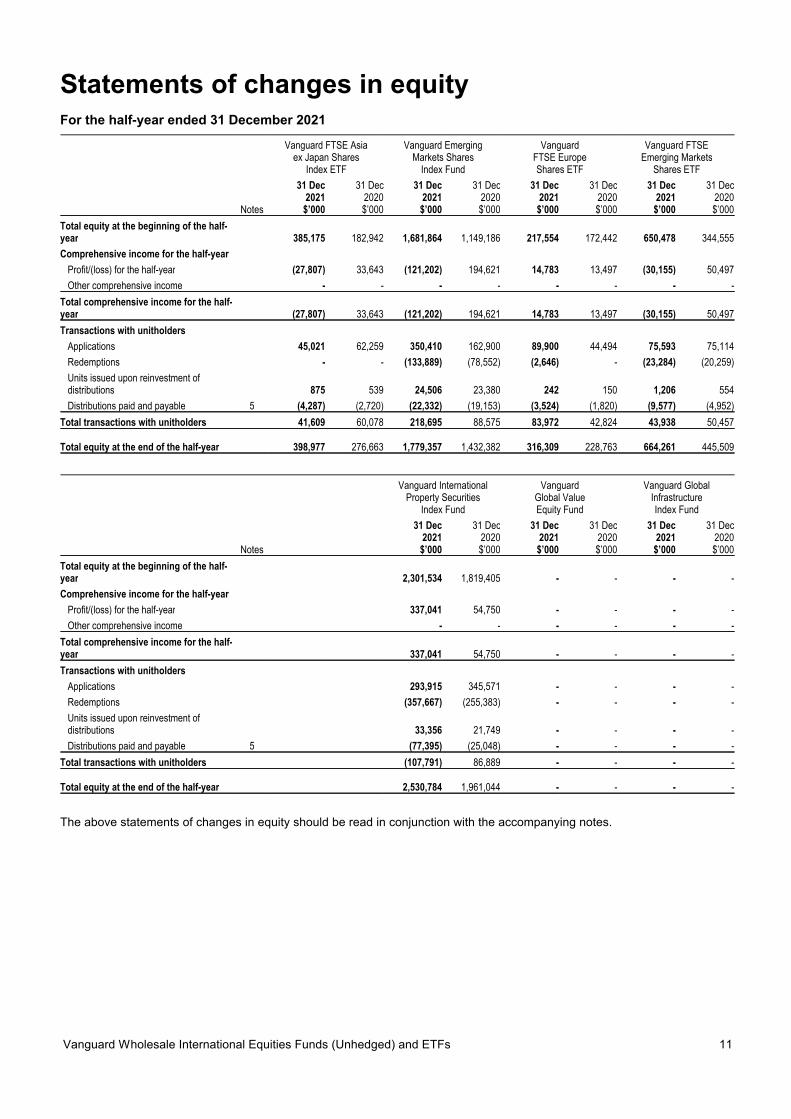
Statements of changes in equityFor the half-year ended 31 December 2021
Vanguard FTSE Asiaex Japan Shares
Index ETF
Vanguard EmergingMarkets Shares
Index Fund
VanguardFTSE EuropeShares ETF
Vanguard FTSEEmerging Markets
Shares ETF
31 Dec2021
31 Dec2020
31 Dec2021
31 Dec2020
31 Dec2021
31 Dec2020
31 Dec2021
31 Dec2020
Notes $’000 $’000 $’000 $’000 $’000 $’000 $’000 $’000
Total equity at the beginning of the half-year 385,175 182,942 1,681,864 1,149,186 217,554 172,442 650,478 344,555
Comprehensive income for the half-year
Profit/(loss) for the half-year (27,807) 33,643 (121,202) 194,621 14,783 13,497 (30,155) 50,497
Other comprehensive income - - - - - - - -
Total comprehensive income for the half-year (27,807) 33,643 (121,202) 194,621 14,783 13,497 (30,155) 50,497
Transactions with unitholders
Applications 45,021 62,259 350,410 162,900 89,900 44,494 75,593 75,114
Redemptions - - (133,889) (78,552) (2,646) - (23,284) (20,259)
Units issued upon reinvestment ofdistributions 875 539 24,506 23,380 242 150 1,206 554
Distributions paid and payable 5 (4,287) (2,720) (22,332) (19,153) (3,524) (1,820) (9,577) (4,952)
Total transactions with unitholders 41,609 60,078 218,695 88,575 83,972 42,824 43,938 50,457
Total equity at the end of the half-year 398,977 276,663 1,779,357 1,432,382 316,309 228,763 664,261 445,509
Vanguard InternationalProperty Securities
Index Fund
VanguardGlobal ValueEquity Fund
Vanguard GlobalInfrastructureIndex Fund
31 Dec2021
31 Dec2020
31 Dec2021
31 Dec2020
31 Dec2021
31 Dec2020
Notes $’000 $’000 $’000 $’000 $’000 $’000
Total equity at the beginning of the half-year 2,301,534 1,819,405 - - - -
Comprehensive income for the half-year
Profit/(loss) for the half-year 337,041 54,750 - - - -
Other comprehensive income - - - - - -
Total comprehensive income for the half-year 337,041 54,750 - - - -
Transactions with unitholders
Applications 293,915 345,571 - - - -
Redemptions (357,667) (255,383) - - - -
Units issued upon reinvestment ofdistributions 33,356 21,749 - - - -
Distributions paid and payable 5 (77,395) (25,048) - - - -
Total transactions with unitholders (107,791) 86,889 - - - -
Total equity at the end of the half-year 2,530,784 1,961,044 - - - -
The above statements of changes in equity should be read in conjunction with the accompanying notes.
Vanguard Wholesale International Equities Funds (Unhedged) and ETFs 11

Statements of changes in equity (continued)For the half-year ended 31 December 2021
Vanguard GlobalMulti-Factor
Fund
VanguardInternational Shares
Index Fund
Vanguard InternationalSmall Companies
Index Fund
31 Dec2021
31 Dec2020
31 Dec2021
31 Dec2020
31 Dec2021
31 Dec2020
Notes $’000 $’000 $’000 $’000 $’000 $’000
Total equity at the beginning of the half-year - - - - - -
Comprehensive income for the half-year
Profit/(loss) for the half-year - - - - - -
Other comprehensive income - - - - - -
Total comprehensive income for the half-year - - - - - -
Transactions with unitholders
Applications - - - - - -
Redemptions - - - - - -
Units issued upon reinvestment ofdistributions - - - - - -
Distributions paid and payable 5 - - - - - -
Total transactions with unitholders - - - - - -
Total equity at the end of the half-year - - - - - -
The above statements of changes in equity should be read in conjunction with the accompanying notes.
12 Vanguard Interim Report
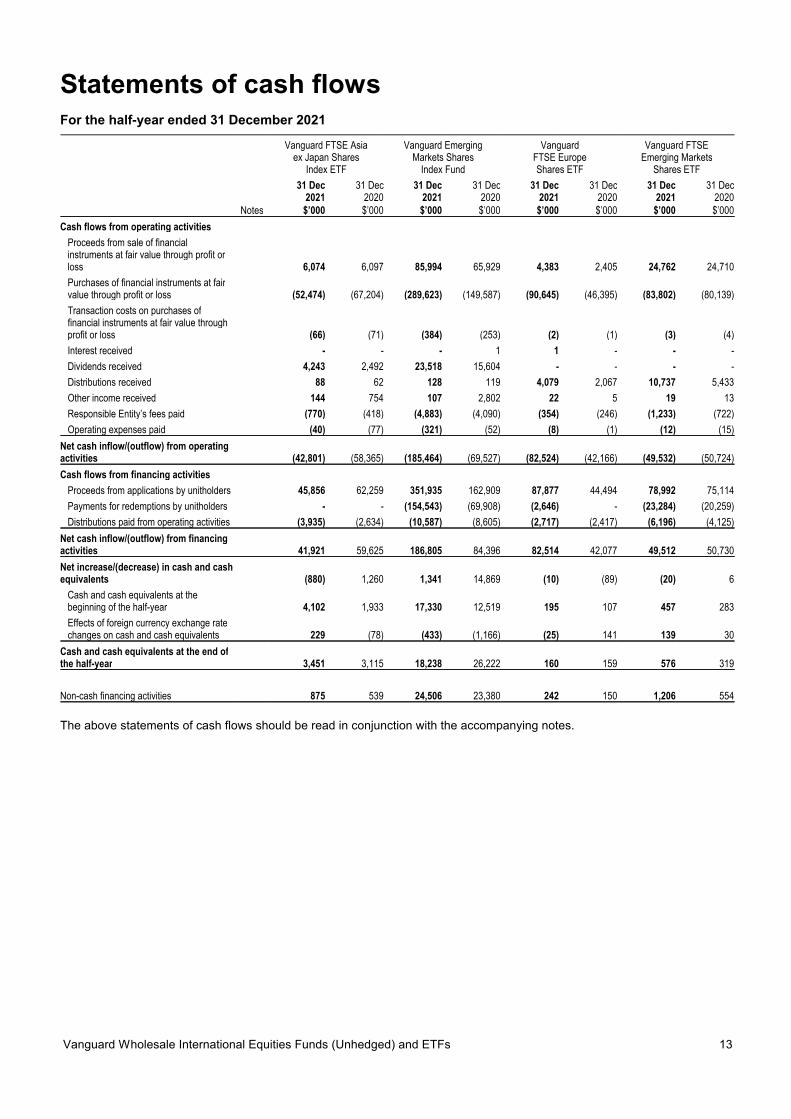
Statements of cash flowsFor the half-year ended 31 December 2021
Vanguard FTSE Asiaex Japan Shares
Index ETF
Vanguard EmergingMarkets Shares
Index Fund
VanguardFTSE EuropeShares ETF
Vanguard FTSEEmerging Markets
Shares ETF
31 Dec2021
31 Dec2020
31 Dec2021
31 Dec2020
31 Dec2021
31 Dec2020
31 Dec2021
31 Dec2020
Notes $’000 $’000 $’000 $’000 $’000 $’000 $’000 $’000
Cash flows from operating activities
Proceeds from sale of financialinstruments at fair value through profit orloss 6,074 6,097 85,994 65,929 4,383 2,405 24,762 24,710
Purchases of financial instruments at fairvalue through profit or loss (52,474) (67,204) (289,623) (149,587) (90,645) (46,395) (83,802) (80,139)
Transaction costs on purchases offinancial instruments at fair value throughprofit or loss (66) (71) (384) (253) (2) (1) (3) (4)
Interest received - - - 1 1 - - -
Dividends received 4,243 2,492 23,518 15,604 - - - -
Distributions received 88 62 128 119 4,079 2,067 10,737 5,433
Other income received 144 754 107 2,802 22 5 19 13
Responsible Entity’s fees paid (770) (418) (4,883) (4,090) (354) (246) (1,233) (722)
Operating expenses paid (40) (77) (321) (52) (8) (1) (12) (15)
Net cash inflow/(outflow) from operatingactivities (42,801) (58,365) (185,464) (69,527) (82,524) (42,166) (49,532) (50,724)
Cash flows from financing activities
Proceeds from applications by unitholders 45,856 62,259 351,935 162,909 87,877 44,494 78,992 75,114
Payments for redemptions by unitholders - - (154,543) (69,908) (2,646) - (23,284) (20,259)
Distributions paid from operating activities (3,935) (2,634) (10,587) (8,605) (2,717) (2,417) (6,196) (4,125)
Net cash inflow/(outflow) from financingactivities 41,921 59,625 186,805 84,396 82,514 42,077 49,512 50,730
Net increase/(decrease) in cash and cashequivalents (880) 1,260 1,341 14,869 (10) (89) (20) 6
Cash and cash equivalents at thebeginning of the half-year 4,102 1,933 17,330 12,519 195 107 457 283
Effects of foreign currency exchange ratechanges on cash and cash equivalents 229 (78) (433) (1,166) (25) 141 139 30
Cash and cash equivalents at the end ofthe half-year 3,451 3,115 18,238 26,222 160 159 576 319
Non-cash financing activities 875 539 24,506 23,380 242 150 1,206 554
The above statements of cash flows should be read in conjunction with the accompanying notes.
Vanguard Wholesale International Equities Funds (Unhedged) and ETFs 13
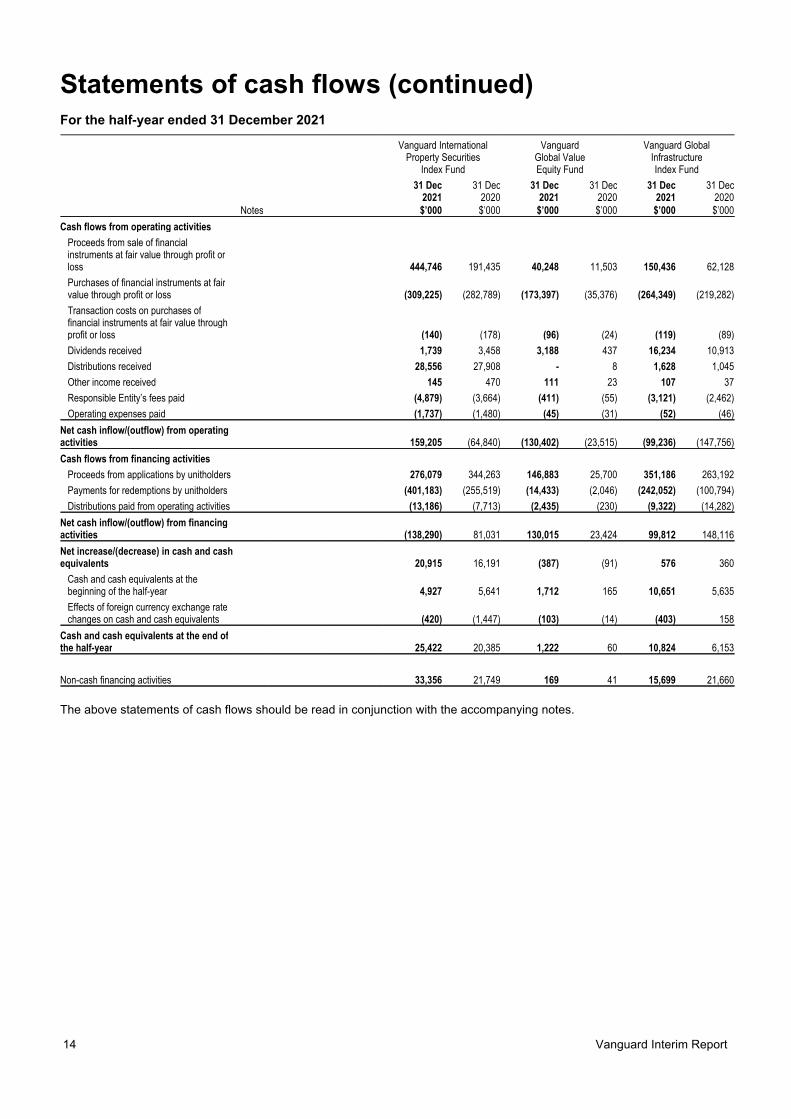
Statements of cash flows (continued)For the half-year ended 31 December 2021
Vanguard InternationalProperty Securities
Index Fund
VanguardGlobal ValueEquity Fund
Vanguard GlobalInfrastructureIndex Fund
31 Dec2021
31 Dec2020
31 Dec2021
31 Dec2020
31 Dec2021
31 Dec2020
Notes $’000 $’000 $’000 $’000 $’000 $’000
Cash flows from operating activities
Proceeds from sale of financialinstruments at fair value through profit orloss 444,746 191,435 40,248 11,503 150,436 62,128
Purchases of financial instruments at fairvalue through profit or loss (309,225) (282,789) (173,397) (35,376) (264,349) (219,282)
Transaction costs on purchases offinancial instruments at fair value throughprofit or loss (140) (178) (96) (24) (119) (89)
Dividends received 1,739 3,458 3,188 437 16,234 10,913
Distributions received 28,556 27,908 - 8 1,628 1,045
Other income received 145 470 111 23 107 37
Responsible Entity’s fees paid (4,879) (3,664) (411) (55) (3,121) (2,462)
Operating expenses paid (1,737) (1,480) (45) (31) (52) (46)
Net cash inflow/(outflow) from operatingactivities 159,205 (64,840) (130,402) (23,515) (99,236) (147,756)
Cash flows from financing activities
Proceeds from applications by unitholders 276,079 344,263 146,883 25,700 351,186 263,192
Payments for redemptions by unitholders (401,183) (255,519) (14,433) (2,046) (242,052) (100,794)
Distributions paid from operating activities (13,186) (7,713) (2,435) (230) (9,322) (14,282)
Net cash inflow/(outflow) from financingactivities (138,290) 81,031 130,015 23,424 99,812 148,116
Net increase/(decrease) in cash and cashequivalents 20,915 16,191 (387) (91) 576 360
Cash and cash equivalents at thebeginning of the half-year 4,927 5,641 1,712 165 10,651 5,635
Effects of foreign currency exchange ratechanges on cash and cash equivalents (420) (1,447) (103) (14) (403) 158
Cash and cash equivalents at the end ofthe half-year 25,422 20,385 1,222 60 10,824 6,153
Non-cash financing activities 33,356 21,749 169 41 15,699 21,660
The above statements of cash flows should be read in conjunction with the accompanying notes.
14 Vanguard Interim Report
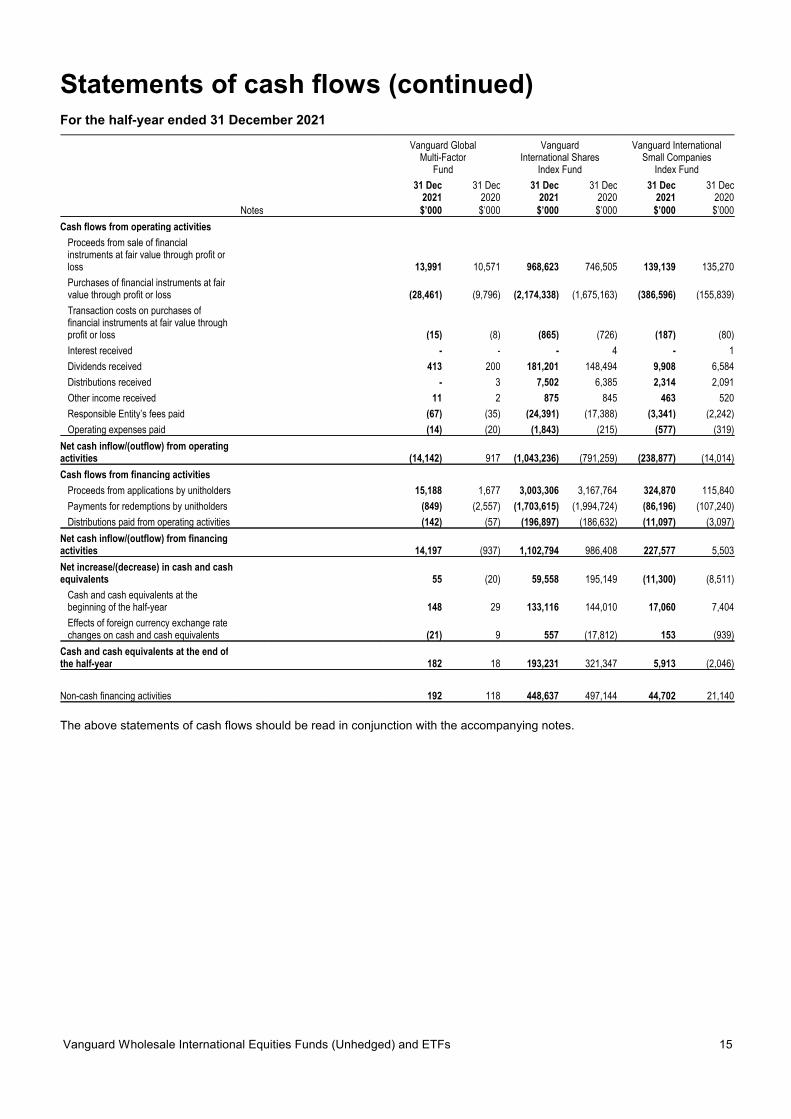
Statements of cash flows (continued)For the half-year ended 31 December 2021
Vanguard GlobalMulti-Factor
Fund
VanguardInternational Shares
Index Fund
Vanguard InternationalSmall Companies
Index Fund
31 Dec2021
31 Dec2020
31 Dec2021
31 Dec2020
31 Dec2021
31 Dec2020
Notes $’000 $’000 $’000 $’000 $’000 $’000
Cash flows from operating activities
Proceeds from sale of financialinstruments at fair value through profit orloss 13,991 10,571 968,623 746,505 139,139 135,270
Purchases of financial instruments at fairvalue through profit or loss (28,461) (9,796) (2,174,338) (1,675,163) (386,596) (155,839)
Transaction costs on purchases offinancial instruments at fair value throughprofit or loss (15) (8) (865) (726) (187) (80)
Interest received - - - 4 - 1
Dividends received 413 200 181,201 148,494 9,908 6,584
Distributions received - 3 7,502 6,385 2,314 2,091
Other income received 11 2 875 845 463 520
Responsible Entity’s fees paid (67) (35) (24,391) (17,388) (3,341) (2,242)
Operating expenses paid (14) (20) (1,843) (215) (577) (319)
Net cash inflow/(outflow) from operatingactivities (14,142) 917 (1,043,236) (791,259) (238,877) (14,014)
Cash flows from financing activities
Proceeds from applications by unitholders 15,188 1,677 3,003,306 3,167,764 324,870 115,840
Payments for redemptions by unitholders (849) (2,557) (1,703,615) (1,994,724) (86,196) (107,240)
Distributions paid from operating activities (142) (57) (196,897) (186,632) (11,097) (3,097)
Net cash inflow/(outflow) from financingactivities 14,197 (937) 1,102,794 986,408 227,577 5,503
Net increase/(decrease) in cash and cashequivalents 55 (20) 59,558 195,149 (11,300) (8,511)
Cash and cash equivalents at thebeginning of the half-year 148 29 133,116 144,010 17,060 7,404
Effects of foreign currency exchange ratechanges on cash and cash equivalents (21) 9 557 (17,812) 153 (939)
Cash and cash equivalents at the end ofthe half-year 182 18 193,231 321,347 5,913 (2,046)
Non-cash financing activities 192 118 448,637 497,144 44,702 21,140
The above statements of cash flows should be read in conjunction with the accompanying notes.
Vanguard Wholesale International Equities Funds (Unhedged) and ETFs 15
Notes to the financial statementsFor the half-year ended 31 December 2021
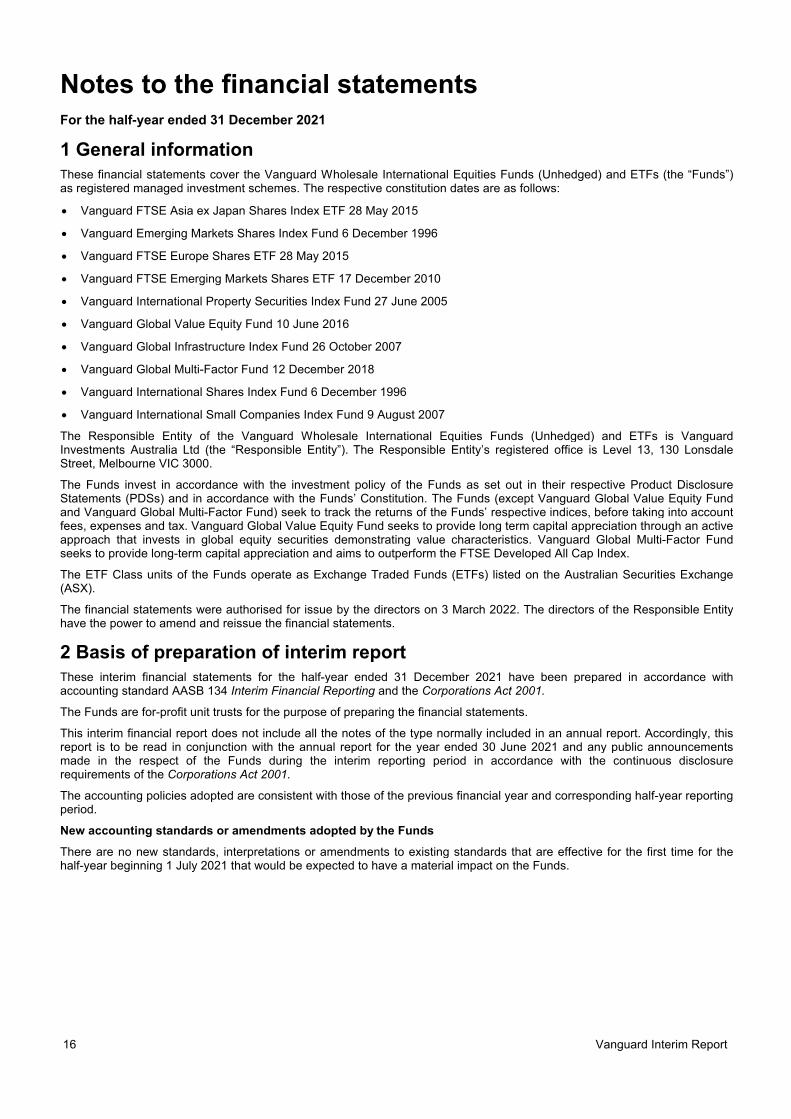
1 General informationThese financial statements cover the Vanguard Wholesale International Equities Funds (Unhedged) and ETFs (the “Funds”)as registered managed investment schemes. The respective constitution dates are as follows:
Vanguard FTSE Asia ex Japan Shares Index ETF 28 May 2015
Vanguard Emerging Markets Shares Index Fund 6 December 1996
Vanguard FTSE Europe Shares ETF 28 May 2015
Vanguard FTSE Emerging Markets Shares ETF 17 December 2010
Vanguard International Property Securities Index Fund 27 June 2005
Vanguard Global Value Equity Fund 10 June 2016
Vanguard Global Infrastructure Index Fund 26 October 2007
Vanguard Global Multi-Factor Fund 12 December 2018
Vanguard International Shares Index Fund 6 December 1996
Vanguard International Small Companies Index Fund 9 August 2007
The Responsible Entity of the Vanguard Wholesale International Equities Funds (Unhedged) and ETFs is VanguardInvestments Australia Ltd (the “Responsible Entity”). The Responsible Entity’s registered office is Level 13, 130 LonsdaleStreet, Melbourne VIC 3000.
The Funds invest in accordance with the investment policy of the Funds as set out in their respective Product DisclosureStatements (PDSs) and in accordance with the Funds’ Constitution. The Funds (except Vanguard Global Value Equity Fundand Vanguard Global Multi-Factor Fund) seek to track the returns of the Funds’ respective indices, before taking into accountfees, expenses and tax. Vanguard Global Value Equity Fund seeks to provide long term capital appreciation through an activeapproach that invests in global equity securities demonstrating value characteristics. Vanguard Global Multi-Factor Fundseeks to provide long-term capital appreciation and aims to outperform the FTSE Developed All Cap Index.
The ETF Class units of the Funds operate as Exchange Traded Funds (ETFs) listed on the Australian Securities Exchange(ASX).
The financial statements were authorised for issue by the directors on 3 March 2022. The directors of the Responsible Entityhave the power to amend and reissue the financial statements.
2 Basis of preparation of interim reportThese interim financial statements for the half-year ended 31 December 2021 have been prepared in accordance withaccounting standard AASB 134 Interim Financial Reporting and the Corporations Act 2001.
The Funds are for-profit unit trusts for the purpose of preparing the financial statements.
This interim financial report does not include all the notes of the type normally included in an annual report. Accordingly, thisreport is to be read in conjunction with the annual report for the year ended 30 June 2021 and any public announcementsmade in the respect of the Funds during the interim reporting period in accordance with the continuous disclosurerequirements of the Corporations Act 2001.
The accounting policies adopted are consistent with those of the previous financial year and corresponding half-year reportingperiod.
New accounting standards or amendments adopted by the Funds
There are no new standards, interpretations or amendments to existing standards that are effective for the first time for thehalf-year beginning 1 July 2021 that would be expected to have a material impact on the Funds.
16 Vanguard Interim Report
Notes to the financial statements (continued)For the half-year ended 31 December 2021
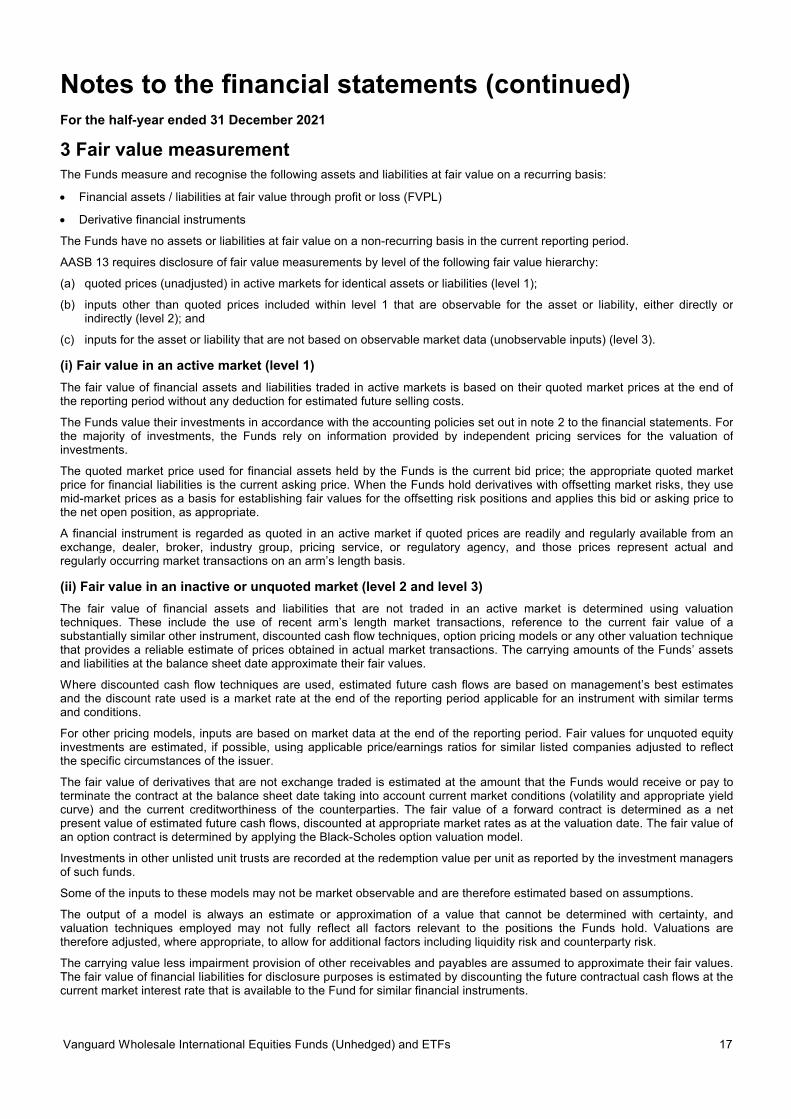
3 Fair value measurementThe Funds measure and recognise the following assets and liabilities at fair value on a recurring basis:
Financial assets / liabilities at fair value through profit or loss (FVPL)
Derivative financial instruments
The Funds have no assets or liabilities at fair value on a non-recurring basis in the current reporting period.
AASB 13 requires disclosure of fair value measurements by level of the following fair value hierarchy:
(a) quoted prices (unadjusted) in active markets for identical assets or liabilities (level 1);
(b) inputs other than quoted prices included within level 1 that are observable for the asset or liability, either directly orindirectly (level 2); and
(c) inputs for the asset or liability that are not based on observable market data (unobservable inputs) (level 3).
(i) Fair value in an active market (level 1)
The fair value of financial assets and liabilities traded in active markets is based on their quoted market prices at the end ofthe reporting period without any deduction for estimated future selling costs.
The Funds value their investments in accordance with the accounting policies set out in note 2 to the financial statements. Forthe majority of investments, the Funds rely on information provided by independent pricing services for the valuation ofinvestments.
The quoted market price used for financial assets held by the Funds is the current bid price; the appropriate quoted marketprice for financial liabilities is the current asking price. When the Funds hold derivatives with offsetting market risks, they usemid-market prices as a basis for establishing fair values for the offsetting risk positions and applies this bid or asking price tothe net open position, as appropriate.
A financial instrument is regarded as quoted in an active market if quoted prices are readily and regularly available from anexchange, dealer, broker, industry group, pricing service, or regulatory agency, and those prices represent actual andregularly occurring market transactions on an arm’s length basis.
(ii) Fair value in an inactive or unquoted market (level 2 and level 3)
The fair value of financial assets and liabilities that are not traded in an active market is determined using valuationtechniques. These include the use of recent arm’s length market transactions, reference to the current fair value of asubstantially similar other instrument, discounted cash flow techniques, option pricing models or any other valuation techniquethat provides a reliable estimate of prices obtained in actual market transactions. The carrying amounts of the Funds’ assetsand liabilities at the balance sheet date approximate their fair values.
Where discounted cash flow techniques are used, estimated future cash flows are based on management’s best estimatesand the discount rate used is a market rate at the end of the reporting period applicable for an instrument with similar termsand conditions.
For other pricing models, inputs are based on market data at the end of the reporting period. Fair values for unquoted equityinvestments are estimated, if possible, using applicable price/earnings ratios for similar listed companies adjusted to reflectthe specific circumstances of the issuer.
The fair value of derivatives that are not exchange traded is estimated at the amount that the Funds would receive or pay toterminate the contract at the balance sheet date taking into account current market conditions (volatility and appropriate yieldcurve) and the current creditworthiness of the counterparties. The fair value of a forward contract is determined as a netpresent value of estimated future cash flows, discounted at appropriate market rates as at the valuation date. The fair value ofan option contract is determined by applying the Black-Scholes option valuation model.
Investments in other unlisted unit trusts are recorded at the redemption value per unit as reported by the investment managersof such funds.
Some of the inputs to these models may not be market observable and are therefore estimated based on assumptions.
The output of a model is always an estimate or approximation of a value that cannot be determined with certainty, andvaluation techniques employed may not fully reflect all factors relevant to the positions the Funds hold. Valuations aretherefore adjusted, where appropriate, to allow for additional factors including liquidity risk and counterparty risk.
The carrying value less impairment provision of other receivables and payables are assumed to approximate their fair values.The fair value of financial liabilities for disclosure purposes is estimated by discounting the future contractual cash flows at thecurrent market interest rate that is available to the Fund for similar financial instruments.
Vanguard Wholesale International Equities Funds (Unhedged) and ETFs 17
Notes to the financial statements (continued)For the half-year ended 31 December 2021
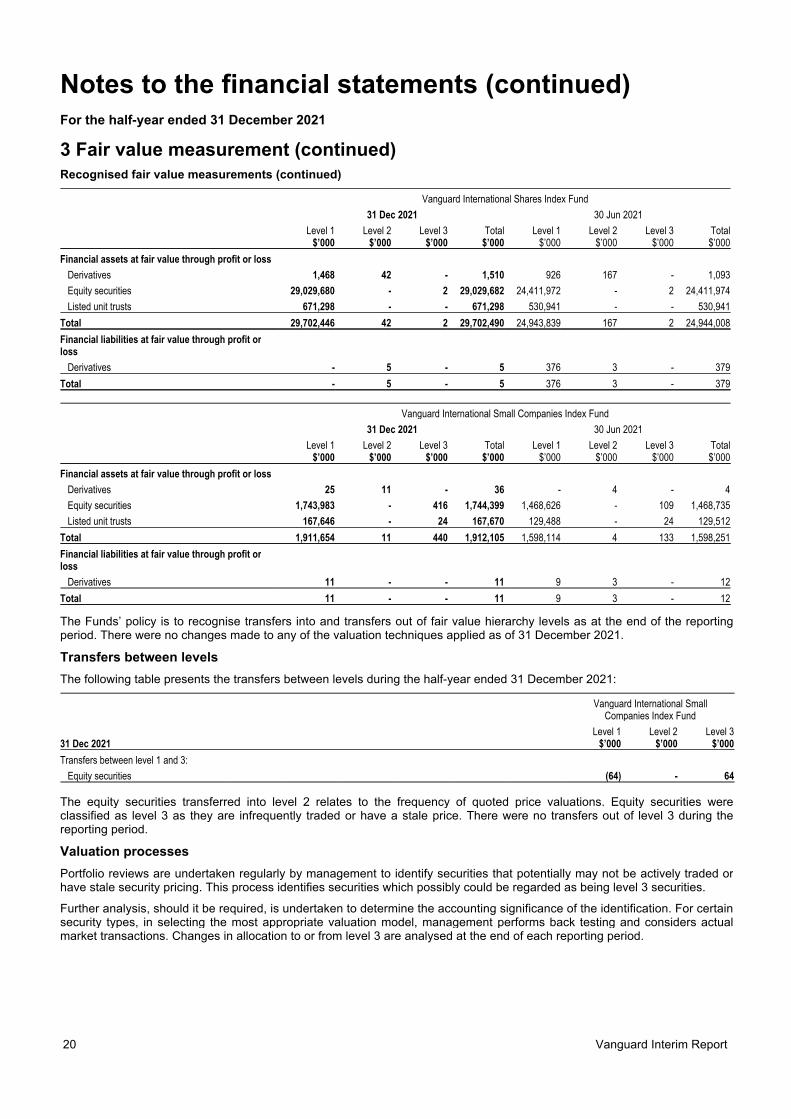
3 Fair value measurement (continued)
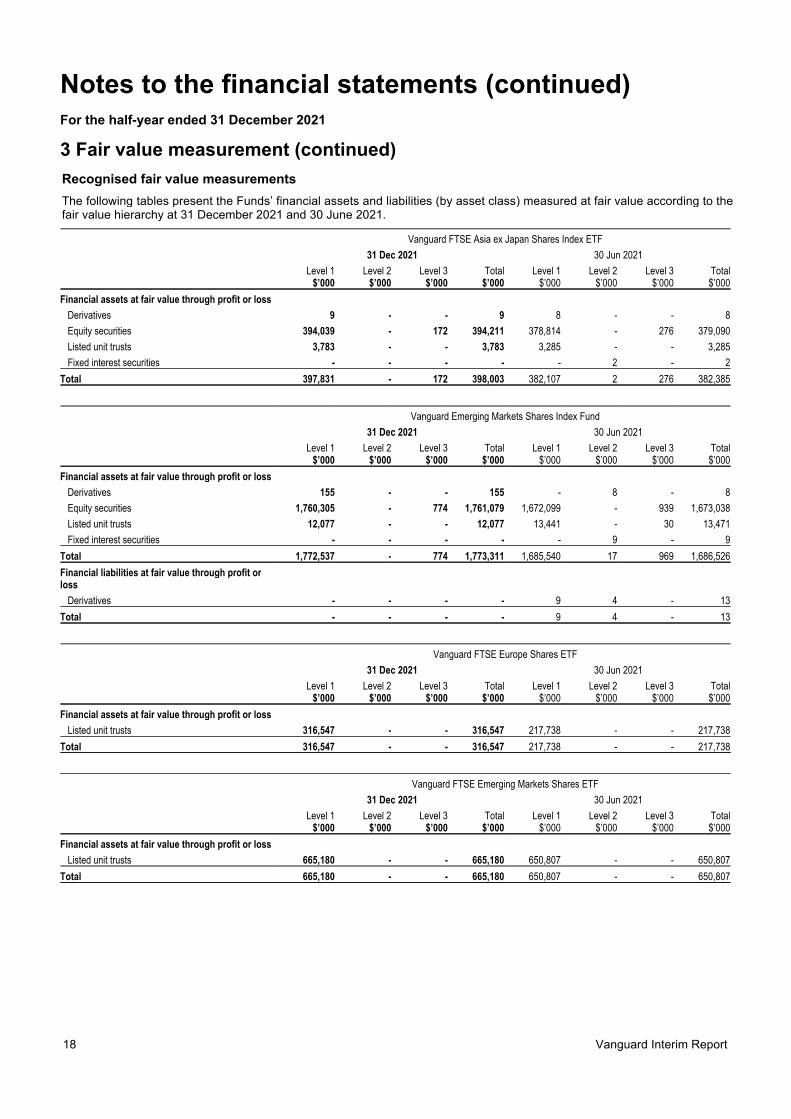
Recognised fair value measurements
The following tables present the Funds’ financial assets and liabilities (by asset class) measured at fair value according to thefair value hierarchy at 31 December 2021 and 30 June 2021.
Vanguard FTSE Asia ex Japan Shares Index ETF
31 Dec 2021 30 Jun 2021
Level 1 Level 2 Level 3 Total Level 1 Level 2 Level 3 Total$’000 $’000 $’000 $’000 $’000 $’000 $’000 $’000
Financial assets at fair value through profit or loss
Derivatives 9 - - 9 8 - - 8
Equity securities 394,039 - 172 394,211 378,814 - 276 379,090
Listed unit trusts 3,783 - - 3,783 3,285 - - 3,285
Fixed interest securities - - - - - 2 - 2
Total 397,831 - 172 398,003 382,107 2 276 382,385
Vanguard Emerging Markets Shares Index Fund
31 Dec 2021 30 Jun 2021
Level 1 Level 2 Level 3 Total Level 1 Level 2 Level 3 Total$’000 $’000 $’000 $’000 $’000 $’000 $’000 $’000
Financial assets at fair value through profit or loss
Derivatives 155 - - 155 - 8 - 8
Equity securities 1,760,305 - 774 1,761,079 1,672,099 - 939 1,673,038
Listed unit trusts 12,077 - - 12,077 13,441 - 30 13,471
Fixed interest securities - - - - - 9 - 9
Total 1,772,537 - 774 1,773,311 1,685,540 17 969 1,686,526
Financial liabilities at fair value through profit orloss
Derivatives - - - - 9 4 - 13
Total - - - - 9 4 - 13
Vanguard FTSE Europe Shares ETF
31 Dec 2021 30 Jun 2021
Level 1 Level 2 Level 3 Total Level 1 Level 2 Level 3 Total$’000 $’000 $’000 $’000 $’000 $’000 $’000 $’000
Financial assets at fair value through profit or loss
Listed unit trusts 316,547 - - 316,547 217,738 - - 217,738
Total 316,547 - - 316,547 217,738 - - 217,738
Vanguard FTSE Emerging Markets Shares ETF
31 Dec 2021 30 Jun 2021
Level 1 Level 2 Level 3 Total Level 1 Level 2 Level 3 Total$’000 $’000 $’000 $’000 $’000 $’000 $’000 $’000
Financial assets at fair value through profit or loss
Listed unit trusts 665,180 - - 665,180 650,807 - - 650,807
Total 665,180 - - 665,180 650,807 - - 650,807
18 Vanguard Interim Report
Notes to the financial statements (continued)For the half-year ended 31 December 2021
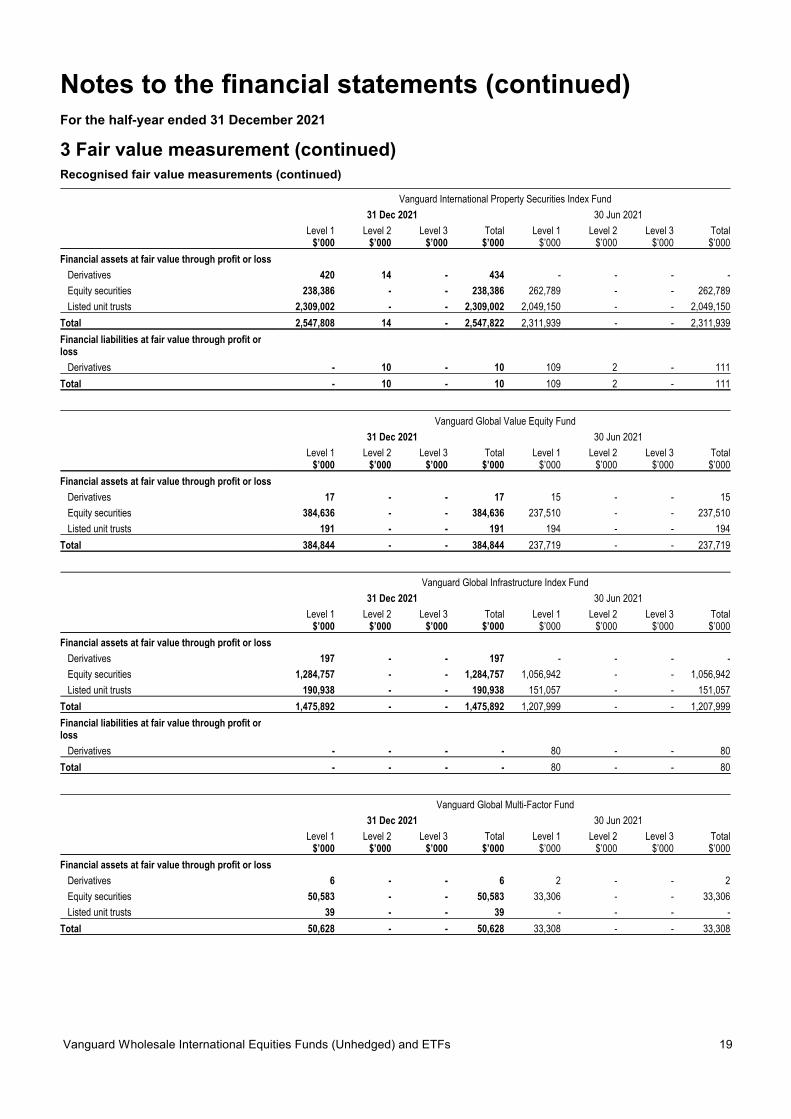
3 Fair value measurement (continued)Recognised fair value measurements (continued)
Vanguard International Property Securities Index Fund
31 Dec 2021 30 Jun 2021
Level 1 Level 2 Level 3 Total Level 1 Level 2 Level 3 Total$’000 $’000 $’000 $’000 $’000 $’000 $’000 $’000
Financial assets at fair value through profit or loss
Derivatives 420 14 - 434 - - - -
Equity securities 238,386 - - 238,386 262,789 - - 262,789
Listed unit trusts 2,309,002 - - 2,309,002 2,049,150 - - 2,049,150
Total 2,547,808 14 - 2,547,822 2,311,939 - - 2,311,939
Financial liabilities at fair value through profit orloss
Derivatives - 10 - 10 109 2 - 111
Total - 10 - 10 109 2 - 111
Vanguard Global Value Equity Fund
31 Dec 2021 30 Jun 2021
Level 1 Level 2 Level 3 Total Level 1 Level 2 Level 3 Total$’000 $’000 $’000 $’000 $’000 $’000 $’000 $’000
Financial assets at fair value through profit or loss
Derivatives 17 - - 17 15 - - 15
Equity securities 384,636 - - 384,636 237,510 - - 237,510
Listed unit trusts 191 - - 191 194 - - 194
Total 384,844 - - 384,844 237,719 - - 237,719
Vanguard Global Infrastructure Index Fund
31 Dec 2021 30 Jun 2021
Level 1 Level 2 Level 3 Total Level 1 Level 2 Level 3 Total$’000 $’000 $’000 $’000 $’000 $’000 $’000 $’000
Financial assets at fair value through profit or loss
Derivatives 197 - - 197 - - - -
Equity securities 1,284,757 - - 1,284,757 1,056,942 - - 1,056,942
Listed unit trusts 190,938 - - 190,938 151,057 - - 151,057
Total 1,475,892 - - 1,475,892 1,207,999 - - 1,207,999
Financial liabilities at fair value through profit orloss
Derivatives - - - - 80 - - 80
Total - - - - 80 - - 80
Vanguard Global Multi-Factor Fund
31 Dec 2021 30 Jun 2021
Level 1 Level 2 Level 3 Total Level 1 Level 2 Level 3 Total$’000 $’000 $’000 $’000 $’000 $’000 $’000 $’000
Financial assets at fair value through profit or loss
Derivatives 6 - - 6 2 - - 2
Equity securities 50,583 - - 50,583 33,306 - - 33,306
Listed unit trusts 39 - - 39 - - - -
Total 50,628 - - 50,628 33,308 - - 33,308
Vanguard Wholesale International Equities Funds (Unhedged) and ETFs 19
Notes to the financial statements (continued)For the half-year ended 31 December 2021
3 Fair value measurement (continued)Recognised fair value measurements (continued)
Vanguard International Shares Index Fund
31 Dec 2021 30 Jun 2021
Level 1 Level 2 Level 3 Total Level 1 Level 2 Level 3 Total$’000 $’000 $’000 $’000 $’000 $’000 $’000 $’000
Financial assets at fair value through profit or loss
Derivatives 1,468 42 - 1,510 926 167 - 1,093
Equity securities 29,029,680 - 2 29,029,682 24,411,972 - 2 24,411,974
Listed unit trusts 671,298 - - 671,298 530,941 - - 530,941
Total 29,702,446 42 2 29,702,490 24,943,839 167 2 24,944,008
Financial liabilities at fair value through profit orloss
Derivatives - 5 - 5 376 3 - 379
Total - 5 - 5 376 3 - 379
Vanguard International Small Companies Index Fund
31 Dec 2021 30 Jun 2021
Level 1 Level 2 Level 3 Total Level 1 Level 2 Level 3 Total$’000 $’000 $’000 $’000 $’000 $’000 $’000 $’000
Financial assets at fair value through profit or loss
Derivatives 25 11 - 36 - 4 - 4
Equity securities 1,743,983 - 416 1,744,399 1,468,626 - 109 1,468,735
Listed unit trusts 167,646 - 24 167,670 129,488 - 24 129,512
Total 1,911,654 11 440 1,912,105 1,598,114 4 133 1,598,251
Financial liabilities at fair value through profit orloss
Derivatives 11 - - 11 9 3 - 12
Total 11 - - 11 9 3 - 12
The Funds’ policy is to recognise transfers into and transfers out of fair value hierarchy levels as at the end of the reportingperiod. There were no changes made to any of the valuation techniques applied as of 31 December 2021.
Transfers between levels
The following table presents the transfers between levels during the half-year ended 31 December 2021:
Vanguard International SmallCompanies Index Fund
Level 1 Level 2 Level 331 Dec 2021 $’000 $’000 $’000
Transfers between level 1 and 3:
Equity securities (64) - 64
The equity securities transferred into level 2 relates to the frequency of quoted price valuations. Equity securities wereclassified as level 3 as they are infrequently traded or have a stale price. There were no transfers out of level 3 during thereporting period.
Valuation processes
Portfolio reviews are undertaken regularly by management to identify securities that potentially may not be actively traded orhave stale security pricing. This process identifies securities which possibly could be regarded as being level 3 securities.
Further analysis, should it be required, is undertaken to determine the accounting significance of the identification. For certainsecurity types, in selecting the most appropriate valuation model, management performs back testing and considers actualmarket transactions. Changes in allocation to or from level 3 are analysed at the end of each reporting period.
20 Vanguard Interim Report
Notes to the financial statements (continued)For the half-year ended 31 December 2021
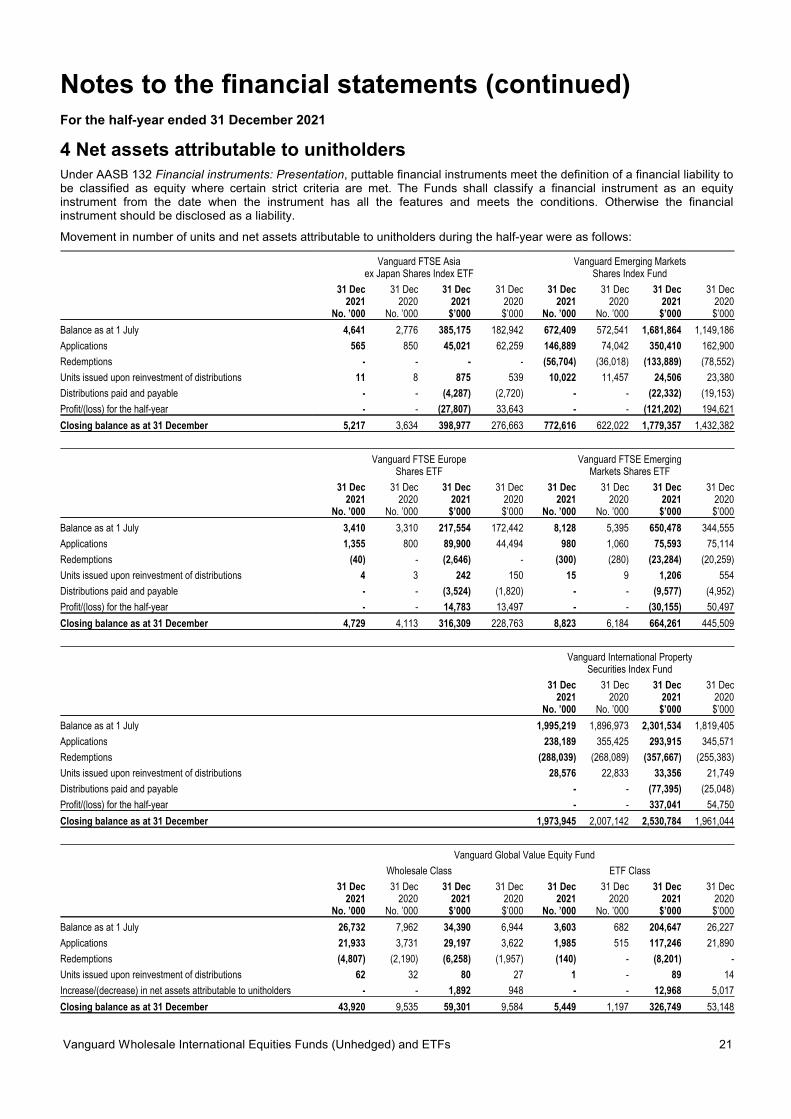
4 Net assets attributable to unitholdersUnder AASB 132 Financial instruments: Presentation, puttable financial instruments meet the definition of a financial liability tobe classified as equity where certain strict criteria are met. The Funds shall classify a financial instrument as an equityinstrument from the date when the instrument has all the features and meets the conditions. Otherwise the financialinstrument should be disclosed as a liability.
Movement in number of units and net assets attributable to unitholders during the half-year were as follows:
Vanguard FTSE Asiaex Japan Shares Index ETF
Vanguard Emerging MarketsShares Index Fund
31 Dec2021
31 Dec2020
31 Dec2021
31 Dec2020
31 Dec2021
31 Dec2020
31 Dec2021
31 Dec2020
No. ’000 No. ’000 $’000 $’000 No. ’000 No. ’000 $’000 $’000
Balance as at 1 July 4,641 2,776 385,175 182,942 672,409 572,541 1,681,864 1,149,186
Applications 565 850 45,021 62,259 146,889 74,042 350,410 162,900
Redemptions - - - - (56,704) (36,018) (133,889) (78,552)
Units issued upon reinvestment of distributions 11 8 875 539 10,022 11,457 24,506 23,380
Distributions paid and payable - - (4,287) (2,720) - - (22,332) (19,153)
Profit/(loss) for the half-year - - (27,807) 33,643 - - (121,202) 194,621
Closing balance as at 31 December 5,217 3,634 398,977 276,663 772,616 622,022 1,779,357 1,432,382
Vanguard FTSE EuropeShares ETF
Vanguard FTSE EmergingMarkets Shares ETF
31 Dec2021
31 Dec2020
31 Dec2021
31 Dec2020
31 Dec2021
31 Dec2020
31 Dec2021
31 Dec2020
No. ’000 No. ’000 $’000 $’000 No. ’000 No. ’000 $’000 $’000
Balance as at 1 July 3,410 3,310 217,554 172,442 8,128 5,395 650,478 344,555
Applications 1,355 800 89,900 44,494 980 1,060 75,593 75,114
Redemptions (40) - (2,646) - (300) (280) (23,284) (20,259)
Units issued upon reinvestment of distributions 4 3 242 150 15 9 1,206 554
Distributions paid and payable - - (3,524) (1,820) - - (9,577) (4,952)
Profit/(loss) for the half-year - - 14,783 13,497 - - (30,155) 50,497
Closing balance as at 31 December 4,729 4,113 316,309 228,763 8,823 6,184 664,261 445,509
Vanguard International PropertySecurities Index Fund
31 Dec2021
31 Dec2020
31 Dec2021
31 Dec2020
No. ’000 No. ’000 $’000 $’000
Balance as at 1 July 1,995,219 1,896,973 2,301,534 1,819,405
Applications 238,189 355,425 293,915 345,571
Redemptions (288,039) (268,089) (357,667) (255,383)
Units issued upon reinvestment of distributions 28,576 22,833 33,356 21,749
Distributions paid and payable - - (77,395) (25,048)
Profit/(loss) for the half-year - - 337,041 54,750
Closing balance as at 31 December 1,973,945 2,007,142 2,530,784 1,961,044
Vanguard Global Value Equity Fund
Wholesale Class ETF Class
31 Dec2021
31 Dec2020
31 Dec2021
31 Dec2020
31 Dec2021
31 Dec2020
31 Dec2021
31 Dec2020
No. ’000 No. ’000 $’000 $’000 No. ’000 No. ’000 $’000 $’000
Balance as at 1 July 26,732 7,962 34,390 6,944 3,603 682 204,647 26,227
Applications 21,933 3,731 29,197 3,622 1,985 515 117,246 21,890
Redemptions (4,807) (2,190) (6,258) (1,957) (140) - (8,201) -
Units issued upon reinvestment of distributions 62 32 80 27 1 - 89 14
Increase/(decrease) in net assets attributable to unitholders - - 1,892 948 - - 12,968 5,017
Closing balance as at 31 December 43,920 9,535 59,301 9,584 5,449 1,197 326,749 53,148
Vanguard Wholesale International Equities Funds (Unhedged) and ETFs 21
Notes to the financial statements (continued)For the half-year ended 31 December 2021
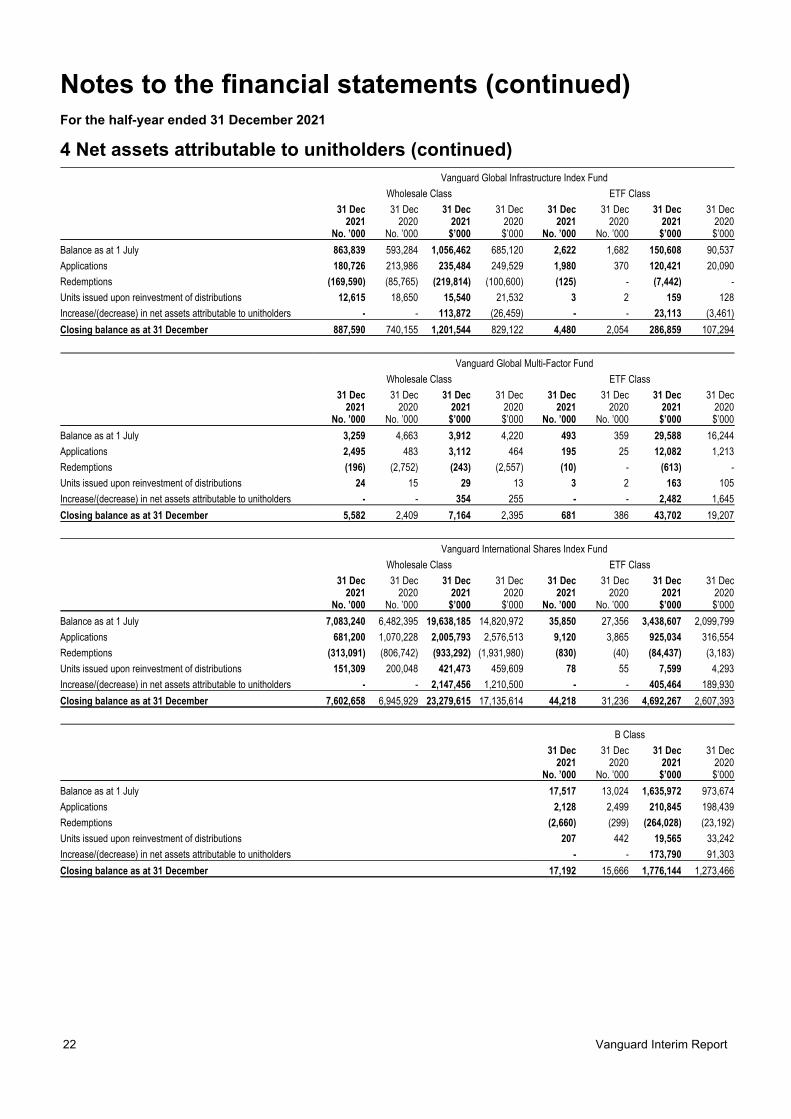
4 Net assets attributable to unitholders (continued)
Vanguard Global Infrastructure Index Fund
Wholesale Class ETF Class
31 Dec2021
31 Dec2020
31 Dec2021
31 Dec2020
31 Dec2021
31 Dec2020
31 Dec2021
31 Dec2020
No. ’000 No. ’000 $’000 $’000 No. ’000 No. ’000 $’000 $’000
Balance as at 1 July 863,839 593,284 1,056,462 685,120 2,622 1,682 150,608 90,537
Applications 180,726 213,986 235,484 249,529 1,980 370 120,421 20,090
Redemptions (169,590) (85,765) (219,814) (100,600) (125) - (7,442) -
Units issued upon reinvestment of distributions 12,615 18,650 15,540 21,532 3 2 159 128
Increase/(decrease) in net assets attributable to unitholders - - 113,872 (26,459) - - 23,113 (3,461)
Closing balance as at 31 December 887,590 740,155 1,201,544 829,122 4,480 2,054 286,859 107,294
Vanguard Global Multi-Factor Fund
Wholesale Class ETF Class
31 Dec2021
31 Dec2020
31 Dec2021
31 Dec2020
31 Dec2021
31 Dec2020
31 Dec2021
31 Dec2020
No. ’000 No. ’000 $’000 $’000 No. ’000 No. ’000 $’000 $’000
Balance as at 1 July 3,259 4,663 3,912 4,220 493 359 29,588 16,244
Applications 2,495 483 3,112 464 195 25 12,082 1,213
Redemptions (196) (2,752) (243) (2,557) (10) - (613) -
Units issued upon reinvestment of distributions 24 15 29 13 3 2 163 105
Increase/(decrease) in net assets attributable to unitholders - - 354 255 - - 2,482 1,645
Closing balance as at 31 December 5,582 2,409 7,164 2,395 681 386 43,702 19,207
Vanguard International Shares Index Fund
Wholesale Class ETF Class
31 Dec2021
31 Dec2020
31 Dec2021
31 Dec2020
31 Dec2021
31 Dec2020
31 Dec2021
31 Dec2020
No. ’000 No. ’000 $’000 $’000 No. ’000 No. ’000 $’000 $’000
Balance as at 1 July 7,083,240 6,482,395 19,638,185 14,820,972 35,850 27,356 3,438,607 2,099,799
Applications 681,200 1,070,228 2,005,793 2,576,513 9,120 3,865 925,034 316,554
Redemptions (313,091) (806,742) (933,292) (1,931,980) (830) (40) (84,437) (3,183)
Units issued upon reinvestment of distributions 151,309 200,048 421,473 459,609 78 55 7,599 4,293
Increase/(decrease) in net assets attributable to unitholders - - 2,147,456 1,210,500 - - 405,464 189,930
Closing balance as at 31 December 7,602,658 6,945,929 23,279,615 17,135,614 44,218 31,236 4,692,267 2,607,393
B Class
31 Dec2021
31 Dec2020
31 Dec2021
31 Dec2020
No. ’000 No. ’000 $’000 $’000
Balance as at 1 July 17,517 13,024 1,635,972 973,674
Applications 2,128 2,499 210,845 198,439
Redemptions (2,660) (299) (264,028) (23,192)
Units issued upon reinvestment of distributions 207 442 19,565 33,242
Increase/(decrease) in net assets attributable to unitholders - - 173,790 91,303
Closing balance as at 31 December 17,192 15,666 1,776,144 1,273,466
22 Vanguard Interim Report

Notes to the financial statements (continued)For the half-year ended 31 December 2021
4 Net assets attributable to unitholders (continued)
Vanguard International Small Companies Index Fund
Wholesale Class ETF Class
31 Dec2021
31 Dec2020
31 Dec2021
31 Dec2020
31 Dec2021
31 Dec2020
31 Dec2021
31 Dec2020
No. ’000 No. ’000 $’000 $’000 No. ’000 No. ’000 $’000 $’000
Balance as at 1 July 738,093 694,495 1,432,146 1,038,046 2,092 747 131,848 35,421
Applications 132,685 55,338 264,417 86,394 810 570 52,275 29,850
Redemptions (29,024) (67,569) (57,554) (110,093) (5) - (338) -
Units issued upon reinvestment of distributions 22,765 14,000 44,306 21,074 6 1 396 66
Increase/(decrease) in net assets attributable to unitholders - - 28,382 169,969 - - 2,731 7,414
Closing balance as at 31 December 864,519 696,264 1,711,697 1,205,390 2,903 1,318 186,912 72,751
Each unit represents a right to an individual share in the Funds and does not extend to a right to the underlying assets of theFunds. The Vanguard FTSE Asia ex Japan Shares Index ETF, Vanguard Emerging Markets Shares Index Fund, VanguardFTSE Europe Shares ETF, Vanguard FTSE Emerging Markets Shares ETF and Vanguard International Property SecuritiesIndex Fund have no separate classes of units and each unit has the same rights attaching to it as all other units of the Funds.
Capital risk management
The Funds consider their net assets attributable to unitholders as capital, notwithstanding net assets attributable to unitholdersare classified either as a liability or equity. The amount of net assets attributable to unitholders can change significantly on adaily basis as the Funds are subject to daily applications and redemptions at the discretion of unitholders.
Daily applications and redemptions are reviewed relative to the liquidity of the Funds’ underlying assets on a daily basis by theResponsible Entity. Under the terms of the Funds’ Constitution, the Responsible Entity has the discretion to reject anapplication for units and to defer or adjust a redemption of units if the exercise of such discretion is in the best interests ofunitholders.
The Funds’ investment strategy remains unchanged and the Funds continue to hold direct investments which provideexposure to liquid assets including equity securities, income securities, interest earnings and cash equivalent securities. Assuch, the Funds will meet any capital requirements from the liquidation of liquid assets, which include cash and cashequivalents.
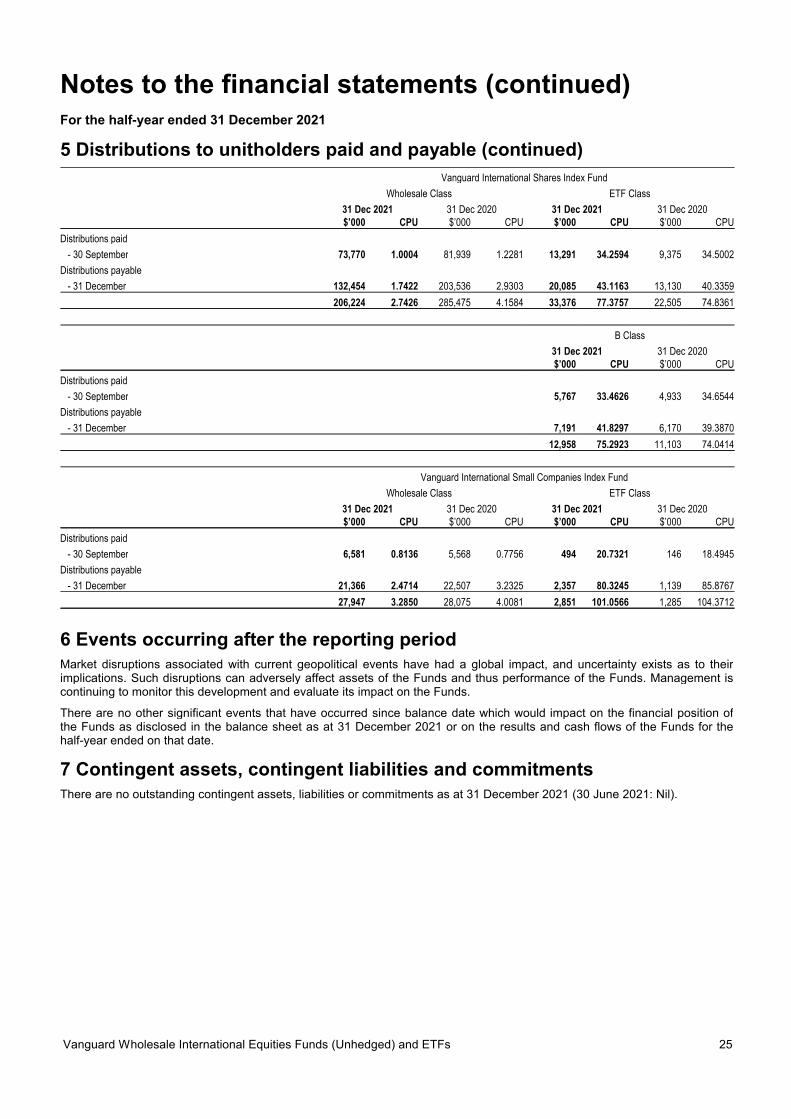
5 Distributions to unitholders paid and payableThe distributions during the half-year were as follows:
Vanguard FTSE Asiaex Japan Shares Index ETF
Vanguard Emerging MarketsShares Index Fund
31 Dec 2021 31 Dec 2020 31 Dec 2021 31 Dec 2020$’000 CPU $’000 CPU $’000 CPU $’000 CPU
Distributions paid
- 30 September 2,831 60.2770 1,674 56.9625 14,318 1.9156 13,791 2.3019
Distributions payable
- 31 December 1,456 25.0326 1,046 26.5696 8,014 1.0372 5,362 0.8621
4,287 85.3096 2,720 83.5321 22,332 2.9528 19,153 3.1640
Vanguard FTSE EuropeShares ETF
Vanguard FTSE EmergingMarkets Shares ETF
31 Dec 2021 31 Dec 2020 31 Dec 2021 31 Dec 2020$’000 CPU $’000 CPU $’000 CPU $’000 CPU
Distributions paid
- 30 September 1,156 27.4562 726 21.6462 4,304 52.1018 2,621 48.6810
Distributions payable
- 31 December 2,368 49.4508 1,094 26.2452 5,273 58.0009 2,331 36.1708
3,524 76.9070 1,820 47.8914 9,577 110.1027 4,952 84.8518
Vanguard Wholesale International Equities Funds (Unhedged) and ETFs 23
Notes to the financial statements (continued)For the half-year ended 31 December 2021
5 Distributions to unitholders paid and payable (continued)
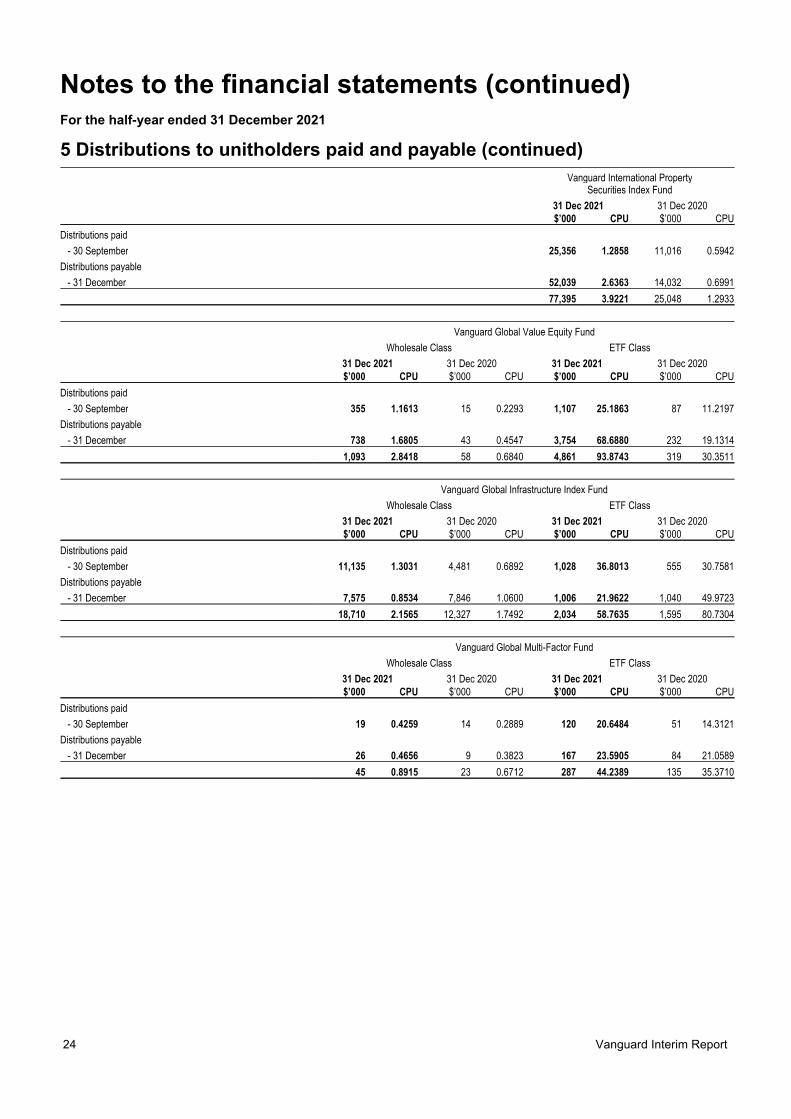
Vanguard International PropertySecurities Index Fund
31 Dec 2021 31 Dec 2020$’000 CPU $’000 CPU
Distributions paid
- 30 September 25,356 1.2858 11,016 0.5942
Distributions payable
- 31 December 52,039 2.6363 14,032 0.6991
77,395 3.9221 25,048 1.2933
Vanguard Global Value Equity Fund
Wholesale Class ETF Class
31 Dec 2021 31 Dec 2020 31 Dec 2021 31 Dec 2020$’000 CPU $’000 CPU $’000 CPU $’000 CPU
Distributions paid
- 30 September 355 1.1613 15 0.2293 1,107 25.1863 87 11.2197
Distributions payable
- 31 December 738 1.6805 43 0.4547 3,754 68.6880 232 19.1314
1,093 2.8418 58 0.6840 4,861 93.8743 319 30.3511
Vanguard Global Infrastructure Index Fund
Wholesale Class ETF Class
31 Dec 2021 31 Dec 2020 31 Dec 2021 31 Dec 2020$’000 CPU $’000 CPU $’000 CPU $’000 CPU
Distributions paid
- 30 September 11,135 1.3031 4,481 0.6892 1,028 36.8013 555 30.7581
Distributions payable
- 31 December 7,575 0.8534 7,846 1.0600 1,006 21.9622 1,040 49.9723
18,710 2.1565 12,327 1.7492 2,034 58.7635 1,595 80.7304
Vanguard Global Multi-Factor Fund
Wholesale Class ETF Class
31 Dec 2021 31 Dec 2020 31 Dec 2021 31 Dec 2020$’000 CPU $’000 CPU $’000 CPU $’000 CPU
Distributions paid
- 30 September 19 0.4259 14 0.2889 120 20.6484 51 14.3121
Distributions payable
- 31 December 26 0.4656 9 0.3823 167 23.5905 84 21.0589
45 0.8915 23 0.6712 287 44.2389 135 35.3710
24 Vanguard Interim Report
Notes to the financial statements (continued)For the half-year ended 31 December 2021
5 Distributions to unitholders paid and payable (continued)
Vanguard International Shares Index Fund
Wholesale Class ETF Class
31 Dec 2021 31 Dec 2020 31 Dec 2021 31 Dec 2020$’000 CPU $’000 CPU $’000 CPU $’000 CPU
Distributions paid
- 30 September 73,770 1.0004 81,939 1.2281 13,291 34.2594 9,375 34.5002
Distributions payable
- 31 December 132,454 1.7422 203,536 2.9303 20,085 43.1163 13,130 40.3359
206,224 2.7426 285,475 4.1584 33,376 77.3757 22,505 74.8361
B Class
31 Dec 2021 31 Dec 2020$’000 CPU $’000 CPU
Distributions paid
- 30 September 5,767 33.4626 4,933 34.6544
Distributions payable
- 31 December 7,191 41.8297 6,170 39.3870
12,958 75.2923 11,103 74.0414
Vanguard International Small Companies Index Fund
Wholesale Class ETF Class
31 Dec 2021 31 Dec 2020 31 Dec 2021 31 Dec 2020$’000 CPU $’000 CPU $’000 CPU $’000 CPU
Distributions paid
- 30 September 6,581 0.8136 5,568 0.7756 494 20.7321 146 18.4945
Distributions payable
- 31 December 21,366 2.4714 22,507 3.2325 2,357 80.3245 1,139 85.8767
27,947 3.2850 28,075 4.0081 2,851 101.0566 1,285 104.3712
6 Events occurring after the reporting periodMarket disruptions associated with current geopolitical events have had a global impact, and uncertainty exists as to theirimplications. Such disruptions can adversely affect assets of the Funds and thus performance of the Funds. Management iscontinuing to monitor this development and evaluate its impact on the Funds.
There are no other significant events that have occurred since balance date which would impact on the financial position ofthe Funds as disclosed in the balance sheet as at 31 December 2021 or on the results and cash flows of the Funds for thehalf-year ended on that date.
7 Contingent assets, contingent liabilities and commitmentsThere are no outstanding contingent assets, liabilities or commitments as at 31 December 2021 (30 June 2021: Nil).
Vanguard Wholesale International Equities Funds (Unhedged) and ETFs 25
PricewaterhouseCoopers, ABN 52 780 433 757 2 Riverside Quay, SOUTHBANK VIC 3006, GPO Box 1331, MELBOURNE VIC 3001 T: 61 3 8603 1000, F: 61 3 8603 1999
Liability limited by a scheme approved under Professional Standards Legislation.
Independent auditor's review report
To the unitholders of:
Vanguard FTSE Asia ex Japan Shares Index ETF* Vanguard Emerging Markets Shares Index Fund Vanguard FTSE Europe Shares ETF* Vanguard FTSE Emerging Markets Shares ETF* Vanguard International Property Securities Index Fund Vanguard Global Value Equity Fund* Vanguard Global Infrastructure Index Fund* Vanguard Global Multi-Factor Fund* Vanguard International Shares Index Fund* Vanguard International Small Companies Index Fund*
referred to collectively as the Vanguard Wholesale International Equities Funds (Unhedged) and ETFs.
* denotes listed Funds
Report on the half-year financial report
Conclusion We have reviewed the half-year financial report of the Vanguard Wholesale International Equities Funds (Unhedged) and ETFs (the Funds) which comprises the balance sheets as at 31 December 2021, the statements of comprehensive income, statements of changes in equity and statements of cash flows for the half-year ended on that date, significant accounting policies and explanatory notes and the directors' declaration.
Based on our review, which is not an audit, we have not become aware of any matter that makes us believe that the accompanying half-year financial report of the Vanguard Wholesale International Equities Funds (Unhedged) and ETFs does not comply with the Corporations Act 2001 including:
1. giving a true and fair view of the Funds' financial positions as at 31 December 2021 and of theirperformance for the half-year ended on that date
2. complying with Accounting Standard AASB 134 Interim Financial Reporting and the CorporationsRegulations 2001.
Basis for conclusion We conducted our review in accordance with ASRE 2410 Review of a Financial Report Performed by the Independent Auditor of the Entity (ASRE 2410). Our responsibilities are further described in the Auditor’s responsibilities for the review of the half-year financial report section of our report.
We are independent of the Funds in accordance with the auditor independence requirements of the Corporations Act 2001 and the ethical requirements of the Accounting Professional & Ethical Standards Board’s APES 110 Code of Ethics for Professional Accountants (including Independence Standards)
(the Code) that are relevant to the audit of the annual financial report in Australia. We have also fulfilled our other ethical responsibilities in accordance with the Code.
Responsibilities of the directors for the half-year financial report The directors are responsible for the preparation of the half-year financial report that gives a true and fair view in accordance with Australian Accounting Standards and the Corporations Act 2001 and for such internal control as the directors determine is necessary to enable the preparation of the half-year financial report that gives a true and fair view and is free from material misstatement whether due to fraud or error.
Auditor's responsibilities for the review of the half-year financial report Our responsibility is to express a conclusion on the half-year financial report based on our review. ASRE 2410 requires us to conclude whether we have become aware of any matter that makes us believe that the half-year financial report is not in accordance with the Corporations Act 2001 including giving a true and fair view of the Funds' financial positions as at 31 December 2021 and of their performance for the half-year ended on that date, and complying with Accounting Standard AASB 134 Interim Financial Reporting and the Corporations Regulations 2001.
A review of a half-year financial report consists of making enquiries, primarily of persons responsible for financial and accounting matters, and applying analytical and other review procedures. A review is substantially less in scope than an audit conducted in accordance with Australian Auditing Standards and consequently does not enable us to obtain assurance that we would become aware of all significant matters that might be identified in an audit. Accordingly, we do not express an audit opinion.
PricewaterhouseCoopers
Adrian Gut Melbourne Partner 3 March 2022
Vanguard Investments Australia Ltd (ABN 72 072 881 086 / AFSL 227263) (“Vanguard”) is the product issuer andResponsible Entity of the interests in the Vanguard Wholesale Funds and Australian ETFs. Interests in the VanguardWholesale Funds are offered through a Product Disclosure Statement (“PDS”) only. Vanguard ETFs will only be issued toAuthorised Participants. That is, persons who have entered into an Authorised Participant Agreement with Vanguard (“EligibleInvestors”). Retail investors can transact in Vanguard ETFs through a stockbroker or financial adviser on the secondarymarket. You can access the relevant PDS at www.vanguard.com.au or by calling 1300 655 102.
Past performance is not an indication of future performance. In preparing this Interim Report, individual circumstances, forexample tax implications, have not been taken into account and it may, therefore, not be applicable to an individual’s situation.Before making an investment decision, you should consider your circumstances and whether the information contained in theInterim Report is applicable to your situation. This Interim Report was prepared in good faith and we accept no liability for anyerrors or omissions. All marks are the exclusive property of their respective owners.
The funds or securities referred to herein are not sponsored, endorsed, or promoted by MSCI, and MSCI bears no liability withrespect to any such funds or securities. The PDS contains a more detailed description of the limited relationship MSCI haswith Vanguard and any related funds.
London Stock Exchange Group companies include FTSE International Limited (‘FTSE’), Frank Russell Company (‘Russell’),MTS Next Limited (‘MTS’), and FTSE TMX Global Debt Capital Markets Inc. (‘FTSE TMX’). All rights reserved. ‘FTSE®’,‘Russell®’, ‘MTS®’, ‘FTSE TMX®’ and ‘FTSE Russell’ and other service marks and trademarks related to the FTSE or Russellindexes are trademarks of the London Stock Exchange Group companies and are used by FTSE, MTS, FTSE TMX andRussell under licence. All information is provided for information purposes only. No responsibility or liability can be acceptedby the London Stock Exchange Group companies nor its licensors for any errors or for any loss from use of this publication.Neither the London Stock Exchange Group companies nor any of their licensors make any claim, prediction, warranty orrepresentation whatsoever, expressly or impliedly, either as to the results to be obtained from the use of the FTSE Indices orthe fitness or suitability of the Indices for any particular purpose to which they might be put.
©2022 Vanguard Investments Australia Ltd. All rights reserved.
Responsible EntityVanguard Investments Australia LtdABN 72 072 881 086AFSL 227263
Level 13130 Lonsdale StreetMelbourne VIC 3000
Telephone: (03) 8888 3888Facsimile: 1300 765 712
vanguard.com.au

vanguard.com.au1300 655 101
Vanguard Investments Australia Ltd (ABN 72 072 881 086 / AFS Licence 227263) is the product issuer. We have not taken yours or your clients’ circumstances into account when preparing the information so it may not be applicable to the particular situation you are considering. You should consider yours and your clients’ circumstances, and our Product Disclosure Statements (“PDSs”), before making any investment decision or recommendation. You can access our PDSs at vanguard.com.au or by calling 1300 655 205. Past performance is not an indication of future performance. This publication was prepared in good faith and we accept no liability for any errors or omissions. © 2022 Vanguard Investments Australia Ltd. All rights reserved.IRIEQUH_022022