Embed Size (px)
Citation preview

Vanguard Research March 2019
Vanguard’s approach to target-date funds
■ Research indicates that many investors lack time for or interest in retirement planning.1 Target-date funds (TDFs) are designed to help them build a professionally diversified portfolio and achieve their retirement goals.
■ Vanguard TDFs are constructed using fundamental investment principles and portfolio- construction best practices that balance market, inflation, and longevity risks in an efficient and transparent manner over an investor’s life cycle.
■ This paper provides an overview of Vanguard’s methodology in designing its TDFs. It outlines our view of glide-path construction, asset-class diversification, and the potential benefits of passively managed implementation. It also provides simulated outcomes for a hypothetical investor. In practice, Vanguard TDFs serve an extremely diverse investor population; because of this, they are regularly evaluated to ensure that they have a high likelihood of meeting a broad array of retirement-income needs.
Scott J. Donaldson, CFA, CFP®; Francis M. Kinniry, Jr., CFA; Brian J. Scott, CFA; Ted Dinucci, CFA; and Edoardo Cilla, M.Sc.
1 For a more detailed discussion of these issues, see Young and Young (2018) and Choi et al. (2006).

2
Notes on risk
All investing is subject to risk, including the possible loss of the money you invest. Past performance is no guarantee of future results. The performance of an index is not an exact representation of any particular investment, as you cannot invest directly in an index. Diversification does not ensure a profit or protect against a loss. Bond funds are subject to the risk that an issuer will fail to make payments on time, and that bond prices will decline because of rising interest rates or negative perceptions of an issuer’s ability to make payments. Investments in stocks or bonds issued by non-U.S. companies are subject to risks including country/regional risk and currency risk. Prices of mid- and small-cap stocks often fluctuate more than those of large-company stocks.
Investments in target-date funds are subject to the risks of their underlying funds. The year in the fund name refers to the approximate year (the target date) when an investor in the fund would retire and leave the workforce. The fund will gradually shift its emphasis from more aggressive investments to more conservative ones based on its target date. An investment in a target-date fund is not guaranteed at any time, including on or after the target date. Investors should periodically monitor the portfolio to ensure it is in line with their current situation.
IMPORTANT NOTE: The projections and other information generated by the Vanguard Capital Markets Model® regarding the likelihood of various investment outcomes are hypothetical in nature, do not reflect actual investment results, and are not guarantees of future results. VCMM results may vary with each use and over time. The VCMM projections are based on a statistical analysis of historical data. Future returns may behave differently from the historical patterns captured in the VCMM.
More important, the VCMM may be underestimating extreme negative scenarios unobserved in the historical period on which the model estimation is based.
The use of TDFs in employer-sponsored and individual retirement plans has expanded dramatically over the past ten years—and for good reason. TDFs can help investors construct well-diversified portfolios—critical to achieving retirement readiness—while simplifying the investment process. TDFs can also provide a sensible default investment option that plan sponsors can use in conjunction with plan-design strategies to improve participant portfolio diversification, enrollment and savings rates.
TDFs are designed to address a particular challenge facing many retirement investors: constructing a professionally diversified portfolio. Both Vanguard research and other studies indicate that many investors lack time for or interest in retirement planning.2 Even a motivated saver
may make errors or fail to manage a portfolio’s strategy effectively over time. TDFs address these challenges by simplifying the asset-allocation decision. Once an investor decides to invest in a TDF, subsequent decisions about portfolio construction and ongoing and life-cycle rebalancing are delegated to the fund’s portfolio manager.
Vanguard’s approach to glide-path construction
Fundamentally, the investment case for Vanguard TDFs rests on two key strategic principles: that there are significant potential rewards for taking market risk, and that younger investors are better able to withstand that risk than older investors because a larger percentage of their total wealth is in human capital versus their financial holdings.
2 Source: Ibid.

3 The expectation of a long-term equity risk premium was also corroborated by Dimson, Marsh, and Staunton (2002), who showed positive historical risk premiums for equities versus bonds in 19 countries since 1900.
4 For a more detailed discussion of these issues, see Bennyhoff (2008) and Ameriks, Hess, and Donaldson (2008). 3
Regarding the first of these principles, two important considerations justify an expectation of an equity risk premium. The first is the historical record: In the past, stock market investors in many countries have been rewarded with such a premium. Figure 1 shows historical returns for equities in excess of returns of nominal U.S. bonds over various time periods from 1926 through 2017.3
Figure 1 shows that stocks have provided higher average returns than bonds over all time horizons analyzed from 1926 through 2017—albeit with a greater propensity to underperform by significant amounts over shorter time frames. Historically, bond returns have lagged equity returns by about 4–5 percentage points, annualized—amounting to a sizable return differential in most circum-stances over longer time periods. Consequently, retirement savers investing only in “safe” assets must dramatically increase their savings rates to compensate for the lower expected returns.
The second reason for stocks’ outperformance of bonds is forward-looking and theoretical: The long-term outlook for global corporate earnings remains positive. The fact that investors sometimes question this outlook because of the risk involved is precisely why stock investors should expect to earn higher average returns over the long run than those who choose less volatile investments.
The second strategic principle underlying Vanguard TDFs’ construction—that younger investors are better able to withstand risk—recognizes that total net worth consists of both current financial holdings and future work earnings. The majority of younger individuals’ ultimate retirement wealth is in the form of what they will earn in the future, or their human capital. Therefore, it may be appropriate for a younger person’s portfolio to have a large commitment to stocks to balance and diversify his or her risk exposure to work-related earnings (Viceira, 2001; Cocco, Gomes, and Maenhout, 2005).4
The human capital theory doesn’t explicitly state how quickly or in what proportion equity exposure should diminish without the addition of a variety of assumptions and caveats. It does, however, support the theoretical concept that equity allocations should decline with age
to help manage risk through time. Widespread debate remains as to what level of equity exposure may be appropriate to diversify investors’ human capital. There is no universally accepted optimal answer; ultimately, this is a fiduciary decision that sponsors offering TDFs must make for their participants and that individual investors must make for themselves. And while TDFs are not tailored at the individual level, Vanguard does consider investor behavior in its glide-path construction, as the ability to withstand market risk does not necessarily translate into the willingness to bear such risk. Put differently, the inevitable ups and downs in portfolio returns must be made tolerable to investors to ensure they don’t flee the market in downturns—a step that would lower their chances of reaching their long-term financial objectives.
Figure 1. Historical equity risk premium over different time periods, 1926–2017
Notes: Past performance is no guarantee of future results. The performance of an index is not an exact representation of any particular investment, as you cannot invest directly in an index. U.S. stock market returns are represented by the Standard & Poor’s 90 Index from 1926 through March 3, 1957; the Standard & Poor’s 500 Index from March 4, 1957 through 1974; the Wilshire 5000 Index from 1975 through April 22, 2005; the MSCI US Broad Market Index from April 23, 2005 through June 2, 2013; and the CRSP US Total Market Index thereafter. U.S. bond market returns are represented by the Standard & Poor’s High Grade Corporate Index from 1926 to 1968, the Citigroup High Grade Index from 1969 to 1972, the Lehman Brothers U.S. Long Credit AA Index from 1973 to 1975, the Barclays Capital U.S. Aggregate Bond Index from 1976 to 2009, and the Spliced Barclays U.S. Aggregate Float Adjusted Bond Index thereafter. Sources: Vanguard calculations, based on data from Standard & Poor’s, Wilshire, MSCI, CRSP, Citigroup, and Barclays.
0%
20%
40%
60%
80%
100%
-6 -4 -2 0 2 4 6
-15
-10
-5
0
5
10
15
0.0
0.1
0.2
0.3
0.4
0.5
0.6
0.7
0.8
0%
100%
200%
300%
400%
500%
2012201120102009200820072006200520042003Notes: dot size = p4
to change size: select same appearance; go to effect > convert to shape > ellipse > absolute
1p
5th
95th
Percentileskey:
75th
25th
Median
5th
95th
Percentileskey:
75th
25th
Median
–6
–3
0
3
6
9
12
15%
Top Bottom
Axi
s la
bel
if n
eed
ed
Axis label if needed
-0.5%
-0.4%
-0.3%
-0.2%
-0.1%
0.0%
0.1%
0.2%
0.3%
0.4%
0.5%
0.0
0.1
0.2
0.3
0.4
0.5
0.6
0.7
0.8
An
nu
aliz
ed e
xces
s st
ock
ret
urn
ve
rsu
s re
turn
fo
r n
om
inal
bo
nd
s
–60
–40
–20
0
40
20
60%
1-year 3-year 5-year 10-year 20-year 30-year 40-year
Range of excess returnsAverage excess return
5 For a more detailed discussion of tactical asset allocation, see Stockton and Shtekhman (2010).4
The asset-allocation glide path
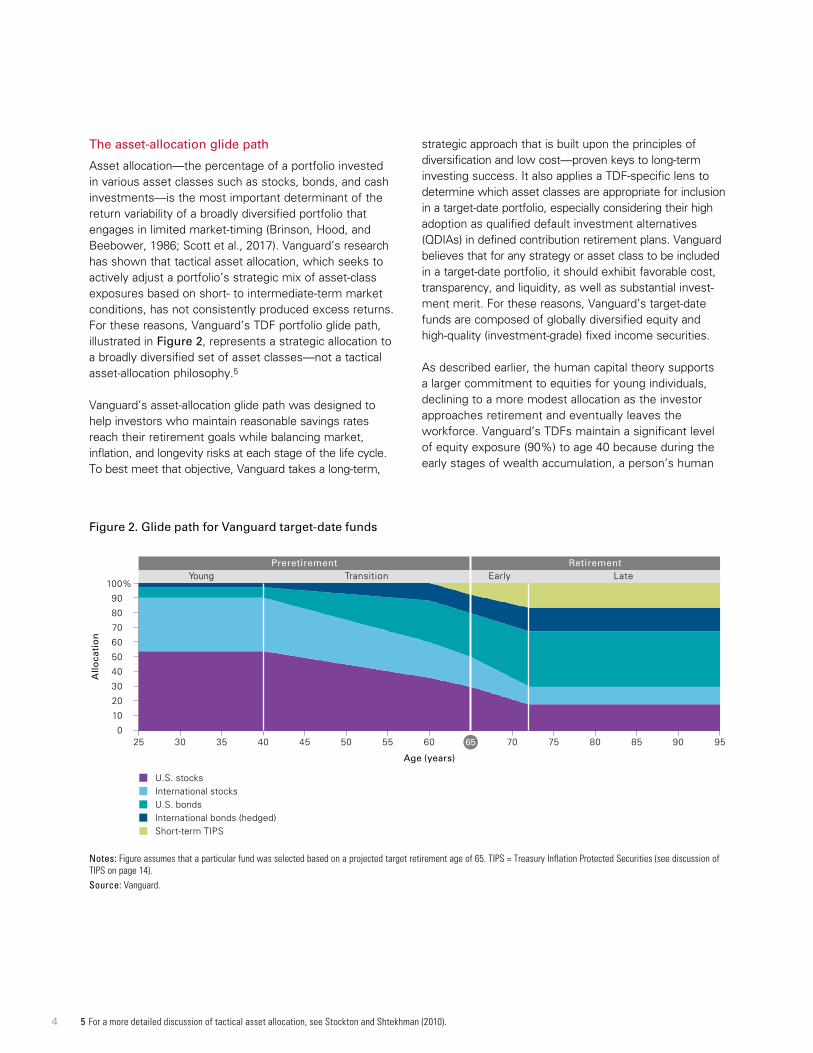
Asset allocation—the percentage of a portfolio invested in various asset classes such as stocks, bonds, and cash investments—is the most important determinant of the return variability of a broadly diversified portfolio that engages in limited market-timing (Brinson, Hood, and Beebower, 1986; Scott et al., 2017). Vanguard’s research has shown that tactical asset allocation, which seeks to actively adjust a portfolio’s strategic mix of asset-class exposures based on short- to intermediate-term market conditions, has not consistently produced excess returns. For these reasons, Vanguard’s TDF portfolio glide path, illustrated in Figure 2, represents a strategic allocation to a broadly diversified set of asset classes—not a tactical asset-allocation philosophy.5
Vanguard’s asset-allocation glide path was designed to help investors who maintain reasonable savings rates reach their retirement goals while balancing market, inflation, and longevity risks at each stage of the life cycle. To best meet that objective, Vanguard takes a long-term,
strategic approach that is built upon the principles of diversification and low cost—proven keys to long-term investing success. It also applies a TDF-specific lens to determine which asset classes are appropriate for inclusion in a target-date portfolio, especially considering their high adoption as qualified default investment alternatives (QDIAs) in defined contribution retirement plans. Vanguard believes that for any strategy or asset class to be included in a target-date portfolio, it should exhibit favorable cost, transparency, and liquidity, as well as substantial invest-ment merit. For these reasons, Vanguard’s target-date funds are composed of globally diversified equity and high-quality (investment-grade) fixed income securities.
As described earlier, the human capital theory supports a larger commitment to equities for young individuals, declining to a more modest allocation as the investor approaches retirement and eventually leaves the workforce. Vanguard’s TDFs maintain a significant level of equity exposure (90%) to age 40 because during the early stages of wealth accumulation, a person’s human
Figure 2. Glide path for Vanguard target-date funds
Notes: Figure assumes that a particular fund was selected based on a projected target retirement age of 65. TIPS = Treasury Inflation Protected Securities (see discussion of TIPS on page 14). Source: Vanguard.
Allo
cati
on
Age (years)
0
10
20
50
60
70
80
90
40
30
100%
25 30 35 40 45 50 55 60 70 75 80 85 90 9565
Young Transition Early Late
U.S. stocksInternational stocksU.S. bondsInternational bonds (hedged)Short-term TIPS
Preretirement Retirement

5
capital remains so dominant over the small balances in financial capital. After age 40, the equity allocation continues to decline until age 72, to compensate for the shifting balance between human and financial capital. This shift from equity to fixed income also aligns well with both the point at which investors begin to withdraw assets from their tax-deferred portfolios in meaningful amounts and the age (70½) at which they begin taking required minimum distributions (RMDs).
To help meet retirees’ need for diversification and growth potential for a number of years in retirement, Vanguard TDFs still offer 50% equity exposure at an investor’s designated retirement year (including both U.S. and international stocks; see Figure 2)—which is gradually reduced over the next seven years to 30%. This allocation recognizes that, if absolutely necessary, most preretirees and recent retirees still have the ability—though far less so than younger investors—to alter their retirement plans, and that modest exposure to equities can diversify their portfolios while providing important capital appreciation potential to protect against inflation and longevity risk. In
addition, most retirees have a substantial portion of their wealth in the form of relatively safe, inflation-adjusted Social Security benefits, which should be diversified with some exposure to the equity markets.
Simulated outcomes and measures of success
As part of the process of evaluating and identifying an appropriate glide path given this theoretical framework, we ran various financial simulations. We used the Vanguard Capital Markets Model (VCMM) to explore, in a rigorous, quantitative way, the potential financial implications of alternate risk-reward scenarios and different approaches to glide-path construction. The results of our simulations are presented below.
For example, Figure 3 illustrates three different glide paths, including that of Vanguard TDFs. They begin with varying levels of significant equity exposure and end at retirement with ranges of more moderate levels of equity exposure.
Figure 3. Vanguard TDF glide path compared with hypothetical more aggressive and more conservative glide paths
Glide-path equity allocations
Notes: Results may vary with each use and over time. For a detailed description of the assumptions used in the scenario analysis, see Appendix I. Source: Vanguard.
Eq
uit
y al
loca
tio
n
Age
0
40
20
60
80
100%
25 30 35 40 45 50 55 60 65 70 75 80 85 90 95
Aggressive glide pathVanguard glide pathConservative glide path

6 For a further breakdown of replacement ratios at various preretirement salary levels, see AON Consulting and Georgia State University’s 2008 Replacement Ratio Study: A Measurement Tool for Retirement Planning.
7 Note that in the annuity example, we do not assume payments are adjusted for inflation. This is because in most private, corporate pension plans, annuity benefit payments are not typically adjusted for inflation. It has also been Vanguard’s experience that among investors who do choose to annuitize retirement assets, the vast majority do not choose inflation-adjusted payout options. 6
Figure 4 compares the same glide paths under a baseline simulation yielding a predictable outcome. The more aggressive the path, the greater the wealth accumulation, on average. After contributing over a 40-year period, the median hypothetical Vanguard investor retired with 12.4 times his or her ending salary saved. Investors on the more aggressive glide path accumulated an additional 7% more for 13.3 times the investors’ ending salary saved. Conversely, investors on the more conservative glide path accumulated about 8% less than the Vanguard investors because of the lower equity allocation.
If we expect the risk-reward relationships of the past to prevail in the future, it makes sense that simulation output would conclude that bearing more market risk will lead to greater wealth accumulation and retirement income over an investor’s life cycle. Focusing solely on expected wealth accumulation over a 40-year time horizon, however, masks the intra-year volatility—and downside risk—that investors would need to endure in order to achieve higher wealth multiples. That said, more (or less) equity exposure over the life of the glide path may be appropriate for investors and plan sponsors, depending on their financial objectives and ability to avoid common behavioral pitfalls such as performance-chasing. If maximization of wealth is the primary goal, then a higher equity allocation would be an appropriate strategy. On the other hand, if the primary goal is to minimize risk and an investor is saving at a high rate, the more conservative glide path may be appropriate.
Evaluating retirement-income sufficiency
To evaluate the sufficiency of any TDF glide path, we need to identify a target for wealth accumulation that can realistically be expected to meet a reasonable retirement-spending goal. For this, Vanguard assumes a hypothetical investor earning $60,000 per year at age 65 will need to replace 78% of that age-65 salary, or $46,800, as an annual spending goal.6 An amount equal to 46% of the individual’s salary at age 65 ($27,600) will
come from Social Security, and an amount equal to 32% of that salary ($19,200) will come from private sources. One way to perform this evaluation is to determine the probability of the investor accumulating assets sufficient to purchase an immediate income annuity with an annual payout equal to the required income replacement needed from private sources.
The target level of wealth to purchase an appropriate annuity has been identified as approximately $341,000,7 or about 5.7 times the retiree’s $60,000 ending salary. Note that this level of savings is roughly equivalent to the 1st-percentile outcome of 5.7x in the Vanguard glide path. However, very few individuals end up using their balances to purchase immediate income annuities.
If the investor chooses instead to systematically draw down the portfolio in retirement, an additional evaluation is needed to help determine an adequate level of wealth accumulation and an appropriate asset allocation during retirement. We thus again assumed a spending need of $19,200 annually (32% of the investor’s preretirement income), adjusted for inflation, which translates to an income requirement of approximately 2.5% of median
Figure 4. Average wealth accumulation at retirement under different 40-year TDF glide paths
More More conservative Vanguard aggressive glide path glide path glide path
Median 11.4x 12.4x 13.3x
1st percentile 5.7x 5.7x 5.5x
Notes: This hypothetical illustration does not represent any particular investment and the rate is not guaranteed. Numbers in this chart represent multiples of an investor’s ending salary at retirement. For example, the median investor on the Vanguard glide path would accumulate assets equal to 12.4 times his or her ending salary over a 40-year investment period. See Appendix I for additional details on the simulation. Source: Vanguard.

8 Note that the 50% higher spending rate, though more aggressive than the 2008 AON study mentioned in Footnote 6, better approximates some preliminary Vanguard research estimates suggesting a higher total replacement ratio and a greater need for income coming from private sources. This potentially higher replacement ratio is primarily a function of higher anticipated health-care related expenses in retirement. 7
projected portfolio assets. (See Appendix II for a comparison of the material differences between an income annuity and a systematic withdrawal program.)
The far-right column of Figure 5 compares the probability that each glide path will enable an investor to accumulate sufficient assets to purchase an annuity with the designated annual payout at age 65. The probability of meeting the retirement-income objective through an annual systematic withdrawal is shown in the other two columns. Here we have defined the objective as having a positive balance at the ages of 85 and 95, essentially enough to last through the retirement years. In each simulation, the Vanguard glide path provides very high probabilities of at least 98% of reaching the goal. This outcome makes sense, as the spending rate of between 2% and 3% is less than the portfolio’s long-term expected return during the retirement years.
The next section presents our analysis of an expanded set of simulations we ran to test the portfolio’s longevity under more stressful scenarios and its performance using alternative glide paths. Our focus in these scenarios was on retirement-income adequacy. We wanted to address three common concerns: higher-than-expected spending needs during retirement, the risk of unfavorable equity markets as one enters retirement, and the trade-offs involved in maintaining different levels of market risk throughout retirement.
Retirement-income sufficiency under different assumptions and market conditions
Our first scenario evaluates retirement-income sufficiency under more aggressive spending assumptions. For this analysis, we apply a 50% higher spending rate to simulate an investor that spends more aggressively from his or her private assets during retirement.8 In Figure 6, we measure expected portfolio longevity assuming an
individual with a preretirement income of $60,000 who needs to replace 48% of their income from personal sources, or $28,800, rather than the 32% ($19,200) used in the previous analysis. One important detail: Despite the greater financial burden being placed on it, the portfolio is still expected to provide a relatively high likelihood of being able to meet either a series of systematic withdrawals or the purchase of an immediate income annuity (the latter of which we estimate would cost approximately $511,000).
Figure 5. Probability of achieving retirement-income needs under different TDF glide-path scenarios
Systematic drawdown
Positive Positive Cost of balance balance immediate at age 85 at age 95 annuity
More conservative glide path >99% 98% 99%
Vanguard glide path >99 98 99
More aggressive glide path >99 99 99
Source: Vanguard.
Figure 6. Probability of meeting retirement- income needs under different income- replacement assumptions
Systematic drawdown
Positive Positive Cost of balance balance immediate at age 85 at age 95 annuity
32% replacement ratio >99% 98% 99%
48% replacement ratio 95 85 85
Source: Vanguard.

8
The second scenario addresses a common concern often referred to as “sequence-of-returns risk.” This is the fear that capital market returns sour at retirement—the moment when investors become dependent upon their financial assets for income and have the most years of retirement ahead of them. Here, we maintained the higher retirement-spending rate (48%, or $28,800) and considered forward-looking glide-path simulations where global equities experienced an annualized return below –6.0% for the first five years of retirement (when the investor is between 65 and 70 years old). While the –6% annual return threshold does not hold any significance from an investment perspective, we chose it because of the 10,000 unique market simulations generated by the VCMM, about 100 met this requirement—providing both an ample number of observations to evaluate and
a sufficiently negative market environment for our consideration. The solid green line in Figure 7 shows our median wealth outcome for this adverse market scenario; the solid blue line shows the median outcome for the full set of forward-looking glide path simulations. As expected, the total value of the portfolio declines in the stress case because of the run of poor returns seen between ages 65 and 70. In both scenarios, however— and even with a negative market event during a highly sensitive time in the investor life cycle—the value of the portfolio remains positive through age 95.
Figure 7 also includes the 1st- and 25th-percentile outcomes from this bear market scenario (shown as a gray dashed line and a purple dashed line, respectively). Note that the percentiles represent the distribution of
Figure 7. Distribution of wealth in scenarios where global equities experienced an annualized return below –6% for the first five years of retirement
Note: This hypothetical illustration does not represent the return on any particular investment and the rate is not guaranteed. Source: Vanguard.
0%
20%
40%
60%
80%
100%
-6 -4 -2 0 2 4 6
-15
-10
-5
0
5
10
15
0.0
0.1
0.2
0.3
0.4
0.5
0.6
0.7
0.8
0%
100%
200%
300%
400%
500%
2012201120102009200820072006200520042003Notes: dot size = p4
to change size: select same appearance; go to effect > convert to shape > ellipse > absolute
1p
5th
95th
Percentileskey:
75th
25th
Median
5th
95th
Percentileskey:
75th
25th
Median
–6
–3
0
3
6
9
12
15%
Top Bottom
Axi
s la
bel
if n
eed
ed
Axis label if needed
-6%
-3%
0%
3%
6%
9%
12%
15%
0
200000
400000
600000
800000
1000000
Po
rtfo
lio b
alan
ce (
in U
.S. d
olla
rs)
Age
0
400,000
200,000
600,000
800,000
$1,000,000
25 30 35 40 45 50 55 60 65 70 75 80 85 90 95
Median outcome with full set of market simulationsMedian outcome with 5-year stress scenario
1st-percentile outcome with 5-year stress scenario25th-percentile outcome with 5-year stress scenario

9
outcomes for the adverse market scenarios only (that is, for the 100 poor equity market scenarios). In these limited instances, portfolio assets are depleted between ages 75 and 95. These undesirable outcomes are hardly surprising, given the extremely negative sequence of returns early in retirement coupled with smaller wealth accumulation during the investor’s working years. In these scenarios, it is very difficult to avoid portfolio depletion through asset allocation adjustments alone; behavioral modifications such as reduced spending in retirement or increased savings prior to retirement will almost certainly be required.
For the final analysis of this section, we considered the trade-offs involved in maintaining more or less market risk during the retirement phase of the investor life cycle.
Using the same 48% higher income need from private sources as used in the first two scenarios, we constructed two alternative glide paths, naming them “Higher Landing Point” and “Lower Landing Point” (see Figure 8). Both glide paths fully replicate the Vanguard glide path leading up to retirement at age 65. After that—and as their names would suggest—Higher Landing Point gradually transitions from 50% globally diversified equity exposure at age 65 to 40% globally diversified equity exposure at 72 and remains static thereafter, while Lower Landing Point de-risks more aggressively, going from 50% to 20% global equity exposure over the same seven years. (As shown in the figure, the Vanguard glide path falls exactly between the two alternative glide paths, ending at 30% globally diversified equity exposure.)
Figure 8. Alternative glide paths with higher and lower equity allocations in retirement
Glide-path equity allocations
Source: Vanguard.
Eq
uit
y al
loca
tio
n
Age
0
40
20
60
80
100%
25 30 35 40 45 50 55 60 65 70 75 80 85 90 95
Higher Landing PointVanguard glide pathLower Landing Point

10
Figure 9 depicts the probability of a positive balance, and the median wealth expectations, generated by each of the three glide paths at ages 65, 85, and 95. All three overlap at age 65, of course, since there are no differences in their asset allocations or investor assumptions. Over time, differences gradually emerge, which become more pronounced later in retirement. But even at age 95, we find no significant differences in the overall probability of maintaining a positive balance: The Vanguard glide path provides an 85% probability, and the other two glide paths yield comparable results (87% for Higher Landing Point, 82% for Lower Landing Point).
Although roughly equivalent in terms of the overall likeli-hood of depleting financial assets, differences in relative outcomes are more pronounced when considering the expected dollar-value of wealth. By maintaining greater market risk during retirement, Higher Landing Point is expected to accumulate approximately $1 million by age 95. This dollar amount reflects approximately 50% greater wealth creation than that attained by the Lower Landing Point and 20% more wealth creation than the Vanguard glide path at the same point in time. Thus, all else being equal, maintaining additional equity exposure is expected to produce greater amounts of wealth—which may provide investors with more financial flexibility, additional protection against longevity risk, or both.
Figure 9. Probability of a positive balance and median wealth under alternative glide-path scenarios
Note: This hypothetical illustration does not represent the return on any particular investment and the rate is not guaranteed. Source: Vanguard.
Pro
bab
ility
of
a p
osi
tive
bal
ance
Age
75
80
85
90
95
100%
6055 7065
$746,825$746,825$746,825 $881,206
$794,497$713,247
$991,901$814,894
$656,139
8075 9085 10095 105
Higher Landing PointVanguard glide pathLower Landing Point

9 Vanguard’s proprietary life-cycle model (VLCM) incorporates a utility-based framework that allows Vanguard to quantitatively assess the significance of different asset allocation glide paths, and subsequent changes in expected wealth outcomes, in terms of the value (utility) that investors derive from different levels of wealth relative to the dispersion of potential outcomes. Generally speaking, negative outcomes (i.e., financial losses) are penalized more significantly than positive outcomes of equal magnitude or dollar value. 11
However, it is important to remember that maintaining higher equity exposure is not without its trade-offs. We highlight one such trade-off in Figure 10, which shows the distribution of worst one-year returns for each glide path during retirement.
To achieve the higher wealth accumulation shown in Figure 9, investors must take on higher market risk. Figure 10 demonstrates the greater volatility and downside risk that equities may exhibit over shorter periods of time. In terms of median outcomes, Higher Landing Point results in more downside risk than either the Vanguard glide path (35% more) or Lower Landing Point (71% more). Ultimately, the decision to maintain more or less market risk is neither right nor wrong. It is
dependent upon investor or plan sponsor objectives. As a simple rule of thumb, if longevity risk or additional financial objectives beyond basic retirement income is the primary goal, then holding a larger allocation to equities may be prudent. However, if capital preservation is the primary objective, or if the investor maintains modest retirement-income needs, less market risk is likely to produce a better investor experience.9
Because investor preferences and demographics are extremely heterogeneous, we believe that, for Vanguard TDFs, having a 30% global equity exposure as the landing point provides a reasonable balance of market, longevity, and inflationary risks.
Figure 10. Distribution of worst one-year returns during retirement under alternative glide-path scenarios
Note: This hypothetical illustration does not represent the return on any particular investment and the rate is not guaranteed. Source: Vanguard.
Vanguard glide path
–4.8%
5th
95th
Percentileskey:
75th
25th
Median
–15
–12
–9
–6
–3
0%
Lower Landing Point
On
e-y
ear
retu
rns
Axis label if needed
Higher Landing PointVanguard glide pathLower Landing Point
Higher Landing PointVanguard glide pathLower Landing Point
Higher Landing Point
–6.5%
–3.8%

Sub-asset allocation of the glide path: diversifying within major asset classes
Once an appropriate level of risky asset exposure at each point along the investor life cycle has been determined—that is, once the Vanguard glide path has been established—the focus turns to sub-asset allocation among various types of stocks and bonds. For broadly diversified, balanced portfolios such as the Vanguard TDFs, exposure to all key sub-asset classes allows the investor to participate in some of the stronger-performing sectors while mitigating the negative impact of weaker-performing ones.
The level and rate of change of equity exposure as the investor ages are the most recognizable components of risk in TDFs and their most significant drivers of long-term performance. However, over shorter periods, performance differentials can also stem from the portfolio’s relative allocation to sub-asset classes within stocks and bonds (Cole, Kinniry, and Donaldson, 2009). It is important for plan sponsors and investors to be aware of the trade-offs associated with various sub-allocations in both the more risky (stocks) and less risky (bonds) asset classes.
12
Higher savings rate increases probability of retirement sufficiency
Given the highly uncertain nature of the capital markets, investors need to understand what can and can’t be controlled. Stock and bond market returns cannot be controlled, and an individual’s spending needs can be difficult to project. That said, an individual does have control over how much they save leading up to their retirement.
Figure 11 examines the impact of changing an investor’s contribution rate and assumes that income replacement needs are 50% higher than our baseline expectation (48% of $60,000 at age 65 instead of 32% of $60,000 at age 65). We assume that an investor stayed the course on the Vanguard TDF glide path for the full 40-year accumulation horizon and increased (or decreased) their savings rate by 20%. All other assumptions other than spending in retirement and saving prior to retirement are the same and are detailed in Appendix I. So, for example, someone who had been saving 5% of their salary is now saving 6% or 4% of it. At both ages 85 and 95, the additional capital accumulation for the increased savings scenarios provides a higher probability of achieving the retirement-income
goal (98% and 92%, respectively) compared with saving at the baseline or reduced rate. A higher savings rate also improves portfolio longevity at age 85 and 95 (98% and 92% respectively) compared to taking more equity risk in the higher-landing-point glide path illustrated in figure 9 (96% and 87%, respectively).
Therefore, to reliably increase the probability of retirement readiness and reduce the probability of depleting the portfolio, prudent portfolio construction must be accompanied by a diligent savings program.
Figure 11. Probability of achieving retirement-income needs under different savings scenarios
Systematic drawdown
Positive Positive Cost of balance balance immediate at age 85 at age 95 annuity
Reduced savings rate 88% 70% 69%
Baseline savings 95 85 85
Increased savings rate 98 92 92
Source: Vanguard.

10 For an empirical analysis of REITs, see Philips, Walker, and Zilbering (2011). 13
U.S. equity allocations
The U.S. equity allocation in the Vanguard TDF portfolios is weighted according to prevailing market capitalization. This means that the investor will always have exposure to all segments of the broad U.S. stock market (large-, mid-, and small-cap stocks; growth and value stocks) in the exact proportion in which they are represented in the market.
A market-cap-weighted index reflects the consensus estimate of each company’s value at any given moment. In any efficient market, new information affects the price of one or more securities and is reflected instantaneously in an index via the change in market capitalization. Because current prices (and, hence, company values) are set based on current and expected events, market- cap-weighted indexes represent the expected, theoretically mean-variance-efficient, portfolio of securities in a given asset class (Rowley, Walker, and Zhu, 2019). Note that Vanguard does not maintain a separate allocation to real estate investment trusts (REITs) within the TDFs. However, we do include exposure to REITs as part of the U.S. and non-U.S. equity allocations at their market weights.10
International equity allocations
After the decision is made to invest globally, the next step is to determine an appropriate allocation. The standard financial-theory approach is to invest proportionally—whether globally or within a specific country or market—according to market capitalization. This method assumes that markets are reasonably efficient and that stock prices reflect all the available information, investment positions, and expectations of the investing community. However, the benefits of diversification are front-loaded (i.e., adding 100 stocks to a 1,000-stock portfolio has more impact than adding 100 stocks to a 1,100-stock portfolio). Our research has shown that allocations of 20% non-U.S. equities have provided about 85% of the maximum diversification benefit. Higher amounts such as 30% and 40% have provided more than 95% of this benefit.
Although historical analysis strongly supports the benefits of increasing global diversification, it also demonstrates that the theoretically optimal portfolio often was NOT the actual optimal portfolio over a given period. Therefore, we also take into consideration other factors such as an investor’s home-country preference, costs, liquidity, concentration, and regulatory constraints. We believe that if these factors are reasonably balanced against the incremental diversification benefit achieved, further movement to market-capitalization weights—a forward-looking efficient-market portfolio—is prudent.
Vanguard TDFs currently diversify a U.S. stock portfolio with international stocks equal to 40% of the total equity allocation. As of November 30, 2018, international equities accounted for roughly half of world equity market capitalization. Within the TDFs, non-U.S. stocks are represented by a market-cap-weighted index fund. This fund seeks to track the performance of a benchmark index that measures the investment return of stocks in the developed and emerging markets, excluding the United States.
U.S. fixed income allocations
Similar to our market-cap-weighted methodology for both U.S. and non-U.S. equities, Vanguard follows a market-proportional approach in the U.S. nominal investment-grade bond market to provide investors broad exposure across sectors, qualities, and maturities. We do not implement duration or credit tilts at any point along the glide path on a strategic or tactical basis. Instead, we use the full nominal investment-grade market to earn the higher returns often associated with credit and longer-maturity fixed income securities, combining them with the safety and liquidity of government and short-duration bonds to provide a strong ballast against the primary risk of a balanced portfolio: equity risk. We do not include high-yield bonds because they represent a relatively illiquid and small—albeit growing—portion of the taxable U.S. bond market, and, at market weight, would not significantly alter the risk-and-return makeup of a broadly diversified portfolio.

11 For a detailed discussion of TIPS, see The Vanguard Group (2006), Wallick and Marshall (2009), and Davis et al. (2012).14
Furthermore—and despite their higher historical returns compared to investment-grade bonds of similar duration—high-yield bonds exhibit both equity and fixed income characteristics that would increase a balanced portfolio’s downside risk during periods of equity market turmoil (if they replaced investment-grade bonds) (Philips, 2012). While younger investors are better positioned to take on the increased downside risk for the prospect of higher returns, an allocation to high-yield bonds could have no meaningful benefit for them, given the significant equity exposure early in the glide path. The same would be true for investors in or nearing retirement. Vanguard has therefore concluded that adding this exposure to its TDFs would complicate the structure without providing meaningful benefits.
Hedged international fixed income allocation
The Vanguard TDF fixed income allocation also includes a hedged exposure to international fixed income, which is the largest asset class in the investable universe, representing about 25% of the global liquid market and approximately 60% of all nominal investment-grade fixed income. As with other asset classes, we follow a market-proportional approach in the investment-grade international bond market.
Although risk factors such as interest rate fluctuations, inflation, economic cycles, and issues associated with changing or unstable political regimes may seem worrisome to U.S. investors, these should be viewed in the appropriate context. For example, although the bonds of any one country may be more volatile than comparable U.S. bonds, a portfolio that includes the bonds of many countries and issuers would benefit from imperfect correlations across those issuers.
It’s also important to note that currency fluctuations account for a significant portion of the volatility in interna-tional bonds—volatility that is mitigated by Vanguard’s decision to hedge this exposure. Vanguard research
suggests that a strategic allocation to hedge international bonds can further moderate risk in a diversified portfolio (Schlanger, Walker, and Roberts, 2018).
As it does when evaluating non-U.S. equities, Vanguard weighs factors including home-country preference, costs, liquidity, concentration, and regulatory constraints when assessing the appropriate allocation to non-U.S. fixed income. As with global stocks, we believe further movement to market-cap weights can be prudent. However, because the factors Vanguard considers when setting global allocations behave differently within fixed income and equities, appropriate allocations to these assets may differ. This asset class represents 30% of Vanguard TDFs’ fixed income exposure.
Short-term TIPS allocation
In a portfolio of traditional fixed income securities, investors cannot, with certainty, manage inflation risk—the risk that the returns earned over time will fall short of actual inflation. That is because a bond portfolio’s “real” (inflation-adjusted) value falls when actual inflation exceeds the “expected rate” of inflation that was built into market interest rates at the time the investor purchased the bond. The availability of Treasury Inflation Protected Securities (TIPS) over the past two decades—providing inflation-adjusted increases in both principal value and interest payments—has given investors the opportunity to manage the extent to which their fixed income portfolios are subject to general inflation risk.11
Although the risk of inflation is always present, it’s primarily in the later stages that investors should focus on tools to provide some protection. This is because in the accumulation stage, inflation protection can be effectively provided from salaries and higher real returning assets, such as equities. But once in retirement, it is much more difficult to add to a portfolio through additional earnings. Therefore, investors should balance the need to preserve capital through bonds and cash with the need to preserve their purchasing power.

12 Beta refers to a measure of the volatility of a security or a portfolio relative to a benchmark.13 For a more detailed discussion of the use of alternatives in target-date funds, see Tidmore et al. (2017), and for additional details and empirical analysis of commodities
as investments, see the Vanguard publication Investment Case for Commodities? Myths and Reality at https://advisors.vanguard.com/iam/pdf/ICRMR.pdf. 15
Because inflation-protected securities adjust to changes in inflation quickly, TIPS are an appropriate option for protecting a portion of their portfolio’s real value during retirement. Vanguard research shows that short-term TIPS have historically displayed a higher correlation to realized inflation with less duration risk than longer-term TIPS. This can provide investors with a stronger inflation hedge and less duration risk—albeit at the cost of somewhat lower total expected returns (Davis et al., 2012). The primary purpose of TIPS in the near-dated funds is to provide inflation protection, not to boost returns.
Vanguard thus dedicates a portion of each TDF to short-term U.S. TIPS as a partial hedge against unexpected changes in inflation, beginning five years before retirement and reaching a maximum allocation of approximately 17% of the total portfolio at age 72. In later-stage portfolios, the fixed income portion combines a market-proportional allocation within nominal U.S. and international hedged investment-grade bonds and a meaningful allocation to TIPS.
Because TDF portfolios use bonds as the primary diversifier for equities, it is important to recognize that the components of the bond allocation can contribute to the portfolio’s overall risk level and return variability, particularly over shorter periods. Historically, the correlation between stock and bond returns has been low; however, in extreme market conditions, the correlation between equities and higher-risk, more aggressive bonds (i.e., corporate bonds) is much higher, which can diminish the diversification benefit of holding bonds as a general asset class. In an extreme down market, an explicit allocation to TIPS in the more conservative portfolios also provides a potentially beneficial relative overweight to high-quality government bonds at a time when the investor can least afford the possibility that the bond allocation might react similarly to the equity allocation.
The role of nontraditional asset classes
Vanguard believes that there is a high watermark for asset classes and investment strategies to be included in a target-date portfolio, given a large heterogeneous investor population and the vehicle’s typical designation as a QDIA. This philosophy also applies to nontraditional and alternative asset classes and investment strategies. Although their popularity has grown in recent years, they have a long history of use in defined benefit plans, endowments and foundations. Often their intended use by these institutions is to improve the risk-return profile of the portfolio, but they may also be used to address specific risks (namely inflation), or to increase long-term expected returns. While there is no universally accepted definition of an alternative investment, these often include an overweight to REITs, high-yield bonds, commodities, currency, emerging-market bonds, private equity, and common hedge fund strategies, including long/short and market-neutral approaches.
Vanguard agrees that each of these can offer potential—sometimes meaningful—advantages compared with investing in traditional stocks, bonds, and cash. In fact, Vanguard simulations show modest improvements in portfolio risk-adjusted returns when including some of these types of investment strategies, because of fundamental differences in their drivers of return. However, such results are before fees and do not consider imple-mentation risks, lower transparency, and reduced liquidity, which often accompany such investments.
The extent to which these potential advantages can actually be captured remains a subject of great debate. And when it comes to strategies for which investable beta is not available, it is even more challenging to assess the degree to which the intended investment merits can be relied upon.12 Strategies such as long/short, market-neutral, and private equity largely depend on manager skill; success will therefore be dependent upon consistently selecting top managers.13

14 For a more detailed discussion on the expected outcomes from including a commodities allocation in a TDF, see Tidmore et al. (2017).16
For defined benefit, endowment, and foundation investment committees, these risks are known and understood in advance; however, the same conditions cannot be assumed for a typical TDF investor. Within the defined contribution landscape, therefore, the plan sponsor relies on their investment beliefs, plan objectives, oversight ability, and knowledge of the plan participants when assessing whether to include alternative assets.
Commodities provide a good example of the complexities introduced with alternative assets. Historically, commodities—specifically, commodity futures—have supplied diversification benefits to global stock and bond portfolios, and they have also been an effective hedge against inflation (despite their high stand-alone volatility). In addition, obtaining commodities exposure can often be accomplished in a relatively liquid and transparent manner.
Even so, including a commodities allocation would generally result in lower wealth accumulation (since at least some of its funding would otherwise be used for equities), higher fees, and greater complexity. Such complexities include the sizing and funding of a commodities allocation, the choice of indexing methodology, and tax and regulatory issues surrounding the nature of the “income” generated by commodities futures positions in a mutual fund. Vanguard TDF portfolios do not explicitly include an allocation to commodities futures because of our current assessment of the risks, costs, and complexities involved relative to the expected improvement in portfolio outcomes.14
Key implementation considerations
Active versus indexing
Discussions regarding the active/passive decision have become more commonplace among investors and investment professionals. There is no such thing as a purely passive TDF because glide-path construction and sub-allocation decisions are active choices. That said, Vanguard utilizes broadly diversified index funds as underlying investments for its TDFs because it believes they offer the most transparent and efficient implementation of our strategic portfolio construction decisions. Moreover, indexing has been instrumental in controlling—and reducing over time—the costs of investing, which are generally less than the fees charged by actively managed mutual funds. Specifically, actively managed funds typically have higher management fees coupled with higher transaction costs. The higher fees often result from a portion of the management fee that must cover the research process; higher transaction costs are attributable to the generally higher turnover associated with active management’s attempt to outperform the market.
While active management does offer the opportunity to outperform the market, years of financial practice lead us to conclude that it is difficult to identify skilled managers in advance—and to stick with them through their inevitable bouts of underperformance.

17
Figure 12 provides a sense of how active management has performed compared with passive management across common asset classes and sub-asset classes— and highlights how difficult it can be for active managers to outperform their indexes (and thus their indexed peers). The difference in performance is even more pronounced when active funds that were closed or merged during the covered period are taken into account. More than 50% of the surviving active managers underperformed the average return of low-cost index funds in all five style categories.
Ultimately, Vanguard believes that low-cost active management can play an important role in retirement plans for investors. However, because, on average,
active managers can’t add value, we feel that assuming active risk for the prospect of outperformance is a decision that should be made knowingly by investors and plan sponsors based on their goals and beliefs regarding active management.
Given this, we are confident that a fully passive implementation of the glide path is an appropriate strategy for its series of target-date portfolios because it best captures the benefits of its portfolio construction expertise via a low-cost, highly transparent, and broadly diversified investment vehicle.
Figure 12. Percentage of actively managed funds that underperformed their benchmarks
Notes: Data are for the ten years ended December 31, 2017. The actively managed funds are those listed in the respective Morningstar categories. Benchmarks reflect those identified in each fund’s prospectus. Sources: Vanguard calculations, based on data from Morningstar, Inc.
0%
20%
40%
60%
80%
100%
-6 -4 -2 0 2 4 6
-15
-10
-5
0
5
10
15
0
20
40
60
80
100
0%
100%
200%
300%
400%
500%
2012201120102009200820072006200520042003Notes: dot size = p4
to change size: select same appearance; go to effect > convert to shape > ellipse > absolute
1p
5th
95th
Percentileskey:
75th
25th
Median
5th
95th
Percentileskey:
75th
25th
Median
–6
–3
0
3
6
9
12
15%
Top Bottom
Axi
s la
bel
if n
eed
ed
Axis label if needed
-6%
-3%
0%
3%
6%
9%
12%
15%
0.0
0.1
0.2
0.3
0.4
0.5
0.6
0.7
0.8
0
40
20
60
80
100%
U.S. large-cap blend U.S. small-cap blend International equity,developed markets
International equity,emerging markets
U.S. �xed income
Percentage of funds, surviving onlyPercentage of funds, adjusted to include “dead” funds (those that were closed or merged over the analysis period)

18
Conclusion
Target-date funds offer a professionally constructed portfolio created specifically for retirement investors. Vanguard TDFs have been designed by combining our capital-market expectations, portfolio construction research, and vast practical experience with investors to offer a broadly diversified portfolio that balances market, inflation, and longevity risks in an efficient and transparent manner over the investor life cycle. While Vanguard TDFs serve an extremely diverse investor population, robust quantitative analysis demonstrates a high likelihood of meeting a broad array of retirement-income objectives. However, the probability of successfully achieving an appropriate wealth accumulation or systematic withdrawal objective cannot be considered in isolation. Ultimately, in order to realize the projected outcomes, investors must save adequately and remain invested until (or, in the case of a systematic withdrawal program, beyond) the retirement date, regardless of the market environment.
References
Ameriks, John A., Michael Hess, and Scott Donaldson, 2008. Four Key Considerations for Target Date Funds. Valley Forge, Pa.: The Vanguard Group.
AON Consulting and Georgia State University, 2008. Replacement Ratio Study: A Measurement Tool for Retirement Planning. Chicago: Aon Consulting.
Bennyhoff, Donald G., 2008. Time Diversification and Horizon-Based Allocation Strategies. Valley Forge, Pa.: The Vanguard Group.
Brinson, Gary P., L. Randolph Hood, and Gilbert L. Beebower, 1986. Determinants of Portfolio Performance. Financial Analysts Journal 42(4): 39–48: reprinted in Financial Analysts Journal (50th Anniversary Issue) 51(1): 133–38.
Choi, James J., David Laibson, Brigitte C. Madrian, and Andrew Metrick, 2006. Saving for Retirement on the Path of Least Resistance. In Behavioral Public Finance: Toward a New Agenda, edited by Edward J. McCaffery and Joel Slemrod. New York: Russell Sage Foundation, 304–51.
Cocco, João F., Francisco J. Gomes, and Pascal J. Maehout, 2005. Consumption and Portfolio Choice Over the Life Cycle. Review of Financial Studies 18: 491–533.
Cole, C. William, Francis M. Kinniry Jr., and Scott Donaldson, 2009. Target Date Funds: Looking Beyond the Glide Path in 2008. Valley Forge, Pa.: The Vanguard Group.
Davis, Joseph, Roger Aliaga-Díaz, Charles J. Thomas, and Nathan Zahm, 2012. The Long and Short of TIPS. Valley Forge, Pa.: The Vanguard Group.
Davis, Joseph, Roger Aliaga-Díaz, Harshdeep Ahluwalia, Frank Polanco, and Christos Tasopoulos, 2014. Vanguard Global Capital Markets Model. Valley Forge, Pa.: The Vanguard Group.
Davis, Joseph, Roger Aliaga-Díaz, Harshdeep Ahluwalia, and Ravi Tolani, 2018. Improving U.S. Stock Return Forecasts: A “Fair-Value” CAPE Approach. The Journal of Portfolio Management. 44(3): 43–55.
Dimson, Elroy, Paul Marsh, and Mike Staunton, 2002. Triumph of the Optimists: 101 Years of Global Investment Returns. Princeton: Princeton University Press.
Gomes, Francisco J., and Laurence J. Kotlikoff, 2008. Optimal Life-Cycle Investing With Flexible Labor Supply: A Welfare Analysis of Life-Cycle Funds. American Economic Review (Papers and Proceedings) 98: 297–303.
Kinniry, Francis M. Jr., and Christopher B. Philips, 2012. The Theory and Implications of Expanding Traditional Portfolios. Valley Forge, Pa.: The Vanguard Group.
Mitchell, Olivia S., Gary R. Mottola, Stephen P. Utkus, and Takeshi Yamaguchi, 2007. The Dynamics of Lifecycle Investing in 401(k) Plans. Working paper. Philadelphia: Pension Research Council, University of Pennsylvania.
Mottola, Gary R., and Stephen P. Utkus, 2009. Flight to Safety? Market Volatility and Target-Date Funds. Valley Forge, Pa.: The Vanguard Group.
Nessmith, William E., Stephen P. Utkus, and Jean A. Young, 2007. Measuring the Effectiveness of Automatic Enrollment. Valley Forge, Pa.: The Vanguard Group.
Nessmith, William E. and Stephen P. Utkus, 2008. Target-Date Funds: Plan and Participant Adoption in 2007. Valley Forge, Pa.: The Vanguard Group.

19
Philips, Christopher B., David J. Walker and Yan Zilbering, 2011. REITs: Effective Exposure to Commercial Real Estate? Valley Forge, Pa.: The Vanguard Group.
Philips, Christopher B., 2012. Worth the Risk? The Appeal and Challenges of High-Yield Bonds. Valley Forge, Pa.: The Vanguard Group.
Rowley, James J., David J. Walker, and Carol Zhu, 2019. The Case for Low-Cost Index-Fund Investing. Valley Forge, Pa.: The Vanguard Group.
Schlanger, Todd, David J. Walker and Daren R. Roberts, 2018. Going Global With Bonds: The Benefits of a More Global Fixed Income Allocation. Valley Forge, Pa.: The Vanguard Group.
Scott, Brian J., James Balsamo, Kelly N. McShane, and Christos Tasopoulos, 2017. The Global Case for Strategic Asset Allocation and an Examination of Home Bias. Valley Forge, Pa.: The Vanguard Group.
Simon, Scott, 2004. In Indexing We Trust. Journal of Indexes, August/September issue; available at http://www.etf.com/publications/jounalofindexes/joi-articles/1811.html.
Stockton, Kimberly A., and Anatoly Shtekhman, 2010. A Primer on Tactical Asset Allocation Strategy Evaluation. Valley Forge, Pa.: The Vanguard Group.
Tidmore, Chris, Scott J. Donaldson, Daniel B. Berkowitz, and Daren R. Roberts, 2017. Assessing the Inclusion of Alternatives in Target-Date Funds. Valley Forge, Pa.: The Vanguard Group.
Vanguard Group, The, 2006. Investing in Treasury Inflation Protected Securities. Valley Forge, Pa.: The Vanguard Group.
Vanguard Group, The, 2018. How America Saves 2018: Vanguard 2018 Defined Contribution Plan Data. Valley Forge, Pa.: The Vanguard Group.
Viceira, Luis M., 2001. Optimal Portfolio Choice for Long-Horizon Investors with Nontradable Labor Income. Journal of Finance 56: 433–70.
Wallick, Daniel W., and Jill Marshall, 2009. TIPS and the Nature of Inflation Protection. Valley Forge, Pa.: The Vanguard Group.
Wilson, Jack W., and Charles P. Jones, 2002. An Analysis of the S&P 500 Index and Cowles’ Extensions: Price Indexes and Stock Returns, 1870–1999. Journal of Business 75(3).
Young, Jean A., and Galina Young, 2018. TDF Adoption in 2017. Valley Forge, Pa.: The Vanguard Group.
Appendix I. About the Vanguard Capital Markets Model and study assumptions
Vanguard Capital Markets Model
The Vanguard Capital Markets Model (VCMM) is a proprietary financial simulation tool developed and maintained by Vanguard’s Investment Strategy Group. The VCMM uses a statistical analysis of historical data for interest rates, inflation, and other risk factors for global equities, fixed income, and commodity markets to generate forward-looking distributions of expected long-term returns. The asset-return distributions shown in this paper are drawn from 10,000 VCMM simulations based on market data and other information available as of September 30, 2018.
The VCMM is grounded in the empirical view that the returns of various asset classes reflect the compensation investors receive for bearing different types of systematic risk (or beta). Using a long span of historical monthly data, the VCMM estimates a dynamic statistical relationship among global risk factors and asset returns. Based on these calculation, the model uses regression-based Monte Carlo simulation methods to project relationships in the future. In 2017, Vanguard made enhancements to VCMM by adopting a new methodology for forecasting global equity returns. This resulted in lower long-term equity return projections as well as a narrower range of simulated outcomes. For additional information regarding these changes to the equity model, or about VCMM more broadly, please see the research papers Improving U.S. Stock Return Forecasts: A “Fair-Value” CAPE Approach (Davis et al., 2018) and Vanguard Global Capital Markets Model (Davis et al., 2014).
Wage scale
Investor salary growth is modeled after the U.S. Social Security Administration’s wage index. The SSA wage index is based on reported wages across workers’ age spectrum 25–65 for low-, medium-, and high-income earners. This wage scale allows us to trace the earnings progression of an average earner over a 40-year working career, accounting for factors such as career development. Therefore, as modeled, the average participant reaches a peak salary at age 55 (in real terms) and experiences a

20
decline in real salary through the age of 65. In our life-cycle simulations, we also allow for annual salary growth of 1.1% on a real basis, in addition to the cross-sectional increase in the wage scale, to reflect the historical average productivity growth of the U.S. economy.
Contribution rates
Age-specific contribution rates are derived from How America Saves 2018 (The Vanguard Group, 2018), a report surveying the 4.9 million participants served by Vanguard’s recordkeeping business. Contribution patterns account for the likelihood that investors will start with a lower savings rate in their early working years and increase their contributions as retirement approaches. Contributions start at approximately 5% at age 25 and increase to approximately 10% at age 65. In addition, the simulations include a company match of $0.50 per dollar up to 3% of salary, which is consistent with industry averages.
Replacement ratios and drawdown scenarios
We follow industry convention in assuming that retirees will spend a percentage of the age-65 salary every year in retirement form a combination of Social Security benefits and investment income from private sources. In this paper, we focus on the portion of retirement income that is funded from a TDF investment. In addition to internal research, Vanguard draws on the work of Aon Consulting (with data taken from the U.S. Department of Labor’s Bureau of Labor Statistics “Consumer Expenditure Survey”) to develop different replacement ratios in order to assess TDF retirement-income adequacy under higher and lower spending needs.
Annuity examples
Annuity prices reflect Vanguard estimates for an immediate joint annuity for a 65-year old male and a 62-year old female couple with an annual payout equal to the required replacement ratio and a 50% benefit to the survivor. To
estimate future annuity prices, these prices were then adjusted upward by 10% to account for longer life expectancies 40 years in the future.
Asset returns
The asset-return distributions are based on 10,000 simulations from the VCMM. VCMM uses a statistical analysis of historical data to create forward-looking expectations for the U.S. and international capital markets.
The model uses index returns, without any fees or expenses, to represent asset classes. Taxes are not factored into the analysis. Inflation is modeled based on historical data from 1962 and simulated going forward with the median and volatility displayed in Figure A-1. U.S. stocks are represented by the MSCI US Broad Market Index; U.S. bonds are represented by the Bloomberg Barclays U.S. Aggregate Bond Index; international stocks are represented by the MSCI All Country World ex USA Index; inflation is calculated from the Consumer Price Index; and intermediate TIPS and cash are derived from underlying U.S. Treasury yield data from the Federal Reserve Board.
Figure A-1. Projected annualized 70-year asset- return distributions
Median return Standard deviation
Domestic equity 8.0% 17.5%
U.S. nominal bonds 4.4 5.9
Inflation 2.0 2.9
International equity 8.9 19.2
International bonds 4.2 4.6
Short-term TIPS 3.3 4.2
Source: Vanguard.

21
Appendix II. Comparing an annuity and a systematic withdrawal plan
Immediate-income annuity: Vanguard Annuity Access™ in collaboration with the Income Solutions® platform Systematic withdrawal plan
Objective To provide a fixed, guaranteed monthly payment for the life of the annuitant.
To gradually spend down a diversified portfolio that is managed for total return rather than income. The goal is to provide some reasonable level of income over time.
Payments Fixed payments are made monthly, unless the annuitant chooses annual adjustments according to an inflation-based index or a fixed percentage rate selected at the time of purchase.
Payments are normally made monthly. Strategies vary from simple percentage spending rules to more complicated Monte Carlo and tax sensitive withdrawals.
Investors’ spendable income is not limited to portfolio yield, but can be based on initial capital and a portfolio’s total return.
Costs and expenses
No initial sales loads, charges, or surrender fees. Fees are incorporated into the rate quoted at the time of purchase.
Also see “Taxes” below.
Expenses vary depending on the underlying assets involved.
Liquidity None; the annuitant surrenders any claim to principal in exchange for the annuity.
Depends on the assets involved. In most cases, shares can be redeemed at any time.
Guarantees and safety
Payments are guaranteed based on the claims- paying ability of the insurance company that issues the annuity.
The investor recieves no guarantees; payments and principal can go up or down significantly.
Fluctuation of principal
Not applicable, because the annuitant surrenders the principal.
Share prices can fluctuate significantly.
Taxes Payments are generally treated as ordinary income. Annuities purchased with after-tax dollars will receive a partial return of capital in each payment. Some states may assess a one-time premium tax on annuity purchases.
Distributions may consist of any combination of income, capital gains, and return of capital.
Note: There may be other material differences to consider.
Figure A-2. Projected 70-year asset-class correlations
Domestic U.S. nominal International International Short-term equity bonds Inflation equity bonds TIPS
Domestic equity 1.0
U.S. nominal bonds –0.1 1.0
Inflation 0.2 0.1 1.0
International equity 0.7 –0.2 0.0 1.0
International bonds –0.1 0.7 0.0 –0.2 1.0
Short-term TIPS 0.0 0.6 0.6 –0.2 0.5 1.0
Source: Vanguard.

© 2019 The Vanguard Group, Inc. All rights reserved. Vanguard Marketing Corporation, Distributor.
ISGTDF 032019
Vanguard Research
P.O. Box 2600 Valley Forge, PA 19482-2600
Connect with Vanguard® > vanguard.com
For more information about Vanguard funds, visit vanguard.com or call 800-662-2739 to obtain a prospectus. Investment objectives, risks, charges, expenses, and other important information about a fund are contained in the prospectus; read and consider it carefully before investing.
Annuities are long-term vehicles designed for retirement purposes and contain underlying investment portfolios that are subject to investment risk, including possible loss of principal.
Vanguard Annuity Access is offered in collaboration with Hueler Investment Services, Inc., through the Income Solutions platform. Income Solutions is a registered trademark of Hueler Investment Services, Inc., and used under license. United States Patent No. 7,653,560. Vanguard Annuity Access is provided by Vanguard Marketing Corporation, d/b/a VMC Insurance Services in California.
CFA® is a registered trademark owned by CFA Institute.