Embed Size (px)
Citation preview
iiCLIMATE RISK COUNTRY PROFILE: VANUATU
COPYRIGHT© 2021 by the World Bank Group1818 H Street NW, Washington, DC 20433Telephone: 202-473-1000; Internet: www.worldbank.org
This work is a product of the staff of the World Bank Group (WBG) and with external contributions. The opinions, findings, interpretations, and conclusions expressed in this work are those of the authors and do not necessarily reflect the views or the official policy or position of the WBG, its Board of Executive Directors, or the governments it represents.
The WBG does not guarantee the accuracy of the data included in this work and do not make any warranty, express or implied, nor assume any liability or responsibility for any consequence of their use. This publication follows the WBG’s practice in references to member designations, borders, and maps. The boundaries, colors, denominations, and other information shown on any map in this work, or the use of the term “country” do not imply any judgment on the part of the WBG, its Boards, or the governments it represents, concerning the legal status of any territory or geographic area or the endorsement or acceptance of such boundaries.
The mention of any specific companies or products of manufacturers does not imply that they are endorsed or recommended by the WBG in preference to others of a similar nature that are not mentioned.
RIGHTS AND PERMISSIONS The material in this work is subject to copyright. Because the WBG encourages dissemination of its knowledge, this work may be reproduced, in whole or in part, for noncommercial purposes as long as full attribution to this work is given.
Please cite the work as follows: Climate Risk Country Profile: Vanuatu (2021): The World Bank Group.
Any queries on rights and licenses, including subsidiary rights, should be addressed to World Bank Publications, The World Bank Group, 1818 H Street NW, Washington, DC 20433, USA; fax: 202-522-2625; e-mail: [email protected].
Cover Photos: © eGuide Travel, “Vanuatu” May 11, 2010 via Flickr, Creative Commons CC BY-NC-ND 2.0. © Tom Perry/World Bank, “An Information-communication Revolution in the Pacific” May 22, 2013 via Flickr, Creative Commons CC BY-NCND 2.0.
Graphic Design: Circle Graphics, Inc., Reisterstown, MD.
iiiCLIMATE RISK COUNTRY PROFILE: VANUATU
ACKNOWLEDGEMENTSThis profile is part of a series of Climate Risk Country Profiles that are developed by the World Bank Group (WBG). These profiles synthesize the most relevant data and information on climate change, disaster risk reduction, and adaptation actions and policies at the country level. The profile is designed as a quick reference source for development practitioners to better integrate climate resilience in development planning and policy making. This effort is co-led by Veronique Morin (Senior Climate Change Specialist, WBG) and Ana E. Bucher (Senior Climate Change Specialist, WBG).
This profile was written by Alex Chapman (Consultant, NEF Consulting), William Davies (Consultant, NEF Consulting), Ciaran Downey (Consultant, NEF Consulting) and MacKenzie Dove (Senior Climate Change Consultant, WBG). Technical review of the profiles was undertaken by Robert L. Wilby (Loughborough University). Additional support was provided by Megumi Sato (Junior Professional Officer, WBG), Jason Johnston (Operations Analyst, WBG) and Yunziyi Lang (Climate Change Analyst, WBG). This profile also benefited from inputs of WBG regional staff and country teams.
Climate and climate-related information is largely drawn from the Climate Change Knowledge Portal (CCKP), a WBG online platform with available global climate data and analysis based on the current Intergovernmental Panel on Climate Change (IPCC) reports and datasets. The team is grateful for all comments and suggestions received from the sector, regional, and country development specialists, as well as climate research scientists and institutions for their advice and guidance on use of climate related datasets.
ivCLIMATE RISK COUNTRY PROFILE: VANUATU
FOREWORD . . . . . . . . . . . . . . . . . . . . . . . . . . . . . . . . . . . . 1
KEY MESSAGES . . . . . . . . . . . . . . . . . . . . . . . . . . . . . . . . . . 2
COUNTRY OVERVIEW . . . . . . . . . . . . . . . . . . . . . . . . . . . . . . . 2
CLIMATOLOGY . . . . . . . . . . . . . . . . . . . . . . . . . . . . . . . . . . 5Climate Baseline 5
Overview 5Key Trends 5
Climate Future 6Model Ensemble 6RCPs 7
CLIMATE RELATED NATURAL HAZARDS . . . . . . . . . . . . . . . . . . . . . . 9Heat Waves 9Drought 10Flood, Cyclones, and Storm Surge 10
CLIMATE CHANGE IMPACTS . . . . . . . . . . . . . . . . . . . . . . . . . . . .11Natural Resources 11
Water 11The Coastal Zone 12Coral Reefs and Fisheries 13Island Ecology 14
Economic Sectors 15Agriculture and Food 15Tourism 16
Communities 17Poverty, Inequality and Vulnerability to Climate-Related Disaster 17Human Health 18
POLICIES AND PROGRAMS . . . . . . . . . . . . . . . . . . . . . . . . . . . 20National adaptation Policies and Strategies 20Climate Change Priorities of the WBG 20
CONTENTS
1CLIMATE RISK COUNTRY PROFILE: VANUATU
Climate change is a major risk to good development outcomes, and the World Bank Group is committed to playing
an important role in helping countries integrate climate action into their core development agendas. The World
Bank Group is committed to supporting client countries to invest in and build a low-carbon, climate-resilient future,
helping them to be better prepared to adapt to current and future climate impacts.
The World Bank Group is investing in incorporating and systematically managing climate risks in development
operations through its individual corporate commitments.
A key aspect of the World Bank Group’s Action Plan on Adaptation and Resilience (2019) is to help countries
shift from addressing adaptation as an incremental cost and isolated investment to systematically incorporating
climate risks and opportunities at every phase of policy planning, investment design, implementation and evaluation
of development outcomes. For all IDA and IBRD operations, climate and disaster risk screening is one of the
mandatory corporate climate commitments. This is supported by the World Bank Group’s Climate and Disaster Risk
Screening Tool which enables all Bank staff to assess short- and long-term climate and disaster risks in operations
and national or sectoral planning processes. This screening tool draws up-to-date and relevant information from
the World Bank Group’s Climate Change Knowledge Portal, a comprehensive online ‘one-stop shop’ for global,
regional, and country data related to climate change and development.
Recognizing the value of consistent, easy-to-use technical resources for client countries as well as to support
respective internal climate risk assessment and adaptation planning processes, the World Bank Group’s Climate
Change Group has developed this content. Standardizing and pooling expertise facilitates the World Bank Group in
conducting initial assessments of climate risks and opportunities across sectors within a country, within institutional
portfolios across regions, and acts as a global resource for development practitioners.
For developing countries, the climate risk profiles are intended to serve as public goods to facilitate upstream
country diagnostics, policy dialogue, and strategic planning by providing comprehensive overviews of trends
and projected changes in key climate parameters, sector-specific implications, relevant policies and programs,
adaptation priorities and opportunities for further actions.
It is my hope that these efforts will spur deepening of long-term risk management in developing countries and our
engagement in supporting climate change adaptation planning at operational levels.
Bernice Van BronkhorstGlobal Director
Climate Change Group (CCG)
The World Bank Group (WBG)
FOREWORD
2CLIMATE RISK COUNTRY PROFILE: VANUATU
• Vanuatu is warming and is expected to warm throughout the 21st century. Future rates of warming are clouded
by current models’ inability to simulate very localized changes but, warming is expected to be in the range of
0.7°C–2.9°C depending on the 21st century rate of global emissions.
• Natural variability between years, even decades, ensure short- and medium-term rainfall changes are difficult
to detect and project into the future. Further research is urgently required to develop models better suited to
modelling the future climate of Pacific Islands.
• The sea-level near Vanuatu is projected to increase throughout the 21st century, with models showing a
very high confidence in this trend. While Vanuatu’s islands have higher elevation than some Pacific Island
nations’, long-term sea-level rise, in combination with local tectonic movements, threatens coastal livelihoods
and infrastructure.
• Coral bleaching as a result of climate change is a significant risk to the country’s ecology and economy and is
part of the global picture of coral loss.
• A realignment of the nation’s fisheries is likely, but without careful and sustainable management the future
production outlook is not necessarily negative.
• Potential intensification of the most extreme tropical cyclone events threatens significant damage and loss
to Vanuatu’s population. The science underpinning our understanding of future Pacific circulation patterns is
weak, and likely trends are not well understood.
• Adaptation and disaster risk reduction efforts are hampered by Vanuatu’s lack of economic independence, high
community dependence on subsistence agriculture, and its inaccessible location. Climate change threatens to
drive poverty and inequality.
KEY MESSAGES
COUNTRY OVERVIEW
The Republic of Vanuatu is an island nation situated in the Melanesia region of Oceania. The country consists
of over 80 individual islands, over which is spread a population of over 299,800 people (2019)1 which has
been growing rapidly. The nation is culturally diverse, exemplified by its 138 distinct languages, although
there are only three languages officially recognized (English, French, and Bislama). Since Vanuatu declared
independence, in 1980, it has been a constitutional representative democracy.
The economy of Vanuatu, like surrounding island states, is based predominantly on the service sector (67% of GDP
value added), followed by agriculture (22%) and industry (11%). However, there is significant local dependence
on subsistence agriculture2 and issues of poverty and undernourishment are prevalent (Table 1). The nation
1 World Bank (2021). World Development Indicators. DataBank. [accessed 17 February, 2021]. URL: https://databank.worldbank.org/source/world-development-indicators
2 PCRAFI (2015). Vanuatu Country Note. Pacific Catastrophe Risk Assessment and Financing Initiative. The World Bank. URL: https://www.gfdrr.org/sites/default/files/publication/Pacific_Catastrophe_Risk_Insurance-Pilot_Report_140715%281%29.pdf
3CLIMATE RISK COUNTRY PROFILE: VANUATU
has extensive natural resources, including forests, uplands, corals, and atolls which provide habitats for unique
biodiversity and supplement the livelihoods of the 80% of the population that reside in rural areas.
Disasters resulting from natural hazards are a significant contributor to issues of social deprivation and impede
economic development in Vanuatu, costing on average an estimated 6% of GDP every year.1 The nation’s exposure
to natural hazards, extensive low-lying coastal zone, development context, and precarious natural resource base
mean it is amongst the most vulnerable nations to climate change in the world. Vanuatu published its Third National
Communication in 2020 and submitted its Updated Nationally Determined Contributions in 2020 to the UNFCCC.
These documents outline the country’s commitment to ensuring adaptation and climate change resilience and align
with the country’s development goals.
Green, Inclusive and Resilient RecoveryThe coronavirus disease (COVID-19) pandemic has led to unprecedented adverse social and economic impacts.
Further, the pandemic has demonstrated the compounding impacts of adding yet another shock on top of the multiple
challenges that vulnerable populations already face in day-to-day life, with the potential to create devastating health,
social, economic and environmental crises that can leave a deep, long-lasting mark. However, as governments
take urgent action and lay the foundations for their financial, economic, and social recovery, they have a unique
opportunity to create economies that are more sustainable, inclusive and resilient. Short and long-term recovery
efforts should prioritize investments that boost jobs and economic activity; have positive impacts on human, social
and natural capital; protect biodiversity and ecosystems services; boost resilience; and advance the decarbonization
of economies.
This document aims to succinctly summarize the climate risks faced by Vanuatu. This includes rapid onset and
long- term changes in key climate parameters, as well as impacts of these changes on communities, livelihoods and
economies, many of which are already underway. This is a high-level synthesis of existing research and analyses,
focusing on the geographic domain of Vanuatu, therefore potentially excluding some international influences and
localized impacts. The core climate projections presented are sourced from the Pacific-Australia Climate Change
Science and Adaptation Planning Program,3,4 as well as the World Bank Group’s Climate Change Knowledge Portal
(CCKP), incorporating climate projections from the Coupled Model Inter-comparison Project Phase 5 (CMIP5).
This document is primarily meant for WBG staff to inform their climate actions. The document also aims to direct
the reader to many useful sources of secondary data and research. For a meta-analysis of the research available
on climate change adaptation in small-island developing nations please see Klöck and Nunn (2019).5
3 Australian Bureau of Meteorology and CSIRO (2014) Climate Variability, Extremes and Change in the Western Tropical Pacific: New Science and Updated Country Reports. Pacific-Australia Climate Change Science and Adaptation Planning Program Technical Report, Australian Bureau of Meteorology and CSIRO, Melbourne, Australia. URL: https://www.pacificclimatechangescience.org/wp-content/uploads/2014/07/PACCSAP_CountryReports2014_WEB_140710.pdf
4 The NextGen projections for the Pacific region under CMIP5 are expected to be available from late 2021. These will provide an update on the PACCSAP 2014 projections referenced in this profile. The process for providing the new NextGen CMIP6 projections for the Pacific is still in the planning phase.
5 Klöck, C. and Nunn, P.D. (2019). Adaptation to Climate Change in Small Island Developing States: A Systematic Literature Review of Academic Research. The Journal of Environment & Development. URL: https://journals.sagepub.com/doi/abs/10.1177/ 1070496519835895
4CLIMATE RISK COUNTRY PROFILE: VANUATU
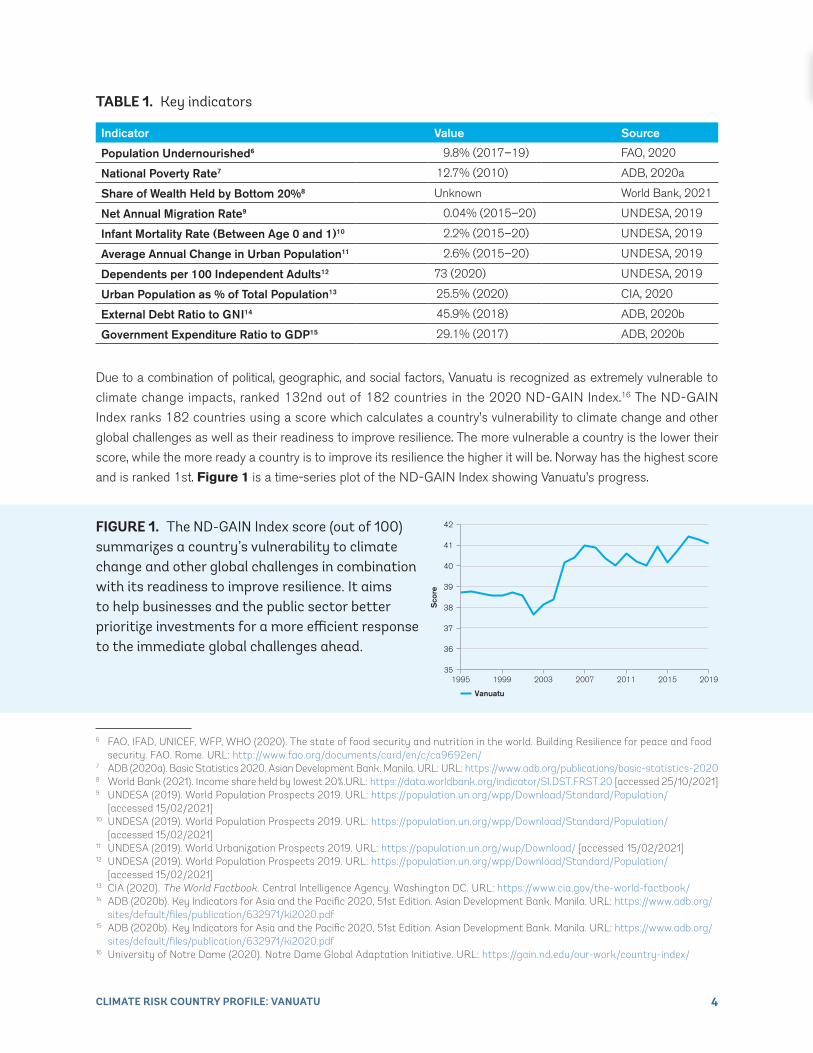
TABLE 1 . Key indicators
Indicator Value Source
Population Undernourished6 9.8% (2017–19) FAO, 2020
National Poverty Rate7 12.7% (2010) ADB, 2020a
Share of Wealth Held by Bottom 20%8 Unknown World Bank, 2021
Net Annual Migration Rate9 0.04% (2015–20) UNDESA, 2019
Infant Mortality Rate (Between Age 0 and 1)10 2.2% (2015–20) UNDESA, 2019
Average Annual Change in Urban Population11 2.6% (2015–20) UNDESA, 2019
Dependents per 100 Independent Adults12 73 (2020) UNDESA, 2019
Urban Population as % of Total Population13 25.5% (2020) CIA, 2020
External Debt Ratio to GNI14 45.9% (2018) ADB, 2020b
Government Expenditure Ratio to GDP15 29.1% (2017) ADB, 2020b
6 FAO, IFAD, UNICEF, WFP, WHO (2020). The state of food security and nutrition in the world. Building Resilience for peace and food security. FAO. Rome. URL: http://www.fao.org/documents/card/en/c/ca9692en/
7 ADB (2020a). Basic Statistics 2020. Asian Development Bank. Manila. URL: URL: https://www.adb.org/publications/basic-statistics-20208 World Bank (2021). Income share held by lowest 20%.URL: https://data.worldbank.org/indicator/SI.DST.FRST.20 [accessed 25/10/2021]9 UNDESA (2019). World Population Prospects 2019. URL: https://population.un.org/wpp/Download/Standard/Population/
[accessed 15/02/2021]10 UNDESA (2019). World Population Prospects 2019. URL: https://population.un.org/wpp/Download/Standard/Population/
[accessed 15/02/2021]11 UNDESA (2019). World Urbanization Prospects 2019. URL: https://population.un.org/wup/Download/ [accessed 15/02/2021]12 UNDESA (2019). World Population Prospects 2019. URL: https://population.un.org/wpp/Download/Standard/Population/
[accessed 15/02/2021]13 CIA (2020). The World Factbook. Central Intelligence Agency. Washington DC. URL: https://www.cia.gov/the-world-factbook/14 ADB (2020b). Key Indicators for Asia and the Pacific 2020, 51st Edition. Asian Development Bank. Manila. URL: https://www.adb.org/
sites/default/files/publication/632971/ki2020.pdf15 ADB (2020b). Key Indicators for Asia and the Pacific 2020, 51st Edition. Asian Development Bank. Manila. URL: https://www.adb.org/
sites/default/files/publication/632971/ki2020.pdf16 University of Notre Dame (2020). Notre Dame Global Adaptation Initiative. URL: https://gain.nd.edu/our-work/country-index/
Due to a combination of political, geographic, and social factors, Vanuatu is recognized as extremely vulnerable to
climate change impacts, ranked 132nd out of 182 countries in the 2020 ND-GAIN Index.16 The ND-GAIN
Index ranks 182 countries using a score which calculates a country’s vulnerability to climate change and other
global challenges as well as their readiness to improve resilience. The more vulnerable a country is the lower their
score, while the more ready a country is to improve its resilience the higher it will be. Norway has the highest score
and is ranked 1st. Figure 1 is a time-series plot of the ND-GAIN Index showing Vanuatu’s progress.
Vanuatu
Sco
re
1995 1999 2003 2007 2011 2015 2019
37
38
36
39
40
41
35
42FIGURE 1 . The ND-GAIN Index score (out of 100) summarizes a country’s vulnerability to climate change and other global challenges in combination with its readiness to improve resilience It aims to help businesses and the public sector better prioritize investments for a more efficient response to the immediate global challenges ahead
5CLIMATE RISK COUNTRY PROFILE: VANUATU
Climate Baseline
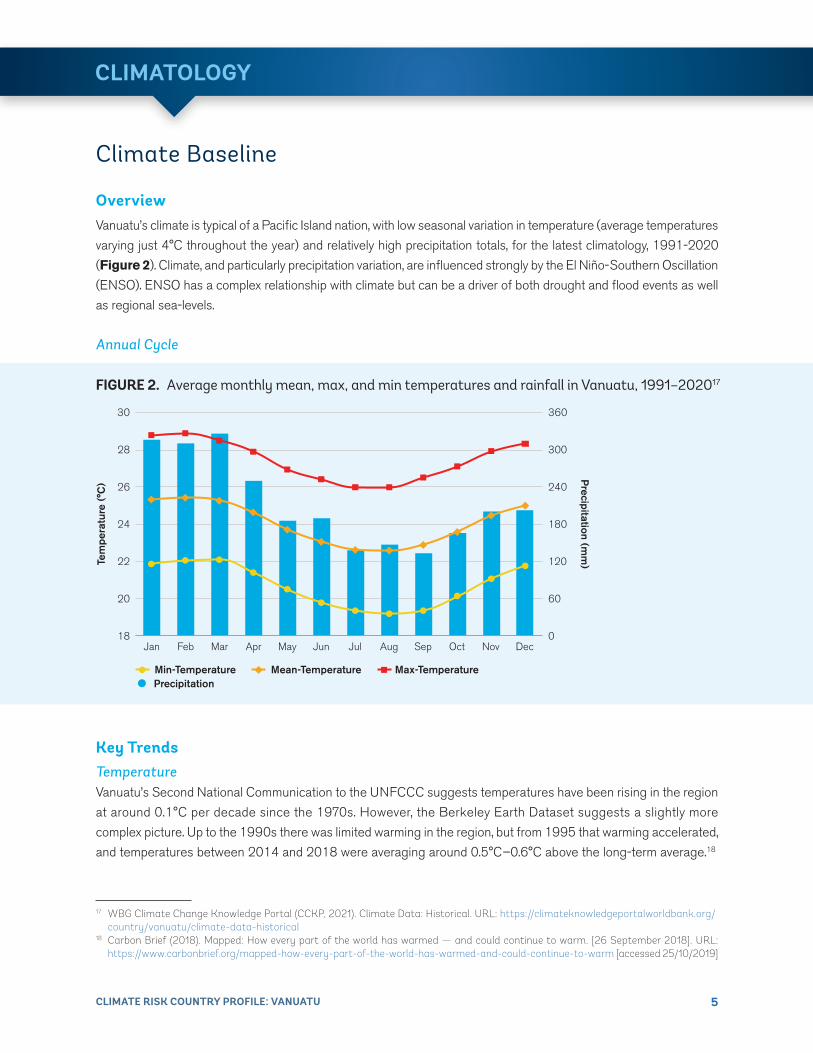
OverviewVanuatu’s climate is typical of a Pacific Island nation, with low seasonal variation in temperature (average temperatures
varying just 4°C throughout the year) and relatively high precipitation totals, for the latest climatology, 1991-2020
(Figure 2). Climate, and particularly precipitation variation, are influenced strongly by the El Niño-Southern Oscillation
(ENSO). ENSO has a complex relationship with climate but can be a driver of both drought and flood events as well
as regional sea-levels.
Annual Cycle
CLIMATOLOGY
17 WBG Climate Change Knowledge Portal (CCKP, 2021). Climate Data: Historical. URL: https://climateknowledgeportalworldbank.org/country/vanuatu/climate-data-historical
18 Carbon Brief (2018). Mapped: How every part of the world has warmed — and could continue to warm. [26 September 2018]. URL: https://www.carbonbrief.org/mapped-how-every-part-of-the-world-has-warmed-and-could-continue-to-warm [accessed 25/10/2019]
18
20
22
24
26
28
30
0
60
120
180
240
300
360
Tem
pera
ture
(°C
)
Precipitation (m
m)
Jan Feb Mar Apr May Jun Jul Aug Sep Oct Nov Dec
Min-Temperature Mean-Temperature Max-TemperaturePrecipitation
FIGURE 2 . Average monthly mean, max, and min temperatures and rainfall in Vanuatu, 1991–202017
Key TrendsTemperatureVanuatu’s Second National Communication to the UNFCCC suggests temperatures have been rising in the region
at around 0.1°C per decade since the 1970s. However, the Berkeley Earth Dataset suggests a slightly more
complex picture. Up to the 1990s there was limited warming in the region, but from 1995 that warming accelerated,
and temperatures between 2014 and 2018 were averaging around 0.5°C–0.6°C above the long-term average.18
6CLIMATE RISK COUNTRY PROFILE: VANUATU
PrecipitationA study has pointed to significant natural multi-decadal rainfall variability in the South Pacific Convergence Zone (which
Vanuatu is situated within). Observing records over 400 years, it shows abrupt changes of ∼1,800 millimeters (mm)
can occur between wet seasons.19 However, no changes in rainfall patterns significantly outside the range of normal
inter-annual variation have been documented and linked to human-induced climate changes.
Climate Future
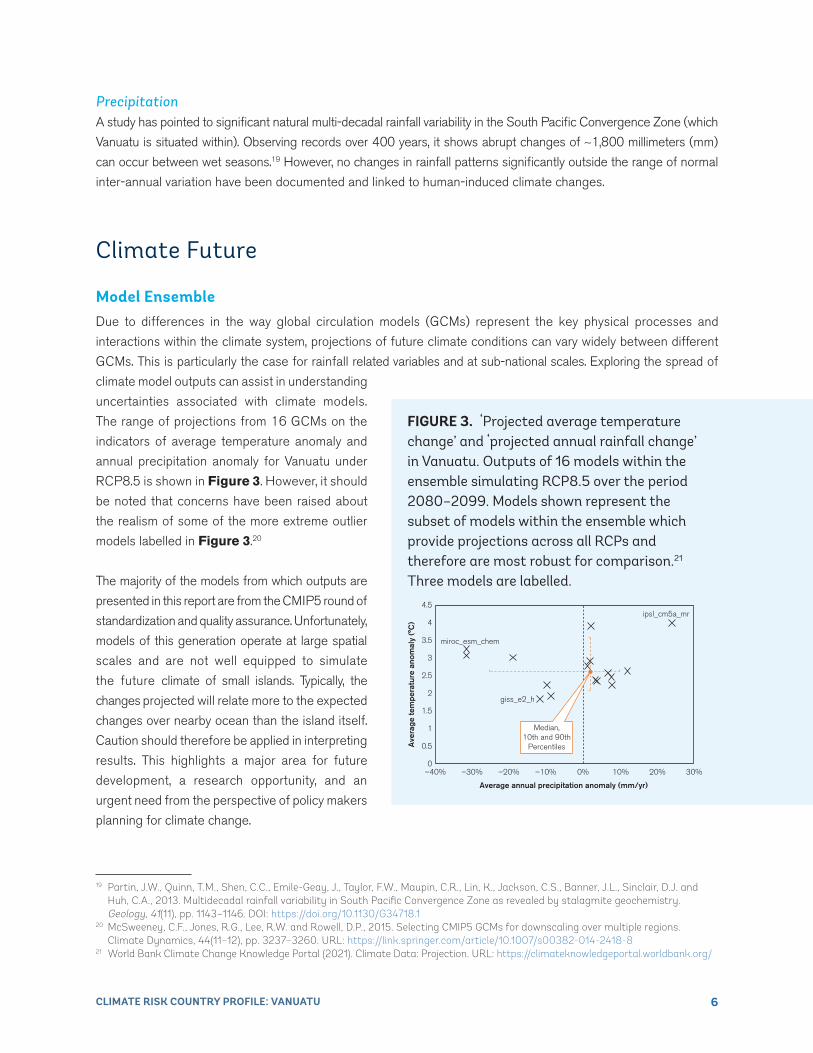
Model EnsembleDue to differences in the way global circulation models (GCMs) represent the key physical processes and
interactions within the climate system, projections of future climate conditions can vary widely between different
GCMs. This is particularly the case for rainfall related variables and at sub-national scales. Exploring the spread of
climate model outputs can assist in understanding
uncertainties associated with climate models.
The range of projections from 16 GCMs on the
indicators of average temperature anomaly and
annual precipitation anomaly for Vanuatu under
RCP8.5 is shown in Figure 3. However, it should
be noted that concerns have been raised about
the realism of some of the more extreme outlier
models labelled in Figure 3.20
The majority of the models from which outputs are
presented in this report are from the CMIP5 round of
standardization and quality assurance. Unfortunately,
models of this generation operate at large spatial
scales and are not well equipped to simulate
the future climate of small islands. Typically, the
changes projected will relate more to the expected
changes over nearby ocean than the island itself.
Caution should therefore be applied in interpreting
results. This highlights a major area for future
development, a research opportunity, and an
urgent need from the perspective of policy makers
planning for climate change.
19 Partin, J.W., Quinn, T.M., Shen, C.C., Emile-Geay, J., Taylor, F.W., Maupin, C.R., Lin, K., Jackson, C.S., Banner, J.L., Sinclair, D.J. and Huh, C.A., 2013. Multidecadal rainfall variability in South Pacific Convergence Zone as revealed by stalagmite geochemistry. Geology, 41(11), pp. 1143–1146. DOI: https://doi.org/10.1130/G34718.1
20 McSweeney, C.F., Jones, R.G., Lee, R.W. and Rowell, D.P., 2015. Selecting CMIP5 GCMs for downscaling over multiple regions. Climate Dynamics, 44(11–12), pp. 3237–3260. URL: https://link.springer.com/article/10.1007/s00382-014-2418-8
21 World Bank Climate Change Knowledge Portal (2021). Climate Data: Projection. URL: https://climateknowledgeportal.worldbank.org/
FIGURE 3 . ‘Projected average temperature change’ and ‘projected annual rainfall change’ in Vanuatu Outputs of 16 models within the ensemble simulating RCP8 5 over the period 2080–2099 Models shown represent the subset of models within the ensemble which provide projections across all RCPs and therefore are most robust for comparison 21 Three models are labelled
Ave
rage
tem
pera
ture
ano
mal
y (°
C)
giss_e2_h
ipsl_cm5a_mr
miroc_esm_chem
0
0.5
1
1.5
2
2.5
3
3.5
4
4.5
–40% –30% –20% –10% 0% 10% 20% 30%
Average annual precipitation anomaly (mm/yr)
Median,10th and 90th
Percentiles
7CLIMATE RISK COUNTRY PROFILE: VANUATU
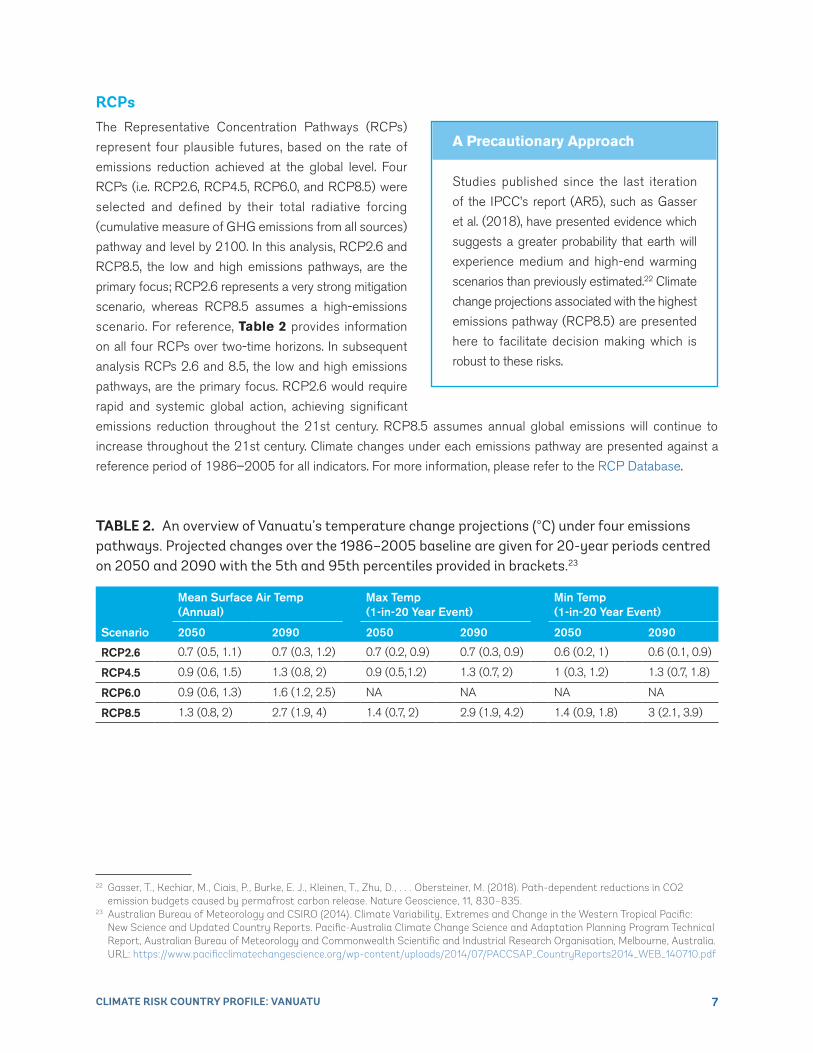
RCPsThe Representative Concentration Pathways (RCPs)
represent four plausible futures, based on the rate of
emissions reduction achieved at the global level. Four
RCPs (i.e. RCP2.6, RCP4.5, RCP6.0, and RCP8.5) were
selected and defined by their total radiative forcing
(cumulative measure of GHG emissions from all sources)
pathway and level by 2100. In this analysis, RCP2.6 and
RCP8.5, the low and high emissions pathways, are the
primary focus; RCP2.6 represents a very strong mitigation
scenario, whereas RCP8.5 assumes a high-emissions
scenario. For reference, Table 2 provides information
on all four RCPs over two-time horizons. In subsequent
analysis RCPs 2.6 and 8.5, the low and high emissions
pathways, are the primary focus. RCP2.6 would require
rapid and systemic global action, achieving significant
emissions reduction throughout the 21st century. RCP8.5 assumes annual global emissions will continue to
increase throughout the 21st century. Climate changes under each emissions pathway are presented against a
reference period of 1986–2005 for all indicators. For more information, please refer to the RCP Database.
22 Gasser, T., Kechiar, M., Ciais, P., Burke, E. J., Kleinen, T., Zhu, D., . . . Obersteiner, M. (2018). Path-dependent reductions in CO2 emission budgets caused by permafrost carbon release. Nature Geoscience, 11, 830–835.
23 Australian Bureau of Meteorology and CSIRO (2014). Climate Variability, Extremes and Change in the Western Tropical Pacific: New Science and Updated Country Reports. Pacific-Australia Climate Change Science and Adaptation Planning Program Technical Report, Australian Bureau of Meteorology and Commonwealth Scientific and Industrial Research Organisation, Melbourne, Australia. URL: https://www.pacificclimatechangescience.org/wp-content/uploads/2014/07/PACCSAP_CountryReports2014_WEB_140710.pdf
A Precautionary Approach
Studies published since the last iteration
of the IPCC’s report (AR5), such as Gasser
et al. (2018), have presented evidence which
suggests a greater probability that earth will
experience medium and high-end warming
scenarios than previously estimated.22 Climate
change projections associated with the highest
emissions pathway (RCP8.5) are presented
here to facilitate decision making which is
robust to these risks.
TABLE 2 . An overview of Vanuatu’s temperature change projections (°C) under four emissions pathways Projected changes over the 1986–2005 baseline are given for 20-year periods centred on 2050 and 2090 with the 5th and 95th percentiles provided in brackets 23
Scenario
Mean Surface Air Temp (Annual)
Max Temp (1-in-20 Year Event)
Min Temp (1-in-20 Year Event)
2050 2090 2050 2090 2050 2090
RCP2.6 0.7 (0.5, 1.1) 0.7 (0.3, 1.2) 0.7 (0.2, 0.9) 0.7 (0.3, 0.9) 0.6 (0.2, 1) 0.6 (0.1, 0.9)
RCP4.5 0.9 (0.6, 1.5) 1.3 (0.8, 2) 0.9 (0.5,1.2) 1.3 (0.7, 2) 1 (0.3, 1.2) 1.3 (0.7, 1.8)
RCP6.0 0.9 (0.6, 1.3) 1.6 (1.2, 2.5) NA NA NA NA
RCP8.5 1.3 (0.8, 2) 2.7 (1.9, 4) 1.4 (0.7, 2) 2.9 (1.9, 4.2) 1.4 (0.9, 1.8) 3 (2.1, 3.9)
8CLIMATE RISK COUNTRY PROFILE: VANUATU
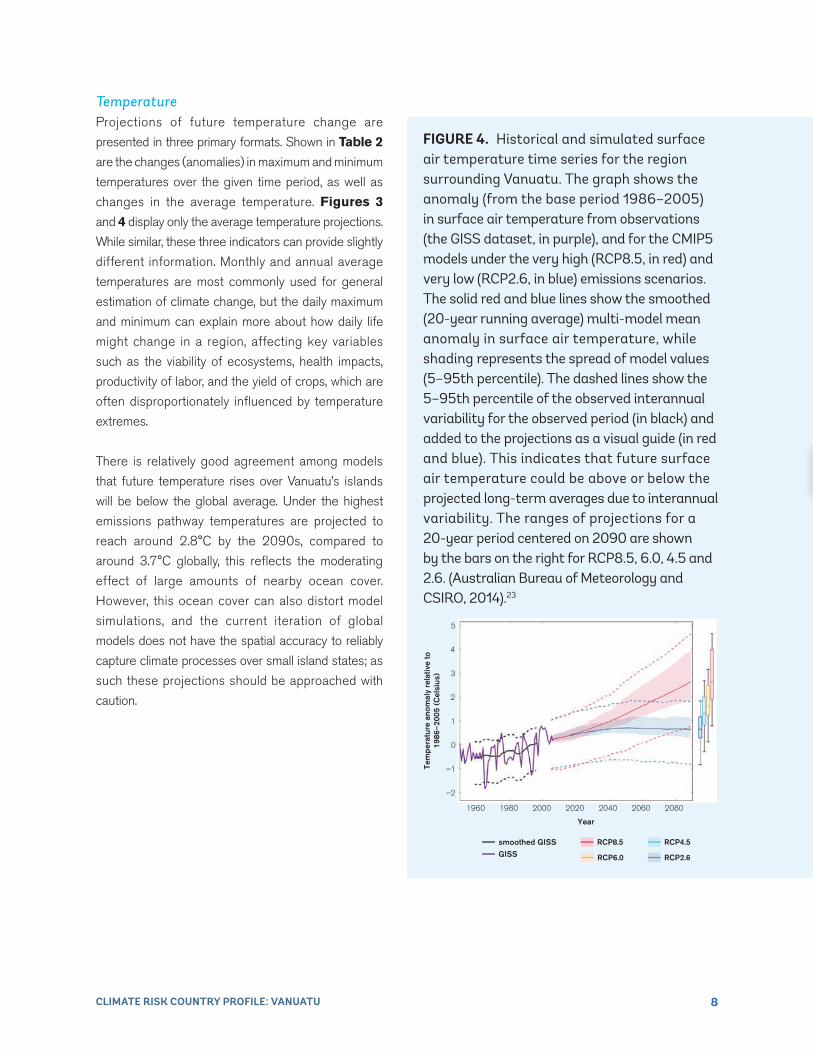
TemperatureProjections of future temperature change are
presented in three primary formats. Shown in Table 2
are the changes (anomalies) in maximum and minimum
temperatures over the given time period, as well as
changes in the average temperature. Figures 3
and 4 display only the average temperature projections.
While similar, these three indicators can provide slightly
different information. Monthly and annual average
temperatures are most commonly used for general
estimation of climate change, but the daily maximum
and minimum can explain more about how daily life
might change in a region, affecting key variables
such as the viability of ecosystems, health impacts,
productivity of labor, and the yield of crops, which are
often disproportionately influenced by temperature
extremes.
There is relatively good agreement among models
that future temperature rises over Vanuatu’s islands
will be below the global average. Under the highest
emissions pathway temperatures are projected to
reach around 2.8°C by the 2090s, compared to
around 3.7°C globally, this reflects the moderating
effect of large amounts of nearby ocean cover.
However, this ocean cover can also distort model
simulations, and the current iteration of global
models does not have the spatial accuracy to reliably
capture climate processes over small island states; as
such these projections should be approached with
caution.
FIGURE 4 . Historical and simulated surface air temperature time series for the region surrounding Vanuatu The graph shows the anomaly (from the base period 1986–2005) in surface air temperature from observations (the GISS dataset, in purple), and for the CMIP5 models under the very high (RCP8 5, in red) and very low (RCP2 6, in blue) emissions scenarios The solid red and blue lines show the smoothed (20-year running average) multi-model mean anomaly in surface air temperature, while shading represents the spread of model values (5–95th percentile) The dashed lines show the 5–95th percentile of the observed interannual variability for the observed period (in black) and added to the projections as a visual guide (in red and blue) This indicates that future surface air temperature could be above or below the projected long-term averages due to interannual variability The ranges of projections for a 20-year period centered on 2090 are shown by the bars on the right for RCP8 5, 6 0, 4 5 and 2 6 (Australian Bureau of Meteorology and CSIRO, 2014) 23
Tem
pera
ture
ano
mal
y re
lativ
e to
1986
–200
5 (C
elsi
us)
0
1
–1
–2
2
3
4
5
1960 1980 2000 2020 2040 2060 2080
Year
RCP2.6
RCP4.5
RCP6.0
RCP8.5GISSsmoothed GISS
9CLIMATE RISK COUNTRY PROFILE: VANUATU
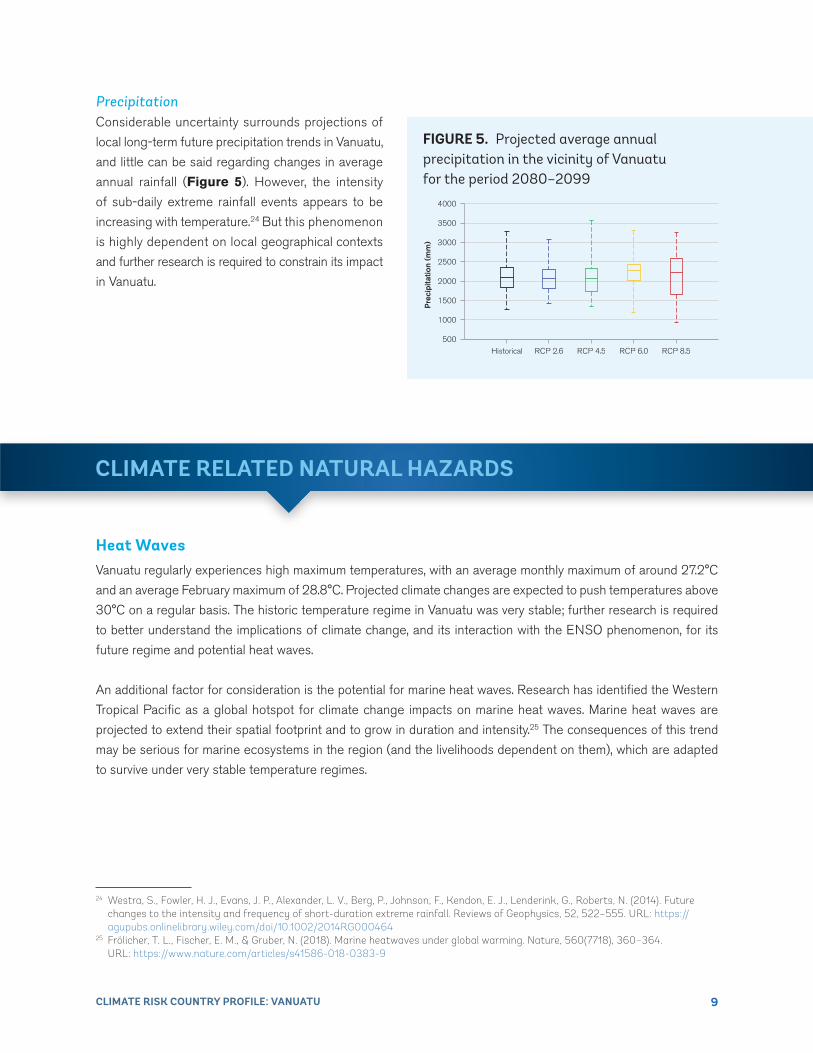
PrecipitationConsiderable uncertainty surrounds projections of
local long-term future precipitation trends in Vanuatu,
and little can be said regarding changes in average
annual rainfall (Figure 5). However, the intensity
of sub-daily extreme rainfall events appears to be
increasing with temperature.24 But this phenomenon
is highly dependent on local geographical contexts
and further research is required to constrain its impact
in Vanuatu.
Heat WavesVanuatu regularly experiences high maximum temperatures, with an average monthly maximum of around 27.2°C
and an average February maximum of 28.8°C. Projected climate changes are expected to push temperatures above
30°C on a regular basis. The historic temperature regime in Vanuatu was very stable; further research is required
to better understand the implications of climate change, and its interaction with the ENSO phenomenon, for its
future regime and potential heat waves.
An additional factor for consideration is the potential for marine heat waves. Research has identified the Western
Tropical Pacific as a global hotspot for climate change impacts on marine heat waves. Marine heat waves are
projected to extend their spatial footprint and to grow in duration and intensity.25 The consequences of this trend
may be serious for marine ecosystems in the region (and the livelihoods dependent on them), which are adapted
to survive under very stable temperature regimes.
CLIMATE RELATED NATURAL HAZARDS
24 Westra, S., Fowler, H. J., Evans, J. P., Alexander, L. V., Berg, P., Johnson, F., Kendon, E. J., Lenderink, G., Roberts, N. (2014). Future changes to the intensity and frequency of short-duration extreme rainfall. Reviews of Geophysics, 52, 522–555. URL: https://agupubs.onlinelibrary.wiley.com/doi/10.1002/2014RG000464
25 Frölicher, T. L., Fischer, E. M., & Gruber, N. (2018). Marine heatwaves under global warming. Nature, 560(7718), 360–364. URL: https://www.nature.com/articles/s41586-018-0383-9
Historical RCP 2.6 RCP 4.5 RCP 6.0 RCP 8.5
4000
3500
3000
2500
2000
1500
1000
500
Pre
cipi
tatio
n (m
m)
FIGURE 5 . Projected average annual precipitation in the vicinity of Vanuatu for the period 2080–2099
10CLIMATE RISK COUNTRY PROFILE: VANUATU
DroughtTwo types of drought may affect Vanuatu, meteorological (usually associated with a precipitation deficit) and
hydrological (usually associated with a deficit in surface and subsurface water flow). Meteorological drought is
expected to increase in frequency, with one study suggesting a potential doubling in the frequency of severe and
extreme droughts by the 2080s under RCP8.5.26 This represents a major risk as there is very high dependence
on rainwater for subsistence.27
Flood, Cyclones, and Storm SurgeVanuatu has very high exposure and vulnerability to the impact of flood, tropical cyclones, and storm surge which
can strike in combination or isolation. Cyclones bring coastal and flash flooding even when only passing in the
vicinity of the island. According to its Second National Communication to the UNFCCC around 20–30 cyclones
pass over Vanuatu every decade, around 3–5 of which will cause severe damage. In 2015 Cyclone Pam, a category 5
tropical cyclone, struck Vanuatu killing 11 people, destroying or damaging over 17,000 buildings and displacing
65,000 people. The economic damages associated with the incident were estimated to be equivalent to around
64% of GDP.28
Climate change is expected to interact with cyclone hazard in complex ways which are currently poorly understood.
Known risks include the action of sea-level rise to enhance the damage caused by cyclone-induced storm surges,
and the possibility of increased wind speed and precipitation intensity. Modelling of climate change impacts on
cyclone intensity and frequency conducted across the globe points to a general trend of reduced cyclone frequency
but increased intensity and frequency of the most extreme events.29,30 Trends emerging from the scientific literature
in regard to tropical cyclone genesis and tracks in the Pacific point towards a climate change-driven westward shift
in the genesis location of cyclones.31 Evaluation of the climate change implications for severe wind hazard have thus
far produced inconclusive results.32 Other characteristics, such as maximum wave height, have been shown to be
strongly linked to El Niño-Southern Oscillation, and as such will depend upon the poorly understood relationship
between climate change and ENSO.33 One study has suggested that under future climates, cyclone generation
26 Y. Li.; P. Urich. (2017). Climate Change Impact Assessment for Luganville, Vanuatu: ADB/CLIMsystems Ltd. (Unpublished.)27 Foster, T. and Willetts, J. (2018). Multiple water source use in rural Vanuatu: are households choosing the safest option for drinking?
International Journal of Environmental Health Research, 28(6), pp. 579–589. URL: https://doi.org/10.1080/09603123.2018.149195328 NABCCDRR (2015). Cyclone Pam post disaster needs assessment. National Advisory Board on Climate Change and Disaster Risk
Reduction. URL: https://www.nab.vu/cyclone-pam-post-disaster-needs-assessment [accessed 16/05/2019]29 Walsh, K., McBride, J., Klotzbach, P., Balachandran, S., Camargo, S., Holland, G., Knutson, T., Kossin, J., Lee, T., Sobel, A., Sugi, M. (2015).
Tropical cyclones and climate change. WIREs Climate Change: 7: 65–89. URL: https://onlinelibrary.wiley.com/doi/abs/10.1002/wcc.37130 Widlansky, M. J., Annamalai, H., Gingerich, S. B., Storlazzi, C. D., Marra, J. J., Hodges, K. I., . . . Kitoh, A. (2019). Tropical Cyclone
Projections: Changing Climate Threats for Pacific Island Defense Installations. Weather, Climate, and Society, 11(1), 3–15. DOI: https://doi.org/10.1175/WCAS-D-17-0112.1
31 Wu, L., Wang, C., & Wang, B. (2015). Westward shift of western North Pacific tropical cyclogenesis. Geophysical Research Letters, 42(5), 1537–1542. DOI: https://doi.org/10.1002/2015GL063450
32 Siquera, A., Arthur, A., Woolf, M. (2014) Evaluation of severe wind hazard from tropical cyclones — current and future climate simulations. Pacific-Australia Climate Change Science and Adaptation Planning Program. URL: https://ecat.ga.gov.au/geonetwork/srv/eng/catalog.search#/metadata/79681
33 Stephens, S. A., & Ramsay, D. L. (2014). Extreme cyclone wave climate in the Southwest Pacific Ocean: Influence of the El Niño Southern Oscillation and projected climate change. Global and Planetary Change, 123, 13–26. DOI: https://doi.org/https://doi.org/10.1016/ j.gloplacha.2014.10.002
11CLIMATE RISK COUNTRY PROFILE: VANUATU
will become more frequent during El Niño events, but less frequent during La Niña events.34 Further research is
required to better understand potential changes in cyclone seasonality and routes, and the potential for cyclone
hazards to be experienced in unprecedented locations.
Vanuatu already has a significant population and asset base exposed to flooding of different types. Over 10,000 people
and several thousand infrastructure assets are exposed to riverine flooding and several hundred people and
infrastructure assets are exposed to storm surge. This exposure is expected to increase as climate change causes
the sea-level to rise.
Natural Resources
WaterThe low-lying small island states of the Pacific face many challenges ensuring secure access to clean water.
Amongst the islands of Vanuatu, sources of water vary depending on the topography of the islands. Volcanic islands
do have some small rivers and streams but these are not present on low-lying islands.35 All of the larger islands,
along with some smaller ones, also have access to groundwater (although smaller islands are vulnerable to ground
water salinization).36 Most Pacific Island states are almost entirely dependent upon rainfall to support agricultural
production, and thus are highly vulnerable to rainfall variability.37
A report by Water Aid in 2018 based on WHO/UNICEF monitoring38 suggested only 90.5% of Vanuatu’s population
had access to at least a basic water supply. According to a 2009 census conducted by the Vanuatu National
Statistics Office the source for water usage varies depending on the activity it is being used for and between rural
and urban families. Most households in urban environments use shared or private piped water for both drinking
and washing but rainfall collected in tanks is also commonly used in rural areas, especially as a source of drinking
water.39 However, the safety of the water within rural rainwater tanks in Vanuatu has been found to commonly
be unhealthy for human consumption with relatively high levels of E. coli contamination.40 If extended periods
CLIMATE CHANGE IMPACTS
34 Chand, S. S., Tory, K. J., Ye, H., & Walsh, K. J. E. (2016). Projected increase in El Niño-driven tropical cyclone frequency in the Pacific. Nature Climate Change, 7, 123. URL: https://doi.org/10.1038/nclimate3181
35 FAO (2016). Aquastat: Vanuatu. URL: http://www.fao.org/nr/water/aquastat/countries_regions/VUT/36 SOPAC (2007). National Integrated Water Resource Management Diagnostic Report: Vanuatu. URL: https://www.pacificwater.org/
userfiles/file/GEF%20IWRM%20Final%20Docs/Vanuatu%20IWRM%20Diagnostic%20%20Report%20Vol%202%2014_04_07.pdf37 UNEP (2011). Freshwater Under Threat Pacific Islands: Vulnerability Assessment of Freshwater Resources to Environmental Change.
URL: https://www.zaragoza.es/contenidos/medioambiente/onu/830_eng.pdf38 Water Aid (2018). The State of the World’s Water 2018. URL: https://www.wateraidindia.in/sites/g/files/jkxoof336/files/the-water-
gap-state-of-water-report.pdf39 VNSO (2010). National Population and Housing Census, 2009. URL: https://catalog.ihsn.org/index.php/catalog/410240 Foster, T., & Willetts, J. (2018). Multiple water source use in rural Vanuatu: are households choosing the safest option for drinking?
International journal of environmental health research, 28(6), 579–589. URL: https://pubmed.ncbi.nlm.nih.gov/30079752/
12CLIMATE RISK COUNTRY PROFILE: VANUATU
of drought and increased groundwater salinization occur, the need to improve rainwater storage structures will
become more pressing. Aquifers used in Port Vila and Luganvile have already come under increased pressure and
will likely continue to do so as the population increases.30
The Coastal ZoneSea-level rise threatens significant physical changes to coastal zones around the world. Global mean sea-level
rise was estimated in the range of 0.44 meters (m) −0.74m by the end of the 21st century by the IPCC’s Fifth
Assessment Report41 but some studies published more recently have highlighted the potential for more significant
rises (Table 3). Localized sea-level rise can in fact be an extremely complex phenomenon to measure and model,
notably due to the influence of large-scale climate phenomena such as ENSO. Some studies have suggested that
the western Pacific has been experiencing above average rates of sea-level rise, but the extent to which this is
attributable to human-driven climate change and/or likely to continue requires further research.42
Sea-level rise is not just a threat due to long-term encroachment on coastal areas, but also due to the projected
increase in the frequency of extreme sea-level events.43 The return period of exceptionally high sea-levels, driven
by climate circulations, is expected to reduce and low-lying pacific island nations are particularly at risk.44 Studies
have shown that the extent of wave-driven flooding is impacted by coral reef height and health, highlighting the
importance of coral conservation.45
Vanuatu’s Second National Communication reports sea-level rise at a rate of around 6 mm/yr between 1990
and 2010 — slightly faster than the global average over the same period. Notably, the net rate at which the sea
is encroaching on Vanuatu’s islands can be significantly accelerated by the simultaneous subsidence of the land
driven by tectonic movements. Between 1997–2009 such movements almost doubled the rate of net sea-level
rise.46 Tectonic movements can hamper efforts to monitor sea-level rise.47 One study has modelled the expected
rates of coastal erosion under rising sea-levels.48 In the long run, coastal infrastructure may be threatened by
permanent inundation.
41 Church, J. a., Clark, P. U., Cazenave, A., Gregory, J. M., Jevrejeva, S., Levermann, A., . . . Unnikrishnan, A. S. (2013). Sea level change. In Climate Change 2013: The Physical Science Basis. Contribution of Working Group I to the Fifth Assessment Report of the Intergovernmental Panel on Climate Change (pp. 1137–1216). Cambridge, United Kingdom and New York, NY, USA: Cambridge University Press. URL: https://www.ipcc.ch/site/assets/uploads/2018/02/WG1AR5_Chapter13_FINAL.pdf
42 Peyser, C. E., Yin, J., Landerer, F. W., & Cole, J. E. (2016). Pacific sea level rise patterns and global surface temperature variability. Geophysical Research Letters, 43(16), 8662–8669.DOI: https://doi.org/10.1002/2016GL069401
43 Widlansky, M. J., Timmermann, A., & Cai, W. (2015). Future extreme sea level seesaws in the tropical Pacific. Science Advances, 1(8). DOI: https://doi.org/10.1126/sciadv.1500560
44 Vitousek, S., Barnard, P. L., Fletcher, C. H., Frazer, N., Erikson, L., & Storlazzi, C. D. (2017). Doubling of coastal flooding frequency within decades due to sea-level rise. Scientific Reports, 7(1), 1399.DOI: https://doi.org/10.1038/s41598-017-01362-7
45 Beetham, E., Kench, P. S., & Popinet, S. (2017). Future Reef Growth Can Mitigate Physical Impacts of Sea-Level Rise on Atoll Islands. Earth’s Future, 5(10), 1002–1014. DOI: https://doi.org/10.1002/2017EF000589
46 Ballu, V., Bouin, M.N., Siméoni, P., Crawford, W.C., Calmant, S., Boré, J.M., Kanas, T. and Pelletier, B., 2011. Comparing the role of absolute sea-level rise and vertical tectonic motions in coastal flooding, Torres Islands (Vanuatu). Proceedings of the National Academy of Sciences, 108(32), pp. 13019–13022. URL: https://www.ncbi.nlm.nih.gov/pmc/articles/PMC3156165/
47 Deo, M.N., Govind, R. and El-Mowafy, A., 2013. The Stability of Tide Gauges in the South Pacific Determined from Multi Epoch Geodetic Levelling, 1992 to 2010. Marine Geodesy, 36(3), pp. 261–284. DOI: https://doi.org/10.1080/01490419.2013.786003
48 Sahin, O., Stewart, R.A., Faivre, G., Ware, D., Tomlinson, R. and Mackey, B. (2019). Spatial Bayesian Network for predicting sea level rise induced coastal erosion in a small Pacific Island. Journal of environmental management, 238, pp. 341–351. URL: https://pubmed.ncbi.nlm.nih.gov/30856594/
13CLIMATE RISK COUNTRY PROFILE: VANUATU
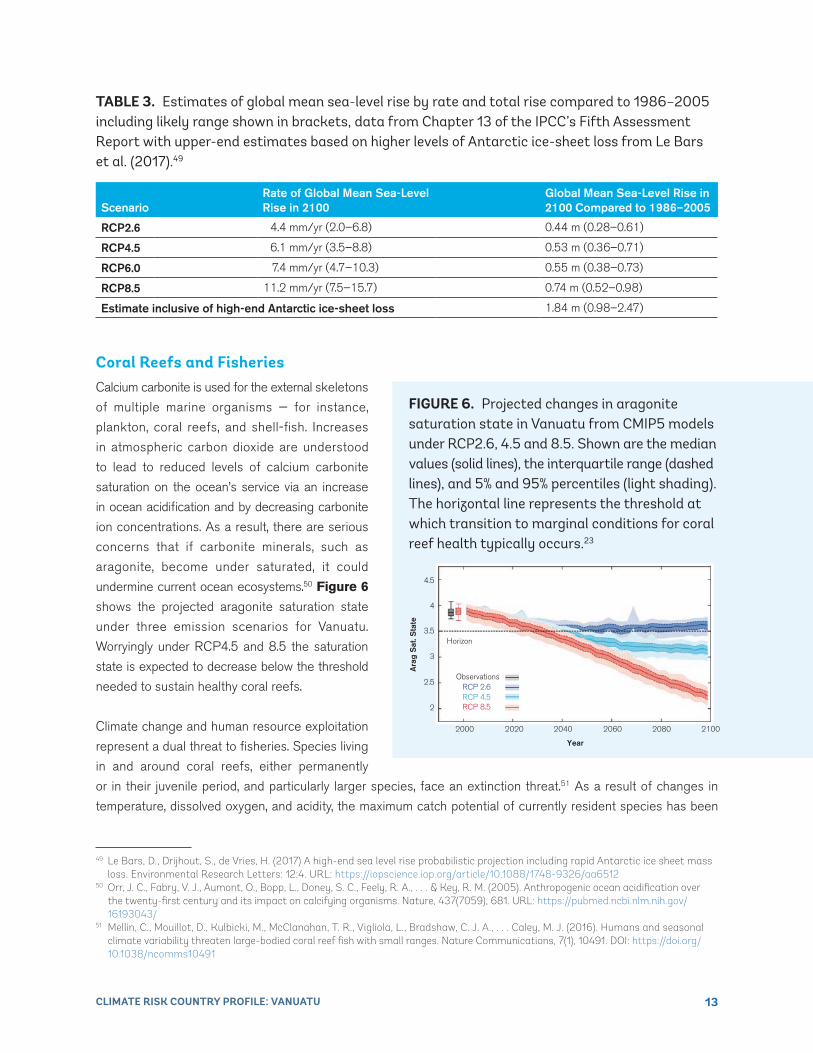
Coral Reefs and FisheriesCalcium carbonite is used for the external skeletons
of multiple marine organisms — for instance,
plankton, coral reefs, and shell-fish. Increases
in atmospheric carbon dioxide are understood
to lead to reduced levels of calcium carbonite
saturation on the ocean’s service via an increase
in ocean acidification and by decreasing carbonite
ion concentrations. As a result, there are serious
concerns that if carbonite minerals, such as
aragonite, become under saturated, it could
undermine current ocean ecosystems.50 Figure 6
shows the projected aragonite saturation state
under three emission scenarios for Vanuatu.
Worryingly under RCP4.5 and 8.5 the saturation
state is expected to decrease below the threshold
needed to sustain healthy coral reefs.
Climate change and human resource exploitation
represent a dual threat to fisheries. Species living
in and around coral reefs, either permanently
or in their juvenile period, and particularly larger species, face an extinction threat.51 As a result of changes in
temperature, dissolved oxygen, and acidity, the maximum catch potential of currently resident species has been
TABLE 3 . Estimates of global mean sea-level rise by rate and total rise compared to 1986–2005 including likely range shown in brackets, data from Chapter 13 of the IPCC’s Fifth Assessment Report with upper-end estimates based on higher levels of Antarctic ice-sheet loss from Le Bars et al (2017) 49
ScenarioRate of Global Mean Sea-Level Rise in 2100
Global Mean Sea-Level Rise in 2100 Compared to 1986–2005
RCP2.6 4.4 mm/yr (2.0–6.8) 0.44 m (0.28–0.61)
RCP4.5 6.1 mm/yr (3.5–8.8) 0.53 m (0.36–0.71)
RCP6.0 7.4 mm/yr (4.7–10.3) 0.55 m (0.38–0.73)
RCP8.5 11.2 mm/yr (7.5–15.7) 0.74 m (0.52–0.98)
Estimate inclusive of high-end Antarctic ice-sheet loss 1.84 m (0.98–2.47)
Ara
g S
at. S
tate
Horizon
4.5
4
3.5
3
2.5
2RCP 4.5RCP 2.6
Observations
RCP 8.5
20202000 2040 2060 2080 2100
Year
FIGURE 6 . Projected changes in aragonite saturation state in Vanuatu from CMIP5 models under RCP2 6, 4 5 and 8 5 Shown are the median values (solid lines), the interquartile range (dashed lines), and 5% and 95% percentiles (light shading) The horizontal line represents the threshold at which transition to marginal conditions for coral reef health typically occurs 23
49 Le Bars, D., Drijhout, S., de Vries, H. (2017) A high-end sea level rise probabilistic projection including rapid Antarctic ice sheet mass loss. Environmental Research Letters: 12:4. URL: https://iopscience.iop.org/article/10.1088/1748-9326/aa6512
50 Orr, J. C., Fabry, V. J., Aumont, O., Bopp, L., Doney, S. C., Feely, R. A., . . . & Key, R. M. (2005). Anthropogenic ocean acidification over the twenty-first century and its impact on calcifying organisms. Nature, 437(7059), 681. URL: https://pubmed.ncbi.nlm.nih.gov/ 16193043/
51 Mellin, C., Mouillot, D., Kulbicki, M., McClanahan, T. R., Vigliola, L., Bradshaw, C. J. A., . . . Caley, M. J. (2016). Humans and seasonal climate variability threaten large-bodied coral reef fish with small ranges. Nature Communications, 7(1), 10491. DOI: https://doi.org/ 10.1038/ncomms10491
14CLIMATE RISK COUNTRY PROFILE: VANUATU
forecast to decline significantly in Vanuatu.52 As a result there have been strong calls for support to communities to
identify suitable responses and financing mechanisms, and to adapt to the changing marine environment.53
Climate change is expected to have a far smaller impact on reducing fish stocks than the effects of fishing. In
Vanuatu, around 1% of GDP is typically derived from the fisheries sector.54 Climate change is projected to affect how
tropical tuna stocks in the Pacific are distributed (such as skipjack, yellowfin, bigeye, and albacore). One study shows
that the biomass of skipjack and yellowfin tuna is largely expected to shift eastwards during the 21st century with the
effect being weaker for bigeye and albacore tuna.55 If these shifts are realized it is likely that a greater proportion of
tuna catch will need to be made in international waters. One study which assessed the future of the Vanuatu fishing
sector under climate change has suggested that despite some potential new pressures and species range shifts
Vanuatu will be able to remain a net exporter of fish up to 2050.56 However, protecting and developing the sector is
projected to come with significant adaptation costs to the national government.57
Island EcologySea-level rise not only threatens humans residing on Pacific islands, but also their unique ecosystem functions
and ecology. Indeed, island biodiversity faces a variety of human pressures.58 Research has shown that inundation
of low-lying islands has the potential to remove important refuges for migrating sea birds.59 As climate changes
so the suitable range for species to inhabit shifts, typically either upslope or away from the equator. In the Island
environment the capacity for species to shift is extremely limited and as such loss and extinction are becoming
increasingly likely. Major concerns have been raised for the terrestrial ecology of low-lying Pacific islands, for
example endemic lizards, which may become trapped in a shrinking habitat.60 Research has also highlighted the
risks to biodiversity in the Pacific through study of tree richness in New Caledonia, where the range sizes of
87%–96% of species was projected to decline, typically by 52%–84%.61
52 Asch, R. G., Cheung, W. W. L., & Reygondeau, G. (2018). Future marine ecosystem drivers, biodiversity, and fisheries maximum catch potential in Pacific Island countries and territories under climate change. Marine Policy, 88, 285–294. URL: https://www.openchannels. org/literature/19806
53 Hanich, Q., Wabnitz, C. C. C., Ota, Y., Amos, M., Donato-Hunt, C., & Hunt, A. (2018). Small-scale fisheries under climate change in the Pacific Islands region. Marine Policy, 88, 279–284. DOI: https://doi.org/https://doi.org/10.1016/j.marpol.2017.11.011
54 FAO (2018). Fishery and Aquaculture Country Profiles — the Republic of Vanuatu. URL: http://www.fao.org/fishery/facp/VUT/en]55 Pacific Community (2019). The Western and Central Pacific Tuna Fishery: 2017 Overview and Status of Stocks. URL: https://www.
researchgate.net/publication/346512257_The_western_and_central_Pacific_tuna_fishery_2019_overview_and_status_of_stocks56 Dey, M.M., Rosegrant, M.W., Gosh, K., Chen, O.L. and Valmonte-Santos, R. (2016). Analysis of the economic impact of climate
change and climate change adaptation strategies for fisheries sector in Pacific coral triangle countries: Model, estimation strategy, and baseline results. Marine Policy, 67, pp. 156–163. DOI: https://doi.org/10.1016/j.marpol.2016.01.004
57 Rosegrant, M.W., Dey, M.M., Valmonte-Santos, R. and Chen, O.L. (2016). Economic impacts of climate change and climate change adaptation strategies in Vanuatu and Timor-Leste. Marine Policy, 67, pp. 179–188. URL: https://doi.org/10.1016/j.marpol.2015.12.010
58 Jupiter, S., Mangubhai, S., & Kingsford, R. T. (2014). Conservation of Biodiversity in the Pacific Islands of Oceania: Challenges and Opportunities. Pacific Conservation Biology, 20(2), 206–220. URL: https://www.publish.csiro.au/pc/pc140206
59 Reynolds, M. H., Courtot, K. N., Berkowitz, P., Storlazzi, C. D., Moore, J., & Flint, E. (2015). Will the Effects of Sea-Level Rise Create Ecological Traps for Pacific Island Seabirds? PLOS ONE, 10(9), 1–23. DOI: https://doi.org/10.1371/journal.pone.0136773
60 Taylor, S., & Kumar, L. (2016). Global Climate Change Impacts on Pacific Islands Terrestrial Biodiversity: A Review. Tropical Conservation Science, 9(1), 203–223. DOI: https://doi.org/10.1177/194008291600900111
61 Pouteau, R., & Birnbaum, P. (2016). Island biodiversity hotspots are getting hotter: vulnerability of tree species to climate change in New Caledonia. Biological Conservation, 201, 111–119. URL: https://agris.fao.org/agris-search/search.do?recordID=FR2017101025
15CLIMATE RISK COUNTRY PROFILE: VANUATU
Economic Sectors
Agriculture and FoodVanuatu’s economy remains strongly oriented towards agriculture (particularly in rural areas). Food products
constituted around 85% of exports in 2011. Simultaneously, Vanuatu has a food trade deficit and dependence on
imports for food security equivalent to over $50 per capita in 2011 giving it high vulnerability to price shocks and
disaster events.62 Key agricultural crops include coconuts, kava, and cocoa plants. About one third of cultivable land
is currently being farmed, with most being used to produce coconuts. Copra, which is the kernel inside coconuts,
accounted for 35% of Vanuatu’s exports in 2007, and coconuts are also used as a source of food, drink, animal
feed, and as a construction material by the islands’ communities.63
Climate change could influence food production via direct and indirect effects on crop growth processes. Direct
effects include alterations to carbon dioxide availability, precipitation and temperatures. Indirect effects include
through impacts on water resource availability and seasonality, soil organic matter transformation, soil erosion,
changes in pest and disease profiles, the arrival of invasive species, and decline in arable areas due to the
submergence of coastal lands. On an international level, these impacts are expected to damage key staple crop
yields, even on lower emissions pathways. Tebaldi and Lobell (2018) estimate 5% and 6% declines in global wheat
and maize yields respectively even if the Paris Climate Agreement is met and warming is limited to 1.5°C.64 Shifts
in the optimal and viable spatial ranges of certain crops are also inevitable, though the extent and speed of those
shifts remains dependent on the emissions pathway.
Multiple climate-linked drivers threaten the productivity of Vanuatu’s agricultural sector. Given the significance
of agriculture to Vanuatu’s economy, saltwater intrusion poses a present danger to food production with much
of the land currently cultivated situated in coastal areas.65 Saltwater intrusion, which allows salt from seawater to
be absorbed into the soil, has been observed to cause reduced crop efficiency and even lead to crop failure.66,67
Cyclones can also cause devastating damage to agricultural products68 but, as mentioned previously, there is
uncertainty surrounding how their intensity and frequency might change in the future.
62 WITS (2019). World Trade Integrated Solution. World Bank. URL: https://wits.worldbank.org/ [accessed 24/05/2019]63 MALFFB, Vanuatu (2021). Department of Agriculture and Rural Development — Background. URL: https://malffb.gov.vu/index.php?id=164 Tebaldi, C., & Lobell, D. (2018). Differences, or lack thereof, in wheat and maize yields under three low-warming scenarios. Environmental
Research Letters: 13: 065001. URL: https://iopscience.iop.org/article/10.1088/1748-9326/aaba4865 Vanuatu (2017). National Redd+ Programme-Malekula. URL: http://reddplus.vu/vanuatu-national-redd-program/redd-selected-
islands/malekula/66 Nhung, T. T., Le Vo, P., Van Nghi, V., & Bang, H. Q. (2019). Salt intrusion adaptation measures for sustainable agricultural development
under climate change effects: A case of Ca Mau Peninsula, Vietnam. Climate Risk Management, 23, 88–100. URL: https://agris.fao.org/ agris-search/search.do?recordID=US201900151965
67 Bartels, D., & Sunkar, R. (2005). Drought and salt tolerance in plants. Critical reviews in plant sciences, 24(1), 23–58. DOI: https://doi.org/10.1080/07352680590910410
68 McKenzie, E., Prasad, B., & Kaloumaira, A. (2005). Economic impacts of natural disasters on development in the pacific: Volume 2: Economic assessment tools. Pacific Islands Applied Geoscience Commission (SOPAC). URL: https://www.researchgate.net/publication/269408914_The_economic_impact_of_natural_disasters_on_development_in_the_Pacific
16CLIMATE RISK COUNTRY PROFILE: VANUATU
A further, and perhaps lesser appreciated influence of climate change on agricultural production is through its
impact on the health and productivity of the labor force. Dunne et al. (2013) suggest that global labor productivity
during peak months has already dropped by 10% as a result of warming, and that a decline of up to 20% might be
expected by the 2050s under the highest emissions pathway (RCP8.5).69 Vanuatu currently operates an agricultural
system highly dependent on physical labor inputs and hence is potentially vulnerable to higher temperatures
without adaptation.70 In combination, it is highly likely that the above processes will have a considerable impact on
national food consumption patterns both through direct impacts on internal agricultural operations, and through
impacts on the global supply chain.
TourismOver 40% of GDP in Vanuatu is linked to the tourism sector. In one critical review of the literature examining
the dynamics between climate change and tourism, there appeared to be multiple indications that the tourism
sectors of small island states, such as Vanuatu, are particularly vulnerable to climate change.71 In the long-term,
the dual threats of rising sea levels and coastal erosion could reduce the quantity and quality of available beach
space without significant adaptation measures and could therefore reduce the attractiveness of the country as
a tourist destination. Another area of vulnerability is the valuable recreational diving sector, which is threatened
by environmental degradation, loss of reeds, and coastal erosion.72 One study has identified an explicit need for
the Government of Vanuatu to take an active and direct role in adapting the nation’s tourism sector to climate
change.73 At present, tourism can come into conflict with other sectors and research has pointed towards a need
to actively pursue greater co-ordination, sustainability and benefit sharing. Agroecological tourism additionally has
the potential to support traditional practices and preserve cultural knowledge.74
In addition to direct physical impacts, climate change may affect the tourism sector in Vanuatu through global efforts
to mitigate climate change. One possible manifestation is in the increased cost of international flights. One study
estimated that while the cost of achieving an emissions-target compatible tourism sector may be proportionately
low (3.6%). Nonetheless the necessary increase in trip costs (estimated at $11 when averaging across every global
trip but potentially higher on a long-haul destination such as Vanuatu) may reduce Vanuatu’s attractiveness as a
tourist destination.75 Further research is required to better constrain the suite of potential climate change impacts
on the sector.
69 Dunne, J. P., Stouffer, R. J., & John, J. G. (2013). Reductions in labour capacity from heat stress under climate warming. Nature Climate Change, 3(6), 563–566. URL: http://www.precaution.org/lib/noaa_reductions_in_labour_capacity_2013.pdf
70 Lebot, V., & Siméoni, P. (2015). Community Food Security: Resilience and Vulnerability in Vanuatu. Human Ecology, 43(6), 827–842. URL: https://link.springer.com/article/10.1007/s10745-015-9796-3
71 Scott, D., Gössling, S., & Hall, C. M. (2012). International tourism and climate change. Wiley Interdisciplinary Reviews: Climate Change, 3(3), 213–232. DOI: https://doi.org/10.1002/wcc.165
72 Klint, L. M., Jiang, M., Law, A., Delacy, T., Filep, S., Calgaro, E., . . . Harrison, D. (2012). Dive tourism in Luganville, Vanuatu: Shocks, stressors, and vulnerability to climate change. Tourism in Marine Environments, 8(1–2), 91–109. URL: http://vuir.vu.edu.au/21781/1/Klint_et_al_2012.pdf
73 Klint, L.M., Wong, E., Jiang, M., Delacy, T., Harrison, D. and Dominey-Howes, D., 2012. Climate change adaptation in the Pacific Island tourism sector: analysing the policy environment in Vanuatu. Current Issues in Tourism, 15(3), pp. 247–274. DOI: https://doi.org/10.1080/ 13683500.2011.608841
74 Addinsall, C., Weiler, B., Scherrer, P. and Glencross, K., 2017. Agroecological tourism: bridging conservation, food security and tourism goals to enhance smallholders’ livelihoods on South Pentecost, Vanuatu. Journal of Sustainable Tourism, 25(8), pp. 1100–1116. URL: https://researchportal.scu.edu.au/discovery/fulldisplay/alma991012820952902368/61SCU_INST:ResearchRepository
75 Scott, D., Gössling, S., Hall, C. M., & Peeters, P. (2016). Can tourism be part of the decarbonized global economy? The costs and risks of alternate carbon reduction policy pathways. Journal of Sustainable Tourism, 24(1), 52–72. URL https://doi.org/10.1080/ 09669582.2015.1107080
17CLIMATE RISK COUNTRY PROFILE: VANUATU
Communities
Poverty, Inequality and Vulnerability to Climate-Related DisasterNot only do Pacific Islands such as Vanuatu face multiple hazards but, as climate change drives hazard intensity, so
does the risk of simultaneous hazard or ‘compound’ hazard exposure.76 At the same time Pacific nations face very
considerable uncertainty around future changes which are enhanced by deficiencies in the current suite of climate
models. In this context a focus on reducing vulnerability and alleviating the underlying drivers of risk is essential. One
study has attempted to develop a framework for understanding and targeting resources at such drivers in Vanuatu.77
Vanuatu has been making progress in its disaster risk management, as evidenced by the effective advance warning
systems which saved lives when Cyclone Pam struck in in 2015.78 Preparing for disaster both in terms of risk
reduction and response can be challenging for Pacific Islands with extremely limited resources. As of 2015,
Vanuatu had a budget for disaster management of around $265,000 per year, and a disaster insurance facility of
around $17 million. Analysis suggests that there is an annual probability of 91% and 22% respectively that demand
will exceed these resources. A lack of state and individual resource to cope with natural hazards is a particular
issue with regards to food availability and the nation’s dependence on imports, leading to frequent food poverty.79
Many of the climate changes projected are likely to disproportionately affect the poorest groups in society. For
instance, heavy manual labor jobs are commonly among the lowest paid whilst also being most at risk of productivity
losses due to heat stress.80 Poorer businesses are the least able to afford air conditioning, an increasing need given
the projected increase in the need for air conditioning with temperature increases. Poorer farmers and communities
are least able to afford local water storage, irrigation infrastructure, and technologies for adaptation. While Vanuatu’s
islands are typically higher above sea-level than some of its Pacific neighbors, climate displacement may still present
a risk. Those communities likely to be most affected are the poorest whose homes and livelihoods could be at risk.
Studies have highlighted the need to better understand the health and wellbeing risks of climate-driven migration.81
76 Matthews, T., Wilby, R.L. and Murphy, C. (2019). An emerging tropical cyclone-deadly heat compound hazard. Nature Climate Change. 9, 602–606. URL: https://www.nature.com/articles/s41558-019-0525-6
77 Jackson, G., McNamara, K. and Witt, B. (2017). A framework for disaster vulnerability in a small island in the Southwest Pacific: a case study of Emae island, Vanuatu. International Journal of Disaster Risk Science, 8(4), pp. 358–373. URL: https://link.springer.com/article/10.1007/s13753-017-0145-6
78 Handmer, J. and Iveson, H. (2017). Cyclone Pam in Vanuatu: Learning from the low death toll. Australian Journal of Emergency Management, The, 32(2), p.60. URL: https://ajem.infoservices.com.au/items/AJEM-32-02-22
79 Feeny, S., McDonald, L., Miller-Dawkins, M., Donahue, J., & Posso, A. (2013). Household vulnerability and resilience to shocks: findings from Solomon Islands and Vanuatu. Australian National University. Working Paper. URL: http://dpa.bellschool.anu.edu.au/ experts-publications/publications/1402/household-vulnerability-and-resilience-shocks-findings
80 Kjellstrom, T., Briggs, D., Freyberg, C., Lemke, B., Otto, M., Hyatt, O. (2016) Heat, human performance, and occupational health: A key issue for the assessment of global climate change impacts. Annual Review of Public Health: 37: 97–112. URL: https:// www.annualreviews.org/doi/abs/10.1146/annurev-publhealth-032315-021740
81 Dannenberg, A.L., Frumkin, H., Hess, J.J. and Ebi, K.L., 2019. Managed retreat as a strategy for climate change adaptation in small communities: public health implications. Climatic Change, pp. 1–14. URL: https://ideas.repec.org/a/spr/climat/v153y2019i1d10.1007_s10584-019-02382-0.html
18CLIMATE RISK COUNTRY PROFILE: VANUATU
GenderAn increasing body of research has shown that climate-related disasters have impacted human populations in many
areas including agricultural production, food security, water management and public health. The level of impacts
and coping strategies of populations depends heavily on their socio-economic status, socio-cultural norms, access
to resources, poverty as well as gender. Research has also provided more evidence that the effects are not gender
neutral, as women and children are among the highest risk groups. Key factors that account for the differences
between women’s and men’s vulnerability to climate change risks include: gender-based differences in time use;
access to assets and credit, treatment by formal institutions, which can constrain women’s opportunities, limited
access to policy discussions and decision making, and a lack of sex-disaggregated data for policy change.82
Human HealthThe broad human health risks of climate change in Pacific Island Countries were assessed in a 2016 study and a
large suite of issues were identified. Specifically flagged in Vanuatu were the health impacts of extreme weather
events, heat-related illness, water security and safety, food security and malnutrition, vector-borne diseases,
respiratory illnesses, non-communicable diseases, and a variety of other disorders.83
Heat-Related MortalityResearch has placed a threshold of 35°C (wet bulb ambient air temperature) on the human body’s ability to regulate
temperature, beyond which even a very short period of exposure can present risk of serious ill-health and death.84
Temperatures significantly lower than the 35°C threshold of ‘survivability’ can still represent a major threat to human
health. Climate change is expected to push global temperatures closer to this temperature ‘danger zone’ both
through slow-onset warming and intensified heat waves.
Honda et al. (2014) utilized the A1B emissions scenario from CMIP3 (most comparable to RCP6.0) to estimate
that without adaptation, annual heat-related deaths in the Australasian region, could increase by 211% by 2030
and 437% by 2050.85 The potential reduction in heat-related deaths achievable by pursuing lower emissions
pathways is significant, as demonstrated by Mitchell et al. (2018).86 Further research is required to better constrain
estimates to Vanuatu’s geographical range.
82 World Bank Group (2016). Gender Equality, Poverty Reduction, and Inclusive Growth. URL: http://documents1.worldbank.org/curated/en/820851467992505410/pdf/102114-REVISED-PUBLIC-WBG-Gender-Strategy.pdf
83 Lachlan, M., Rokho, K., Alistair, W., Simon, H., Jeffery, S., Dianne, K., . . . L., E. K. (2016). Health Impacts of Climate Change in Pacific Island Countries: A Regional Assessment of Vulnerabilities and Adaptation Priorities. Environmental Health Perspectives, 124(11), 1707–1714. URL: https://pubmed.ncbi.nlm.nih.gov/26645102/
84 Im, E. S., Pal, J. S., & Eltahir, E. A. B. (2017). Deadly heat waves projected in the densely populated agricultural regions of South Asia. Science Advances, 3(8), 1–8. URL: https://advances.sciencemag.org/content/3/8/e1603322
85 Honda, Y., Kondo, M., McGregor, G., Kim, H., Guo, Y-L, Hijioka, Y., Yoshikawa, M., Oka, K., Takano, S., Hales, S., Sari Kovats, R. (2014) Heat-related mortality risk model for climate change impact projection. Environmental Health and Preventive Medicine 19: 56–63. DOI: 10.1007/s12199-013-0354-6
86 Mitchell, D., Heaviside, C., Schaller, N., Allen, M., Ebi, K. L., Fischer, E. M., . . . Vardoulakis, S. (2018). Extreme heat-related mortality avoided under Paris Agreement goals. Nature Climate Change, 8(7), 551–553. URL: https://pubmed.ncbi.nlm.nih.gov/30319715/
19CLIMATE RISK COUNTRY PROFILE: VANUATU
Disease and General HealthSea-level rises pose a serious threat to the water security of Pacific nations due to potential salinization of
potable water sources. Saline intrusion to drinking water sources has been linked to the increased prevalence of
hypertension during pregnancy87 and, as 57% of the adult population in Vanuatu is overweight,88 could contribute
to increased levels of hypertension more generally.
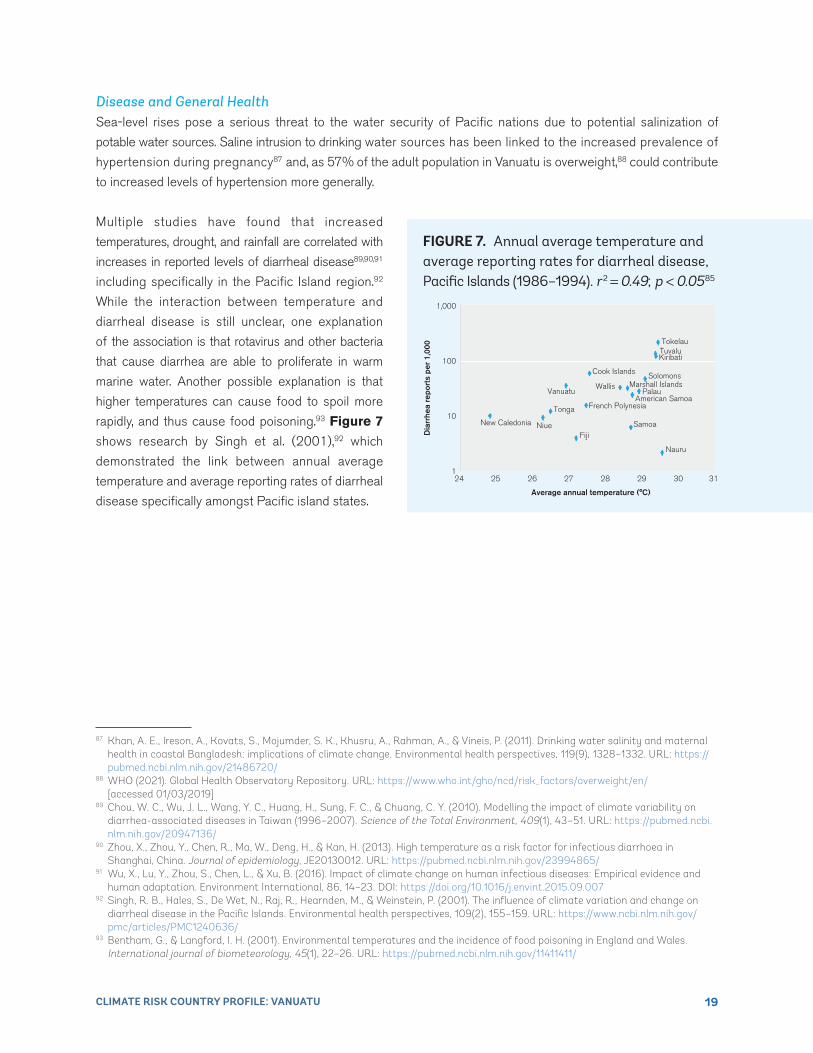
Multiple studies have found that increased
temperatures, drought, and rainfall are correlated with
increases in reported levels of diarrheal disease89,90,91
including specifically in the Pacific Island region.92
While the interaction between temperature and
diarrheal disease is still unclear, one explanation
of the association is that rotavirus and other bacteria
that cause diarrhea are able to proliferate in warm
marine water. Another possible explanation is that
higher temperatures can cause food to spoil more
rapidly, and thus cause food poisoning.93 Figure 7
shows research by Singh et al. (2001),92 which
demonstrated the link between annual average
temperature and average reporting rates of diarrheal
disease specifically amongst Pacific island states.
Tokelau
Palau
TuvaluKiribati
SolomonsMarshall Islands
Cook Islands
Wallis
American SamoaFrench Polynesia
Samoa
Tonga
Vanuatu
Fiji
Nauru
24 25 26 27 28 29 30 31
Average annual temperature (°C)
Dia
rrhe
a re
port
s pe
r 1,
000
1,000
100
10
1
New Caledonia Niue
FIGURE 7 . Annual average temperature and average reporting rates for diarrheal disease, Pacific Islands (1986–1994) r2 = 0 49; p < 0 0585
87 Khan, A. E., Ireson, A., Kovats, S., Mojumder, S. K., Khusru, A., Rahman, A., & Vineis, P. (2011). Drinking water salinity and maternal health in coastal Bangladesh: implications of climate change. Environmental health perspectives, 119(9), 1328–1332. URL: https://pubmed.ncbi.nlm.nih.gov/21486720/
88 WHO (2021). Global Health Observatory Repository. URL: https://www.who.int/gho/ncd/risk_factors/overweight/en/ [accessed 01/03/2019]
89 Chou, W. C., Wu, J. L., Wang, Y. C., Huang, H., Sung, F. C., & Chuang, C. Y. (2010). Modelling the impact of climate variability on diarrhea-associated diseases in Taiwan (1996–2007). Science of the Total Environment, 409(1), 43–51. URL: https://pubmed.ncbi.nlm.nih.gov/20947136/
90 Zhou, X., Zhou, Y., Chen, R., Ma, W., Deng, H., & Kan, H. (2013). High temperature as a risk factor for infectious diarrhoea in Shanghai, China. Journal of epidemiology, JE20130012. URL: https://pubmed.ncbi.nlm.nih.gov/23994865/
91 Wu, X., Lu, Y., Zhou, S., Chen, L., & Xu, B. (2016). Impact of climate change on human infectious diseases: Empirical evidence and human adaptation. Environment International, 86, 14–23. DOI: https://doi.org/10.1016/j.envint.2015.09.007
92 Singh, R. B., Hales, S., De Wet, N., Raj, R., Hearnden, M., & Weinstein, P. (2001). The influence of climate variation and change on diarrheal disease in the Pacific Islands. Environmental health perspectives, 109(2), 155–159. URL: https://www.ncbi.nlm.nih.gov/pmc/articles/PMC1240636/
93 Bentham, G., & Langford, I. H. (2001). Environmental temperatures and the incidence of food poisoning in England and Wales. International journal of biometeorology, 45(1), 22–26. URL: https://pubmed.ncbi.nlm.nih.gov/11411411/
20CLIMATE RISK COUNTRY PROFILE: VANUATU
National adaptation Policies and Strategies• First Nationally Determined Contribution (NDC) (2020)
• Intended Nationally Determined Contribution (INDC) (2016)
• Climate Change and Disaster Risk Reduction Policy 2016–2030 (2015)
• National Adaptation Programme for Action (NAPA) (2007)
Climate Change Priorities of the WBGWBG — Regional Partnership FrameworkThe World Bank Group has agreed a Regional Partnership Framework: Kiribati, Republic of Nauru, Republic of
The Marshall Islands, Federated States of Micronesia, Republic of Palau, Independent State of Samoa, Kingdom
of Tonga, Tuvalu, and Vanuatu which covers the period 2017–2021. Climate change is one of four key focus
areas of the agreement, which states: “Protecting incomes and livelihoods. A key focus will be on strengthened
preparedness and resilience to natural disasters and climate change. Interventions will also help countries
strengthen health systems and address NCDs.”
Under the heading of strengthening resilience to natural disasters and climate change, the RPF aims to continue
to support regional and single-country activities that help the PIC9 strengthen their resilience against natural
disasters and climate change. PICs combine high exposure to frequent and damaging natural hazards with low
capacity to manage the resulting risks. Vulnerability is exacerbated by poor planning, which has increased losses
and exposure to natural disasters, and by climate change, which is predicted to amplify the magnitude of cyclones,
droughts, and flooding. Sea level rise will worsen coastal erosion and salinization of freshwater resources and
increase the severity of storm surges, which will be particularly damaging in atoll islands and low-lying areas. All
these impacts adversely affect agriculture, fisheries, coastal zones, water resources, health and ecosystems and the
communities that rely upon them. The cost of inaction is substantial. Investments in disaster proofing and climate
resilience cost substantially less than rebuilding after a disaster. The WBG will ensure that at least 35% of the
total portfolio will directly or indirectly support climate-related co-benefits. The RPF further identifies a range of
regional and country-specific interventions including vulnerability assessment and disaster risk planning, financing
and insurance initiatives for climate risks and natural hazards, as well as support to resilience building interventions
in areas such as transport, agriculture and water supply.
POLICIES AND PROGRAMS

21CLIMATE RISK COUNTRY PROFILE: VANUATU