Embed Size (px)
Citation preview
To Contents
SPEC
IAL
REP
OR
T9
9-2
1
Vapor Signatures fromMilitary ExplosivesPart 1. Vapor Transport from BuriedMilitary-Grade TNTThomas F. Jenkins, Daniel C. Leggett,and Thomas A. Ranney December 1999
US Army Corpsof Engineers®
Cold Regions Research &Engineering Laboratory
To Contents
Abstract: Crystals of military-grade TNT were placedbeneath 2.5 cm of soil in enclosed 40-mL amber vialsand the accumulation of signature vapors in the head-space above the soil was determined as a function oftime. Three different soils—sand, silt, and clay—wereinvestigated at three different moisture contents: airdry, low moisture, and high moisture. Two replicates ofeach combination of soil type and soil moisture wereequilibrated at three temperatures (23, 4 and –12°C)over periods ranging from 63 to 173 days.
The headspace was sampled by a polyacrylatesolid phase microextraction (SPME) fiber for periodsranging from 5 to 20 minutes, and analytes weredesorbed in the injection port of a gas chromatographequipped with an electron capture detector. Massdetection limits using this method were below 1 pg (1 ×10–12 g) for the major signature chemicals—2,4-dini-trotoluene (2,4-DNT), 1,3-dinitrobenzene (1,3-DNB),and 2,4,6-trinitrotoluene (2,4,6-TNT). At the end of theexperiment, the top 5 mm of soil was carefullyremoved, extracted with acetonitrile, and the extractswere analyzed using RP-HPLC-UV according toSW846 Method 8330.
Both the qualitative and quantitative nature of thechemical signature above buried TNT is strongly afunction of temperature. At 23 and 4°C, 2,4-DNT waspresent at the highest concentration in the headspacevapor, 2,4,6-TNT being only a minor component. At–12°C, the more volatile 1,3-DNB predominated.Vapors penetrate the soils in the order sand > silt >clay, with vapor concentrations in the same order. Drysoils are very retentive of TNT vapors, while soil mois-ture facilitates movement of vapors to the headspace.
Soil–air partition coefficients, computed for thesethree soils at 23 and 4°C for 2,4,6-TNT, ranged from1.6 × 104 mL-air/g-soil for moist sand at 23°C to 3.0× 10⁷ for moist clay at 4°C. Partition coefficients for2,4-DNT were about an order of magnitude lower.Vapor concentrations for several of the air-dried soilswere too low to measure and hence the partition coef-ficients for dry soils could not be estimated, but weremuch higher than for the same soil with higher mois-ture. These results indicate that for detection of buriedmines, the largest mass of signature chemicals will bepresent in the surface soil rather than the overlying air.
How to get copies of CRREL technical publications:
Department of Defense personnel and contractors may order reports through the Defense Technical Information Center:DTIC-BR SUITE 09448725 JOHN J KINGMAN RDFT BELVOIR VA 22060-6218Telephone 1 800 225 3842E-mail [email protected]
[email protected] http://www.dtic.mil/
All others may order reports through the National Technical Information Service:NTIS5285 PORT ROYAL RDSPRINGFIELD VA 22161Telephone 1 703 487 4650
1 703 487 4639 (TDD for the hearing-impaired)E-mail [email protected] http://www.ntis.gov/index.html
A complete list of all CRREL technical publications is available fromUSACRREL (CEERD-IM-HL)72 LYME RDHANOVER NH 03755-1290Telephone 1 603 646 4338E-mail [email protected]
For information on all aspects of the Cold Regions Research and Engineering Laboratory, visit our World Wide Website:
http://www.crrel.usace.army.mil
To Contents
Special Report 99-21
Vapor Signatures fromMilitary ExplosivesPart 1. Vapor Transport from BuriedMilitary-Grade TNTThomas F. Jenkins, Daniel C. Leggett,and Thomas A. Ranney December 1999
Prepared for
OFFICE OF THE CHIEF OF ENGINEERS
Approved for public release; distribution is unlimited.
US Army Corpsof Engineers®
Cold Regions Research &Engineering Laboratory
To Contents
PREFACE
This report was prepared by Dr. Thomas F. Jenkins, Research Chemist, GeologicalSciences Division, Daniel C. Leggett, Research Chemist, Geochemical Sciences Divi-sion, U.S. Army Engineer Research and Development Center, Cold Regions Researchand Engineering Laboratory, and Thomas A. Ranney, Staff Scientist, Science and Tech-nology Corporation, Hanover, New Hampshire.
The authors gratefully acknowledge Alan Hewitt of CRREL and Dr. C.L. Grant, Pro-fessor Emeritus, University of New Hampshire, for their technical reviews of thisreport. In addition, the authors acknowledge Jane Mason, CRREL, for assistance inpreparation of the figures presented in this report.
Funding for this research was provided by the U.S. Army Engineer Research andDevelopment Center, Cold Regions Research and Engineering Laboratory AppliedResearch Program (AT-42) under work unit Chemical Detection of Landmines and UXO inCold Regions Environments, and a work unit entitled Chemical Vapor Transport ThroughSnow/Soil Systems (AT-24-EP-002).
This publication reflects the personal views of the authors and does not suggest orreflect the policy, practices, programs, or doctrine of the U.S. Army or Government ofthe United States. The contents of this report are not to be used for advertising or pro-motional purposes. Citation of brand names does not constitute an official endorse-ment or approval of the use of such commercial products.
ii

To Contents
CONTENTS
Preface .......................................................................................................................................... iiIntroduction ................................................................................................................................. 1
Background .............................................................................................................................. 1Objective ................................................................................................................................... 2
Experimental methods ............................................................................................................... 2Soils used for experiment....................................................................................................... 2Design of experiment ............................................................................................................. 3Soil sample collection, solvent extraction, and analysis using RP-HPLC ...................... 3Vapor sampling using SPME and vapor analysis using GC-µECD................................. 4
Results and discussion ............................................................................................................... 5Qualitative nature of headspace signatures ........................................................................ 5Calibration of SPME fibers for quantification of analytes in headspace samples ......... 7Vapor concentrations of signature chemicals in soil headspace samples ....................... 13Accumulation of explosives residues on surface soils ...................................................... 17Soil–air partition coefficients ................................................................................................. 20
Summary ...................................................................................................................................... 20Literature cited ............................................................................................................................ 21Appendix A: Data ....................................................................................................................... 23Abstract ........................................................................................................................................ 41
ILLUSTRATIONS
Figure1. Soil test device ...................................................................................................................... 32. Portable solid-phase microextraction field sampler ....................................................... 43. Vapor signature of 1966 military-grade TNT .................................................................. 64. Vapor signature above the low-moisture sand held at 4°C for 35 days ...................... 65. Vapor signature above low-moisture sand held at –12°C for 36 days ......................... 76. Mass of TNT vapor collected on polyacrylate SPME fiber at different temperatures 87. Continuous sampling of TNT vapor by alternating two polyacrylate SPME fibers
at 20-minute intervals .................................................................................................. 98. Continuous sampling of headspace vapor above moist Raritan Arsenal soil for
TNT by alternating two polyacrylate SPME fibers at 20-minute intervals at23°C ................................................................................................................................. 10
9. Mass of 2,4-DNT vapor sorbed on a polyacrylate SPME fiber at 23°C ....................... 1110. Mass of 2,6-DNT vapor sorbed on a polyacrylate SPME fiber at 23°C ....................... 1211. Mass of 1,3-DNB vapor sorbed on a polyacrylate SPME fiber at 23°C ....................... 1212. Concentration of analytes in the headspace vapor above 5.8% moist silt containing
buried TNT at 23°C ...................................................................................................... 17
iii

To Contents
TABLES
Table1. Concentration of 2,4-DNT and 2,4,6-TNT in the headspace ......................................... 22. Analysis of a soil cover for DNT and TNT content ........................................................ 23. Physical characteristics of soils used in explosives vapor transport study ................ 24. Retention times for explosives-related compounds by RP-HPLC ............................... 45. Retention times for explosives-related compounds by gas chromatography ............ 56. Analyte mass collected in 1 minute from headspace vapor using SPME ................... 77. Effective sampling rates for 2,4,6-TNT, 2,4-DNT, 2,6-DNT, and 1,3-DNB as a
function of temperature ............................................................................................... 138. Mean analyte concentrations in headspace vapor above sand containing buried
U.S. military-grade TNT .............................................................................................. 149. Mean analyte concentrations in headspace vapor above silt containing buried
U.S. military-grade TNT .............................................................................................. 1510. Mean analyte concentrations in headspace vapor above clay containing buried
U.S. military-grade TNT .............................................................................................. 1611. Analyte concentration in the surface of test soils after 63, 112, or 173 days ............... 1812. Soil–air partition coefficients for TNT-related compounds ........................................... 20
iv
To Contents
INTRODUCTION
BackgroundIn the early 1970s, CRREL personnel conducted
a series of experiments for which the ultimategoal was to define the vapor signatures of buriedlandmines. The strategy employed was to initiallydefine the signature of military-grade explosivesand then try to understand the attenuation andmodification of these signatures attributable tothe mine casings and soil barriers. The intent wasto provide this information to those groups thatwere developing chemical sensors to detect thepresence of landmines by sensing their associatedvapor signature in near-real time.
Initially, the vapor signature of military-gradeTNT was investigated. Using gas chromatogra-phy with an electron capture detector (GC-ECD),Murrmann et al. (1971) found that while 2,4,6-trinitrotoluene accounted for 99.8% of the solidmilitary-grade TNT sample they studied, it pro-vided only 58% of the equilibrium vapor in theheadspace above the solid TNT. The manufactur-ing impurity, 2,4-dinitrotoluene (2,4-DNT), whileaccounting for only 0.08% of the solid explosive,accounted for 35% of the vapor compositionowing to its much higher vapor pressure. Theremainder of the vapor composition was otherisomers of DNT and TNT. The authors concludedthat 2,4-DNT could be as important as 2,4,6-TNTfor purposes of land mine detection. Despite aspecial effort to detect vapor components otherthan isomers of TNT and DNT using GC-ECDand GC-flame ionization detection (GC-FID), noother vapor components were identified.
In a more detailed study, Leggett et al. (1977)reported results for 8 domestic and 14 foreignmilitary-grade TNT samples. Except for twounknown compounds that responded on the GC-ECD, the results confirmed that the major portionof the vapor composition was ascribable to thevarious isomers of DNT and TNT. The largestcomponent of the vapor was 2,4-DNT for all eightdomestic TNTs, and all but four of the foreignTNTs. In most cases, the concentration of 2,4-DNT in the vapor exceeded that for 2,4,6-TNT byan order of magnitude or more.
A preliminary study was also conducted toassess how quickly vapors of military-grade TNTcould penetrate soil barriers (Jenkins et al. 1974).In this study, 1 g of military-grade TNT wasplaced on top of portions of two moist test soils (asand and a clay) and was then covered with 2.5cm of the appropriate soil in enclosed septumvials. The vials were stored at room temperaturefor 25 days and the headspace above the soil wassampled periodically. The results indicated that2,4-DNT had penetrated through the soil to theheadspace within 4 days, while vapors of 2,4,6-TNT were not detectable in the headspace untilday 12 (Table 1). From these results, the authorsconcluded that DNT and TNT vapors can diffusethrough soil barriers in a relatively short period,and during the diffusion process, vapors arelargely retained within the soil barrier (Table 2).Therefore, the surface soil directly above a buriedmine should have considerably larger amounts ofDNT and TNT than the headspace above.
Vapor Signatures from Military ExplosivesPart 1. Vapor Transport from Buried Military-Grade TNT
THOMAS F. JENKINS, DANIEL C. LEGGETT, AND THOMAS. A. RANNEY
To Contents
ObjectiveOur major objective was to conduct a more
detailed experiment to investigate the qualitativeand quantitative effects of soil barriers at varioustemperatures on the vapor signature from buriedmilitary-grade TNT.
The overall strategy for this study was to set upsmall-scale experiments where we buried a smallquantity of military-grade TNT beneath soil in anenclosed container and to analyze the headspacevapor periodically to determine the rate of break-through of the various explosives-related vapors.
Experiments were conducted to assess the effectsof soil type, moisture content, and ambient tem-perature on the rate of breakthrough and thequalitative and quantitative nature of the vaporsignatures. At the end of the experiments, the sur-face soil was sampled to relate the vapor signa-ture in the headspace to the explosives-relatedsignature present in the surface soil.
EXPERIMENTAL METHODS
Soils used for experimentThree soils were selected for this study because
of their textural differences. A natural silica sandfrom Ottawa, Illinois (ASTM 1999), was selectedto represent coarse-grained material with little orno organic carbon content. This material wasused as received. The second soil selected wasHitchcock silt loam, which is a native soil at ourlocation, and represents a medium-textured soil.The third soil selected, Fort Edward clay, repre-sents a fine-grained material. Both the silt loamand clay soils were passed through a no. 40 sieve(420 µm) to remove some of the larger stableaggregates. The approximate grain size distribu-tion for these soils is presented in Table 3.
The three soils were each studied at three dif-ferent moisture levels: air dry, low moisture, andhigh moisture (Table 3). To moisten the soils, alayer of each was spread out in a large aluminumpan and wetted with well water (from a deep res-idential water well in Hartland, Vermont) using ahand pump sprayer. The pan was shaken to mixthe soil and more water was added. This proce-dure was continued until the approximatedesired moisture level was obtained. This processwas duplicated with a new soil sample and anadditional amount of water was added to raisethe soil to a higher moisture level. The final mois-ture content of the soils was determined byweighing two subsamples of each moist soil,allowing them to air dry, then weighing again,and obtaining the moisture by difference.
Table 1. Concentration (g/mL) of 2,4-DNT and2,4,6-TNT in the headspace. (After Jenkins et al.1974.)
Ft. Belvoir clay Windsor sandDay 2,4-DNT 2,4,6-TNT 2,4-DNT 2,4,6-TNT
0 <d* <d <d <d4 1.2 × 10⁻¹² <d t † <d6 5.0 × 10⁻¹² <d t <d7 1.4 × 10⁻¹¹ <d 1.8 × 10⁻¹² <d
10 N.D.** N.D. 2.1 × 10⁻¹² <d12 3.1 × 10⁻¹¹ t 2.8 × 10⁻¹² t13 N.D. N.D. 1.3 × 10⁻¹¹ t14 N.D. N.D. 1.4 × 10⁻¹¹ t18 N.D. N.D. 1.6 × 10⁻¹¹ t19 8.0 × 10⁻¹¹ 5.8 × 10⁻¹³ N.D. N.D.25 N.D. N.D. 2.6 × 10⁻¹¹ 7.0 × 10⁻¹³
* Concentration was less than an estimated detectionlimit of about 1 × 10–13 g/mL.
† Trace.** No data.
Table 2. Analysis of a soilcover (Ft. Belvoir clay) forDNT and TNT content. (AfterJenkins et al. 1974.)
Analyte Concentration in g/g of soil
2,6-DNT 6.2 × 10⁻⁶
2,5-DNT 8.0 × 10⁻⁶
2,4-DNT 1.4 × 10⁻⁴
2,4,6-TNT 9.3 × 10⁻⁵
2
Table 3. Physical characteristics of soils used in explosives vapor transportstudy.
Bulk densityApproximate grain size Moisture based on (g/cm3)
distribution (%) wet weight (%) Low HighSoil Sand Silt Clay Low level High level Air dry moisture moisture
Ottawa sand 100 2.1 3.1 1.65 1.58 1.64
Hitchcock silt 18 73 9 5.8 10 1.14 1.25 1.28
Fort Edwards clay 5 11 84 15 33 1.09 1.11 1.29
To Contents
Design of experimentReplicates of each air-dried soil and each of the
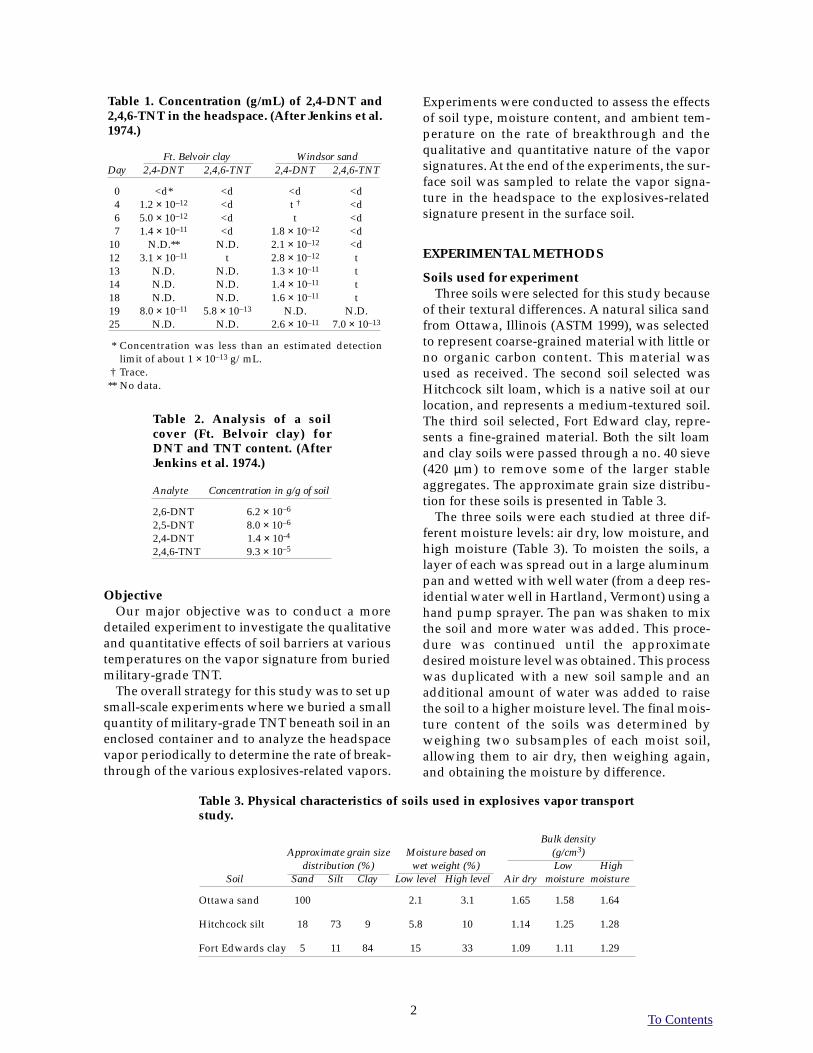
two higher moisture level soils were placed in 40-mL , 27- × 95-mm amber vials (six replicates ofeach) to a depth of 2.5 cm. We used 40-mL (43 mLtotal capacity) amber vials (Krackler Scientific)with open-top screw caps, septa removed,throughout the study. The vials were rinsed withacetone and oven dried at 105°C for several hoursprior to being used. We compacted the soil ineach vial by dropping it several times onto a pad-ded counter from a height of 5 cm. Previouslyground and weighed (110-mg) portions of mili-tary-grade TNT from Picatinny Arsenal wereplaced on top of the soil using a long-stemmedpolyethylene funnel. The TNT was spread into adisk shape approximately 13 mm in diameter and1 mm deep, centered in the vial. Care was takento be sure no TNT touched the vial walls. Anadditional 2.5 cm of soil was then carefully placedin the vial, covering the TNT, and the soil wascompacted as previously described. Bulk densi-ties of the soils were determined by weighing tworepresentative vials of each soil, at each moisturelevel (Table 3). The vial weight was subtractedand the resulting soil weight was divided by thevolume occupied by the 5 cm of soil (25 cm3).Commercially available aluminum foil covered
the vial opening and was secured in place using aplastic screw cap (Fig. 1). Two replicates for eachcombination of soil type and moisture level (18vials) were stored at room temperature (23°C), at4°C, or at −12°C. All vials were wrapped with asheet of aluminum foil to eliminate photocata-lyzed reactions. Headspace samples were collectedusing solid phase microextraction (SPME) fibersat a number of time intervals from 11 to 173 daysas described below. After 63 days, we openedsome replicates following headspace sampling,and sampled and analyzed the surface soil forexplosives-related compounds as describedbelow. Other replicates were treated in an identi-cal manner at periods up to 173 days.
Soil sample collection, solvent extraction,and analysis using RP-HPLC
After conducting the 63-day vapor analysis, wedecided to begin sampling the top 5 mm of soil inone of the replicate vials (A) of the samples storedat room temperature (23°C). We did a similarsampling on the 4°C samples after 67 days and onthe −12°C samples after 69 days. Soils were sam-pled for replicate A, regardless of whether or notsignature chemicals were detectable in the vapor.The remaining replicate samples (B) continuedtheir usual storage, with periodic analysis of the
AAAAAAAAAAAAAAAAAAAAAAAAAAAAAAAAAAAAAAAAAAAAA
Plastic Screw Cap
SPME Holder
Aluminum Foil
SPME Fiber Collector
Crystals of Military-Grade TNT
43 cm Amber Vial3
18 cmVapor
Headspace
3
5.0
cm
2.5
cm
Soil
Figure 1. Soil test device.
3
To Contents
headspace. When analysis indicated significantanalyte in the headspace vapor, the top 5 mm ofsoil in the B replicate samples was removed asabove. After 173 days, the final remaining soils(−12°C) were sampled.
To conduct the soil sampling, we opened thevials and used a small scoop to carefully removethe top 5 mm of soil. The mass of soil removedvaried from about 2 to 4 g. The soil was trans-ferred to a 20-mL scintillation vial and a 10.0-mLaliquot of acetonitrile added. The vials wereplaced in a room-temperature, controlled, ultra-sonic bath and extracted for 18 hours as describedin SW 846 Method 8330 (EPA 1995).
Analyte concentrations in the soil extracts weredetermined by reversed-phase high-performanceliquid chromatography (RP-HPLC). A modularsystem was employed, consisting of a DynatechLC-241 autosampler with a 100-µL injection loop,a Spectra Physics SP8810 isocratic pump, a Spec-tra Physics SP100 variable-wavelength UV-detec-tor set at 254 nm, and a Hewlett Packard 3396series II digital integrator. Separations wereobtained on a 15- × 0.39-cm, 4-µm film, LC-8 col-umn (Waters Nova-Pak) maintained at 28°C andeluted with 15/85 (V/V) isopropanol/water at aflow rate of 1.4-mL/min. The detector responsewas obtained from the digital integrator operat-ing in the peak height mode. For both RP-HPLCanalysis and gas chromatography with a micro-electron capture detector (GC-µECD), standardanalytical reference materials (SARMs) wereused in making the standard solutions in HPLCgrade acetonitrile (Sigma-Aldrich). Retention
times for the various explosives-related analytesare presented in Table 4. Additional confirmationof analyte identities was obtained by analyzingseveral of the 63-day replicate A sample extractson a 25-cm × 4.6-mm (5-µm) LC-18 (Supelco) col-umn eluted with 50:50 methanol/water at 1.5mL/min.
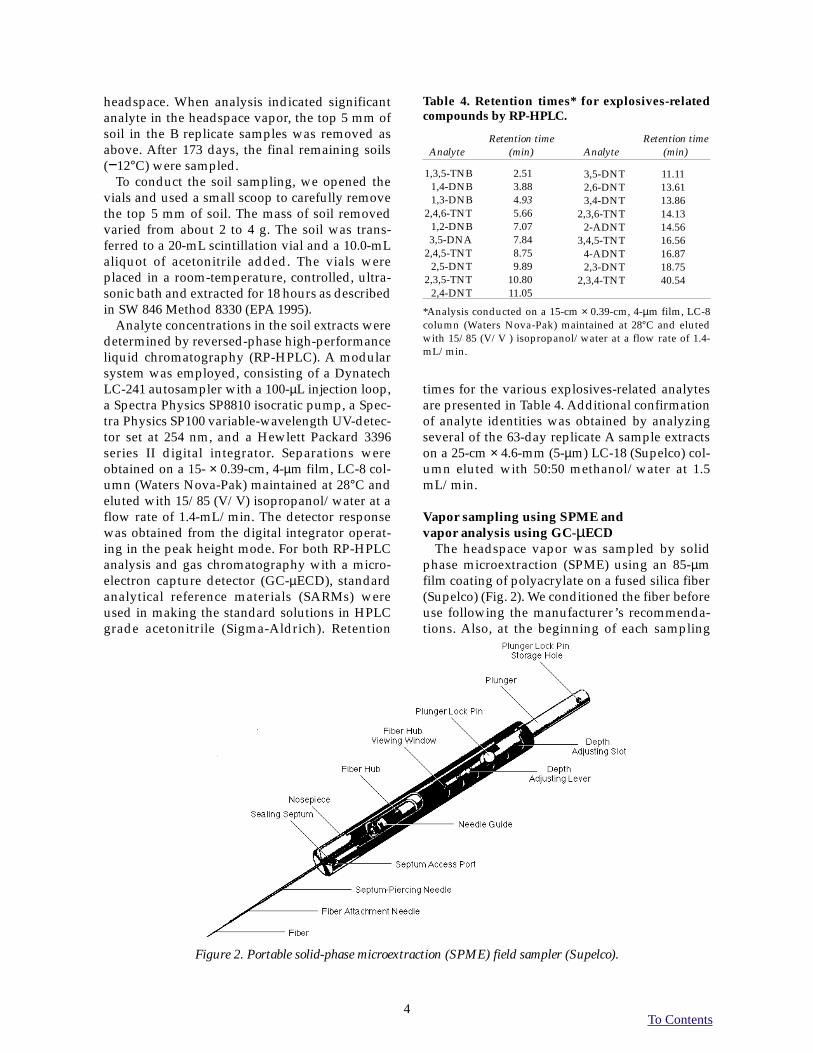
Vapor sampling using SPME andvapor analysis using GC-µECD
The headspace vapor was sampled by solidphase microextraction (SPME) using an 85-µmfilm coating of polyacrylate on a fused silica fiber(Supelco) (Fig. 2). We conditioned the fiber beforeuse following the manufacturer’s recommenda-tions. Also, at the beginning of each sampling
4
Retention timeAnalyte (min)
1,3,5-TNB 2.511,4-DNB 3.881,3-DNB 4.93
2,4,6-TNT 5.661,2-DNB 7.073,5-DNA 7.84
2,4,5-TNT 8.752,5-DNT 9.89
2,3,5-TNT 10.802,4-DNT 11.05
*Analysis conducted on a 15-cm × 0.39-cm, 4-µm film, LC-8column (Waters Nova-Pak) maintained at 28°C and elutedwith 15/85 (V/V ) isopropanol/water at a flow rate of 1.4-mL/min.
3,5-DNT 11.112,6-DNT 13.613,4-DNT 13.86
2,3,6-TNT 14.132-ADNT 14.56
3,4,5-TNT 16.564-ADNT 16.872,3-DNT 18.75
2,3,4-TNT 40.54
Table 4. Retention times* for explosives-relatedcompounds by RP-HPLC.
Retention timeAnalyte (min)
Figure 2. Portable solid-phase microextraction (SPME) field sampler (Supelco).
To Contents
event, the fiber was thermally desorbed in theinjection port of the gas chromatograph (250°C)to assure that it was clean. To sample the head-space, the aluminum foil was punctured by theneedle housing of the fiber and the fiber wasextended into the headspace for a sorption periodof 20 minutes. The opening in the screw cap wasjust the size of the outer diameter of the SPMEholder and helped hold the assembly duringsampling. Later in the study, this sampling timewas reduced because the concentration of someanalytes in the headspace increased to the pointwhere the amount collected over the 20-minutesampling period maximized the detector signal.
After the sampling was complete, the fiber waswithdrawn into its protective needle and theneedle was removed from the vial. The outside ofthe needle was wiped with a tissue wetted withacetonitrile to eliminate any vapors sorbed to themetal and inserted into the injection port of thegas chromatograph. The GC-system consisted ofan HP 6890 gas chromatograph equipped with amicro-electron capture detector (µECD). The cap-illary column was a DB-1, 6 m × 0.53 mm i.d., 1.5µm. Operating parameters were: initial columntemperature of 100°C (hold 2 minutes), ramp to200°C at 10°C/min, then 20°C/min to 250°C andhold for 5 minutes. The injection port and detec-tor temperatures were 250 and 300°C, respectively.The carrier gas was hydrogen with a constantflow rate of 12 mL/min. Retention times for thetarget analytes are presented in Table 5.
Analyte identities were confirmed by analyz-ing a number of SPME samples on an RTX-200capillary column, 6 m × 0.53 mm i.d.; the carriergas was hydrogen at 10 mL/min (Table 5). Itshould be noted that whenever SPME fibers con-taining TNT were desorbed into the hydrogencarrier gas and separated on either the DB-1 orthe RTX-200 columns, we observed peaks ascrib-able to 2ADNT and 4ADNT (2-amino-4,6-dinitro-toluene and 4-amino-2,6-dinitrotoluene). Subse-quent research revealed that these transformationproducts of TNT were being produced by reduc-tion of TNT by the hydrogen carrier, presumablybecause of catalysis on the hot metal protectiveneedle of the SPME device. These amino reduc-tion products were eliminated when the carriergas was changed to helium.
RESULTS AND DISCUSSION
Qualitative nature of headspace signaturesThe signature chemicals observed in the head-
space samples above military-grade TNT were:1,2- and 1,3-dinitrobenzene (DNB), 1,3,5-trini-trobenzene (TNB), the various isomers of dinitro-toluene (DNT), and 2,3,6- and 2,4,6-trinitrotolu-ene (TNT). 2ADNT and 4ADNT were alsoobserved, but, as mentioned above, we subse-quently determined that these two compoundswere being formed by reduction of 2,4,6-TNT inthe presence of the hydrogen carrier gas in theinjector of the gas chromatograph (GC). We did
5
Retention time(min)
Analyte DB-1 column RTX-200
1,4-DNB 3.97 7.761,3-DNB 4.23 8.161,2-DNB 4.41 8.712,6-DNT 4.44 7.832,5-DNT 4.89 8.432,3-DNT 5.18 9.222,4-DNT 5.28 9.053,5-DNT 5.50 9.463,4-DNT 5.79 10.25
1,3,5-TNB 6.61 11.52
* The capillary column was a DB-1, 6 m × 0.53 mm i.d., 1.5 µm. Operating para-meters were: initial column temperature of 100°C (hold 2 min), ramp to 200°Cat 10°C/min, then 20°C/min to 250°C and hold for 5 min. The injection portand detector temperatures were 250°C and 300°C, respectively. The carrier gaswas hydrogen with a constant flow rate of 12 mL/min. Analyte identities wereconfirmed by analyzing a number of SPME samples on an RTX-200 capillarycolumn, 6 m × 0.53 mm i.d. using hydrogen carrier at 10 mL/min.
Table 5. Retention times for explosives-related compoundsby gas chromatography.
2,4,6-TNT 7.01 11.372,3,6-TNT 7.13 11.372,3,5-TNT 7.54 12.172,4,5-TNT 7.78 12.532,3,4-TNT 7.98 12.93
RDX 8.07 13.383,4,5-TNT 8.62 13.87
4-ADNT 9.14 12.543,5-DNA 9.24 13.002-ADNT 9.59 13.38
Retention time(min)
Analyte DB-1 column RTX-200
To Contents
not observe this phenomenon when standards ofTNT in acetonitrile were injected into the GC, andwe postulate that the metal housing surroundingthe SPME fiber catalyzed this reduction in thepresence of hydrogen in the injection port. Whenhelium was substituted for hydrogen as thecarrier gas, the two peaks corresponding to thesecompounds disappeared. For samples where2ADNT and 4ADNT were measured, the concen-tration values were stoichiometrically convertedto, and added to, the TNT concentration.
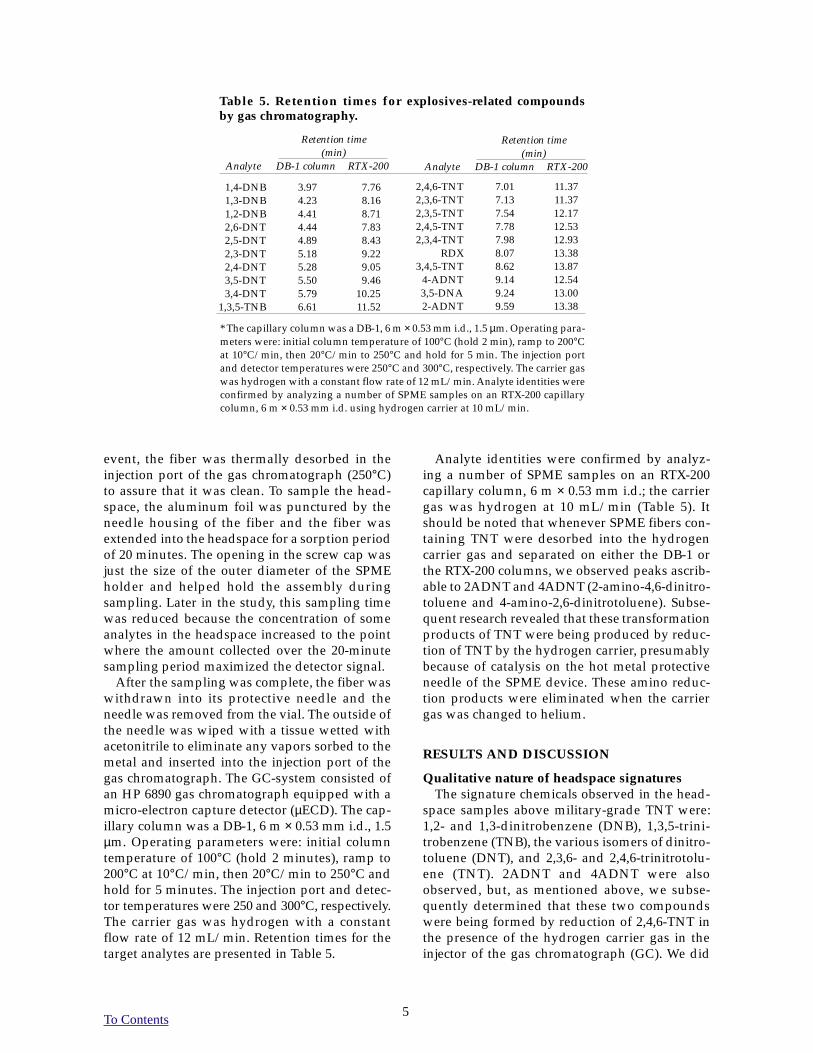
An example GC-µECD chromatogram of theequilibrium vapor above military-grade TNT(Picatinny Arsenal, 1966 vintage), sampled with apolyacrylate SPME fiber for 3 minutes, is pre-sented in Figure 3. The major peaks correspond to2,4-DNT, 1,3-DNB, 1,2-DNB, 2,3,6-TNT, and 2,4,6-TNT, and several other isomers of DNT. Theseresults are consistent with those presented byMurrmann et al. (1971) and Leggett et al. (1977)for vapors from various samples of military-grade TNT. Several of the early eluting peaks thatwere reported as unknowns by Leggett et al.(1977) were probably 1,2-DNB and 1,3-DNB.
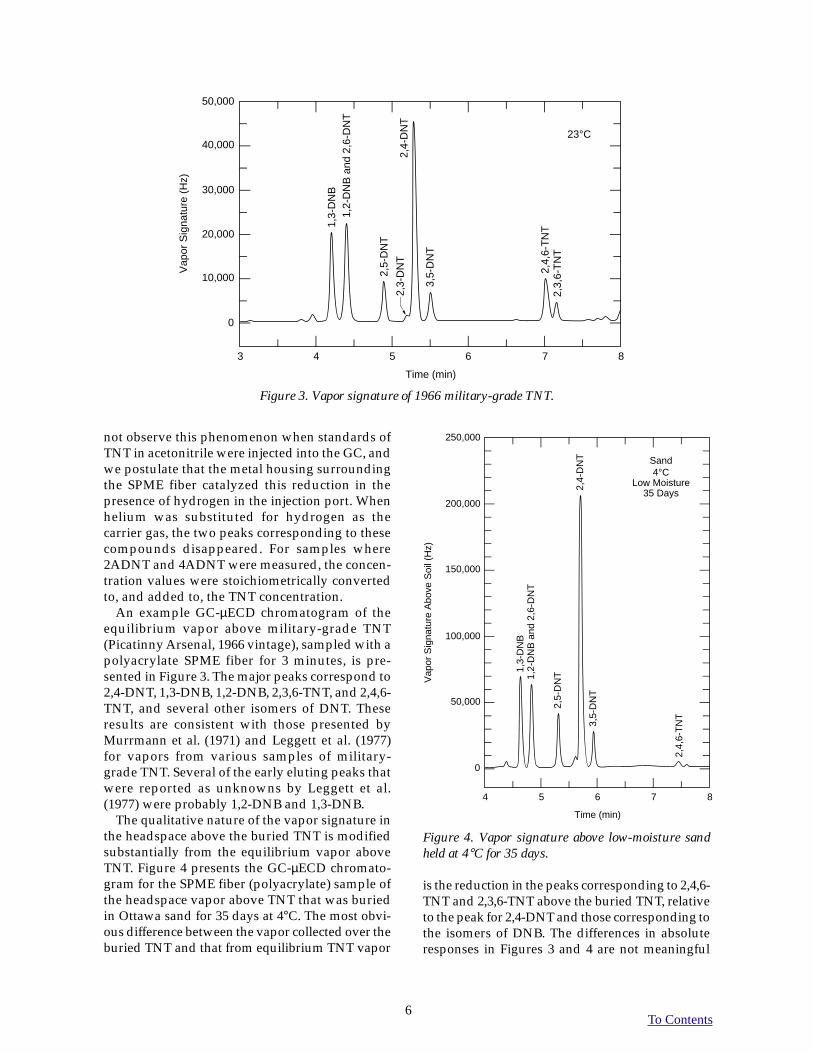
The qualitative nature of the vapor signature inthe headspace above the buried TNT is modifiedsubstantially from the equilibrium vapor aboveTNT. Figure 4 presents the GC-µECD chromato-gram for the SPME fiber (polyacrylate) sample ofthe headspace vapor above TNT that was buriedin Ottawa sand for 35 days at 4°C. The most obvi-ous difference between the vapor collected over theburied TNT and that from equilibrium TNT vapor
6
Figure 3. Vapor signature of 1966 military-grade TNT.
Figure 4. Vapor signature above low-moisture sandheld at 4°C for 35 days.
50,000
0
83
Time (min)
Vap
or S
igna
ture
(H
z)
40,000
30,000
20,000
10,000
4 5 6 7
23°C
1,3-
DN
B1,
2-D
NB
and
2,6
-DN
T
2,5-
DN
T
3,5-
DN
T
2,3-
DN
T2,
4-D
NT
2,4,
6-T
NT
2,3,
6-T
NT
is the reduction in the peaks corresponding to 2,4,6-TNT and 2,3,6-TNT above the buried TNT, relativeto the peak for 2,4-DNT and those corresponding tothe isomers of DNB. The differences in absoluteresponses in Figures 3 and 4 are not meaningful
Sand4°C
Low Moisture35 Days
Vap
or S
igna
ture
Abo
ve S
oil (
Hz)
250,000
200,000
150,000
100,000
50,000
0
8
Time (min)
4 5 6 7
1,3-
DN
B1,
2-D
NB
and
2,6
-DN
T
2,5-
DN
T
2,4-
DN
T3,
5-D
NT
2,4,
6-T
NT
To Contents
because these two samples involved differentexposure periods for the SPME fibers.
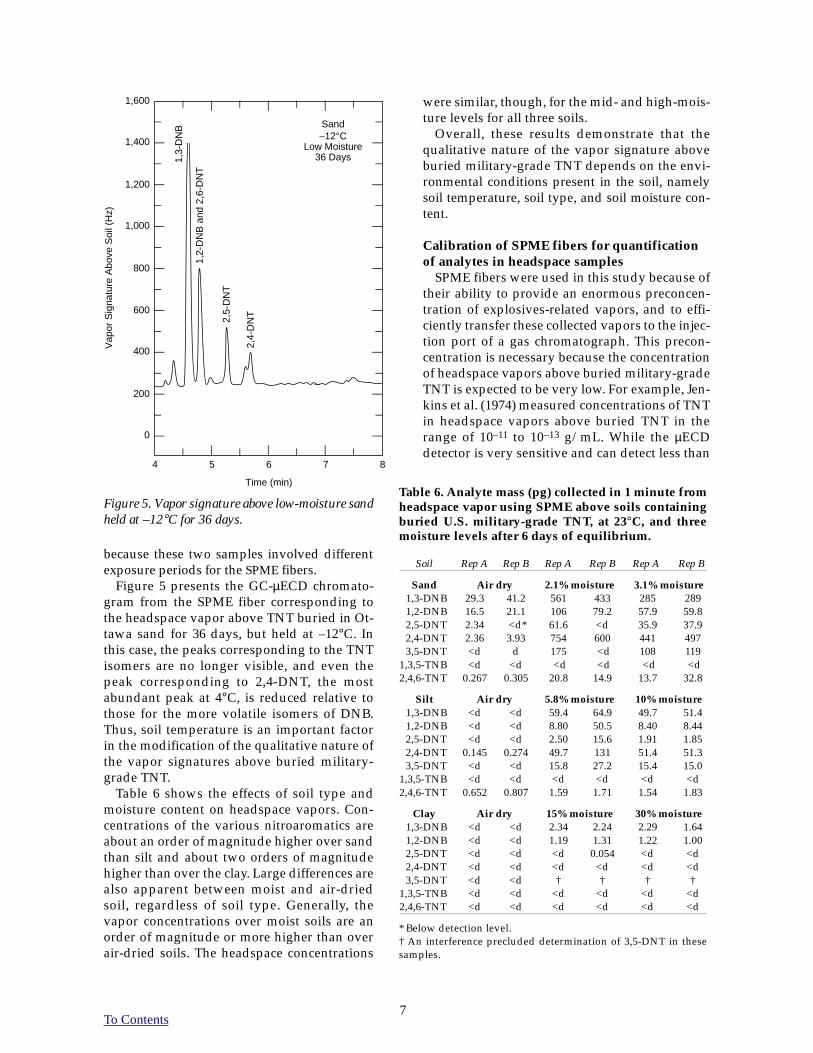
Figure 5 presents the GC-µECD chromato-gram from the SPME fiber corresponding tothe headspace vapor above TNT buried in Ot-tawa sand for 36 days, but held at –12°C. Inthis case, the peaks corresponding to the TNTisomers are no longer visible, and even thepeak corresponding to 2,4-DNT, the mostabundant peak at 4°C, is reduced relative tothose for the more volatile isomers of DNB.Thus, soil temperature is an important factorin the modification of the qualitative nature ofthe vapor signatures above buried military-grade TNT.
Table 6 shows the effects of soil type andmoisture content on headspace vapors. Con-centrations of the various nitroaromatics areabout an order of magnitude higher over sandthan silt and about two orders of magnitudehigher than over the clay. Large differences arealso apparent between moist and air-driedsoil, regardless of soil type. Generally, thevapor concentrations over moist soils are anorder of magnitude or more higher than overair-dried soils. The headspace concentrations
7
Vap
or S
igna
ture
Abo
ve S
oil (
Hz)
1,600
1,400
1,200
1,000
800
600
0
8
Time (min)
400
200
4 5 6 7
Sand–12°C
Low Moisture36 Days
1,2-
DN
B a
nd 2
,6-D
NT
1,3-
DN
B
2,5-
DN
T
2,4-
DN
T
Table 6. Analyte mass (pg) collected in 1 minute fromheadspace vapor using SPME above soils containingburied U.S. military-grade TNT, at 23°C, and threemoisture levels after 6 days of equilibrium.
Soil Rep A Rep B Rep A Rep B Rep A Rep B
Sand Air dry 2.1% moisture 3.1% moisture1,3-DNB 29.3 41.2 561 433 285 2891,2-DNB 16.5 21.1 106 79.2 57.9 59.82,5-DNT 2.34 <d* 61.6 <d 35.9 37.92,4-DNT 2.36 3.93 754 600 441 4973,5-DNT <d d 175 <d 108 119
1,3,5-TNB <d <d <d <d <d <d2,4,6-TNT 0.267 0.305 20.8 14.9 13.7 32.8
Silt Air dry 5.8% moisture 10% moisture1,3-DNB <d <d 59.4 64.9 49.7 51.41,2-DNB <d <d 8.80 50.5 8.40 8.442,5-DNT <d <d 2.50 15.6 1.91 1.852,4-DNT 0.145 0.274 49.7 131 51.4 51.33,5-DNT <d <d 15.8 27.2 15.4 15.0
1,3,5-TNB <d <d <d <d <d <d2,4,6-TNT 0.652 0.807 1.59 1.71 1.54 1.83
Clay Air dry 15% moisture 30% moisture1,3-DNB <d <d 2.34 2.24 2.29 1.641,2-DNB <d <d 1.19 1.31 1.22 1.002,5-DNT <d <d <d 0.054 <d <d2,4-DNT <d <d <d <d <d <d3,5-DNT <d <d † † † †
1,3,5-TNB <d <d <d <d <d <d2,4,6-TNT <d <d <d <d <d <d
* Below detection level.† An interference precluded determination of 3,5-DNT in thesesamples.
Figure 5. Vapor signature above low-moisture sandheld at –12°C for 36 days.
were similar, though, for the mid- and high-mois-ture levels for all three soils.
Overall, these results demonstrate that thequalitative nature of the vapor signature aboveburied military-grade TNT depends on the envi-ronmental conditions present in the soil, namelysoil temperature, soil type, and soil moisture con-tent.
Calibration of SPME fibers for quantificationof analytes in headspace samples
SPME fibers were used in this study because oftheir ability to provide an enormous preconcen-tration of explosives-related vapors, and to effi-ciently transfer these collected vapors to the injec-tion port of a gas chromatograph. This precon-centration is necessary because the concentrationof headspace vapors above buried military-gradeTNT is expected to be very low. For example, Jen-kins et al. (1974) measured concentrations of TNTin headspace vapors above buried TNT in therange of 10–11 to 10–13 g/mL. While the µECDdetector is very sensitive and can detect less than

To Contents
10–12 g of TNT, it would require air sample vol-umes of 10 mL or so to deliver a detectable mass ofTNT to the GC if the vapor concentration was 10–13
g/mL; direct injection of that volume of air con-taining semi-volatile organics with very low vaporpressures is difficult to achieve without losses.
The major difficulty with the use of the SPMEfibers for this application is the difficulty of pro-viding quantitative calibration. Instrumentresponses for explosives vapors obtained bySPME can easily be calibrated with respect tomass. Using liquid standards to obtain responsefactors, we can convert to mass of TNT a peakheight (or peak area) for TNT in the GC-µECDchromatogram from a sample preconcentrated ona SPME fiber. However, to convert this mass to avapor concentration in the headspace, the volumesampled by the fiber needs to be known.
Previous approaches to calibration for SPMEassume that equilibrium is reached between thefiber and the vapor (Zhang and Pawliszyn 1993,Martos and Pawliszyn 1998). Experiments at San-dia National Laboratory* and here at CRREL indi-cate that equilibrium for TNT is not reached evenwhen the headspace is exposed to the fiber for sev-eral days. One exception is the dimethysiloxaneSPME fiber with only a 7-µm coating. In that case,equilibrium appears to be reached more quickly(order of minutes to hours), but little preconcen-tration is achieved. This has been verified at bothCRREL and Sandia.
In an early experiment, we examined the rela-tionship between mass of TNT collected and thelength of time the fiber was exposed to the equilib-rium vapor above military-grade TNT. This wasdone by placing 28 mg of U.S. military-grade TNTin a 40-mL amber vial and allowing it to equili-brate for 3 days at room temperature. A polyacry-late SPME fiber (85 µm) was inserted into the vialand was exposed to the vapor for periods rangingfrom 5 to 30 minutes. This was done at all threetemperatures used in the soil study: 23, 4, and−12°C. A plot of the mass of TNT collected as afunction of exposure time for each temperature isshown in Figure 6. The results indicate that themass of TNT collected is linearly related to expo-sure time through 30 minutes for all three temper-atures. In this experiment, there was a 20-minuterecovery period between exposure periods, and inorder for linearity to be maintained over the entireexperiment, this recovery period must have beenadequate to reestablish equilibrium between theTNT in the vapor and the solid.
Because the mass of TNT collected by the fiber islinearly related to exposure time, the TNT in thevapor cannot be depleted substantially in the va-por during sampling. To directly assess the rate atwhich TNT in the vapor could be depleted usingthe SPME fibers, the following experiment wasconducted. An 80-mg portion of U.S. military-grade TNT was placed in a 40-mL amber vial andthe headspace was allowed to equilibrate for 7days at 23°C. The headspace in the vial was thensampled using polyacrylate SPME fibers continu-ously for 200 minutes in 20-minute increments.
8
Figure 6. Mass of TNT vapor collected on polyacrylate SPME fiber at differ-ent temperatures.
* Personal communication with William Chambers, Sandia NationalLaboratory, 1998.
Time (min)
7,000
0350
Mas
s (p
g)
6,000
5,000
4,000
3,000
2,000
1,000
5 10 15 20 25 30
y = 197x
r = 0.9802
^
y = 1.30x
r = 0.7062
^
y = 26.4x
r = 0.9472
^
23°C4°C
–12°C
To Contents
Two fibers were used, so that while one fiber wassampling the headspace in the vial, the other wasbeing desorbed and the sample analyzed by GC-µECD.
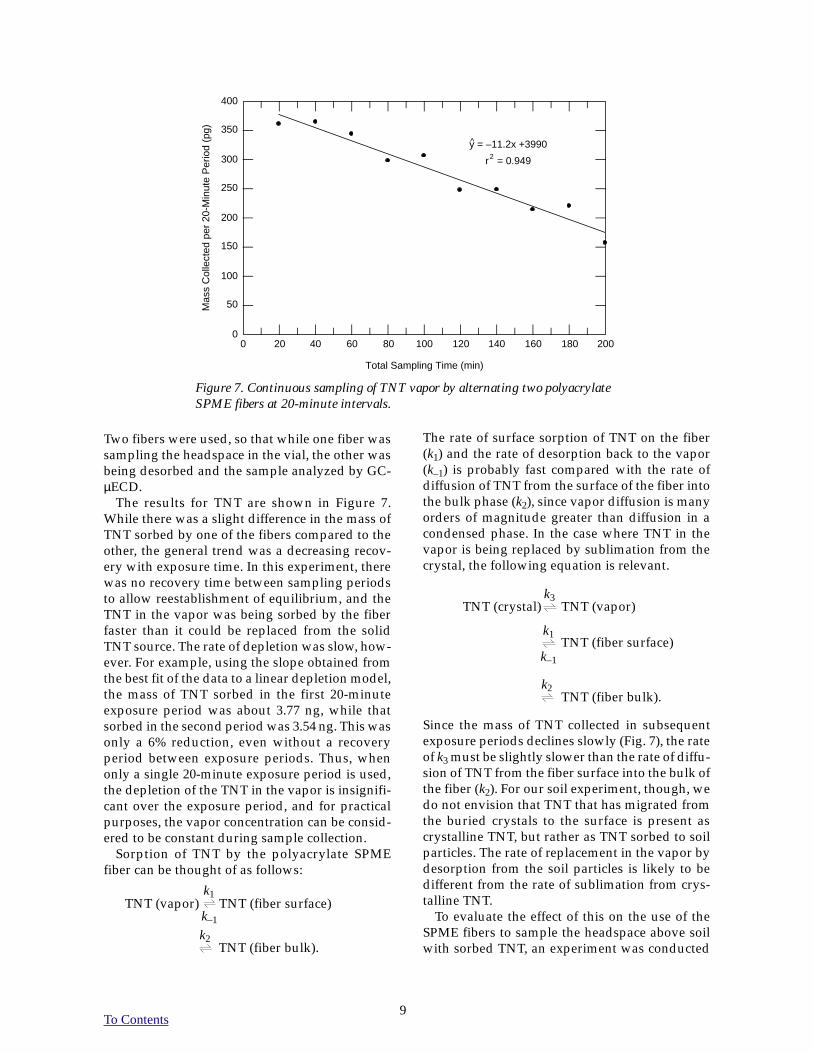
The results for TNT are shown in Figure 7.While there was a slight difference in the mass ofTNT sorbed by one of the fibers compared to theother, the general trend was a decreasing recov-ery with exposure time. In this experiment, therewas no recovery time between sampling periodsto allow reestablishment of equilibrium, and theTNT in the vapor was being sorbed by the fiberfaster than it could be replaced from the solidTNT source. The rate of depletion was slow, how-ever. For example, using the slope obtained fromthe best fit of the data to a linear depletion model,the mass of TNT sorbed in the first 20-minuteexposure period was about 3.77 ng, while thatsorbed in the second period was 3.54 ng. This wasonly a 6% reduction, even without a recoveryperiod between exposure periods. Thus, whenonly a single 20-minute exposure period is used,the depletion of the TNT in the vapor is insignifi-cant over the exposure period, and for practicalpurposes, the vapor concentration can be consid-ered to be constant during sample collection.
Sorption of TNT by the polyacrylate SPMEfiber can be thought of as follows:
The rate of surface sorption of TNT on the fiber(k1) and the rate of desorption back to the vapor(k–1) is probably fast compared with the rate ofdiffusion of TNT from the surface of the fiber intothe bulk phase (k2), since vapor diffusion is manyorders of magnitude greater than diffusion in acondensed phase. In the case where TNT in thevapor is being replaced by sublimation from thecrystal, the following equation is relevant.
Since the mass of TNT collected in subsequentexposure periods declines slowly (Fig. 7), the rateof k3 must be slightly slower than the rate of diffu-sion of TNT from the fiber surface into the bulk ofthe fiber (k2). For our soil experiment, though, wedo not envision that TNT that has migrated fromthe buried crystals to the surface is present ascrystalline TNT, but rather as TNT sorbed to soilparticles. The rate of replacement in the vapor bydesorption from the soil particles is likely to bedifferent from the rate of sublimation from crys-talline TNT.
To evaluate the effect of this on the use of theSPME fibers to sample the headspace above soilwith sorbed TNT, an experiment was conducted
9
Figure 7. Continuous sampling of TNT vapor by alternating two polyacrylateSPME fibers at 20-minute intervals.
TNT (crystal) TNT (vapor)k3
TNT (fiber surface)k1
k–1
TNT (fiber bulk).k2
TNT (vapor) TNT (fiber surface)k1
k–1
TNT (fiber bulk).k2
Total Sampling Time (min)
400
02000
Mas
s C
olle
cted
per
20-
Min
ute
Per
iod
(pg) 350
300
250
200
150
100
20 40 60 80 100 140
50
160 180120
y = –11.2x +3990
r = 0.9492
^

To Contents
with a soil from Raritan Arsenal that was fieldcontaminated with a low concentration of TNT(about 1.4 mg/kg). A 3.02-g portion of the soilwas moistened with water (5% water, on a dryweight basis) and allowed to equilibrate for 3days in a 40-mL amber vial. The headspace in thevial was then sampled continuously for 200 min-utes using two polyacrylate fibers as describedabove. The results are shown in Figure 8. Usingthe best fit linear equation, we find that the masscollected in the first 20 minutes was 20.4 pg, whilethe mass recovered in the second 20-minute sam-pling period was 19.8 pg. The reduction from thefirst to the second sampling periods amounts toonly about 3% and, hence, the assumption thatthe vapor concentration is constant over the sam-pling period when the TNT is sorbed on soil par-ticles is valid.
These results demonstrate that the approach ofsampling the headspace using SPME fibers doesnot substantially reduce the vapor concentrationof TNT during a 20-minute exposure period.Since the mass of TNT collected with time is lin-ear, probably controlled by the diffusion rate ofTNT away from the surface of the fiber, it may bepossible to calibrate the volume of vapor sampledas a function of exposure time for a given chemi-cal. One way this could be done is to sample aheadspace volume where the concentration ofTNT in the vapor was known, and from mass cal-ibration of the TNT collected, the volume sam-pled as a function of time can be calculated from
volume sampled (mL) = mass collected (g)
÷ vapor concentration (g/mL). (1)
Because the vapor pressure of TNT is low andTNT is known to be very sorptive to surfaces, try-ing to establish a known vapor concentration byinjection of a given mass of TNT into a knownvolume of air is impractical. On the other hand,the vapor pressure of TNT as a function of tem-perature has been measured by a number ofinvestigators (Pella 1977, Leggett et al. 1977, etc.).Results from the various investigators vary some-what, but we believe the values published by Pella(1977) are the most reliable. Pella used a liquidsolvent to trap the equilibrium vapor from aknown volume of gas, minimizing sorptioneffects, and reducing the problem to a chromato-graphic analysis against standard solutions in thesame matrix. This type of experiment should beaccurate and precise to a few percent.
The vapor pressure of TNT (p) at 23°C accord-ing to Pella is 6.71 × 10⁻⁶ torr ([log10 (p in torr) =(12.31 ± 0.34) – (5175 ± 105) T, where T is the abso-lute temperature in kelvins]). This converts to avapor concentration of 8.25 × 10⁻⁸ g/L. When weexposed a polyacrylate SPME fiber to the equilib-rium vapor above military-grade TNT (PicatinnyArsenal, 1966 vintage) and determined the massof TNT sorbed by the fiber using GC-µECD in a20-minute exposure period, we collected 3.8 × 10⁻⁹
g of TNT. Computing the volume sampled from
10
Figure 8. Continuous sampling of headspace vapor above moist Raritan Arsenalsoil for TNT by alternating two polyacrylate SPME fibers at 20-minute intervalsat 23°C.
y = –0.0339x +21.0
r = 0.7992
^
Total Sampling Time (min)
25
03000
Mas
s C
olle
cted
per
20-
min
ute
Per
iod
(pg)
20
15
10
5
50 100 150 200 250
To Contents
eq 1, we obtained a sampling volume of 46 mL fora 20-minute exposure period. Since the amountsampled is linearly related to exposure period, theeffective sampling rate for TNT with the poly-acrylate fiber is about 2.3 mL/minute at 23°C.
Since the three major vapor signature chemicalsfrom military-grade TNT are 2,4-DNT and 2,6-DNT (Murrmann et al. 1971, Leggett et al. 1977),and 1,3-DNB (discussed above), it is also impor-tant to be able to calculate the vapor concentra-tions for these substances. In order to do so, weneed to know the effective sampling rate for thesecompounds using the polyacrylate fiber. Thevapor pressures of 2,4-DNT, 2,6-DNT, and 1,3-DNB are 1.44 × 10⁻⁴, 3.71 × 10⁻⁴ (Pella 1977), and6.22 × 10−4 torr (Howard and Maylan 1997, ex-trapolated) at 22°C, respectively, and the resultingvapor concentrations are 1.42 × 10⁻⁹, 3.67 × 10⁻⁹, and5.68 × 10–9 g/mL, respectively. These concentra-tions result in masses collected on the fiber thatare above the linear range of the µECD whenSPME exposure periods are more than a few min-utes. The nitrogen-phosphorus detector (NPD) isselective for nitrogen-containing compounds, butis not nearly as sensitive as the µECD. Thus, tocalibrate the effective sampling rates for 2,4-DNT,2,6-DNT, and 1,3-DNB, 50-mg portions of SARM-grade material for each compound were placed inindividual 40-mL amber vials and the headspaceequilibrated for 7 days. The headspace above eachcompound was sampled by exposing polyacry-late SPME fibers to the respective headspace inthe vial for periods ranging between 1 and 30minutes and desorbing the fibers in the injector of
a GC-NPD (SRI Instruments Model 8610).The mass of each compound was determinedagainst SARM-based standards prepared in ace-tone.
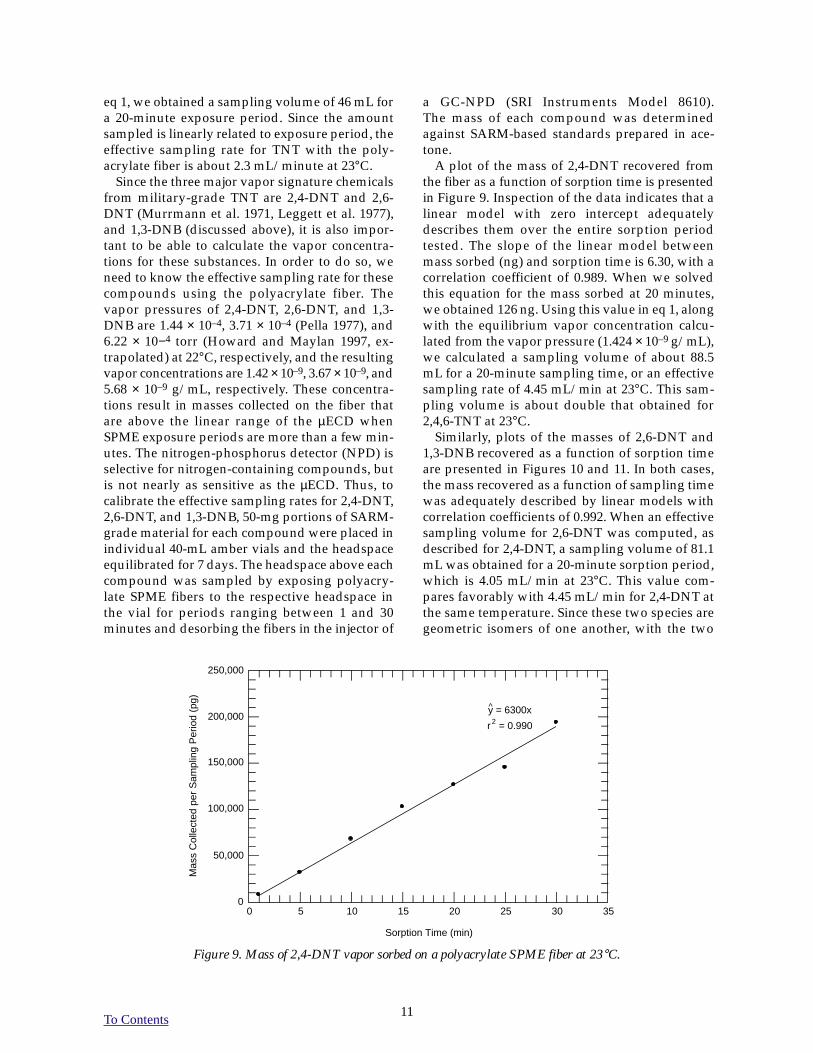
A plot of the mass of 2,4-DNT recovered fromthe fiber as a function of sorption time is presentedin Figure 9. Inspection of the data indicates that alinear model with zero intercept adequatelydescribes them over the entire sorption periodtested. The slope of the linear model betweenmass sorbed (ng) and sorption time is 6.30, with acorrelation coefficient of 0.989. When we solvedthis equation for the mass sorbed at 20 minutes,we obtained 126 ng. Using this value in eq 1, alongwith the equilibrium vapor concentration calcu-lated from the vapor pressure (1.424 × 10⁻⁹ g/mL),we calculated a sampling volume of about 88.5mL for a 20-minute sampling time, or an effectivesampling rate of 4.45 mL/min at 23°C. This sam-pling volume is about double that obtained for2,4,6-TNT at 23°C.
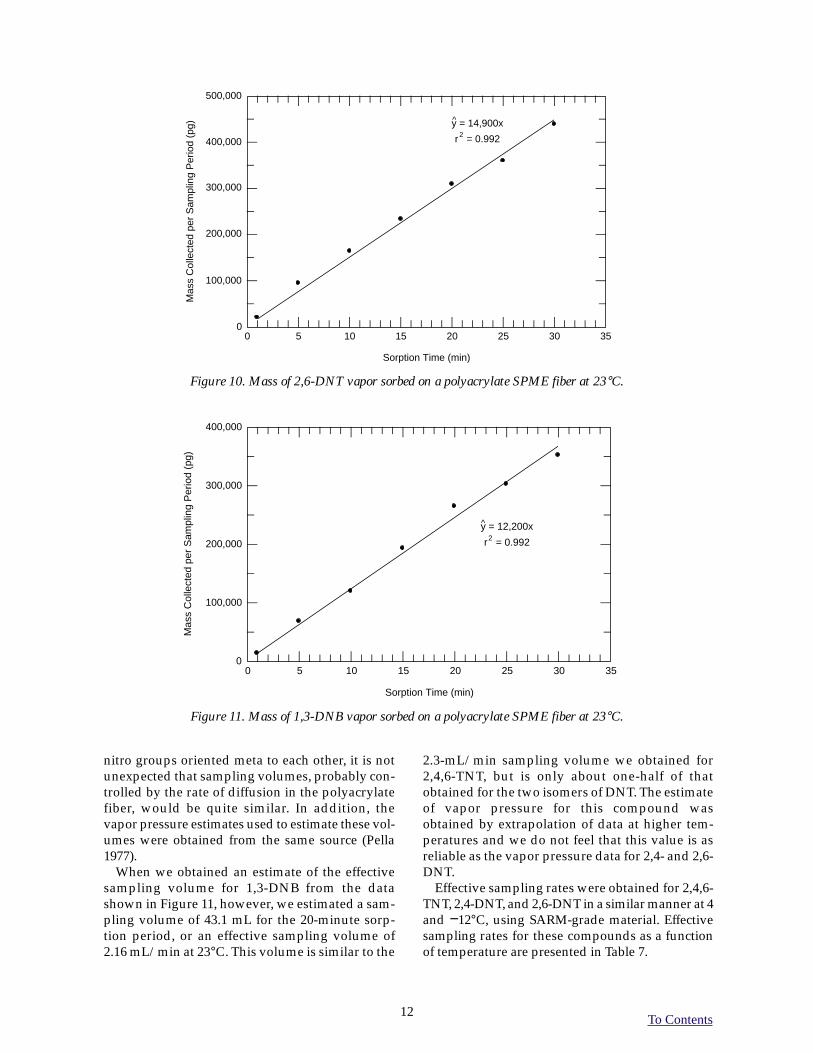
Similarly, plots of the masses of 2,6-DNT and1,3-DNB recovered as a function of sorption timeare presented in Figures 10 and 11. In both cases,the mass recovered as a function of sampling timewas adequately described by linear models withcorrelation coefficients of 0.992. When an effectivesampling volume for 2,6-DNT was computed, asdescribed for 2,4-DNT, a sampling volume of 81.1mL was obtained for a 20-minute sorption period,which is 4.05 mL/min at 23°C. This value com-pares favorably with 4.45 mL/min for 2,4-DNT atthe same temperature. Since these two species aregeometric isomers of one another, with the two
11
Figure 9. Mass of 2,4-DNT vapor sorbed on a polyacrylate SPME fiber at 23°C.
y = 6300x
r = 0.9902
^
Sorption Time (min)
250,000
0350
Mas
s C
olle
cted
per
Sam
plin
g P
erio
d (p
g)
200,000
150,000
100,000
50,000
5 10 15 20 25 30
To Contents12
nitro groups oriented meta to each other, it is notunexpected that sampling volumes, probably con-trolled by the rate of diffusion in the polyacrylatefiber, would be quite similar. In addition, thevapor pressure estimates used to estimate these vol-umes were obtained from the same source (Pella1977).
When we obtained an estimate of the effectivesampling volume for 1,3-DNB from the datashown in Figure 11, however, we estimated a sam-pling volume of 43.1 mL for the 20-minute sorp-tion period, or an effective sampling volume of2.16 mL/min at 23°C. This volume is similar to the
Figure 10. Mass of 2,6-DNT vapor sorbed on a polyacrylate SPME fiber at 23°C.
Figure 11. Mass of 1,3-DNB vapor sorbed on a polyacrylate SPME fiber at 23°C.
2.3-mL/min sampling volume we obtained for2,4,6-TNT, but is only about one-half of thatobtained for the two isomers of DNT. The estimateof vapor pressure for this compound wasobtained by extrapolation of data at higher tem-peratures and we do not feel that this value is asreliable as the vapor pressure data for 2,4- and 2,6-DNT.
Effective sampling rates were obtained for 2,4,6-TNT, 2,4-DNT, and 2,6-DNT in a similar manner at 4and −12°C, using SARM-grade material. Effectivesampling rates for these compounds as a functionof temperature are presented in Table 7.
Sorption Time (min)
500,000
0350
Mas
s C
olle
cted
per
Sam
plin
g P
erio
d (p
g)300,000
200,000
100,000
5 10 15 20 25 30
400,000
y = 14,900x
r = 0.9922
^
y = 12,200x
r = 0.9922
^
Sorption Time (min)
400,000
0350
Mas
s C
olle
cted
per
Sam
plin
g P
erio
d (p
g)
300,000
200,000
100,000
5 10 15 20 25 30
To Contents13
Vapor concentrations of signature chemicalsin soil headspace samples
Peak heights for the target analytes detected inthe soil headspace SPME samples were convertedto mass (ng) using SARM-based standards pre-pared in acetonitrile. Peak heights for 2,5-DNTand 3-5-DNT were converted to mass of analyterecovered using the response factors for 2,4-DNT.After locating a source for these analytes, wemade the standards and compared the detectorresponse to the response for the 2,4-DNT stan-dard. A response conversion factor was appliedto 2,5-DNT and 3,5-DNT so that these analytescould be expressed as their own concentrations.Individual values for the vapor concentration ofeach target analyte in the two replicates for eachcombination of soil type, moisture level, and tem-perature for each day when samples were collect-ed are presented in Appendix A, Tables A1–A9.
The mass of each target analyte detected ineach headspace sample was converted to vaporconcentration (pg/mL) using the effective sam-pling rates (mL/min), which were obtained asdescribed in the Calibration of SPME section, andthe sampling times (minutes) for each tempera-ture. The effective sampling rate for 2,4,6-TNT(2.3 mL/min) was used to compute vapor con-centrations for 2,4,6-TNT and other compoundscontaining three nitro functions. The effectivesampling rate obtained for 2,4-DNT (4.5 mL/min) was used to estimate vapor concentrationsof 2,4-DNT. Vapor concentrations for the otherdinitro-containing compounds (DNTs and DNBs)were estimated from the mean effective samplingrates measured for 2,4-DNT and 2,6-DNT (4.3mL/min). The effective sampling rate estimatefor 1,3-DNB was not used because we judged thevapor pressure data that served as the basis forthis value to be unreliable. These concentrationsfor each headspace sample analyzed are presentedin Tables A10–A18.
Mean vapor concentrations for the two repli-
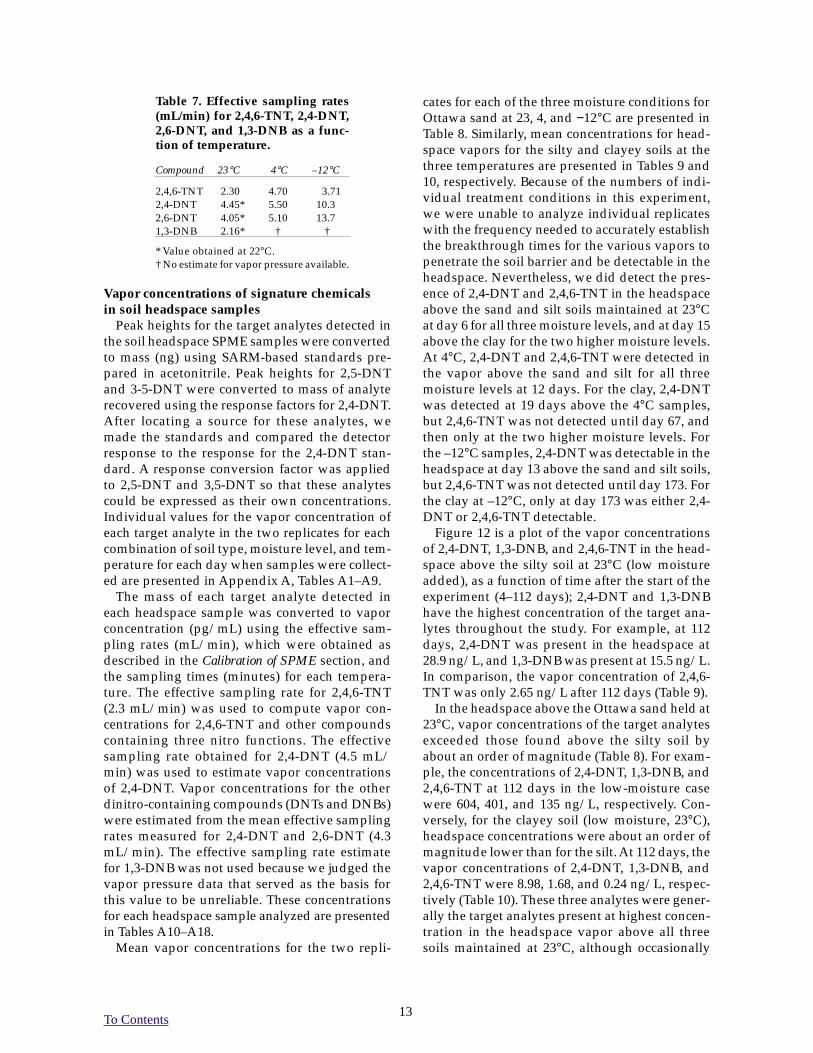
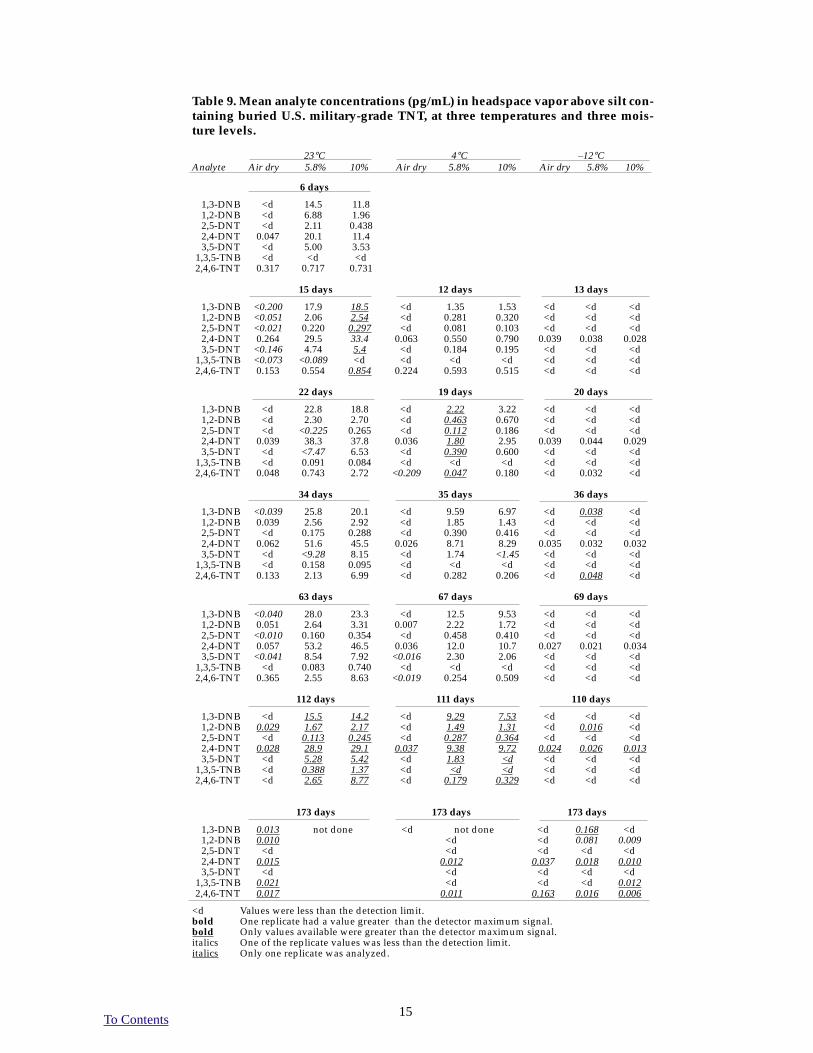
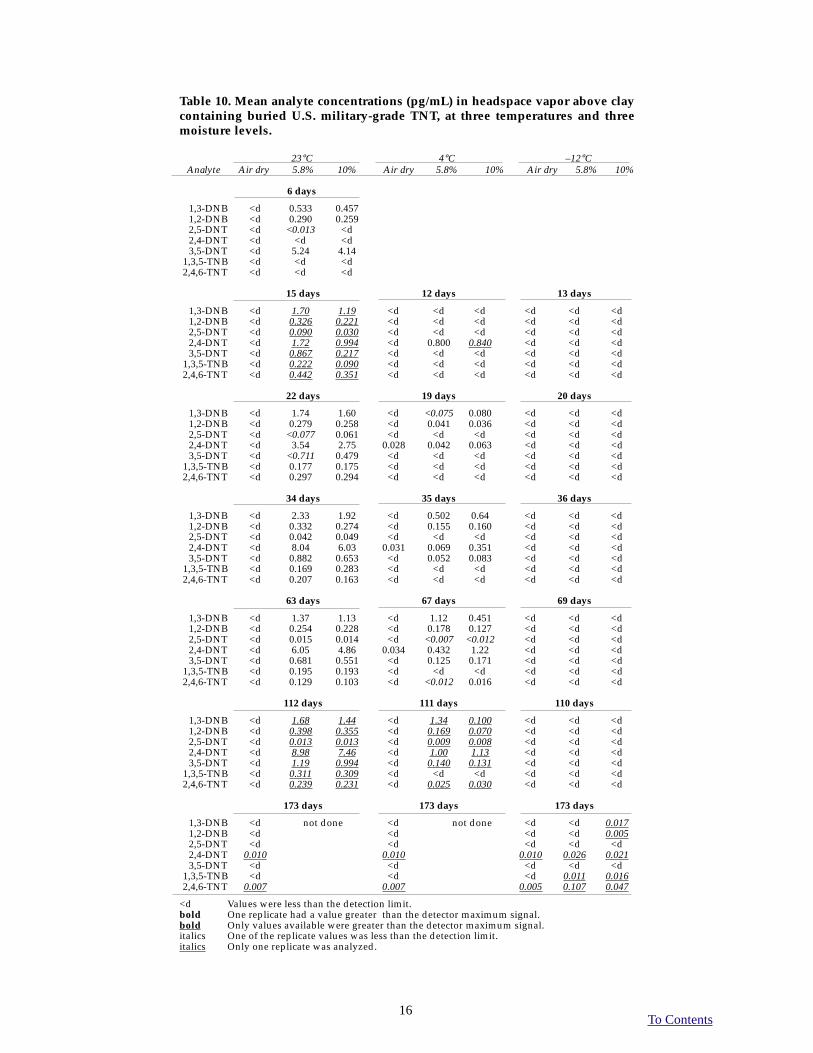
cates for each of the three moisture conditions forOttawa sand at 23, 4, and −12°C are presented inTable 8. Similarly, mean concentrations for head-space vapors for the silty and clayey soils at thethree temperatures are presented in Tables 9 and10, respectively. Because of the numbers of indi-vidual treatment conditions in this experiment,we were unable to analyze individual replicateswith the frequency needed to accurately establishthe breakthrough times for the various vapors topenetrate the soil barrier and be detectable in theheadspace. Nevertheless, we did detect the pres-ence of 2,4-DNT and 2,4,6-TNT in the headspaceabove the sand and silt soils maintained at 23°Cat day 6 for all three moisture levels, and at day 15above the clay for the two higher moisture levels.At 4°C, 2,4-DNT and 2,4,6-TNT were detected inthe vapor above the sand and silt for all threemoisture levels at 12 days. For the clay, 2,4-DNTwas detected at 19 days above the 4°C samples,but 2,4,6-TNT was not detected until day 67, andthen only at the two higher moisture levels. Forthe –12°C samples, 2,4-DNT was detectable in theheadspace at day 13 above the sand and silt soils,but 2,4,6-TNT was not detected until day 173. Forthe clay at –12°C, only at day 173 was either 2,4-DNT or 2,4,6-TNT detectable.
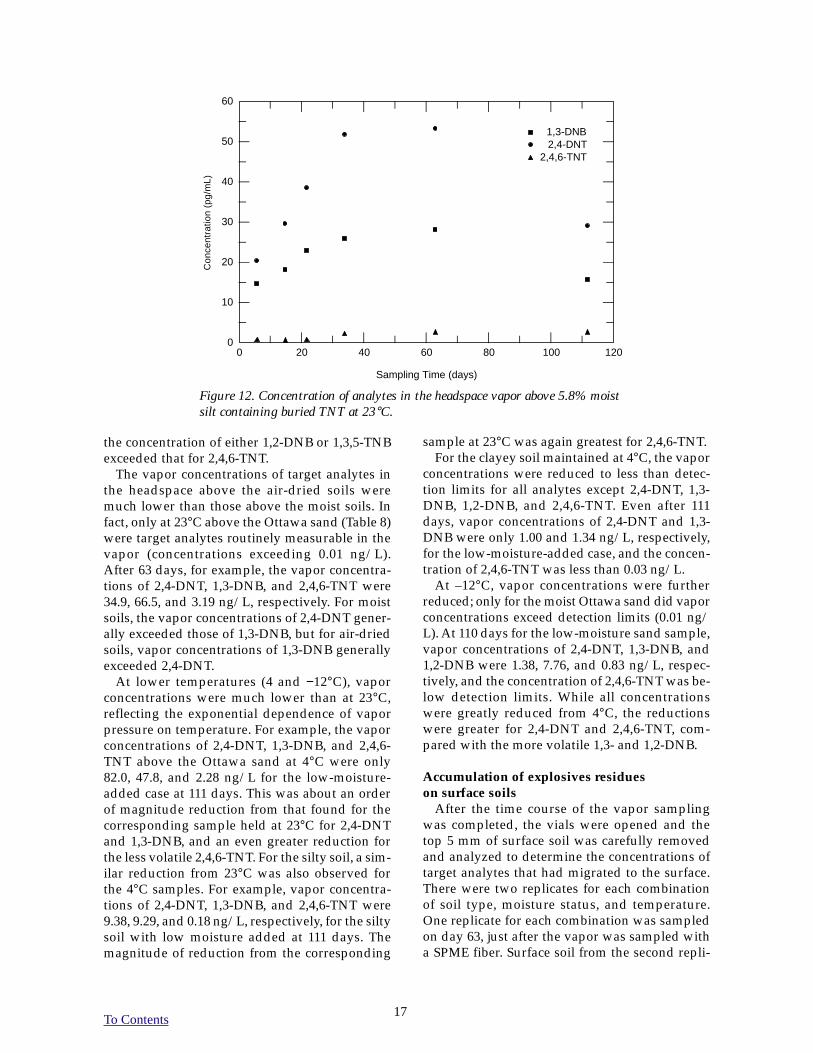
Figure 12 is a plot of the vapor concentrationsof 2,4-DNT, 1,3-DNB, and 2,4,6-TNT in the head-space above the silty soil at 23°C (low moistureadded), as a function of time after the start of theexperiment (4–112 days); 2,4-DNT and 1,3-DNBhave the highest concentration of the target ana-lytes throughout the study. For example, at 112days, 2,4-DNT was present in the headspace at28.9 ng/L, and 1,3-DNB was present at 15.5 ng/L.In comparison, the vapor concentration of 2,4,6-TNT was only 2.65 ng/L after 112 days (Table 9).
In the headspace above the Ottawa sand held at23°C, vapor concentrations of the target analytesexceeded those found above the silty soil byabout an order of magnitude (Table 8). For exam-ple, the concentrations of 2,4-DNT, 1,3-DNB, and2,4,6-TNT at 112 days in the low-moisture casewere 604, 401, and 135 ng/L, respectively. Con-versely, for the clayey soil (low moisture, 23°C),headspace concentrations were about an order ofmagnitude lower than for the silt. At 112 days, thevapor concentrations of 2,4-DNT, 1,3-DNB, and2,4,6-TNT were 8.98, 1.68, and 0.24 ng/L, respec-tively (Table 10). These three analytes were gener-ally the target analytes present at highest concen-tration in the headspace vapor above all threesoils maintained at 23°C, although occasionally
Table 7. Effective sampling rates(mL/min) for 2,4,6-TNT, 2,4-DNT,2,6-DNT, and 1,3-DNB as a func-tion of temperature.
Compound 23°C 4°C –12°C
2,4,6-TNT 2.30 4.70 3.712,4-DNT 4.45* 5.50 10.32,6-DNT 4.05* 5.10 13.71,3-DNB 2.16* † †
* Value obtained at 22°C.† No estimate for vapor pressure available.

To Contents14
Table 8. Mean analyte concentrations (pg/mL) in headspace vapor above sandcontaining buried U.S. military-grade TNT, at three temperatures and threemoisture levels.
23°C 4°C –12°CAnalyte Air dry 2.10% 3.10% Air dry 2.10% 3.10% Air dry 2.10% 3.10%
6 days
1,3-DNB 8.21 116 66.71,2-DNB 4.37 21.5 13.72,5-DNT <0.544 <14.3 8.592,4-DNT 0.700 151 1053,5-DNT <d <40.7 26.5
1,3,5-TNB <d <d <d2,4,6-TNT 0.125 7.76 10.1
15 days 12 days 13 days
1,3-DNB 115 171 87.7 <d 7.05 6.39 <d <d <d1,2-DNB 30.6 34.0 18.8 0.023 1.48 1.42 <d <d <d2,5-DNT 8.74 15.8 7.96 <d 1.05 1.00 <d <d <d2,4-DNT 16.5 >203 172 0.132 7.12 6.82 0.015 0.103 0.0593,5-DNT 4.35 55.6 34.3 <d 2.23 2.00 <d <d <d
1,3,5-TNB <d 1.84 1.17 <d <d <d <d <d <d2,4,6-TNT 3.42 23.8 19.2 0.371 0.980 1.91 <d <d <d
22 days 19 days 20 days
1,3-DNB 15.0 267 107 <0.036 33.6 12.4 <d <d <d1,2-DNB 7.52 43.1 22.4 <0.008 6.50 2.90 <d <d <d2,5-DNT 0.464 15.0 8.09 <0.017 3.64 1.39 <d <d <d2,4-DNT 6.23 >306 208 0.102 44.9 21.3 0.042 0.032 0.0343,5-DNT 0.699 77.6 27.2 0.031 9.33 4.74 <d <d <d
1,3,5-TNB <d 17.20 2.39 <0.063 <0.082 0.071 <d <d <d2,4,6-TNT 0.476 30.8 40.4 0.950 1.58 2.56 <d <d <d
34 days 35 days 36 days
1,3-DNB 64.8 207 146 <d 45.5 30.3 <d 1.00 0.5921,2-DNB 22.3 39.7 29.9 <d 9.61 6.59 <d 0.101 0.0582,5-DNT 4.97 14.6 10.7 <d 5.15 3.31 <d 0.046 0.0272,4-DNT 43.6 >298 >260 0.030 69.6 50.2 0.045 0.042 0.0443,5-DNT <6.06 78.2 60.2 <d 14.7 <10.7 <d <d <d
1,3,5-TNB <d 16.5 8.72 <d 0.243 0.249 <d <d <d2,4,6-TNT 6.90 147 147 0.033 4.22 6.36 <d <d <d
63 days 67 days 69 days
1,3-DNB 66.5 348 212 <d 40.6 32.2 <d 4.19 3.301,2-DNB 22.1 64.0 40.0 <d 9.20 7.00 <d 0.420 0.3162,5-DNT 4.75 26.2 14.5 <d 5.22 3.93 <d 0.197 0.1442,4-DNT 34.9 >168 >211 0.030 66.1 52.6 0.026 0.501 0.3163,5-DNT 4.56 227 70.7 <d 13.0 10.4 <d 0.065 <0.054
1,3,5-TNB <d 11.5 6.51 <d 0.103 0.113 <d <0.021 <0.0192,4,6-TNT 3.19 101 96.8 0.010 2.73 3.70 <d 0.014 0.011
112 days 111 days 110 days
1,3-DNB 5.86 401 231 <d 47.8 31.8 <d 7.76 7.431,2-DNB 3.58 76.3 44.9 <d 10.6 7.19 0.032 0.830 0.7602,5-DNT 0.407 25.2 16.6 <d 6.36 4.15 <d 0.403 0.3652,4-DNT 1.93 604 427 0.018 82.0 56.5 0.026 1.38 1.313,5-DNT 0.267 125 85.6 <d 16.7 11.4 <d 0.218 0.203
1,3,5-TNB <d 8.59 2.96 <d <d <d <d <d <d2,4,6-TNT 0.542 135 97.7 0.006 2.28 1.61 <d <d <d
173 days 173 days
1,3-DNB <d not done <d not done1,2-DNB 0.080 0.0742,5-DNT <d <d2,4-DNT 0.020 0.0103,5-DNT <d <d
1,3,5-TNB 0.010 <d2,4,6-TNT 0.042 0.016
<d Values were less than the detection limit.bold One replicate had a value greater than the detector maximum signal.bold Only values available were greater than the detector maximum signal.italics One of the replicate values was less than the detection limit.italics Only one replicate was analyzed.
To Contents15
Table 9. Mean analyte concentrations (pg/mL) in headspace vapor above silt con-taining buried U.S. military-grade TNT, at three temperatures and three mois-ture levels.
23°C 4°C –12°CAnalyte Air dry 5.8% 10% Air dry 5.8% 10% Air dry 5.8% 10%
6 days
1,3-DNB <d 14.5 11.81,2-DNB <d 6.88 1.962,5-DNT <d 2.11 0.4382,4-DNT 0.047 20.1 11.43,5-DNT <d 5.00 3.53
1,3,5-TNB <d <d <d2,4,6-TNT 0.317 0.717 0.731
15 days 12 days 13 days
1,3-DNB <0.200 17.9 18.5 <d 1.35 1.53 <d <d <d1,2-DNB <0.051 2.06 2.54 <d 0.281 0.320 <d <d <d2,5-DNT <0.021 0.220 0.297 <d 0.081 0.103 <d <d <d2,4-DNT 0.264 29.5 33.4 0.063 0.550 0.790 0.039 0.038 0.0283,5-DNT <0.146 4.74 5.4 <d 0.184 0.195 <d <d <d
1,3,5-TNB <0.073 <0.089 <d <d <d <d <d <d <d2,4,6-TNT 0.153 0.554 0.854 0.224 0.593 0.515 <d <d <d
22 days 19 days 20 days
1,3-DNB <d 22.8 18.8 <d 2.22 3.22 <d <d <d1,2-DNB <d 2.30 2.70 <d 0.463 0.670 <d <d <d2,5-DNT <d <0.225 0.265 <d 0.112 0.186 <d <d <d2,4-DNT 0.039 38.3 37.8 0.036 1.80 2.95 0.039 0.044 0.0293,5-DNT <d <7.47 6.53 <d 0.390 0.600 <d <d <d
1,3,5-TNB <d 0.091 0.084 <d <d <d <d <d <d2,4,6-TNT 0.048 0.743 2.72 <0.209 0.047 0.180 <d 0.032 <d
34 days 35 days 36 days
1,3-DNB <0.039 25.8 20.1 <d 9.59 6.97 <d 0.038 <d1,2-DNB 0.039 2.56 2.92 <d 1.85 1.43 <d <d <d2,5-DNT <d 0.175 0.288 <d 0.390 0.416 <d <d <d2,4-DNT 0.062 51.6 45.5 0.026 8.71 8.29 0.035 0.032 0.0323,5-DNT <d <9.28 8.15 <d 1.74 <1.45 <d <d <d
1,3,5-TNB <d 0.158 0.095 <d <d <d <d <d <d2,4,6-TNT 0.133 2.13 6.99 <d 0.282 0.206 <d 0.048 <d
63 days 67 days 69 days
1,3-DNB <0.040 28.0 23.3 <d 12.5 9.53 <d <d <d1,2-DNB 0.051 2.64 3.31 0.007 2.22 1.72 <d <d <d2,5-DNT <0.010 0.160 0.354 <d 0.458 0.410 <d <d <d2,4-DNT 0.057 53.2 46.5 0.036 12.0 10.7 0.027 0.021 0.0343,5-DNT <0.041 8.54 7.92 <0.016 2.30 2.06 <d <d <d
1,3,5-TNB <d 0.083 0.740 <d <d <d <d <d <d2,4,6-TNT 0.365 2.55 8.63 <0.019 0.254 0.509 <d <d <d
112 days 111 days 110 days
1,3-DNB <d 15.5 14.2 <d 9.29 7.53 <d <d <d1,2-DNB 0.029 1.67 2.17 <d 1.49 1.31 <d 0.016 <d2,5-DNT <d 0.113 0.245 <d 0.287 0.364 <d <d <d2,4-DNT 0.028 28.9 29.1 0.037 9.38 9.72 0.024 0.026 0.0133,5-DNT <d 5.28 5.42 <d 1.83 <d <d <d <d
1,3,5-TNB <d 0.388 1.37 <d <d <d <d <d <d2,4,6-TNT <d 2.65 8.77 <d 0.179 0.329 <d <d <d
173 days 173 days 173 days
1,3-DNB 0.013 not done <d not done <d 0.168 <d1,2-DNB 0.010 <d <d 0.081 0.0092,5-DNT <d <d <d <d <d2,4-DNT 0.015 0.012 0.037 0.018 0.0103,5-DNT <d <d <d <d <d
1,3,5-TNB 0.021 <d <d <d 0.0122,4,6-TNT 0.017 0.011 0.163 0.016 0.006
<d Values were less than the detection limit.bold One replicate had a value greater than the detector maximum signal.bold Only values available were greater than the detector maximum signal.italics One of the replicate values was less than the detection limit.italics Only one replicate was analyzed.
To Contents
Table 10. Mean analyte concentrations (pg/mL) in headspace vapor above claycontaining buried U.S. military-grade TNT, at three temperatures and threemoisture levels.
23°C 4°C –12°CAnalyte Air dry 5.8% 10% Air dry 5.8% 10% Air dry 5.8% 10%
6 days
1,3-DNB <d 0.533 0.4571,2-DNB <d 0.290 0.2592,5-DNT <d <0.013 <d2,4-DNT <d <d <d3,5-DNT <d 5.24 4.14
1,3,5-TNB <d <d <d2,4,6-TNT <d <d <d
15 days 12 days 13 days
1,3-DNB <d 1.70 1.19 <d <d <d <d <d <d1,2-DNB <d 0.326 0.221 <d <d <d <d <d <d2,5-DNT <d 0.090 0.030 <d <d <d <d <d <d2,4-DNT <d 1.72 0.994 <d 0.800 0.840 <d <d <d3,5-DNT <d 0.867 0.217 <d <d <d <d <d <d
1,3,5-TNB <d 0.222 0.090 <d <d <d <d <d <d2,4,6-TNT <d 0.442 0.351 <d <d <d <d <d <d
22 days 19 days 20 days
1,3-DNB <d 1.74 1.60 <d <0.075 0.080 <d <d <d1,2-DNB <d 0.279 0.258 <d 0.041 0.036 <d <d <d2,5-DNT <d <0.077 0.061 <d <d <d <d <d <d2,4-DNT <d 3.54 2.75 0.028 0.042 0.063 <d <d <d3,5-DNT <d <0.711 0.479 <d <d <d <d <d <d
1,3,5-TNB <d 0.177 0.175 <d <d <d <d <d <d2,4,6-TNT <d 0.297 0.294 <d <d <d <d <d <d
34 days 35 days 36 days
1,3-DNB <d 2.33 1.92 <d 0.502 0.64 <d <d <d1,2-DNB <d 0.332 0.274 <d 0.155 0.160 <d <d <d2,5-DNT <d 0.042 0.049 <d <d <d <d <d <d2,4-DNT <d 8.04 6.03 0.031 0.069 0.351 <d <d <d3,5-DNT <d 0.882 0.653 <d 0.052 0.083 <d <d <d
1,3,5-TNB <d 0.169 0.283 <d <d <d <d <d <d2,4,6-TNT <d 0.207 0.163 <d <d <d <d <d <d
63 days 67 days 69 days
1,3-DNB <d 1.37 1.13 <d 1.12 0.451 <d <d <d1,2-DNB <d 0.254 0.228 <d 0.178 0.127 <d <d <d2,5-DNT <d 0.015 0.014 <d <0.007 <0.012 <d <d <d2,4-DNT <d 6.05 4.86 0.034 0.432 1.22 <d <d <d3,5-DNT <d 0.681 0.551 <d 0.125 0.171 <d <d <d
1,3,5-TNB <d 0.195 0.193 <d <d <d <d <d <d2,4,6-TNT <d 0.129 0.103 <d <0.012 0.016 <d <d <d
112 days 111 days 110 days
1,3-DNB <d 1.68 1.44 <d 1.34 0.100 <d <d <d1,2-DNB <d 0.398 0.355 <d 0.169 0.070 <d <d <d2,5-DNT <d 0.013 0.013 <d 0.009 0.008 <d <d <d2,4-DNT <d 8.98 7.46 <d 1.00 1.13 <d <d <d3,5-DNT <d 1.19 0.994 <d 0.140 0.131 <d <d <d
1,3,5-TNB <d 0.311 0.309 <d <d <d <d <d <d2,4,6-TNT <d 0.239 0.231 <d 0.025 0.030 <d <d <d
173 days 173 days 173 days
1,3-DNB <d not done <d not done <d <d 0.0171,2-DNB <d <d <d <d 0.0052,5-DNT <d <d <d <d <d2,4-DNT 0.010 0.010 0.010 0.026 0.0213,5-DNT <d <d <d <d <d
1,3,5-TNB <d <d <d 0.011 0.0162,4,6-TNT 0.007 0.007 0.005 0.107 0.047
<d Values were less than the detection limit.bold One replicate had a value greater than the detector maximum signal.bold Only values available were greater than the detector maximum signal.italics One of the replicate values was less than the detection limit.italics Only one replicate was analyzed.
16
To Contents
Figure 12. Concentration of analytes in the headspace vapor above 5.8% moistsilt containing buried TNT at 23°C.
Sampling Time (days)
60
01200
30
20
10
20 40 60 80 100
50
40
1,3-DNB2,4-DNT
2,4,6-TNT
the concentration of either 1,2-DNB or 1,3,5-TNBexceeded that for 2,4,6-TNT.
The vapor concentrations of target analytes inthe headspace above the air-dried soils weremuch lower than those above the moist soils. Infact, only at 23°C above the Ottawa sand (Table 8)were target analytes routinely measurable in thevapor (concentrations exceeding 0.01 ng/L).After 63 days, for example, the vapor concentra-tions of 2,4-DNT, 1,3-DNB, and 2,4,6-TNT were34.9, 66.5, and 3.19 ng/L, respectively. For moistsoils, the vapor concentrations of 2,4-DNT gener-ally exceeded those of 1,3-DNB, but for air-driedsoils, vapor concentrations of 1,3-DNB generallyexceeded 2,4-DNT.
At lower temperatures (4 and −12°C), vaporconcentrations were much lower than at 23°C,reflecting the exponential dependence of vaporpressure on temperature. For example, the vaporconcentrations of 2,4-DNT, 1,3-DNB, and 2,4,6-TNT above the Ottawa sand at 4°C were only82.0, 47.8, and 2.28 ng/L for the low-moisture-added case at 111 days. This was about an orderof magnitude reduction from that found for thecorresponding sample held at 23°C for 2,4-DNTand 1,3-DNB, and an even greater reduction forthe less volatile 2,4,6-TNT. For the silty soil, a sim-ilar reduction from 23°C was also observed forthe 4°C samples. For example, vapor concentra-tions of 2,4-DNT, 1,3-DNB, and 2,4,6-TNT were9.38, 9.29, and 0.18 ng/L, respectively, for the siltysoil with low moisture added at 111 days. Themagnitude of reduction from the corresponding
sample at 23°C was again greatest for 2,4,6-TNT.For the clayey soil maintained at 4°C, the vapor
concentrations were reduced to less than detec-tion limits for all analytes except 2,4-DNT, 1,3-DNB, 1,2-DNB, and 2,4,6-TNT. Even after 111days, vapor concentrations of 2,4-DNT and 1,3-DNB were only 1.00 and 1.34 ng/L, respectively,for the low-moisture-added case, and the concen-tration of 2,4,6-TNT was less than 0.03 ng/L.
At –12°C, vapor concentrations were furtherreduced; only for the moist Ottawa sand did vaporconcentrations exceed detection limits (0.01 ng/L). At 110 days for the low-moisture sand sample,vapor concentrations of 2,4-DNT, 1,3-DNB, and1,2-DNB were 1.38, 7.76, and 0.83 ng/L, respec-tively, and the concentration of 2,4,6-TNT was be-low detection limits. While all concentrationswere greatly reduced from 4°C, the reductionswere greater for 2,4-DNT and 2,4,6-TNT, com-pared with the more volatile 1,3- and 1,2-DNB.
Accumulation of explosives residueson surface soils
After the time course of the vapor samplingwas completed, the vials were opened and thetop 5 mm of surface soil was carefully removedand analyzed to determine the concentrations oftarget analytes that had migrated to the surface.There were two replicates for each combinationof soil type, moisture status, and temperature.One replicate for each combination was sampledon day 63, just after the vapor was sampled witha SPME fiber. Surface soil from the second repli-
17
Con
cent
ratio
n (p
g/m
L)
To Contents18
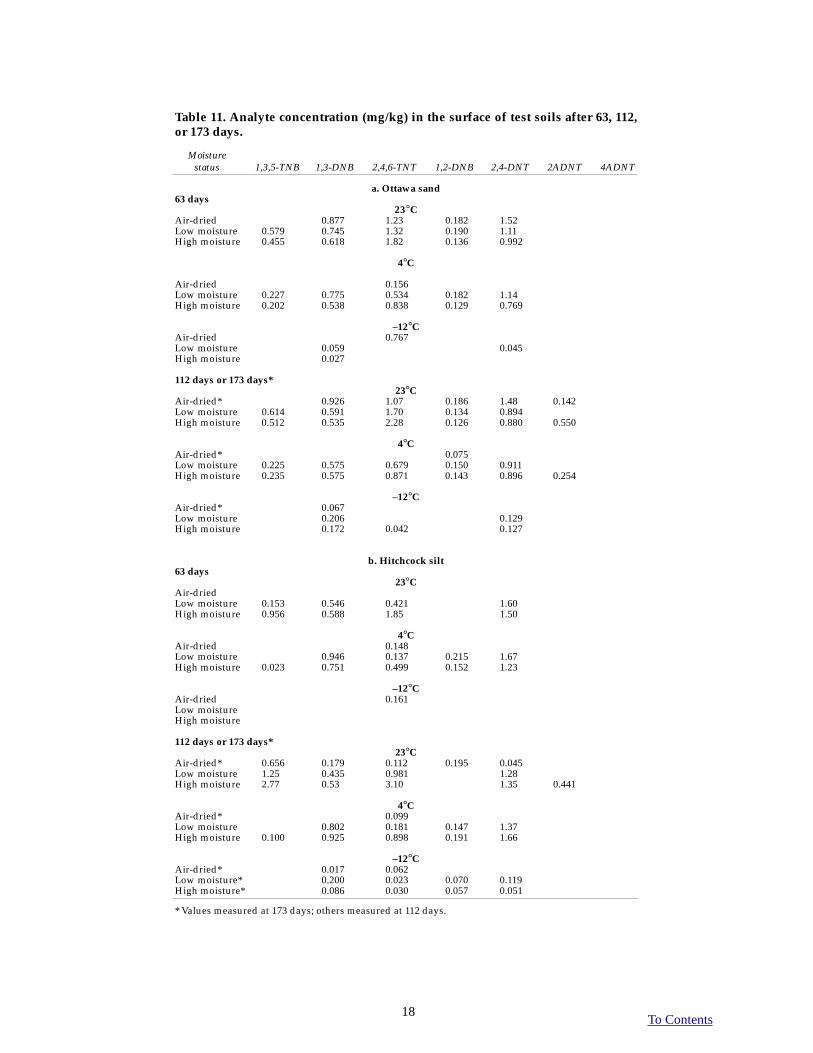
Table 11. Analyte concentration (mg/kg) in the surface of test soils after 63, 112,or 173 days.
Moisturestatus 1,3,5-TNB 1,3-DNB 2,4,6-TNT 1,2-DNB 2,4-DNT 2ADNT 4ADNT
a. Ottawa sand63 days
23°CAir-dried 0.877 1.23 0.182 1.52Low moisture 0.579 0.745 1.32 0.190 1.11High moisture 0.455 0.618 1.82 0.136 0.992
4°C
Air-dried 0.156Low moisture 0.227 0.775 0.534 0.182 1.14High moisture 0.202 0.538 0.838 0.129 0.769
–12°CAir-dried 0.767Low moisture 0.059 0.045High moisture 0.027
112 days or 173 days*23°C
Air-dried* 0.926 1.07 0.186 1.48 0.142Low moisture 0.614 0.591 1.70 0.134 0.894High moisture 0.512 0.535 2.28 0.126 0.880 0.550
4°CAir-dried* 0.075Low moisture 0.225 0.575 0.679 0.150 0.911High moisture 0.235 0.575 0.871 0.143 0.896 0.254
–12°CAir-dried* 0.067Low moisture 0.206 0.129High moisture 0.172 0.042 0.127
b. Hitchcock silt63 days
23°CAir-driedLow moisture 0.153 0.546 0.421 1.60High moisture 0.956 0.588 1.85 1.50
4°CAir-dried 0.148Low moisture 0.946 0.137 0.215 1.67High moisture 0.023 0.751 0.499 0.152 1.23
–12°CAir-dried 0.161Low moistureHigh moisture
112 days or 173 days*23°C
Air-dried* 0.656 0.179 0.112 0.195 0.045Low moisture 1.25 0.435 0.981 1.28High moisture 2.77 0.53 3.10 1.35 0.441
4°CAir-dried* 0.099Low moisture 0.802 0.181 0.147 1.37High moisture 0.100 0.925 0.898 0.191 1.66
–12°CAir-dried* 0.017 0.062Low moisture* 0.200 0.023 0.070 0.119High moisture* 0.086 0.030 0.057 0.051
* Values measured at 173 days; others measured at 112 days.
To Contents
cate was sampled in a similar manner on day 112for most combinations, again just after the vaporsample was collected. For several of the air-driedsoil combinations, and some of the other combi-nations at –12°C, vapor analysis at 112 days indi-cated that target analytes were still below detec-tion limits; thus, in these cases, soil samples forthe second replicate were delayed until day 173 togive additional time for target analytes to maketheir way to the surface.
Results of the surface soil analysis for Ottawasand are presented in Table 11a. Measurable con-centrations of 2,4,6-TNT, 2,4-DNT, 1,3- and 1,2-DNB, and 1,3,5-TNB were obtained for samplesheld at 23 and 4°C. For samples held at –12°C,only 2,4-DNT, 1,3-DNB, and 2,4,6-TNT were de-tected. Concentrations of the various TNT-relatedanalytes ranged from below a detection limit ofabout 0.02 mg/kg to 2.28 mg/kg for 2,4,6-TNT ina high-moisture sample held at 23°C for 112 days.Generally, the analytes in the soil with the highestconcentrations were either 2,4,6-TNT or 2,4-DNTfor samples held at 23 or 4°C, but it was 1,3-DNBfor samples held at –12°C, confirming the highermobility of this more volatile component at lowtemperatures. The similarity in concentrations
19
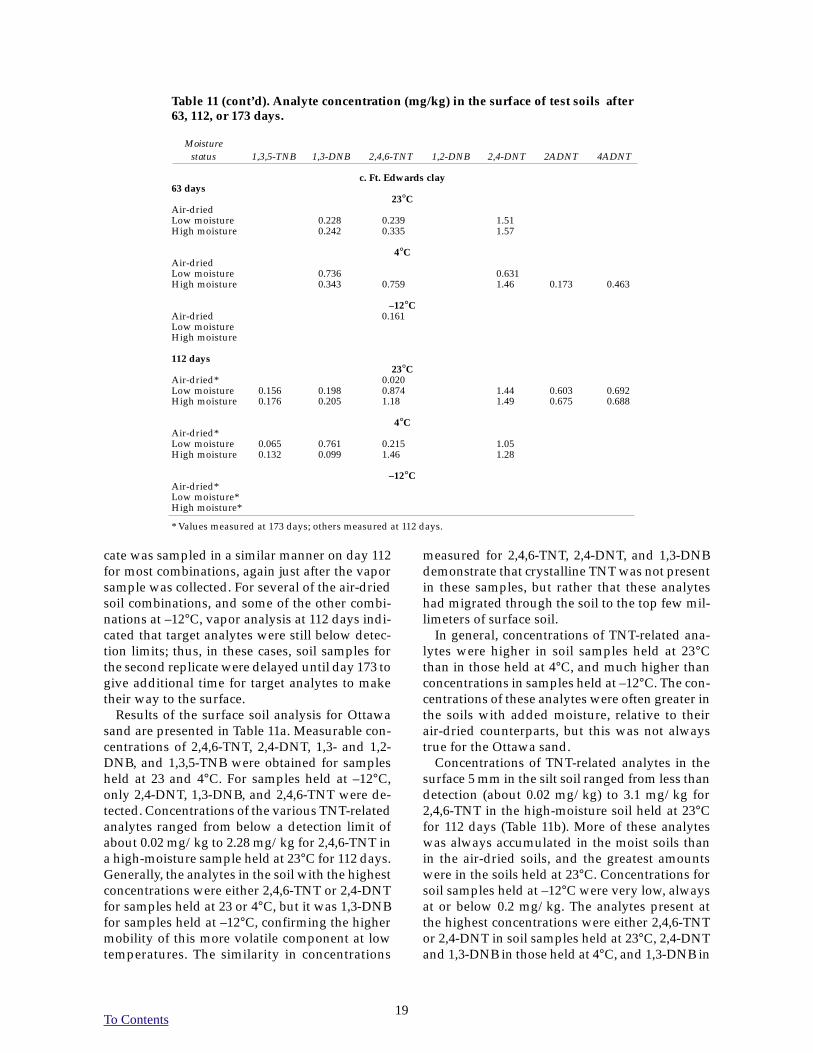
Table 11 (cont’d). Analyte concentration (mg/kg) in the surface of test soils after63, 112, or 173 days.
Moisturestatus 1,3,5-TNB 1,3-DNB 2,4,6-TNT 1,2-DNB 2,4-DNT 2ADNT 4ADNT
c. Ft. Edwards clay63 days
23°CAir-driedLow moisture 0.228 0.239 1.51High moisture 0.242 0.335 1.57
4°CAir-driedLow moisture 0.736 0.631High moisture 0.343 0.759 1.46 0.173 0.463
–12°CAir-dried 0.161Low moistureHigh moisture
112 days23°C
Air-dried* 0.020Low moisture 0.156 0.198 0.874 1.44 0.603 0.692High moisture 0.176 0.205 1.18 1.49 0.675 0.688
4°CAir-dried*Low moisture 0.065 0.761 0.215 1.05High moisture 0.132 0.099 1.46 1.28
–12°CAir-dried*Low moisture*High moisture*
* Values measured at 173 days; others measured at 112 days.
measured for 2,4,6-TNT, 2,4-DNT, and 1,3-DNBdemonstrate that crystalline TNT was not presentin these samples, but rather that these analyteshad migrated through the soil to the top few mil-limeters of surface soil.
In general, concentrations of TNT-related ana-lytes were higher in soil samples held at 23°Cthan in those held at 4°C, and much higher thanconcentrations in samples held at –12°C. The con-centrations of these analytes were often greater inthe soils with added moisture, relative to theirair-dried counterparts, but this was not alwaystrue for the Ottawa sand.
Concentrations of TNT-related analytes in thesurface 5 mm in the silt soil ranged from less thandetection (about 0.02 mg/kg) to 3.1 mg/kg for2,4,6-TNT in the high-moisture soil held at 23°Cfor 112 days (Table 11b). More of these analyteswas always accumulated in the moist soils thanin the air-dried soils, and the greatest amountswere in the soils held at 23°C. Concentrations forsoil samples held at –12°C were very low, alwaysat or below 0.2 mg/kg. The analytes present atthe highest concentrations were either 2,4,6-TNTor 2,4-DNT in soil samples held at 23°C, 2,4-DNTand 1,3-DNB in those held at 4°C, and 1,3-DNB in
To Contents
those held at –12°C. 1,3,5-TNB accumulated sub-stantially, as well, in soil samples held at 23°C,with concentrations ranging from 0.153 to 2.77mg/kg, depending on the moisture content anddays held.
The accumulation of TNT-related analytes inthe surface 5 mm of Ft. Edwards Clay was gener-ally lower than in the sand and silt (Table 11c).TNT-related analytes were nearly always belowdetection for air-dried soils, regardless of the tem-perature. For the moistened soils, concentrationsranged from less than detection to 1.57 mg/kg for2,4-DNT in the high-moisture soil at 63 days. Theconcentration of 2,4-DNT was higher than thatfor 2,4,6-TNT in nearly every case. Concentra-tions of 1,3-DNB were always less than 1.0 mg/kgin the surface of the clay soil.
Even though the two common environmentaltransformation products of TNT (2ADNT and4ADNT) were occasionally detected in thesesoils, the accumulation of these analytes over thisseveral-month experiment was much less thanpredicted from holding time studies (Grant et al.1993, Maskarinec et al. 1991). This may indicatethat analytes moving through the soil in thevapor state become more tightly associated withsoil surfaces than what is normally encounteredat higher concentrations at explosives-contami-nated sites. At higher concentrations, these com-pounds may be present in soil solution to a great-er extent.
Soil–air partition coefficientsSince soil concentrations of TNT-related anal-
ytes were obtained immediately after equilib-rium headspace measurements were completed,it is possible to compute soil–air partition coeffi-cients for each analyte from data obtained in thisexperiment. These partition coefficients areimportant because they compare the amount oftarget analyte present in the soil vs. what ispresent in air at equilibrium. This informationcan be important in deciding whether to concen-trate sample acquisition efforts in the air or in thesoil to detect mines.
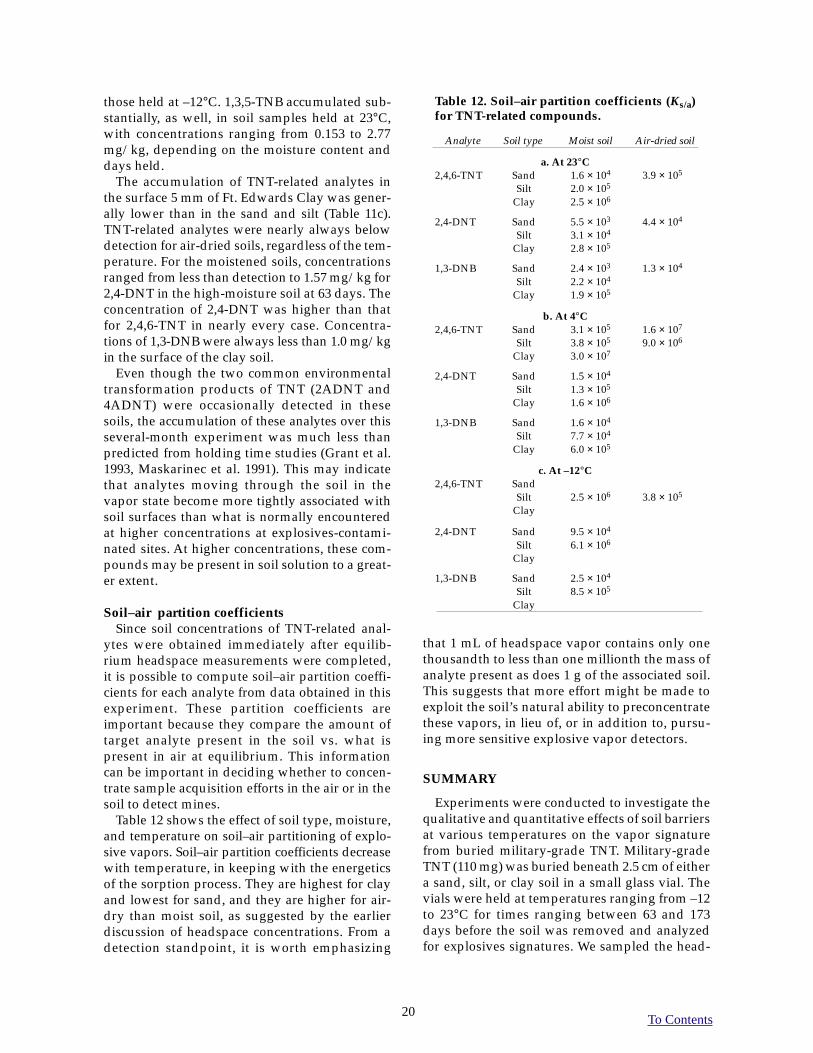
Table 12 shows the effect of soil type, moisture,and temperature on soil–air partitioning of explo-sive vapors. Soil–air partition coefficients decreasewith temperature, in keeping with the energeticsof the sorption process. They are highest for clayand lowest for sand, and they are higher for air-dry than moist soil, as suggested by the earlierdiscussion of headspace concentrations. From adetection standpoint, it is worth emphasizing
20
Table 12. Soil–air partition coefficients (Ks/a)for TNT-related compounds.
Analyte Soil type Moist soil Air-dried soil
a. At 23°C2,4,6-TNT Sand 1.6 × 10⁴ 3.9 × 10⁵
Silt 2.0 × 10⁵
Clay 2.5 × 10⁶
2,4-DNT Sand 5.5 × 10³ 4.4 × 10⁴
Silt 3.1 × 10⁴
Clay 2.8 × 10⁵
1,3-DNB Sand 2.4 × 10³ 1.3 × 10⁴
Silt 2.2 × 10⁴
Clay 1.9 × 10⁵
b. At 4°C2,4,6-TNT Sand 3.1 × 10⁵ 1.6 × 10⁷
Silt 3.8 × 10⁵ 9.0 × 10⁶
Clay 3.0 × 10⁷
2,4-DNT Sand 1.5 × 10⁴
Silt 1.3 × 10⁵
Clay 1.6 × 10⁶
1,3-DNB Sand 1.6 × 10⁴
Silt 7.7 × 10⁴
Clay 6.0 × 10⁵
c. At –12°C2,4,6-TNT Sand
Silt 2.5 × 10⁶ 3.8 × 10⁵
Clay
2,4-DNT Sand 9.5 × 10⁴
Silt 6.1 × 10⁶
Clay
1,3-DNB Sand 2.5 × 10⁴
Silt 8.5 × 10⁵
Clay
that 1 mL of headspace vapor contains only onethousandth to less than one millionth the mass ofanalyte present as does 1 g of the associated soil.This suggests that more effort might be made toexploit the soil’s natural ability to preconcentratethese vapors, in lieu of, or in addition to, pursu-ing more sensitive explosive vapor detectors.
SUMMARY
Experiments were conducted to investigate thequalitative and quantitative effects of soil barriersat various temperatures on the vapor signaturefrom buried military-grade TNT. Military-gradeTNT (110 mg) was buried beneath 2.5 cm of eithera sand, silt, or clay soil in a small glass vial. Thevials were held at temperatures ranging from –12to 23°C for times ranging between 63 and 173days before the soil was removed and analyzedfor explosives signatures. We sampled the head-

To Contents21
space vapors in the vials periodically using poly-acrylate SPME fibers after periods ranging from 6to 173 days and quantified the signatures usingGC-ECD and a non-equilibrium calibration pro-cedure.
Qualitatively, the isomers of DNB, DNT, andTNT account for all of the vapors detected in theheadspace above these soils. In general, 2,4-DNT,1,3-DNB, and 2,4,6-TNT were the target analytespresent at the highest concentrations in the head-space vapor above all three soils maintained at23°C. At 4°C, vapor concentrations were reducedby at least a factor of ten; the reduction was great-est for 2,4,6-TNT, the signature chemical with thelowest vapor pressure. At –12°C, vapor concen-trations were further reduced; reductions weregreater for 2,4-DNT and 2,4,6-TNT, comparedwith the more volatile 1,3-DNB.
Concentrations were generally greater abovesands than above silty soils, and greater abovesilts than clay. Soil moisture level was also animportant variable in controlling headspacevapor concentrations. For air-dried soils, vaporconcentrations were lower than for either of thehigher moisture contents for all three soils at alltemperatures where vapors could be detected.
Measurable concentrations of 2,4,6-TNT, 2,4-DNT, and 1,3-DNB were obtained in the top 5mm of sand and silt held at all three tempera-tures. Lower concentrations of these chemicalswere detected in the clay at 23°C, but concentra-tions were generally below detection limits atlower temperatures.
Soil–air partition coefficients were computedfor samples that had detectable signatures in boththe headspace and the surface soil. These parti-tion coefficients are higher for 2,4,6-TNT than for2,4-DNT or 1,3-DNB, they decrease as tempera-ture increases, they are highest for clay and low-est for sand, and they are higher for air-dry thanmoist soil. At equilibrium, 1 mL of headspacevapor contains only one thousandth to less thanone millionth the mass of signature present asdoes 1 g of the associated soil. Thus, it may bepossible to use the natural preconcentration ofsignature vapors that takes place on surface soilto increase their detectability.
LITERATURE CITED
ASTM (1999) Standard specification for standardsand. C 778-990. West Conshohocken, Pennsylva-nia: American Socirty for Testing and Materials.EPA (1995) SW 846 Method 8330. U.S. Environ-mental Protection Agency, Washington, D.C.Grant, C.L., T.F. Jenkins, and S.M. Golden (1993)Experimental assessment of analytical holdingtimes for nitro-aromatic and nitramine explosivesin soil. USA Cold Regions research and Engineer-ing Laboratory, Special Report 93-11.Howard, P.H. and W.M. Meylan, Ed. (1997)Handbook of Physical Properties of Organic Chemi-cals. Boca Raton: CRC Press.Jenkins, T.F., D.C. Leggett, and R.P. Murrmann(1974) Preliminary investigation of the perme-ability of moist soils to explosive vapor. InAppendix B of G. Spangler (1974) Physical modelfor the subterranean movement of explosivevapors from mines. Fort Belvoir, Virginia: U.S.Army Mobility Equipment Research and Devel-opment Center Report 2095.Leggett, D.C., T.F. Jenkins, and R.P. Murrmann(1977) Composition of vapors evolved from mili-tary TNT as influenced by temperature, solidcomposition, age, and source. USA Cold RegionsResearch and Engineering Laboratory, SpecialReport 77-16.Martos, P.A., and J. Pawliszyn (1998) Calibrationof solid phase microextraction for air analysesbased on physical chemical properties of the coat-ing. Analytical Chemistry 69: 206–215.Maskarinec, M.P., C.K. Bayne, L.H. Johnson,S.K. Holladay, R.A. Jenkins, and B.A. Tompkins(1991) Stability of explosives in environmentalwater and soil samples. Oak Ridge National Lab-oratory Report ORNL/TM-11770.Murrmann, R.P., T.F. Jenkins, and D.C. Leggett(1971) Composition and mass spectra of impuri-ties in military-grade TNT vapor. USA Cold Re-gions Research and Engineering Laboratory, Spe-cial Report 158.Pella, P.A. (1977) Measurement of the vapor pres-sures of TNT, 2,4-DNT, 2,6-DNT, and EGDN.Journal of Chemical Thermodynamics, 9: 301–305.Zhang, Z. and J. Pawliszyn (1993) Headspacesolid-phase microextraction. Analytical Chemistry,65: 1843–1852.

To Contents
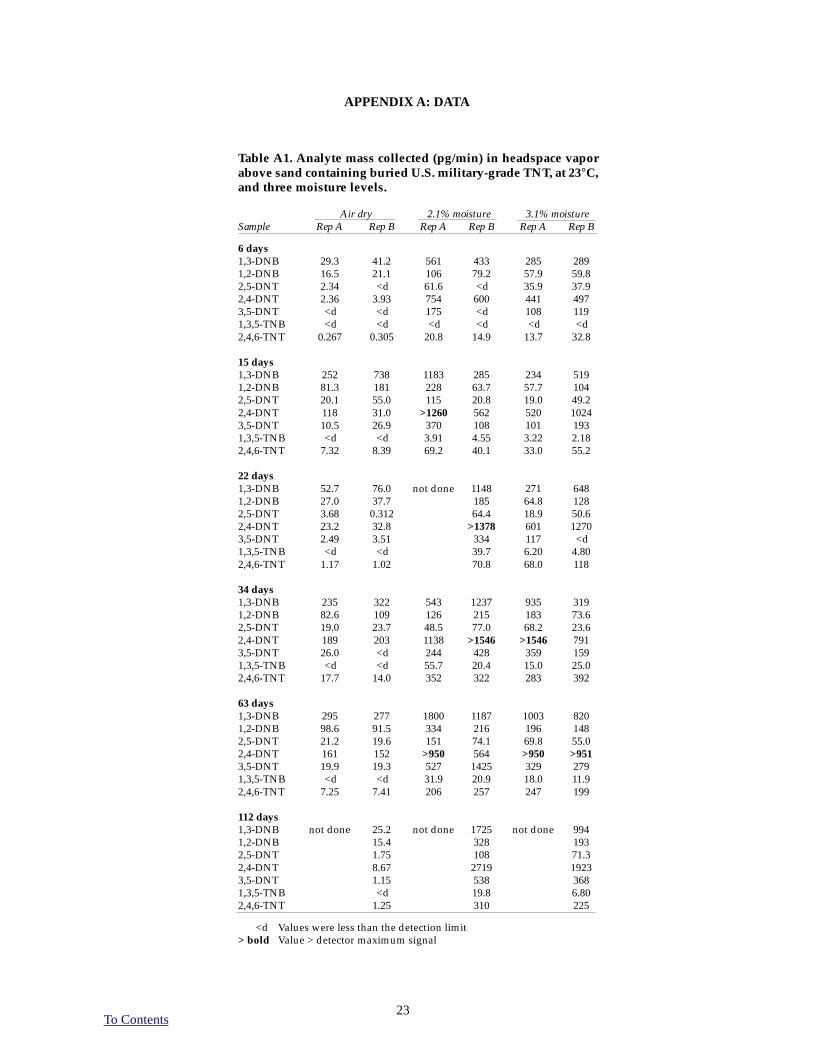
To Contents23
APPENDIX A: DATA
Table A1. Analyte mass collected (pg/min) in headspace vaporabove sand containing buried U.S. military-grade TNT, at 23°C,and three moisture levels.
Air dry 2.1% moisture 3.1% moistureSample Rep A Rep B Rep A Rep B Rep A Rep B
6 days1,3-DNB 29.3 41.2 561 433 285 2891,2-DNB 16.5 21.1 106 79.2 57.9 59.82,5-DNT 2.34 <d 61.6 <d 35.9 37.92,4-DNT 2.36 3.93 754 600 441 4973,5-DNT <d <d 175 <d 108 1191,3,5-TNB <d <d <d <d <d <d2,4,6-TNT 0.267 0.305 20.8 14.9 13.7 32.8
15 days1,3-DNB 252 738 1183 285 234 5191,2-DNB 81.3 181 228 63.7 57.7 1042,5-DNT 20.1 55.0 115 20.8 19.0 49.22,4-DNT 118 31.0 >1260 562 520 10243,5-DNT 10.5 26.9 370 108 101 1931,3,5-TNB <d <d 3.91 4.55 3.22 2.182,4,6-TNT 7.32 8.39 69.2 40.1 33.0 55.2
22 days1,3-DNB 52.7 76.0 not done 1148 271 6481,2-DNB 27.0 37.7 185 64.8 1282,5-DNT 3.68 0.312 64.4 18.9 50.62,4-DNT 23.2 32.8 >1378 601 12703,5-DNT 2.49 3.51 334 117 <d1,3,5-TNB <d <d 39.7 6.20 4.802,4,6-TNT 1.17 1.02 70.8 68.0 118
34 days1,3-DNB 235 322 543 1237 935 3191,2-DNB 82.6 109 126 215 183 73.62,5-DNT 19.0 23.7 48.5 77.0 68.2 23.62,4-DNT 189 203 1138 >1546 >1546 7913,5-DNT 26.0 <d 244 428 359 1591,3,5-TNB <d <d 55.7 20.4 15.0 25.02,4,6-TNT 17.7 14.0 352 322 283 392
63 days1,3-DNB 295 277 1800 1187 1003 8201,2-DNB 98.6 91.5 334 216 196 1482,5-DNT 21.2 19.6 151 74.1 69.8 55.02,4-DNT 161 152 >950 564 >950 >9513,5-DNT 19.9 19.3 527 1425 329 2791,3,5-TNB <d <d 31.9 20.9 18.0 11.92,4,6-TNT 7.25 7.41 206 257 247 199
112 days1,3-DNB not done 25.2 not done 1725 not done 9941,2-DNB 15.4 328 1932,5-DNT 1.75 108 71.32,4-DNT 8.67 2719 19233,5-DNT 1.15 538 3681,3,5-TNB <d 19.8 6.802,4,6-TNT 1.25 310 225
<d Values were less than the detection limit> bold Value > detector maximum signal
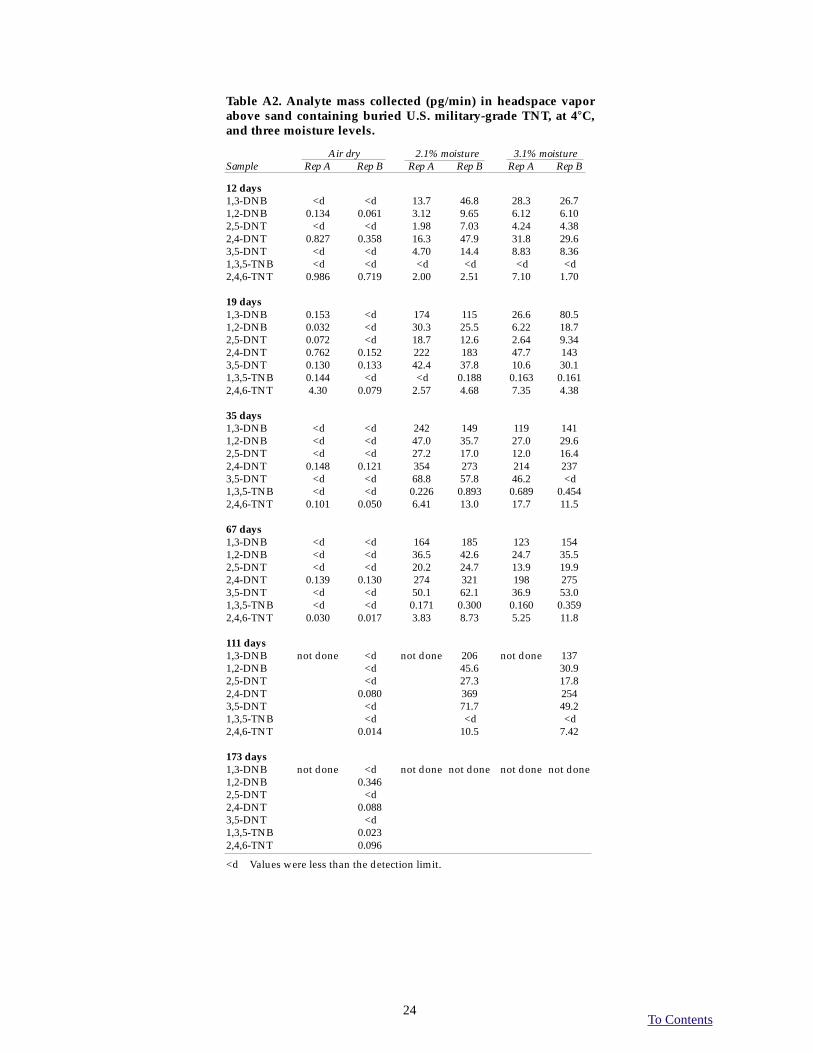
To Contents24
Table A2. Analyte mass collected (pg/min) in headspace vaporabove sand containing buried U.S. military-grade TNT, at 4°C,and three moisture levels.
Air dry 2.1% moisture 3.1% moistureSample Rep A Rep B Rep A Rep B Rep A Rep B
12 days1,3-DNB <d <d 13.7 46.8 28.3 26.71,2-DNB 0.134 0.061 3.12 9.65 6.12 6.102,5-DNT <d <d 1.98 7.03 4.24 4.382,4-DNT 0.827 0.358 16.3 47.9 31.8 29.63,5-DNT <d <d 4.70 14.4 8.83 8.361,3,5-TNB <d <d <d <d <d <d2,4,6-TNT 0.986 0.719 2.00 2.51 7.10 1.70
19 days1,3-DNB 0.153 <d 174 115 26.6 80.51,2-DNB 0.032 <d 30.3 25.5 6.22 18.72,5-DNT 0.072 <d 18.7 12.6 2.64 9.342,4-DNT 0.762 0.152 222 183 47.7 1433,5-DNT 0.130 0.133 42.4 37.8 10.6 30.11,3,5-TNB 0.144 <d <d 0.188 0.163 0.1612,4,6-TNT 4.30 0.079 2.57 4.68 7.35 4.38
35 days1,3-DNB <d <d 242 149 119 1411,2-DNB <d <d 47.0 35.7 27.0 29.62,5-DNT <d <d 27.2 17.0 12.0 16.42,4-DNT 0.148 0.121 354 273 214 2373,5-DNT <d <d 68.8 57.8 46.2 <d1,3,5-TNB <d <d 0.226 0.893 0.689 0.4542,4,6-TNT 0.101 0.050 6.41 13.0 17.7 11.5
67 days1,3-DNB <d <d 164 185 123 1541,2-DNB <d <d 36.5 42.6 24.7 35.52,5-DNT <d <d 20.2 24.7 13.9 19.92,4-DNT 0.139 0.130 274 321 198 2753,5-DNT <d <d 50.1 62.1 36.9 53.01,3,5-TNB <d <d 0.171 0.300 0.160 0.3592,4,6-TNT 0.030 0.017 3.83 8.73 5.25 11.8
111 days1,3-DNB not done <d not done 206 not done 1371,2-DNB <d 45.6 30.92,5-DNT <d 27.3 17.82,4-DNT 0.080 369 2543,5-DNT <d 71.7 49.21,3,5-TNB <d <d <d2,4,6-TNT 0.014 10.5 7.42
173 days1,3-DNB not done <d not done not done not done not done1,2-DNB 0.3462,5-DNT <d2,4-DNT 0.0883,5-DNT <d1,3,5-TNB 0.0232,4,6-TNT 0.096
<d Values were less than the detection limit.
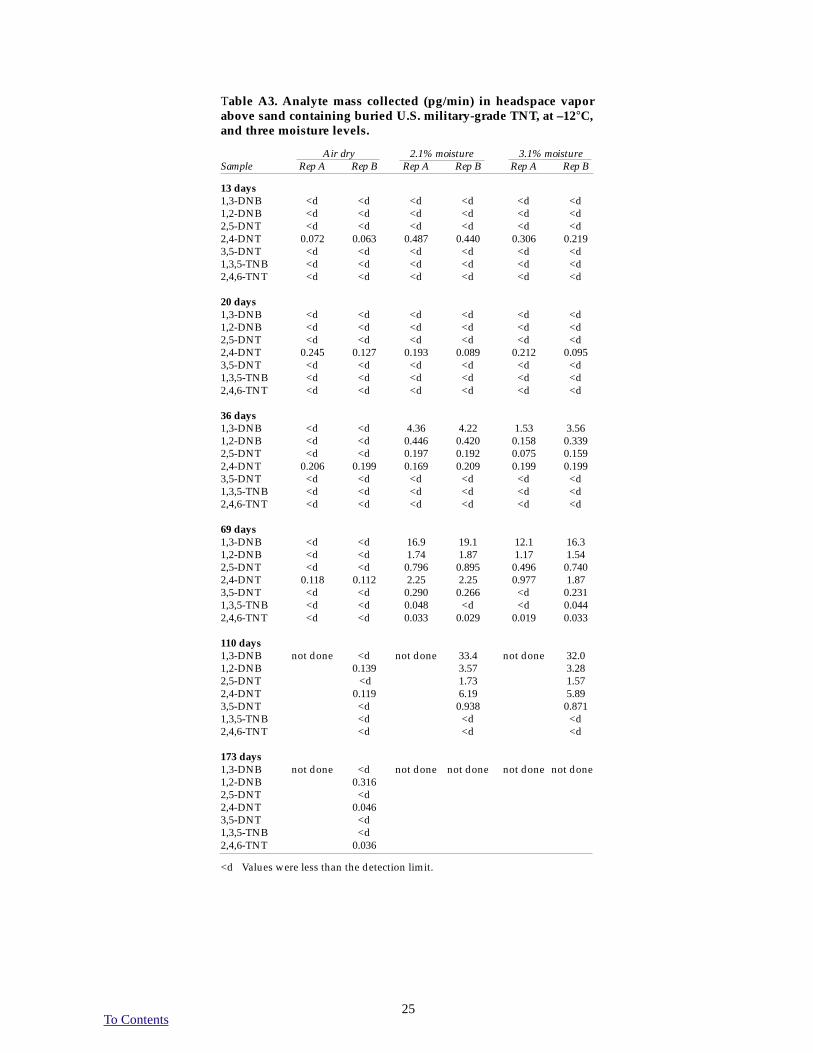
To Contents25
Table A3. Analyte mass collected (pg/min) in headspace vaporabove sand containing buried U.S. military-grade TNT, at –12°C,and three moisture levels.
Air dry 2.1% moisture 3.1% moistureSample Rep A Rep B Rep A Rep B Rep A Rep B
13 days1,3-DNB <d <d <d <d <d <d1,2-DNB <d <d <d <d <d <d2,5-DNT <d <d <d <d <d <d2,4-DNT 0.072 0.063 0.487 0.440 0.306 0.2193,5-DNT <d <d <d <d <d <d1,3,5-TNB <d <d <d <d <d <d2,4,6-TNT <d <d <d <d <d <d
20 days1,3-DNB <d <d <d <d <d <d1,2-DNB <d <d <d <d <d <d2,5-DNT <d <d <d <d <d <d2,4-DNT 0.245 0.127 0.193 0.089 0.212 0.0953,5-DNT <d <d <d <d <d <d1,3,5-TNB <d <d <d <d <d <d2,4,6-TNT <d <d <d <d <d <d
36 days1,3-DNB <d <d 4.36 4.22 1.53 3.561,2-DNB <d <d 0.446 0.420 0.158 0.3392,5-DNT <d <d 0.197 0.192 0.075 0.1592,4-DNT 0.206 0.199 0.169 0.209 0.199 0.1993,5-DNT <d <d <d <d <d <d1,3,5-TNB <d <d <d <d <d <d2,4,6-TNT <d <d <d <d <d <d
69 days1,3-DNB <d <d 16.9 19.1 12.1 16.31,2-DNB <d <d 1.74 1.87 1.17 1.542,5-DNT <d <d 0.796 0.895 0.496 0.7402,4-DNT 0.118 0.112 2.25 2.25 0.977 1.873,5-DNT <d <d 0.290 0.266 <d 0.2311,3,5-TNB <d <d 0.048 <d <d 0.0442,4,6-TNT <d <d 0.033 0.029 0.019 0.033
110 days1,3-DNB not done <d not done 33.4 not done 32.01,2-DNB 0.139 3.57 3.282,5-DNT <d 1.73 1.572,4-DNT 0.119 6.19 5.893,5-DNT <d 0.938 0.8711,3,5-TNB <d <d <d2,4,6-TNT <d <d <d
173 days1,3-DNB not done <d not done not done not done not done1,2-DNB 0.3162,5-DNT <d2,4-DNT 0.0463,5-DNT <d1,3,5-TNB <d2,4,6-TNT 0.036
<d Values were less than the detection limit.
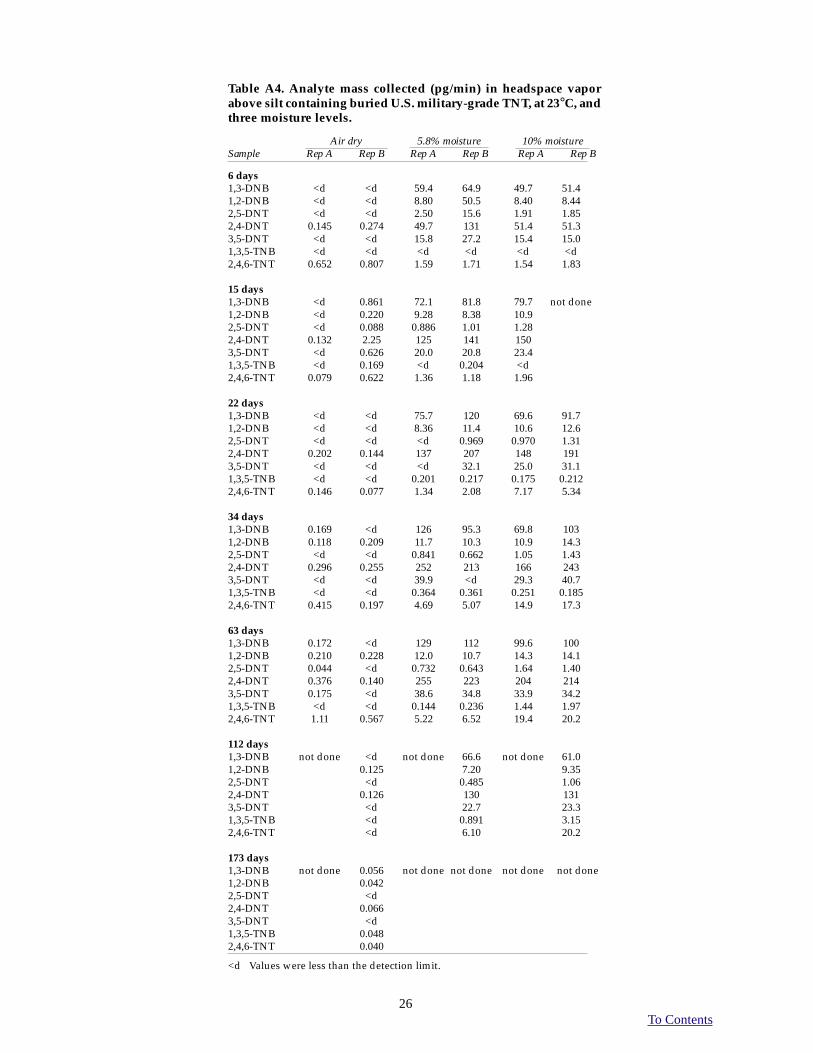
To Contents26
Table A4. Analyte mass collected (pg/min) in headspace vaporabove silt containing buried U.S. military-grade TNT, at 23°C, andthree moisture levels.
Air dry 5.8% moisture 10% moistureSample Rep A Rep B Rep A Rep B Rep A Rep B
6 days1,3-DNB <d <d 59.4 64.9 49.7 51.41,2-DNB <d <d 8.80 50.5 8.40 8.442,5-DNT <d <d 2.50 15.6 1.91 1.852,4-DNT 0.145 0.274 49.7 131 51.4 51.33,5-DNT <d <d 15.8 27.2 15.4 15.01,3,5-TNB <d <d <d <d <d <d2,4,6-TNT 0.652 0.807 1.59 1.71 1.54 1.83
15 days1,3-DNB <d 0.861 72.1 81.8 79.7 not done1,2-DNB <d 0.220 9.28 8.38 10.92,5-DNT <d 0.088 0.886 1.01 1.282,4-DNT 0.132 2.25 125 141 1503,5-DNT <d 0.626 20.0 20.8 23.41,3,5-TNB <d 0.169 <d 0.204 <d2,4,6-TNT 0.079 0.622 1.36 1.18 1.96
22 days1,3-DNB <d <d 75.7 120 69.6 91.71,2-DNB <d <d 8.36 11.4 10.6 12.62,5-DNT <d <d <d 0.969 0.970 1.312,4-DNT 0.202 0.144 137 207 148 1913,5-DNT <d <d <d 32.1 25.0 31.11,3,5-TNB <d <d 0.201 0.217 0.175 0.2122,4,6-TNT 0.146 0.077 1.34 2.08 7.17 5.34
34 days1,3-DNB 0.169 <d 126 95.3 69.8 1031,2-DNB 0.118 0.209 11.7 10.3 10.9 14.32,5-DNT <d <d 0.841 0.662 1.05 1.432,4-DNT 0.296 0.255 252 213 166 2433,5-DNT <d <d 39.9 <d 29.3 40.71,3,5-TNB <d <d 0.364 0.361 0.251 0.1852,4,6-TNT 0.415 0.197 4.69 5.07 14.9 17.3
63 days1,3-DNB 0.172 <d 129 112 99.6 1001,2-DNB 0.210 0.228 12.0 10.7 14.3 14.12,5-DNT 0.044 <d 0.732 0.643 1.64 1.402,4-DNT 0.376 0.140 255 223 204 2143,5-DNT 0.175 <d 38.6 34.8 33.9 34.21,3,5-TNB <d <d 0.144 0.236 1.44 1.972,4,6-TNT 1.11 0.567 5.22 6.52 19.4 20.2
112 days1,3-DNB not done <d not done 66.6 not done 61.01,2-DNB 0.125 7.20 9.352,5-DNT <d 0.485 1.062,4-DNT 0.126 130 1313,5-DNT <d 22.7 23.31,3,5-TNB <d 0.891 3.152,4,6-TNT <d 6.10 20.2
173 days1,3-DNB not done 0.056 not done not done not done not done1,2-DNB 0.0422,5-DNT <d2,4-DNT 0.0663,5-DNT <d1,3,5-TNB 0.0482,4,6-TNT 0.040
<d Values were less than the detection limit.
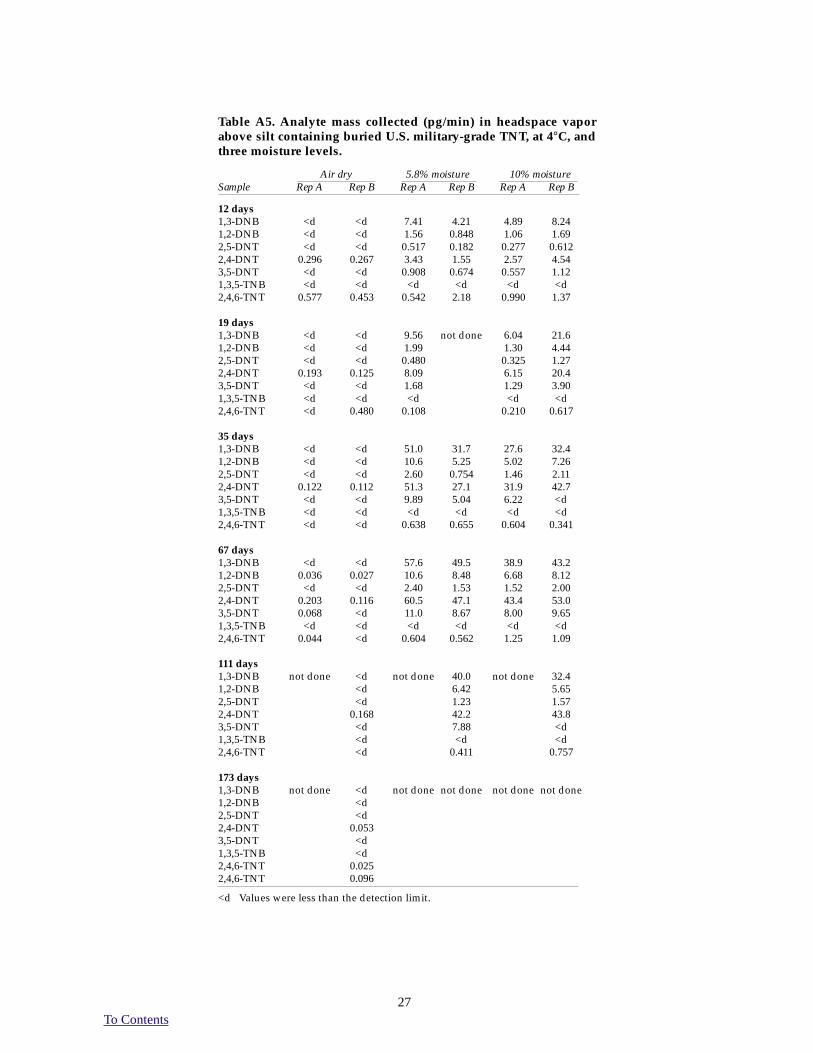
To Contents27
Table A5. Analyte mass collected (pg/min) in headspace vaporabove silt containing buried U.S. military-grade TNT, at 4°C, andthree moisture levels.
Air dry 5.8% moisture 10% moistureSample Rep A Rep B Rep A Rep B Rep A Rep B
12 days1,3-DNB <d <d 7.41 4.21 4.89 8.241,2-DNB <d <d 1.56 0.848 1.06 1.692,5-DNT <d <d 0.517 0.182 0.277 0.6122,4-DNT 0.296 0.267 3.43 1.55 2.57 4.543,5-DNT <d <d 0.908 0.674 0.557 1.121,3,5-TNB <d <d <d <d <d <d2,4,6-TNT 0.577 0.453 0.542 2.18 0.990 1.37
19 days1,3-DNB <d <d 9.56 not done 6.04 21.61,2-DNB <d <d 1.99 1.30 4.442,5-DNT <d <d 0.480 0.325 1.272,4-DNT 0.193 0.125 8.09 6.15 20.43,5-DNT <d <d 1.68 1.29 3.901,3,5-TNB <d <d <d <d <d2,4,6-TNT <d 0.480 0.108 0.210 0.617
35 days1,3-DNB <d <d 51.0 31.7 27.6 32.41,2-DNB <d <d 10.6 5.25 5.02 7.262,5-DNT <d <d 2.60 0.754 1.46 2.112,4-DNT 0.122 0.112 51.3 27.1 31.9 42.73,5-DNT <d <d 9.89 5.04 6.22 <d1,3,5-TNB <d <d <d <d <d <d2,4,6-TNT <d <d 0.638 0.655 0.604 0.341
67 days1,3-DNB <d <d 57.6 49.5 38.9 43.21,2-DNB 0.036 0.027 10.6 8.48 6.68 8.122,5-DNT <d <d 2.40 1.53 1.52 2.002,4-DNT 0.203 0.116 60.5 47.1 43.4 53.03,5-DNT 0.068 <d 11.0 8.67 8.00 9.651,3,5-TNB <d <d <d <d <d <d2,4,6-TNT 0.044 <d 0.604 0.562 1.25 1.09
111 days1,3-DNB not done <d not done 40.0 not done 32.41,2-DNB <d 6.42 5.652,5-DNT <d 1.23 1.572,4-DNT 0.168 42.2 43.83,5-DNT <d 7.88 <d1,3,5-TNB <d <d <d2,4,6-TNT <d 0.411 0.757
173 days1,3-DNB not done <d not done not done not done not done1,2-DNB <d2,5-DNT <d2,4-DNT 0.0533,5-DNT <d1,3,5-TNB <d2,4,6-TNT 0.0252,4,6-TNT 0.096
<d Values were less than the detection limit.
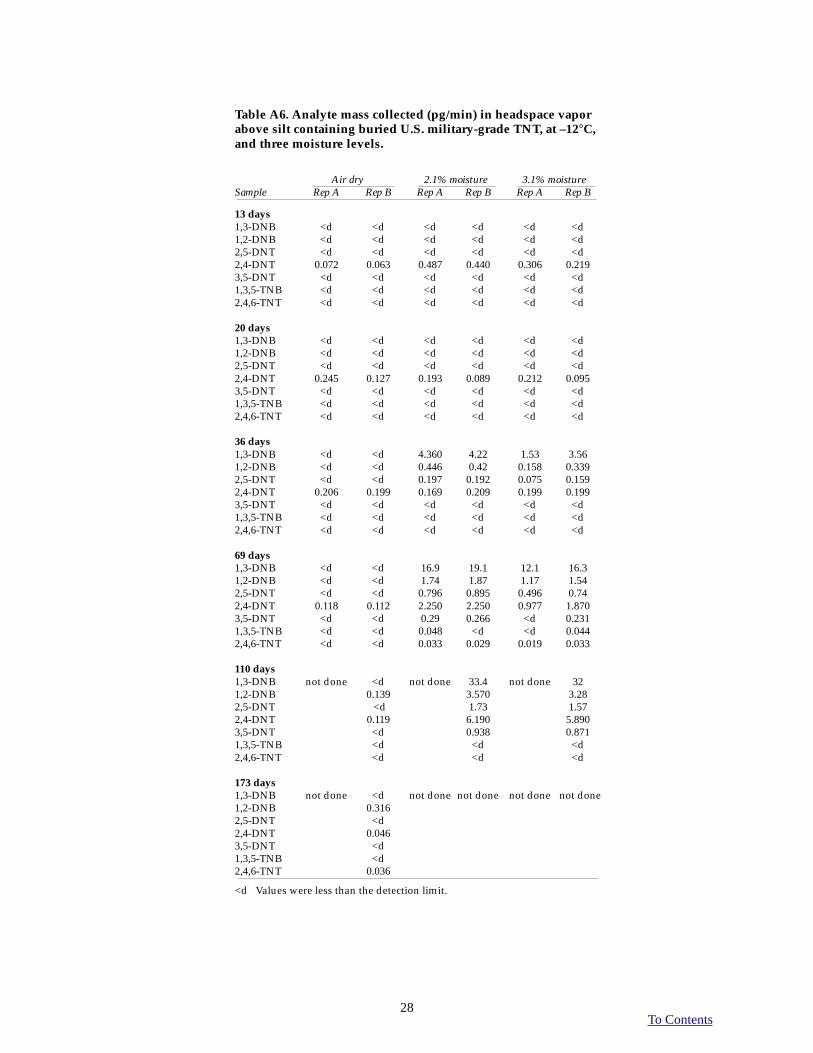
To Contents
Table A6. Analyte mass collected (pg/min) in headspace vaporabove silt containing buried U.S. military-grade TNT, at –12°C,and three moisture levels.
Air dry 2.1% moisture 3.1% moistureSample Rep A Rep B Rep A Rep B Rep A Rep B
13 days1,3-DNB <d <d <d <d <d <d1,2-DNB <d <d <d <d <d <d2,5-DNT <d <d <d <d <d <d2,4-DNT 0.072 0.063 0.487 0.440 0.306 0.2193,5-DNT <d <d <d <d <d <d1,3,5-TNB <d <d <d <d <d <d2,4,6-TNT <d <d <d <d <d <d
20 days1,3-DNB <d <d <d <d <d <d1,2-DNB <d <d <d <d <d <d2,5-DNT <d <d <d <d <d <d2,4-DNT 0.245 0.127 0.193 0.089 0.212 0.0953,5-DNT <d <d <d <d <d <d1,3,5-TNB <d <d <d <d <d <d2,4,6-TNT <d <d <d <d <d <d
36 days1,3-DNB <d <d 4.360 4.22 1.53 3.561,2-DNB <d <d 0.446 0.42 0.158 0.3392,5-DNT <d <d 0.197 0.192 0.075 0.1592,4-DNT 0.206 0.199 0.169 0.209 0.199 0.1993,5-DNT <d <d <d <d <d <d1,3,5-TNB <d <d <d <d <d <d2,4,6-TNT <d <d <d <d <d <d
69 days1,3-DNB <d <d 16.9 19.1 12.1 16.31,2-DNB <d <d 1.74 1.87 1.17 1.542,5-DNT <d <d 0.796 0.895 0.496 0.742,4-DNT 0.118 0.112 2.250 2.250 0.977 1.8703,5-DNT <d <d 0.29 0.266 <d 0.2311,3,5-TNB <d <d 0.048 <d <d 0.0442,4,6-TNT <d <d 0.033 0.029 0.019 0.033
110 days1,3-DNB not done <d not done 33.4 not done 321,2-DNB 0.139 3.570 3.282,5-DNT <d 1.73 1.572,4-DNT 0.119 6.190 5.8903,5-DNT <d 0.938 0.8711,3,5-TNB <d <d <d2,4,6-TNT <d <d <d
173 days1,3-DNB not done <d not done not done not done not done1,2-DNB 0.3162,5-DNT <d2,4-DNT 0.0463,5-DNT <d1,3,5-TNB <d2,4,6-TNT 0.036
<d Values were less than the detection limit.
28
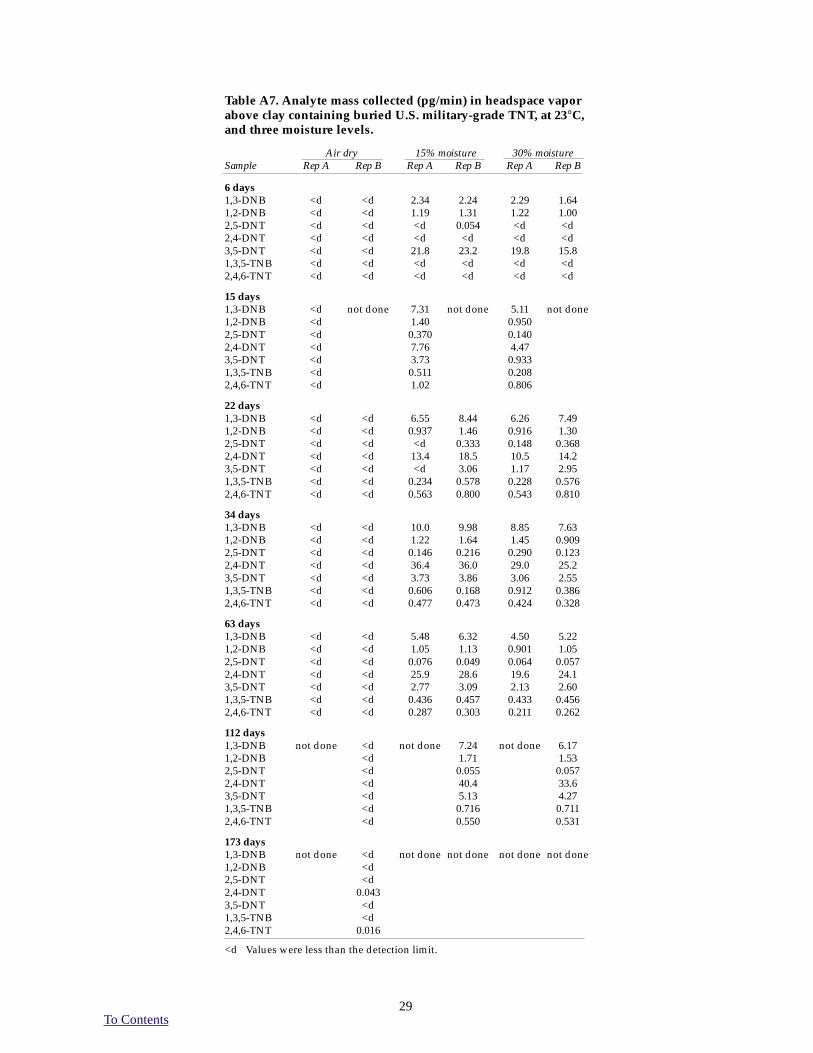
To Contents
Table A7. Analyte mass collected (pg/min) in headspace vaporabove clay containing buried U.S. military-grade TNT, at 23°C,and three moisture levels.
Air dry 15% moisture 30% moistureSample Rep A Rep B Rep A Rep B Rep A Rep B
6 days1,3-DNB <d <d 2.34 2.24 2.29 1.641,2-DNB <d <d 1.19 1.31 1.22 1.002,5-DNT <d <d <d 0.054 <d <d2,4-DNT <d <d <d <d <d <d3,5-DNT <d <d 21.8 23.2 19.8 15.81,3,5-TNB <d <d <d <d <d <d2,4,6-TNT <d <d <d <d <d <d
15 days1,3-DNB <d not done 7.31 not done 5.11 not done1,2-DNB <d 1.40 0.9502,5-DNT <d 0.370 0.1402,4-DNT <d 7.76 4.473,5-DNT <d 3.73 0.9331,3,5-TNB <d 0.511 0.2082,4,6-TNT <d 1.02 0.806
22 days1,3-DNB <d <d 6.55 8.44 6.26 7.491,2-DNB <d <d 0.937 1.46 0.916 1.302,5-DNT <d <d <d 0.333 0.148 0.3682,4-DNT <d <d 13.4 18.5 10.5 14.23,5-DNT <d <d <d 3.06 1.17 2.951,3,5-TNB <d <d 0.234 0.578 0.228 0.5762,4,6-TNT <d <d 0.563 0.800 0.543 0.810
34 days1,3-DNB <d <d 10.0 9.98 8.85 7.631,2-DNB <d <d 1.22 1.64 1.45 0.9092,5-DNT <d <d 0.146 0.216 0.290 0.1232,4-DNT <d <d 36.4 36.0 29.0 25.23,5-DNT <d <d 3.73 3.86 3.06 2.551,3,5-TNB <d <d 0.606 0.168 0.912 0.3862,4,6-TNT <d <d 0.477 0.473 0.424 0.328
63 days1,3-DNB <d <d 5.48 6.32 4.50 5.221,2-DNB <d <d 1.05 1.13 0.901 1.052,5-DNT <d <d 0.076 0.049 0.064 0.0572,4-DNT <d <d 25.9 28.6 19.6 24.13,5-DNT <d <d 2.77 3.09 2.13 2.601,3,5-TNB <d <d 0.436 0.457 0.433 0.4562,4,6-TNT <d <d 0.287 0.303 0.211 0.262
112 days1,3-DNB not done <d not done 7.24 not done 6.171,2-DNB <d 1.71 1.532,5-DNT <d 0.055 0.0572,4-DNT <d 40.4 33.63,5-DNT <d 5.13 4.271,3,5-TNB <d 0.716 0.7112,4,6-TNT <d 0.550 0.531
173 days1,3-DNB not done <d not done not done not done not done1,2-DNB <d2,5-DNT <d2,4-DNT 0.0433,5-DNT <d1,3,5-TNB <d2,4,6-TNT 0.016
<d Values were less than the detection limit.
29
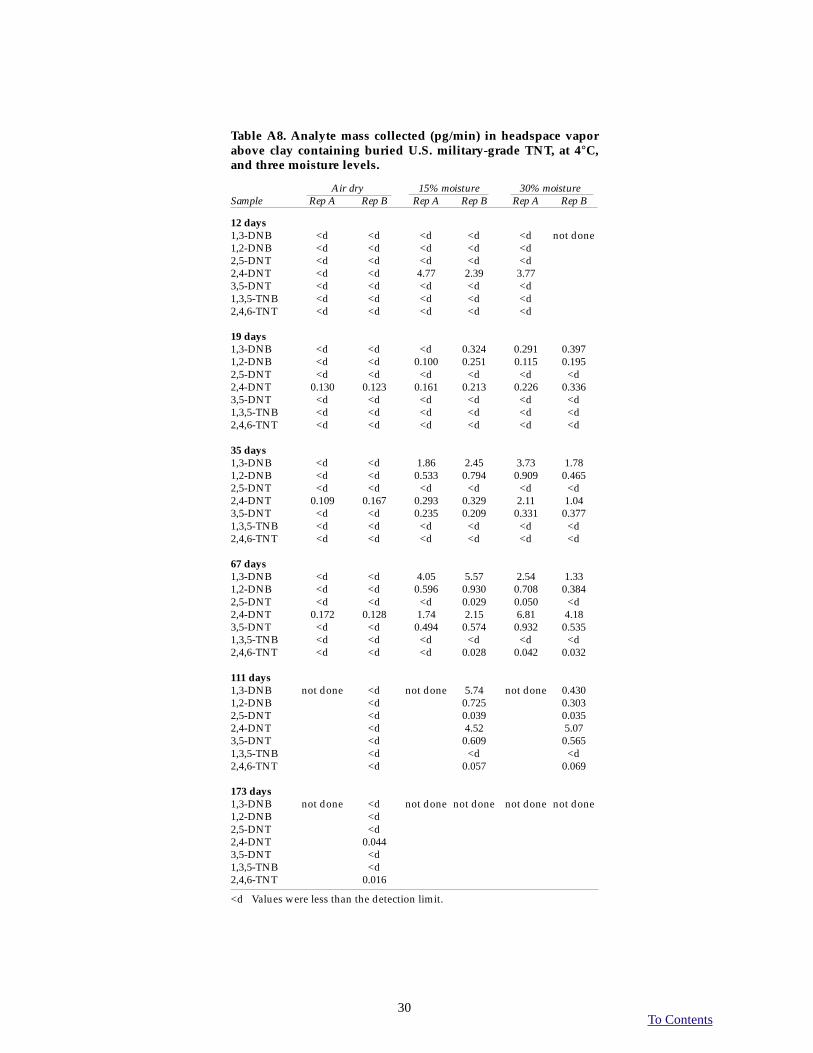
To Contents
Table A8. Analyte mass collected (pg/min) in headspace vaporabove clay containing buried U.S. military-grade TNT, at 4°C,and three moisture levels.
Air dry 15% moisture 30% moistureSample Rep A Rep B Rep A Rep B Rep A Rep B
12 days1,3-DNB <d <d <d <d <d not done1,2-DNB <d <d <d <d <d2,5-DNT <d <d <d <d <d2,4-DNT <d <d 4.77 2.39 3.773,5-DNT <d <d <d <d <d1,3,5-TNB <d <d <d <d <d2,4,6-TNT <d <d <d <d <d
19 days1,3-DNB <d <d <d 0.324 0.291 0.3971,2-DNB <d <d 0.100 0.251 0.115 0.1952,5-DNT <d <d <d <d <d <d2,4-DNT 0.130 0.123 0.161 0.213 0.226 0.3363,5-DNT <d <d <d <d <d <d1,3,5-TNB <d <d <d <d <d <d2,4,6-TNT <d <d <d <d <d <d
35 days1,3-DNB <d <d 1.86 2.45 3.73 1.781,2-DNB <d <d 0.533 0.794 0.909 0.4652,5-DNT <d <d <d <d <d <d2,4-DNT 0.109 0.167 0.293 0.329 2.11 1.043,5-DNT <d <d 0.235 0.209 0.331 0.3771,3,5-TNB <d <d <d <d <d <d2,4,6-TNT <d <d <d <d <d <d
67 days1,3-DNB <d <d 4.05 5.57 2.54 1.331,2-DNB <d <d 0.596 0.930 0.708 0.3842,5-DNT <d <d <d 0.029 0.050 <d2,4-DNT 0.172 0.128 1.74 2.15 6.81 4.183,5-DNT <d <d 0.494 0.574 0.932 0.5351,3,5-TNB <d <d <d <d <d <d2,4,6-TNT <d <d <d 0.028 0.042 0.032
111 days1,3-DNB not done <d not done 5.74 not done 0.4301,2-DNB <d 0.725 0.3032,5-DNT <d 0.039 0.0352,4-DNT <d 4.52 5.073,5-DNT <d 0.609 0.5651,3,5-TNB <d <d <d2,4,6-TNT <d 0.057 0.069
173 days1,3-DNB not done <d not done not done not done not done1,2-DNB <d2,5-DNT <d2,4-DNT 0.0443,5-DNT <d1,3,5-TNB <d2,4,6-TNT 0.016
<d Values were less than the detection limit.
30

To Contents
Table A9. Analyte mass (pg/min) collected in headspace vaporabove clay containing buried U.S. military-grade TNT, at –12°C,and three moisture levels.
Air dry 15% moisture 30% moistureSample Rep A Rep B Rep A Rep B Rep A Rep B
13 days1,3-DNB <d <d <d <d <d <d1,2-DNB <d <d <d <d <d <d2,5-DNT <d <d <d <d <d <d2,4-DNT <d <d <d <d <d <d3,5-DNT <d <d <d <d <d <d1,3,5-TNB <d <d <d <d <d <d2,4,6-TNT <d <d <d <d <d <d
20 days1,3-DNB <d <d <d <d <d <d1,2-DNB <d <d <d <d <d <d2,5-DNT <d <d <d <d <d <d2,4-DNT <d <d <d <d <d <d3,5-DNT <d <d <d <d <d <d1,3,5-TNB <d <d <d <d <d <d2,4,6-TNT <d <d <d <d <d <d
36 days1,3-DNB <d <d <d <d <d <d1,2-DNB <d <d <d <d <d <d2,5-DNT <d <d <d <d <d <d2,4-DNT <d <d <d <d <d <d3,5-DNT <d <d <d <d <d <d1,3,5-TNB <d <d <d <d <d <d2,4,6-TNT <d <d <d <d <d <d
69 days1,3-DNB <d <d <d <d <d <d1,2-DNB <d <d <d <d <d <d2,5-DNT <d <d <d <d <d <d2,4-DNT <d <d <d <d <d <d3,5-DNT <d <d <d <d <d <d1,3,5-TNB <d <d <d <d <d <d2,4,6-TNT <d <d <d <d <d <d
110 days1,3-DNB not done <d not done <d not done <d1,2-DNB <d <d <d2,5-DNT <d <d <d2,4-DNT <d <d <d3,5-DNT <d <d <d1,3,5-TNB <d <d <d2,4,6-TNT <d <d <d
173 days1,3-DNB not done <d not done <d not done 0.0721,2-DNB <d <d 0.0212,5-DNT <d <d <d2,4-DNT 0.043 0.116 0.0943,5-DNT <d <d <d1,3,5-TNB <d 0.026 0.0362,4,6-TNT 0.011 0.245 0.107
<d Values were less than the detection limit.
31
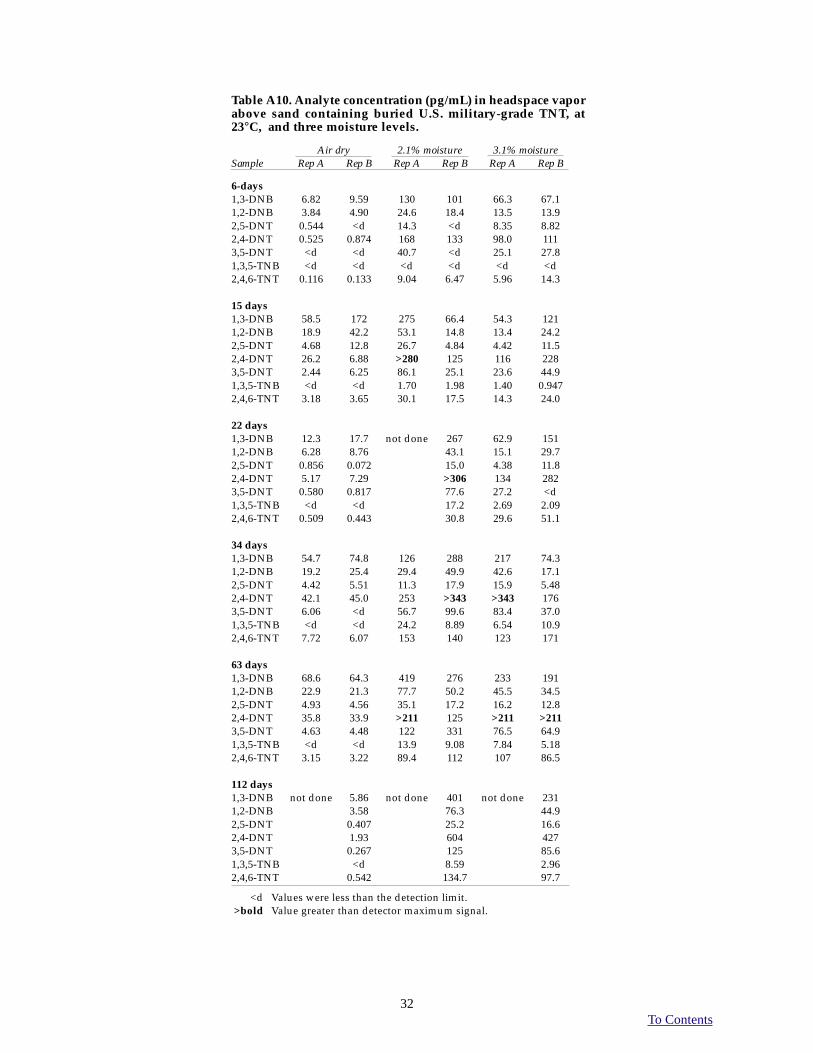
To Contents
Table A10. Analyte concentration (pg/mL) in headspace vaporabove sand containing buried U.S. military-grade TNT, at23°C, and three moisture levels.
Air dry 2.1% moisture 3.1% moistureSample Rep A Rep B Rep A Rep B Rep A Rep B
6-days1,3-DNB 6.82 9.59 130 101 66.3 67.11,2-DNB 3.84 4.90 24.6 18.4 13.5 13.92,5-DNT 0.544 <d 14.3 <d 8.35 8.822,4-DNT 0.525 0.874 168 133 98.0 1113,5-DNT <d <d 40.7 <d 25.1 27.81,3,5-TNB <d <d <d <d <d <d2,4,6-TNT 0.116 0.133 9.04 6.47 5.96 14.3
15 days1,3-DNB 58.5 172 275 66.4 54.3 1211,2-DNB 18.9 42.2 53.1 14.8 13.4 24.22,5-DNT 4.68 12.8 26.7 4.84 4.42 11.52,4-DNT 26.2 6.88 >280 125 116 2283,5-DNT 2.44 6.25 86.1 25.1 23.6 44.91,3,5-TNB <d <d 1.70 1.98 1.40 0.9472,4,6-TNT 3.18 3.65 30.1 17.5 14.3 24.0
22 days1,3-DNB 12.3 17.7 not done 267 62.9 1511,2-DNB 6.28 8.76 43.1 15.1 29.72,5-DNT 0.856 0.072 15.0 4.38 11.82,4-DNT 5.17 7.29 >306 134 2823,5-DNT 0.580 0.817 77.6 27.2 <d1,3,5-TNB <d <d 17.2 2.69 2.092,4,6-TNT 0.509 0.443 30.8 29.6 51.1
34 days1,3-DNB 54.7 74.8 126 288 217 74.31,2-DNB 19.2 25.4 29.4 49.9 42.6 17.12,5-DNT 4.42 5.51 11.3 17.9 15.9 5.482,4-DNT 42.1 45.0 253 >343 >343 1763,5-DNT 6.06 <d 56.7 99.6 83.4 37.01,3,5-TNB <d <d 24.2 8.89 6.54 10.92,4,6-TNT 7.72 6.07 153 140 123 171
63 days1,3-DNB 68.6 64.3 419 276 233 1911,2-DNB 22.9 21.3 77.7 50.2 45.5 34.52,5-DNT 4.93 4.56 35.1 17.2 16.2 12.82,4-DNT 35.8 33.9 >211 125 >211 >2113,5-DNT 4.63 4.48 122 331 76.5 64.91,3,5-TNB <d <d 13.9 9.08 7.84 5.182,4,6-TNT 3.15 3.22 89.4 112 107 86.5
112 days1,3-DNB not done 5.86 not done 401 not done 2311,2-DNB 3.58 76.3 44.92,5-DNT 0.407 25.2 16.62,4-DNT 1.93 604 4273,5-DNT 0.267 125 85.61,3,5-TNB <d 8.59 2.962,4,6-TNT 0.542 134.7 97.7
<d Values were less than the detection limit.>bold Value greater than detector maximum signal.
32
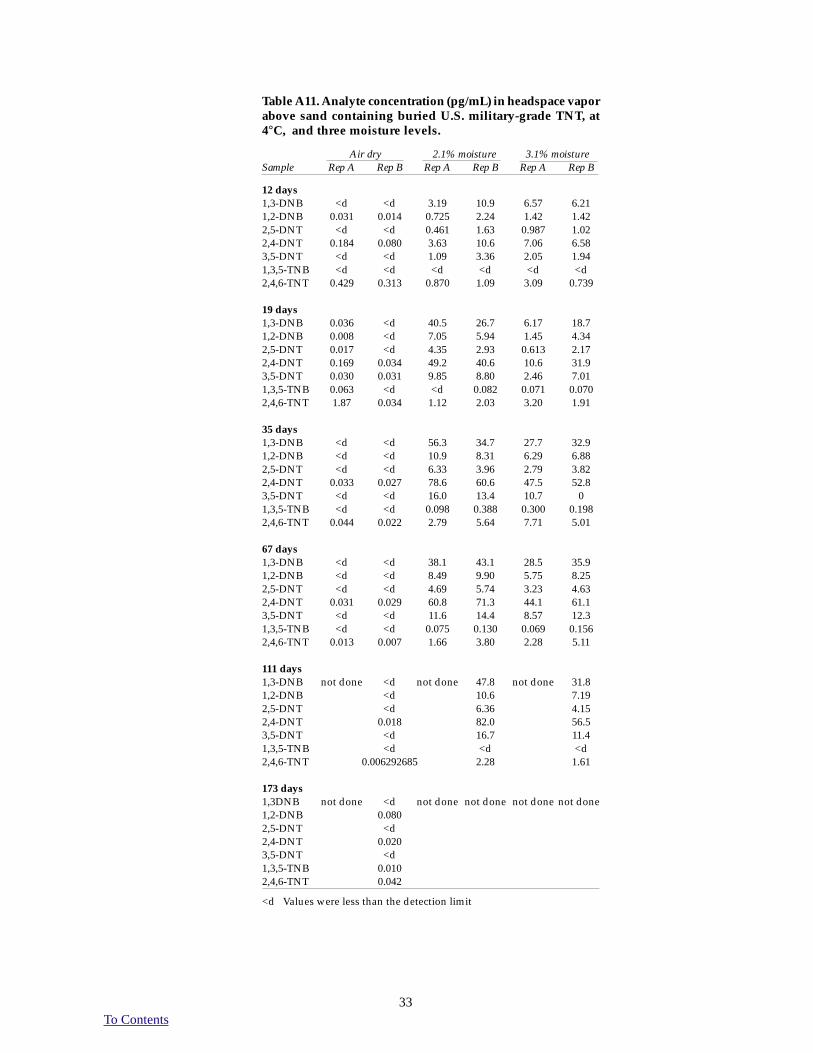
To Contents
Table A11. Analyte concentration (pg/mL) in headspace vaporabove sand containing buried U.S. military-grade TNT, at4°C, and three moisture levels.
Air dry 2.1% moisture 3.1% moistureSample Rep A Rep B Rep A Rep B Rep A Rep B
12 days1,3-DNB <d <d 3.19 10.9 6.57 6.211,2-DNB 0.031 0.014 0.725 2.24 1.42 1.422,5-DNT <d <d 0.461 1.63 0.987 1.022,4-DNT 0.184 0.080 3.63 10.6 7.06 6.583,5-DNT <d <d 1.09 3.36 2.05 1.941,3,5-TNB <d <d <d <d <d <d2,4,6-TNT 0.429 0.313 0.870 1.09 3.09 0.739
19 days1,3-DNB 0.036 <d 40.5 26.7 6.17 18.71,2-DNB 0.008 <d 7.05 5.94 1.45 4.342,5-DNT 0.017 <d 4.35 2.93 0.613 2.172,4-DNT 0.169 0.034 49.2 40.6 10.6 31.93,5-DNT 0.030 0.031 9.85 8.80 2.46 7.011,3,5-TNB 0.063 <d <d 0.082 0.071 0.0702,4,6-TNT 1.87 0.034 1.12 2.03 3.20 1.91
35 days1,3-DNB <d <d 56.3 34.7 27.7 32.91,2-DNB <d <d 10.9 8.31 6.29 6.882,5-DNT <d <d 6.33 3.96 2.79 3.822,4-DNT 0.033 0.027 78.6 60.6 47.5 52.83,5-DNT <d <d 16.0 13.4 10.7 01,3,5-TNB <d <d 0.098 0.388 0.300 0.1982,4,6-TNT 0.044 0.022 2.79 5.64 7.71 5.01
67 days1,3-DNB <d <d 38.1 43.1 28.5 35.91,2-DNB <d <d 8.49 9.90 5.75 8.252,5-DNT <d <d 4.69 5.74 3.23 4.632,4-DNT 0.031 0.029 60.8 71.3 44.1 61.13,5-DNT <d <d 11.6 14.4 8.57 12.31,3,5-TNB <d <d 0.075 0.130 0.069 0.1562,4,6-TNT 0.013 0.007 1.66 3.80 2.28 5.11
111 days1,3-DNB not done <d not done 47.8 not done 31.81,2-DNB <d 10.6 7.192,5-DNT <d 6.36 4.152,4-DNT 0.018 82.0 56.53,5-DNT <d 16.7 11.41,3,5-TNB <d <d <d2,4,6-TNT 0.006292685 2.28 1.61
173 days1,3DNB not done <d not done not done not done not done1,2-DNB 0.0802,5-DNT <d2,4-DNT 0.0203,5-DNT <d1,3,5-TNB 0.0102,4,6-TNT 0.042
<d Values were less than the detection limit
33
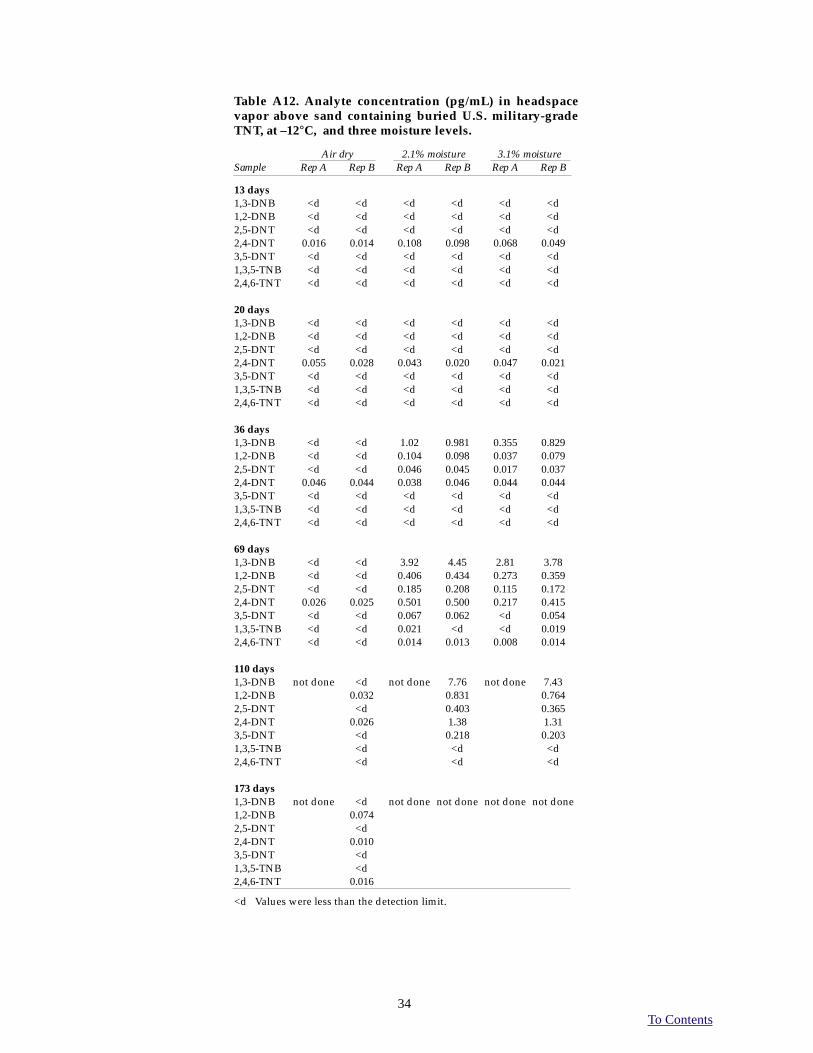
To Contents
Table A12. Analyte concentration (pg/mL) in headspacevapor above sand containing buried U.S. military-gradeTNT, at –12°C, and three moisture levels.
Air dry 2.1% moisture 3.1% moistureSample Rep A Rep B Rep A Rep B Rep A Rep B
13 days1,3-DNB <d <d <d <d <d <d1,2-DNB <d <d <d <d <d <d2,5-DNT <d <d <d <d <d <d2,4-DNT 0.016 0.014 0.108 0.098 0.068 0.0493,5-DNT <d <d <d <d <d <d1,3,5-TNB <d <d <d <d <d <d2,4,6-TNT <d <d <d <d <d <d
20 days1,3-DNB <d <d <d <d <d <d1,2-DNB <d <d <d <d <d <d2,5-DNT <d <d <d <d <d <d2,4-DNT 0.055 0.028 0.043 0.020 0.047 0.0213,5-DNT <d <d <d <d <d <d1,3,5-TNB <d <d <d <d <d <d2,4,6-TNT <d <d <d <d <d <d
36 days1,3-DNB <d <d 1.02 0.981 0.355 0.8291,2-DNB <d <d 0.104 0.098 0.037 0.0792,5-DNT <d <d 0.046 0.045 0.017 0.0372,4-DNT 0.046 0.044 0.038 0.046 0.044 0.0443,5-DNT <d <d <d <d <d <d1,3,5-TNB <d <d <d <d <d <d2,4,6-TNT <d <d <d <d <d <d
69 days1,3-DNB <d <d 3.92 4.45 2.81 3.781,2-DNB <d <d 0.406 0.434 0.273 0.3592,5-DNT <d <d 0.185 0.208 0.115 0.1722,4-DNT 0.026 0.025 0.501 0.500 0.217 0.4153,5-DNT <d <d 0.067 0.062 <d 0.0541,3,5-TNB <d <d 0.021 <d <d 0.0192,4,6-TNT <d <d 0.014 0.013 0.008 0.014
110 days1,3-DNB not done <d not done 7.76 not done 7.431,2-DNB 0.032 0.831 0.7642,5-DNT <d 0.403 0.3652,4-DNT 0.026 1.38 1.313,5-DNT <d 0.218 0.2031,3,5-TNB <d <d <d2,4,6-TNT <d <d <d
173 days1,3-DNB not done <d not done not done not done not done1,2-DNB 0.0742,5-DNT <d2,4-DNT 0.0103,5-DNT <d1,3,5-TNB <d2,4,6-TNT 0.016
<d Values were less than the detection limit.
34
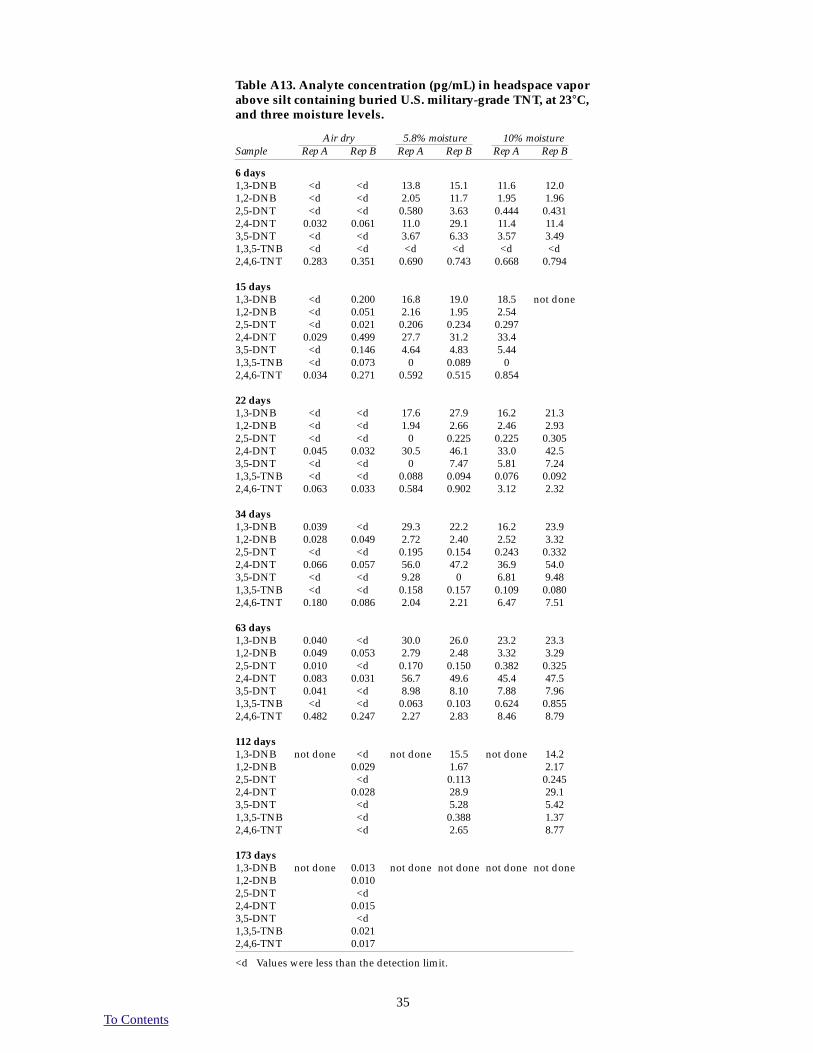
To Contents
Table A13. Analyte concentration (pg/mL) in headspace vaporabove silt containing buried U.S. military-grade TNT, at 23°C,and three moisture levels.
Air dry 5.8% moisture 10% moistureSample Rep A Rep B Rep A Rep B Rep A Rep B
6 days1,3-DNB <d <d 13.8 15.1 11.6 12.01,2-DNB <d <d 2.05 11.7 1.95 1.962,5-DNT <d <d 0.580 3.63 0.444 0.4312,4-DNT 0.032 0.061 11.0 29.1 11.4 11.43,5-DNT <d <d 3.67 6.33 3.57 3.491,3,5-TNB <d <d <d <d <d <d2,4,6-TNT 0.283 0.351 0.690 0.743 0.668 0.794
15 days1,3-DNB <d 0.200 16.8 19.0 18.5 not done1,2-DNB <d 0.051 2.16 1.95 2.542,5-DNT <d 0.021 0.206 0.234 0.2972,4-DNT 0.029 0.499 27.7 31.2 33.43,5-DNT <d 0.146 4.64 4.83 5.441,3,5-TNB <d 0.073 0 0.089 02,4,6-TNT 0.034 0.271 0.592 0.515 0.854
22 days1,3-DNB <d <d 17.6 27.9 16.2 21.31,2-DNB <d <d 1.94 2.66 2.46 2.932,5-DNT <d <d 0 0.225 0.225 0.3052,4-DNT 0.045 0.032 30.5 46.1 33.0 42.53,5-DNT <d <d 0 7.47 5.81 7.241,3,5-TNB <d <d 0.088 0.094 0.076 0.0922,4,6-TNT 0.063 0.033 0.584 0.902 3.12 2.32
34 days1,3-DNB 0.039 <d 29.3 22.2 16.2 23.91,2-DNB 0.028 0.049 2.72 2.40 2.52 3.322,5-DNT <d <d 0.195 0.154 0.243 0.3322,4-DNT 0.066 0.057 56.0 47.2 36.9 54.03,5-DNT <d <d 9.28 0 6.81 9.481,3,5-TNB <d <d 0.158 0.157 0.109 0.0802,4,6-TNT 0.180 0.086 2.04 2.21 6.47 7.51
63 days1,3-DNB 0.040 <d 30.0 26.0 23.2 23.31,2-DNB 0.049 0.053 2.79 2.48 3.32 3.292,5-DNT 0.010 <d 0.170 0.150 0.382 0.3252,4-DNT 0.083 0.031 56.7 49.6 45.4 47.53,5-DNT 0.041 <d 8.98 8.10 7.88 7.961,3,5-TNB <d <d 0.063 0.103 0.624 0.8552,4,6-TNT 0.482 0.247 2.27 2.83 8.46 8.79
112 days1,3-DNB not done <d not done 15.5 not done 14.21,2-DNB 0.029 1.67 2.172,5-DNT <d 0.113 0.2452,4-DNT 0.028 28.9 29.13,5-DNT <d 5.28 5.421,3,5-TNB <d 0.388 1.372,4,6-TNT <d 2.65 8.77
173 days1,3-DNB not done 0.013 not done not done not done not done1,2-DNB 0.0102,5-DNT <d2,4-DNT 0.0153,5-DNT <d1,3,5-TNB 0.0212,4,6-TNT 0.017
<d Values were less than the detection limit.
35

To Contents
Table A14. Analyte concentration (pg/mL) in headspace vaporabove silt containing buried U.S. military-grade TNT, at 4°C,and three moisture levels.
Air dry 5.8% moisture 10% moistureSample Rep A Rep B Rep A Rep B Rep A Rep B
12 days1,3-DNB <d <d 1.72 0.978 1.14 1.921,2-DNB <d <d 0.364 0.197 0.247 0.3932,5-DNT <d <d 0.120 0.042 0.064 0.1422,4-DNT 0.066 0.059 0.761 0.346 0.572 1.013,5-DNT <d <d 0.211 0.157 0.130 0.2601,3,5-TNB <d <d <d <d <d <d2,4,6-TNT 0.251 0.197 0.236 0.950 0.431 0.598
19 days1,3-DNB <d <d 2.22 not done 1.40 5.031,2-DNB <d <d 0.463 0.302 1.032,5-DNT <d <d 0.112 0.076 0.2962,4-DNT 0.043 0.028 1.80 1.37 4.533,5-DNT <d <d 0.390 0.299 0.9081,3,5-TNB <d <d <d <d <d2,4,6-TNT <d 0.209 0.047 0.091 0.268
35 days1,3-DNB <d <d 11.8 7.37 6.41 7.531,2-DNB <d <d 2.47 1.22 1.17 1.692,5-DNT <d <d 0.604 0.175 0.340 0.4912,4-DNT 0.027 0.025 11.4 6.02 7.09 9.483,5-DNT <d <d 2.30 1.17 1.45 <d1,3,5-TNB <d <d <d <d <d <d2,4,6-TNT <d <d 0.278 0.285 0.263 0.148
67 days1,3-DNB <d <d 13.4 11.5 9.05 10.01,2-DNB 0.008 0.006 2.47 1.97 1.55 1.892,5-DNT <d <d 0.559 0.356 0.353 0.4662,4-DNT 0.045 0.026 13.4 10.5 9.64 11.83,5-DNT 0.016 <d 2.57 2.02 1.86 2.251,3,5-TNB <d <d <d <d <d <d2,4,6-TNT 0.019 <d 0.263 0.244 0.543 0.474
111 days1,3-DNB not done <d not done 9.29 not done 7.531,2-DNB <d 1.49 1.312,5-DNT <d 0.287 0.3642,4-DNT 0.037 9.38 9.723,5-DNT <d 1.83 <d1,3,5-TNB <d <d <d2,4,6-TNT <d 0.179 0.329
173-days1,3-DNB not done <d not done not done not done not done1,2-DNB <d2,5-DNT <d2,4-DNT 0.0123,5-DNT <d1,3,5-TNB <d2,4,6-TNT 0.011
<d Values were less than the detection limit.
36
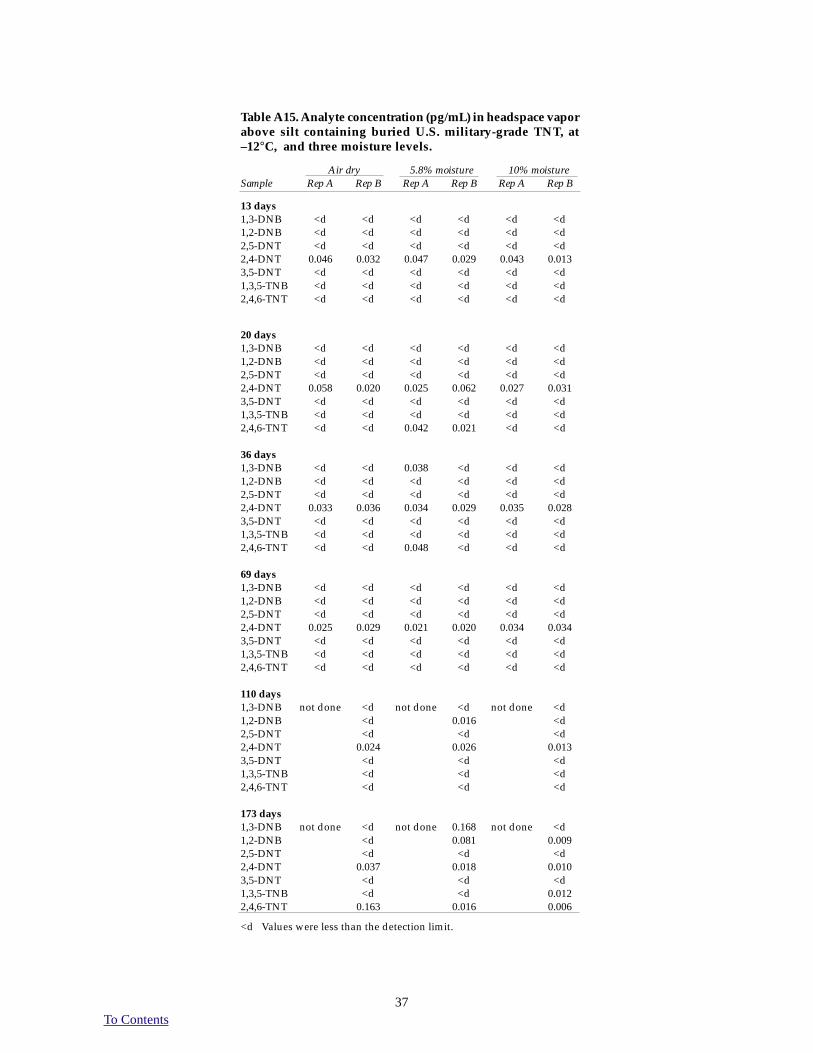
To Contents
Table A15. Analyte concentration (pg/mL) in headspace vaporabove silt containing buried U.S. military-grade TNT, at–12°C, and three moisture levels.
Air dry 5.8% moisture 10% moistureSample Rep A Rep B Rep A Rep B Rep A Rep B
13 days1,3-DNB <d <d <d <d <d <d1,2-DNB <d <d <d <d <d <d2,5-DNT <d <d <d <d <d <d2,4-DNT 0.046 0.032 0.047 0.029 0.043 0.0133,5-DNT <d <d <d <d <d <d1,3,5-TNB <d <d <d <d <d <d2,4,6-TNT <d <d <d <d <d <d
20 days1,3-DNB <d <d <d <d <d <d1,2-DNB <d <d <d <d <d <d2,5-DNT <d <d <d <d <d <d2,4-DNT 0.058 0.020 0.025 0.062 0.027 0.0313,5-DNT <d <d <d <d <d <d1,3,5-TNB <d <d <d <d <d <d2,4,6-TNT <d <d 0.042 0.021 <d <d
36 days1,3-DNB <d <d 0.038 <d <d <d1,2-DNB <d <d <d <d <d <d2,5-DNT <d <d <d <d <d <d2,4-DNT 0.033 0.036 0.034 0.029 0.035 0.0283,5-DNT <d <d <d <d <d <d1,3,5-TNB <d <d <d <d <d <d2,4,6-TNT <d <d 0.048 <d <d <d
69 days1,3-DNB <d <d <d <d <d <d1,2-DNB <d <d <d <d <d <d2,5-DNT <d <d <d <d <d <d2,4-DNT 0.025 0.029 0.021 0.020 0.034 0.0343,5-DNT <d <d <d <d <d <d1,3,5-TNB <d <d <d <d <d <d2,4,6-TNT <d <d <d <d <d <d
110 days1,3-DNB not done <d not done <d not done <d1,2-DNB <d 0.016 <d2,5-DNT <d <d <d2,4-DNT 0.024 0.026 0.0133,5-DNT <d <d <d1,3,5-TNB <d <d <d2,4,6-TNT <d <d <d
173 days1,3-DNB not done <d not done 0.168 not done <d1,2-DNB <d 0.081 0.0092,5-DNT <d <d <d2,4-DNT 0.037 0.018 0.0103,5-DNT <d <d <d1,3,5-TNB <d <d 0.0122,4,6-TNT 0.163 0.016 0.006
<d Values were less than the detection limit.
37
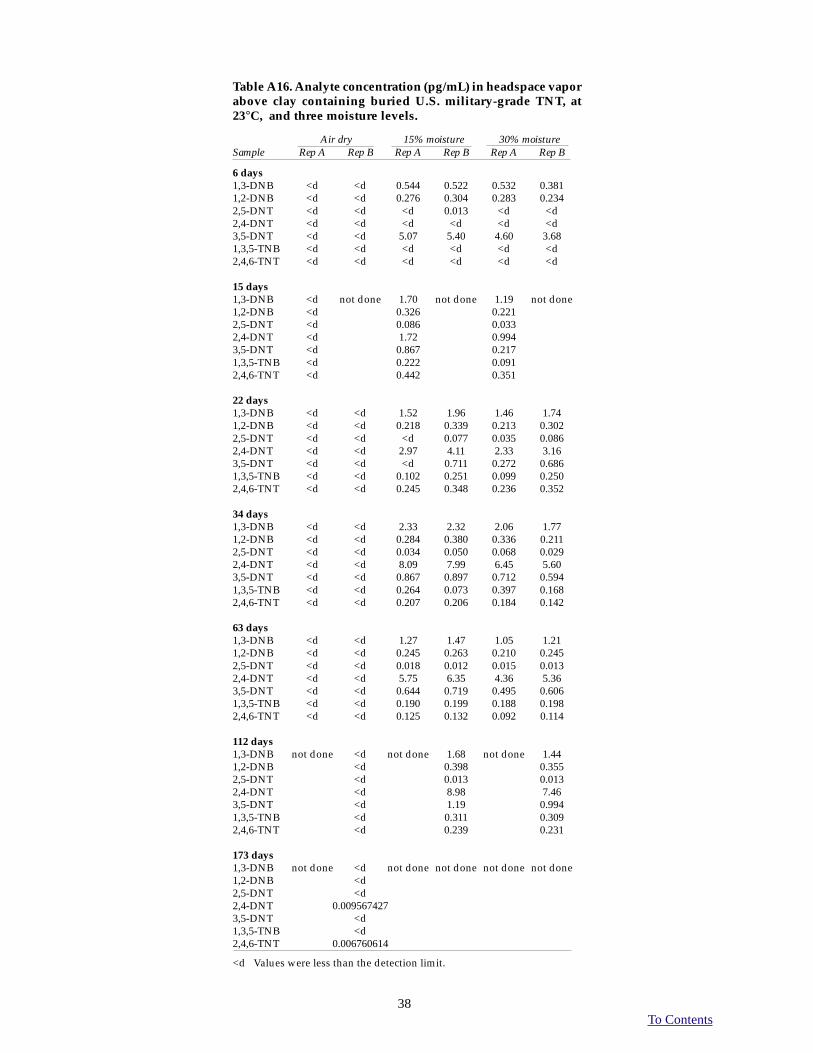
To Contents
Table A16. Analyte concentration (pg/mL) in headspace vaporabove clay containing buried U.S. military-grade TNT, at23°C, and three moisture levels.
Air dry 15% moisture 30% moistureSample Rep A Rep B Rep A Rep B Rep A Rep B
6 days1,3-DNB <d <d 0.544 0.522 0.532 0.3811,2-DNB <d <d 0.276 0.304 0.283 0.2342,5-DNT <d <d <d 0.013 <d <d2,4-DNT <d <d <d <d <d <d3,5-DNT <d <d 5.07 5.40 4.60 3.681,3,5-TNB <d <d <d <d <d <d2,4,6-TNT <d <d <d <d <d <d
15 days1,3-DNB <d not done 1.70 not done 1.19 not done1,2-DNB <d 0.326 0.2212,5-DNT <d 0.086 0.0332,4-DNT <d 1.72 0.9943,5-DNT <d 0.867 0.2171,3,5-TNB <d 0.222 0.0912,4,6-TNT <d 0.442 0.351
22 days1,3-DNB <d <d 1.52 1.96 1.46 1.741,2-DNB <d <d 0.218 0.339 0.213 0.3022,5-DNT <d <d <d 0.077 0.035 0.0862,4-DNT <d <d 2.97 4.11 2.33 3.163,5-DNT <d <d <d 0.711 0.272 0.6861,3,5-TNB <d <d 0.102 0.251 0.099 0.2502,4,6-TNT <d <d 0.245 0.348 0.236 0.352
34 days1,3-DNB <d <d 2.33 2.32 2.06 1.771,2-DNB <d <d 0.284 0.380 0.336 0.2112,5-DNT <d <d 0.034 0.050 0.068 0.0292,4-DNT <d <d 8.09 7.99 6.45 5.603,5-DNT <d <d 0.867 0.897 0.712 0.5941,3,5-TNB <d <d 0.264 0.073 0.397 0.1682,4,6-TNT <d <d 0.207 0.206 0.184 0.142
63 days1,3-DNB <d <d 1.27 1.47 1.05 1.211,2-DNB <d <d 0.245 0.263 0.210 0.2452,5-DNT <d <d 0.018 0.012 0.015 0.0132,4-DNT <d <d 5.75 6.35 4.36 5.363,5-DNT <d <d 0.644 0.719 0.495 0.6061,3,5-TNB <d <d 0.190 0.199 0.188 0.1982,4,6-TNT <d <d 0.125 0.132 0.092 0.114
112 days1,3-DNB not done <d not done 1.68 not done 1.441,2-DNB <d 0.398 0.3552,5-DNT <d 0.013 0.0132,4-DNT <d 8.98 7.463,5-DNT <d 1.19 0.9941,3,5-TNB <d 0.311 0.3092,4,6-TNT <d 0.239 0.231
173 days1,3-DNB not done <d not done not done not done not done1,2-DNB <d2,5-DNT <d2,4-DNT 0.0095674273,5-DNT <d1,3,5-TNB <d2,4,6-TNT 0.006760614
<d Values were less than the detection limit.
38

To Contents
Table A17. Analyte concentration (pg/mL) in headspace vaporabove clay containing buried U.S. military-grade TNT, at 4°C,and three moisture levels.
Air dry 15% moisture 30% moistureSample Rep A Rep B Rep A Rep B Rep A Rep B
12 days1,3-DNB <d <d <d <d <d not done1,2-DNB <d <d <d <d <d2,5-DNT <d <d <d <d <d2,4-DNT <d <d 1.06 0.532 0.8373,5-DNT <d <d <d <d <d1,3,5-TNB <d <d <d <d <d2,4,6-TNT <d <d <d <d <d
19 days1,3-DNB <d <d <d 0.075 0.068 0.0921,2-DNB <d <d 0.023 0.058 0.027 0.0452,5-DNT <d <d <d <d <d <d2,4-DNT 0.029 0.027 0.036 0.047 0.050 0.0753,5-DNT <d <d <d <d <d <d1,3,5-TNB <d <d <d <d <d <d2,4,6-TNT <d <d <d <d <d <d
35 days1,3-DNB <d <d 0.434 0.569 0.867 0.4131,2-DNB <d <d 0.124 0.185 0.211 0.1082,5-DNT <d <d <d <d <d <d2,4-DNT 0.024 0.037 0.065 0.073 0.470 0.2323,5-DNT <d <d 0.055 0.049 0.077 0.0881,3,5-TNB <d <d <d <d <d <d2,4,6-TNT <d <d <d <d <d <d
67 days1,3-DNB <d <d 0.941 1.30 0.591 0.3101,2-DNB <d <d 0.139 0.216 0.165 0.0892,5-DNT <d <d <d 0.007 0.012 <d2,4-DNT 0.038 0.029 0.386 0.477 1.51 0.9293,5-DNT <d <d 0.115 0.134 0.217 0.1241,3,5-TNB <d <d <d <d <d <d2,4,6-TNT <d <d <d 0.012 0.018 0.014
111 days1,3-DNB not done <d not done 1.34 not done 0.1001,2-DNB <d 0.169 0.0702,5-DNT <d 0.009 0.0082,4-DNT <d 1.00 1.133,5-DNT <d 0.142 0.1311,3,5-TNB <d <d <d2,4,6-TNT <d 0.025 0.030
173 days1,3-DNB not done <d not done not done not done not done1,2-DNB <d2,5-DNT <d2,4-DNT 0.0103,5-DNT <d1,3,5-TNB <d2,4,6-TNT 0.007
<d Values were less than the detection limit.
39
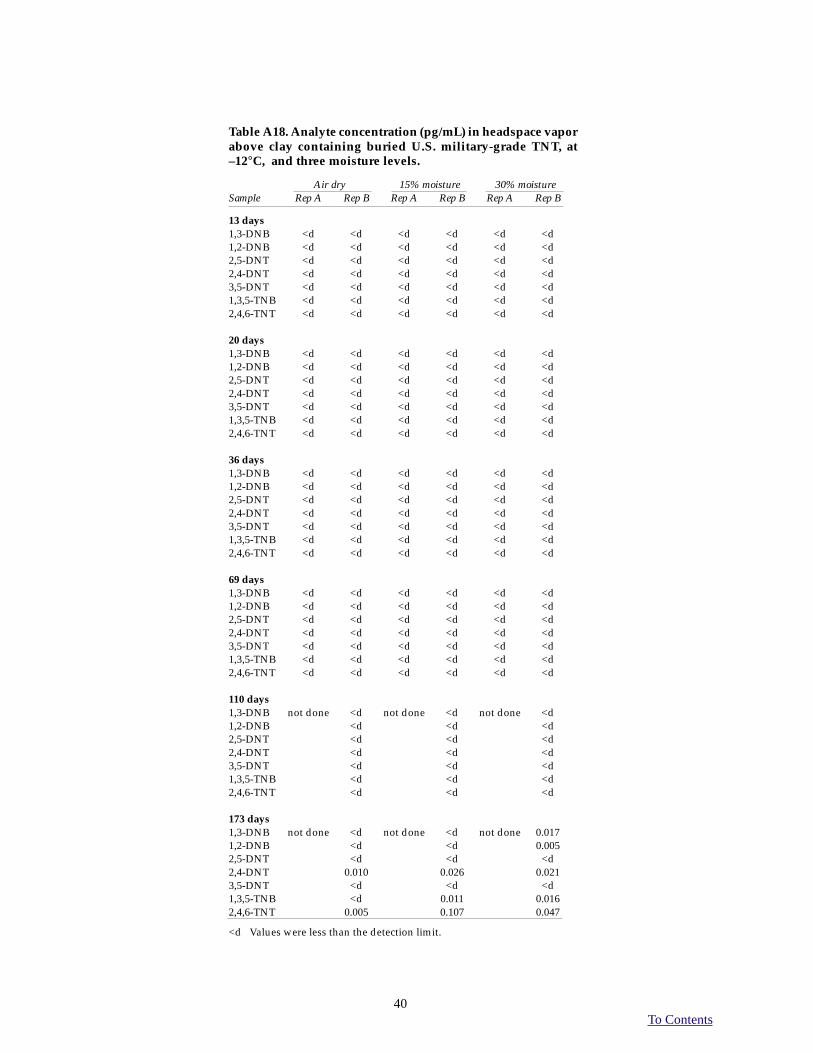
To Contents
Table A18. Analyte concentration (pg/mL) in headspace vaporabove clay containing buried U.S. military-grade TNT, at–12°C, and three moisture levels.
Air dry 15% moisture 30% moistureSample Rep A Rep B Rep A Rep B Rep A Rep B
13 days1,3-DNB <d <d <d <d <d <d1,2-DNB <d <d <d <d <d <d2,5-DNT <d <d <d <d <d <d2,4-DNT <d <d <d <d <d <d3,5-DNT <d <d <d <d <d <d1,3,5-TNB <d <d <d <d <d <d2,4,6-TNT <d <d <d <d <d <d
20 days1,3-DNB <d <d <d <d <d <d1,2-DNB <d <d <d <d <d <d2,5-DNT <d <d <d <d <d <d2,4-DNT <d <d <d <d <d <d3,5-DNT <d <d <d <d <d <d1,3,5-TNB <d <d <d <d <d <d2,4,6-TNT <d <d <d <d <d <d
36 days1,3-DNB <d <d <d <d <d <d1,2-DNB <d <d <d <d <d <d2,5-DNT <d <d <d <d <d <d2,4-DNT <d <d <d <d <d <d3,5-DNT <d <d <d <d <d <d1,3,5-TNB <d <d <d <d <d <d2,4,6-TNT <d <d <d <d <d <d
69 days1,3-DNB <d <d <d <d <d <d1,2-DNB <d <d <d <d <d <d2,5-DNT <d <d <d <d <d <d2,4-DNT <d <d <d <d <d <d3,5-DNT <d <d <d <d <d <d1,3,5-TNB <d <d <d <d <d <d2,4,6-TNT <d <d <d <d <d <d
110 days1,3-DNB not done <d not done <d not done <d1,2-DNB <d <d <d2,5-DNT <d <d <d2,4-DNT <d <d <d3,5-DNT <d <d <d1,3,5-TNB <d <d <d2,4,6-TNT <d <d <d
173 days1,3-DNB not done <d not done <d not done 0.0171,2-DNB <d <d 0.0052,5-DNT <d <d <d2,4-DNT 0.010 0.026 0.0213,5-DNT <d <d <d1,3,5-TNB <d 0.011 0.0162,4,6-TNT 0.005 0.107 0.047
<d Values were less than the detection limit.
40
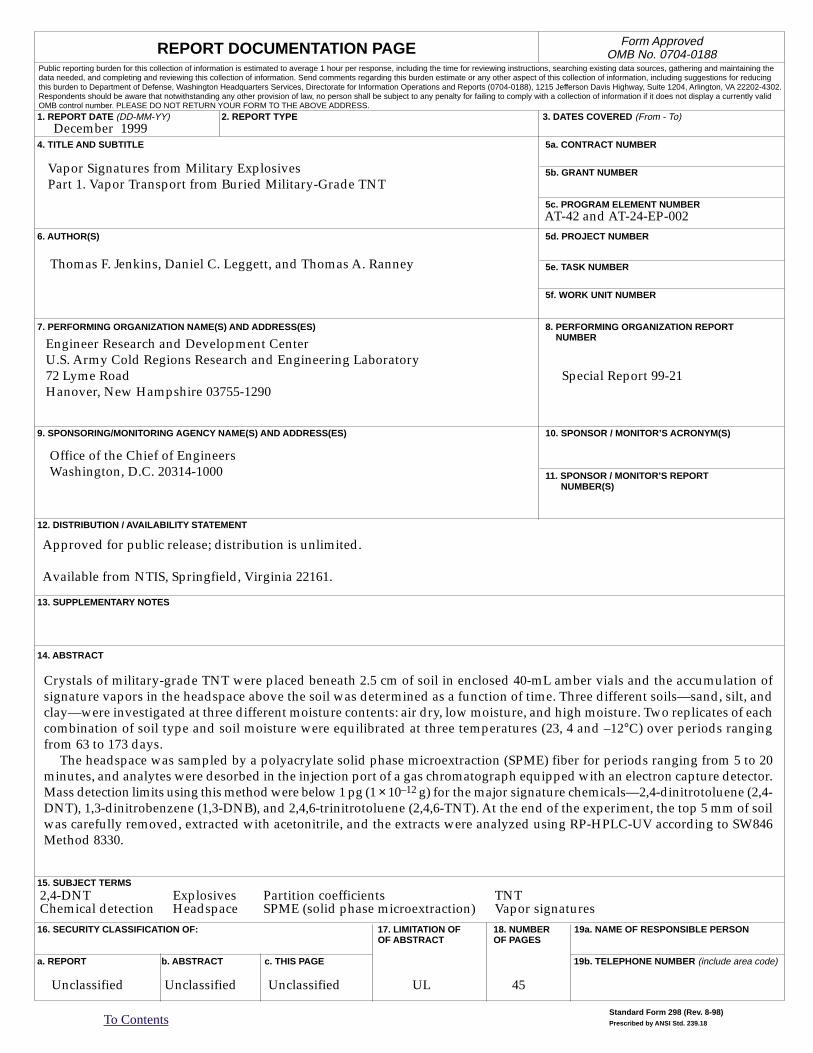
To Contents
1. REPORT DATE (DD-MM-YY) 2. REPORT TYPE 3. DATES COVERED (From - To)
4. TITLE AND SUBTITLE 5a. CONTRACT NUMBER
5b. GRANT NUMBER
5c. PROGRAM ELEMENT NUMBER
6. AUTHOR(S) 5d. PROJECT NUMBER
5e. TASK NUMBER
5f. WORK UNIT NUMBER
7. PERFORMING ORGANIZATION NAME(S) AND ADDRESS(ES) 8. PERFORMING ORGANIZATION REPORT NUMBER
9. SPONSORING/MONITORING AGENCY NAME(S) AND ADDRESS(ES) 10. SPONSOR / MONITOR’S ACRONYM(S)
11. SPONSOR / MONITOR’S REPORT NUMBER(S)
12. DISTRIBUTION / AVAILABILITY STATEMENT
13. SUPPLEMENTARY NOTES
14. ABSTRACT
15. SUBJECT TERMS
16. SECURITY CLASSIFICATION OF: 17. LIMITATION OF 18. NUMBER 19a. NAME OF RESPONSIBLE PERSONOF ABSTRACT OF PAGES
a. REPORT b. ABSTRACT c. THIS PAGE 19b. TELEPHONE NUMBER (include area code)
Unclassified Unclassified Unclassified UL 45
Standard Form 298 (Rev. 8-98)Prescribed by ANSI Std. 239.18
REPORT DOCUMENTATION PAGEPublic reporting burden for this collection of information is estimated to average 1 hour per response, including the time for reviewing instructions, searching existing data sources, gathering and maintaining thedata needed, and completing and reviewing this collection of information. Send comments regarding this burden estimate or any other aspect of this collection of information, including suggestions for reducingthis burden to Department of Defense, Washington Headquarters Services, Directorate for Information Operations and Reports (0704-0188), 1215 Jefferson Davis Highway, Suite 1204, Arlington, VA 22202-4302.Respondents should be aware that notwithstanding any other provision of law, no person shall be subject to any penalty for failing to comply with a collection of information if it does not display a currently validOMB control number. PLEASE DO NOT RETURN YOUR FORM TO THE ABOVE ADDRESS.
Form ApprovedOMB No. 0704-0188
Approved for public release; distribution is unlimited.
Available from NTIS, Springfield, Virginia 22161.
December 1999
AT-42 and AT-24-EP-002
Thomas F. Jenkins, Daniel C. Leggett, and Thomas A. Ranney
Engineer Research and Development CenterU.S. Army Cold Regions Research and Engineering Laboratory72 Lyme Road Special Report 99-21Hanover, New Hampshire 03755-1290
Office of the Chief of EngineersWashington, D.C. 20314-1000
Vapor Signatures from Military ExplosivesPart 1. Vapor Transport from Buried Military-Grade TNT
2,4-DNT Explosives Partition coefficients TNTChemical detection Headspace SPME (solid phase microextraction) Vapor signatures
Crystals of military-grade TNT were placed beneath 2.5 cm of soil in enclosed 40-mL amber vials and the accumulation ofsignature vapors in the headspace above the soil was determined as a function of time. Three different soils—sand, silt, andclay—were investigated at three different moisture contents: air dry, low moisture, and high moisture. Two replicates of eachcombination of soil type and soil moisture were equilibrated at three temperatures (23, 4 and –12°C) over periods rangingfrom 63 to 173 days.
The headspace was sampled by a polyacrylate solid phase microextraction (SPME) fiber for periods ranging from 5 to 20minutes, and analytes were desorbed in the injection port of a gas chromatograph equipped with an electron capture detector.Mass detection limits using this method were below 1 pg (1 × 10–12 g) for the major signature chemicals—2,4-dinitrotoluene (2,4-DNT), 1,3-dinitrobenzene (1,3-DNB), and 2,4,6-trinitrotoluene (2,4,6-TNT). At the end of the experiment, the top 5 mm of soilwas carefully removed, extracted with acetonitrile, and the extracts were analyzed using RP-HPLC-UV according to SW846Method 8330.
To Contents
14. ABSTRACT (cont’d)
Both the qualitative and quantitative nature of the chemical signature above buried TNT is strongly afunction of temperature. At 23 and 4°C, 2,4-DNT was present at the highest concentration in the head-space vapor, 2,4,6-TNT being only a minor component. At –12°C, the more volatile 1,3-DNB predomin-ated. Vapors penetrate the soils in the order sand > silt > clay, with vapor concentrations in the sameorder. Dry soils are very retentive of TNT vapors, while soil moisture facilitates movement of vapors tothe headspace.
Soil–air partition coefficients, computed for these three soils at 23 and 4°C for 2,4,6-TNT, ranged from1.6 × 104 mL-air/g-soil for moist sand at 23°C to 3.0 × 10⁷ for moist clay at 4°C. Partition coefficients for2,4-DNT were about an order of magnitude lower. Vapor concentrations for several of the air-dried soilswere too low to measure and hence the partition coefficients for dry soils could not be estimated, butwere much higher than for the same soil with higher moisture. These results indicate that for detection ofburied mines, the largest mass of signature chemicals will be present in the surface soil rather than theoverlying air.