Embed Size (px)
Citation preview
Fluid Phase Equilibria 217 (2004) 157–164
Vapor–liquid equilibrium of octane-enhancing additives in gasolines6. Total pressure data andGE for binary and ternary mixtures
containing 1,1-dimethylethyl methyl ether (MTBE),methanol andn-hexane at 313.15 K
Cristina Alonsoa, Eduardo A. Monteroa, César R. Chamorrob, José J. Segoviab,Marıa C. Martınb, Miguel A. Villamañánb,∗
a Departamento de Ingenier´ıa Electromecánica, Escuela Politécnica Superior, Universidad de Burgos, Burgos E-09006, Spainb Laboratorio de Termodinámica y Calibración (TERMOCAL), Departamento de Ingenier´ıa Energética y Fluidomecánica,
E.T.S. de Ingenieros Industriales, Universidad de Valladolid, Valladolid E-47071, Spain
Received 2 August 2002; accepted 13 January 2003
Abstract
Experimental isothermalP–x data atT = 313.15 K for the binary systems 1,1-dimethylethyl methyl ether(MTBE) + n-hexane andmethanol+ n-hexane, and the ternary system MTBE+ methanol+ n-hexane are reported. Data reduction by Barker’s method providescorrelations forGE using the Margules equation for the binary systems and the Wohl expansion for the ternary system. Wilson, NRTL andUNIQUAC models have been applied successfully to both the binary and the ternary systems. Moreover, we compare the experimental resultsfor these binary mixtures to the prediction of the UNIFAC (Dortmund) model. Experimental results have been compared to predictions forthe ternary system obtained from the Wilson, NRTL, UNIQUAC and UNIFAC models; for the ternary system, the UNIFAC predictions seempoor. The presence of azeotropes in the binary systems has been studied.© 2003 Elsevier B.V. All rights reserved.
Keywords:Data; VLE low pressure; Hydrocarbons; 1,1-Dimethylethyl methyl ether (MTBE); Excess Gibbs energy; Correlations
1. Introduction
1,1-Dimethylethyl methyl ether (MTBE) also known asmethyl tert-butyl ether is an important blending agent in theformulation of the new gasolines for enhancing the octanenumber in substitution of the traditional leaded products.MTBE is obtained by the catalytic reaction of methanoland isobutene. In this synthesis, the methanol/isobuteneratio is limited by the formation of an azeotrope betweenMTBE and the unreacted methanol. In the subsequentdistillation process, it is obtained as a bottom product inwhich methanol has always been found as an impurity. Thethird added compound,n-hexane, represents hydrocarbonsin the gasoline. To better understand and model the new
∗ Corresponding author. Tel.:+34-983-423364; fax:+34-983-423363.E-mail address:[email protected] (M.A. Villamañan).
formulated gasolines, we started a research program on thethermodynamic characterization of ternary mixtures, as thesimplest multicomponent system, containing oxygenatedadditives (ethers and alcohols) and different types of hydro-carbons (alkanes, cycloalkanes, aromatics, alkenes); MTBE,1,1-dimethylpropyl methyl ether (TAME) and diisopropylether (DIPE) were chosen as additives.
In previous papers[1–13], our group has investi-gated binary and ternary systems containing these ethersand/or the hydrocarbons benzene, cyclohexane,n-heptaneand 1-hexene at 313.15 K. The research program hascontinued with the study of ternary systems ether+alcohol + hydrocarbon and their constituent binary sys-tems. Vapor–liquid equilibrium data (VLE) for the ternarymixtures MTBE+ methanol+ n-heptane[14], TAME +methanol+ n-heptane[15], TAME + tert-amyl alcohol+n-hexane[16], TAME + 1-propanol+ n-hexane[17], andDIPE+ n-heptane+ isopropanol[18] have been reported.
0378-3812/$ – see front matter © 2003 Elsevier B.V. All rights reserved.doi:10.1016/j.fluid.2003.01.001
158 C. Alonso et al. / Fluid Phase Equilibria 217 (2004) 157–164
This paper will contribute with an experimental investiga-tion of the thermodynamic parameters of vapor–liquid equi-librium at T = 313.15 K of the ternary system MTBE+methanol+ n-hexane and the corresponding binary systemsMTBE + n-hexane and methanol+ n-hexane, the third bi-nary system involved (MTBE+ methanol) was publishedpreviously[14].
2. Materials
All the chemicals used were purchased from FlukaChemie AG and were of the highest purity available, chro-matography quality reagents (of the series puriss p.a.) witha stated purity >99.8% (GC) for MTBE andn-hexane and>99.9% (GC) for methanol.
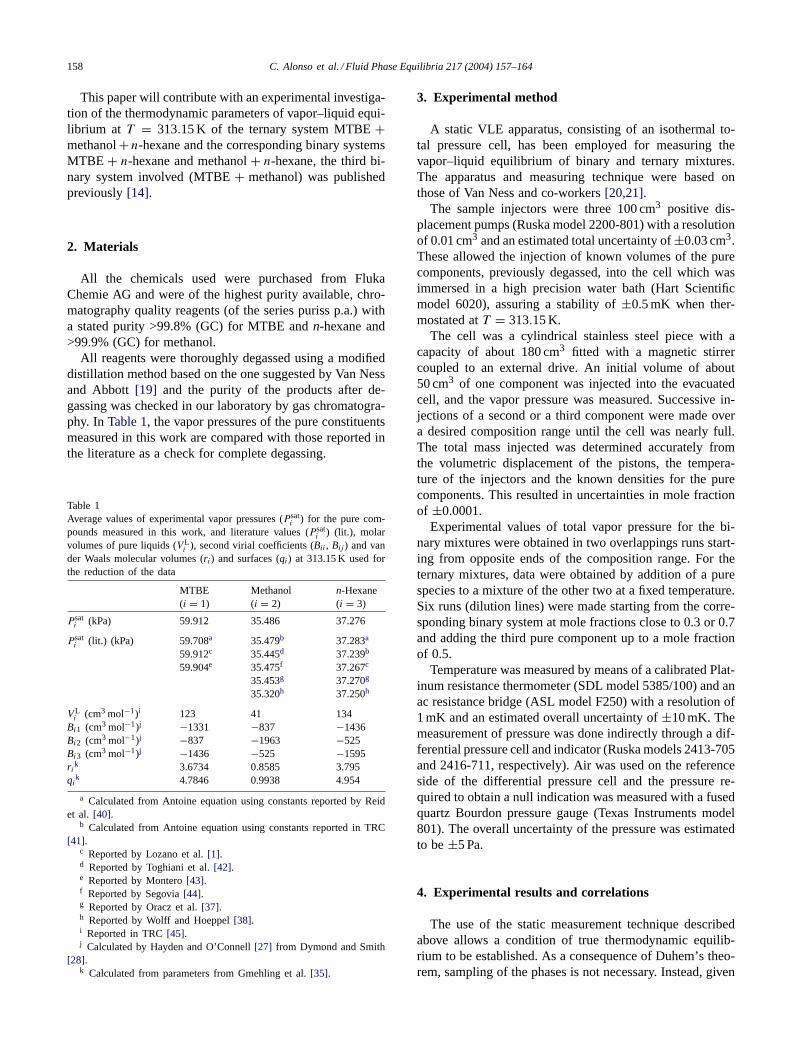
All reagents were thoroughly degassed using a modifieddistillation method based on the one suggested by Van Nessand Abbott [19] and the purity of the products after de-gassing was checked in our laboratory by gas chromatogra-phy. InTable 1, the vapor pressures of the pure constituentsmeasured in this work are compared with those reported inthe literature as a check for complete degassing.
Table 1Average values of experimental vapor pressures (Psat
i ) for the pure com-pounds measured in this work, and literature values (Psat
i ) (lit.), molarvolumes of pure liquids (V L
i ), second virial coefficients (Bii, Bij) and vander Waals molecular volumes (ri) and surfaces (qi) at 313.15 K used forthe reduction of the data
MTBE(i = 1)
Methanol(i = 2)
n-Hexane(i = 3)
Psati (kPa) 59.912 35.486 37.276
Psati (lit.) (kPa) 59.708a 35.479b 37.283a
59.912c 35.445d 37.239b
59.904e 35.475f 37.267c
35.453g 37.270g
35.320h 37.250h
V Li (cm3 mol−1)i 123 41 134
Bi1 (cm3 mol−1)j −1331 −837 −1436Bi2 (cm3 mol−1)j −837 −1963 −525Bi3 (cm3 mol−1)j −1436 −525 −1595ri
k 3.6734 0.8585 3.795qi
k 4.7846 0.9938 4.954
a Calculated from Antoine equation using constants reported by Reidet al. [40].
b Calculated from Antoine equation using constants reported in TRC[41].
c Reported by Lozano et al.[1].d Reported by Toghiani et al.[42].e Reported by Montero[43].f Reported by Segovia[44].g Reported by Oracz et al.[37].h Reported by Wolff and Hoeppel[38].i Reported in TRC[45].j Calculated by Hayden and O’Connell[27] from Dymond and Smith
[28].k Calculated from parameters from Gmehling et al.[35].
3. Experimental method
A static VLE apparatus, consisting of an isothermal to-tal pressure cell, has been employed for measuring thevapor–liquid equilibrium of binary and ternary mixtures.The apparatus and measuring technique were based onthose of Van Ness and co-workers[20,21].
The sample injectors were three 100 cm3 positive dis-placement pumps (Ruska model 2200-801) with a resolutionof 0.01 cm3 and an estimated total uncertainty of±0.03 cm3.These allowed the injection of known volumes of the purecomponents, previously degassed, into the cell which wasimmersed in a high precision water bath (Hart Scientificmodel 6020), assuring a stability of±0.5 mK when ther-mostated atT = 313.15 K.
The cell was a cylindrical stainless steel piece with acapacity of about 180 cm3 fitted with a magnetic stirrercoupled to an external drive. An initial volume of about50 cm3 of one component was injected into the evacuatedcell, and the vapor pressure was measured. Successive in-jections of a second or a third component were made overa desired composition range until the cell was nearly full.The total mass injected was determined accurately fromthe volumetric displacement of the pistons, the tempera-ture of the injectors and the known densities for the purecomponents. This resulted in uncertainties in mole fractionof ±0.0001.
Experimental values of total vapor pressure for the bi-nary mixtures were obtained in two overlappings runs start-ing from opposite ends of the composition range. For theternary mixtures, data were obtained by addition of a purespecies to a mixture of the other two at a fixed temperature.Six runs (dilution lines) were made starting from the corre-sponding binary system at mole fractions close to 0.3 or 0.7and adding the third pure component up to a mole fractionof 0.5.
Temperature was measured by means of a calibrated Plat-inum resistance thermometer (SDL model 5385/100) and anac resistance bridge (ASL model F250) with a resolution of1 mK and an estimated overall uncertainty of±10 mK. Themeasurement of pressure was done indirectly through a dif-ferential pressure cell and indicator (Ruska models 2413-705and 2416-711, respectively). Air was used on the referenceside of the differential pressure cell and the pressure re-quired to obtain a null indication was measured with a fusedquartz Bourdon pressure gauge (Texas Instruments model801). The overall uncertainty of the pressure was estimatedto be±5 Pa.
4. Experimental results and correlations
The use of the static measurement technique describedabove allows a condition of true thermodynamic equilib-rium to be established. As a consequence of Duhem’s theo-rem, sampling of the phases is not necessary. Instead, given
C. Alonso et al. / Fluid Phase Equilibria 217 (2004) 157–164 159
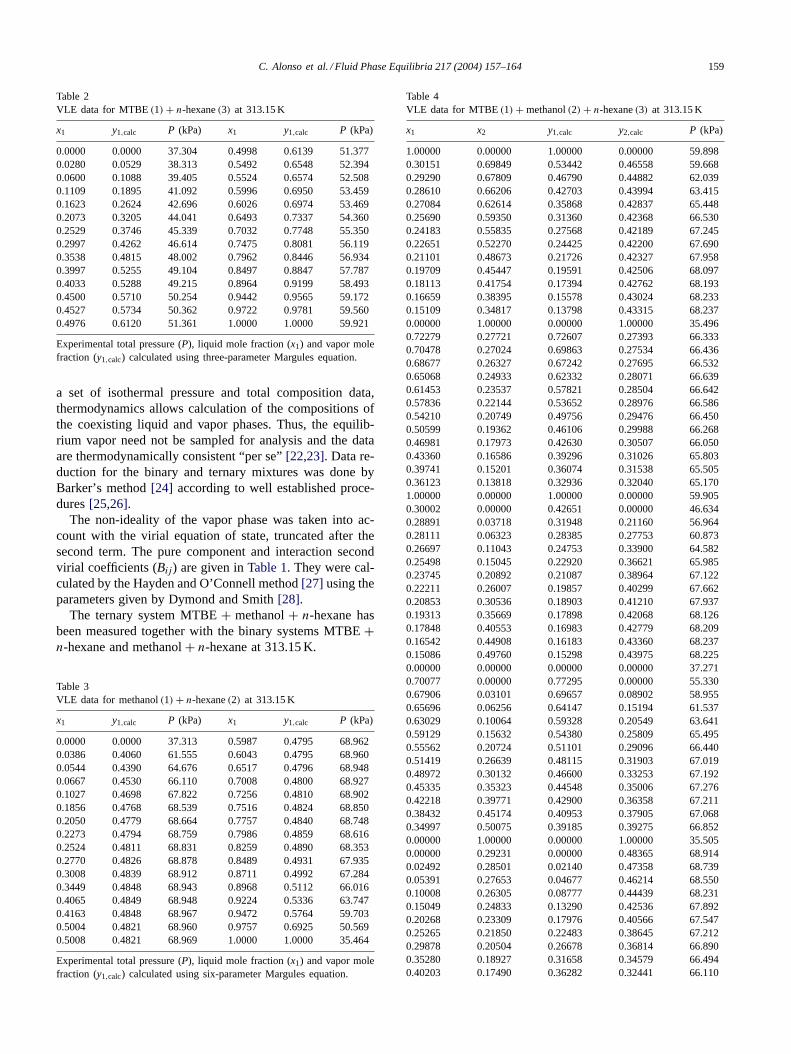
Table 2VLE data for MTBE(1) + n-hexane(3) at 313.15 K
x1 y1,calc P (kPa) x1 y1,calc P (kPa)
0.0000 0.0000 37.304 0.4998 0.6139 51.3770.0280 0.0529 38.313 0.5492 0.6548 52.3940.0600 0.1088 39.405 0.5524 0.6574 52.5080.1109 0.1895 41.092 0.5996 0.6950 53.4590.1623 0.2624 42.696 0.6026 0.6974 53.4690.2073 0.3205 44.041 0.6493 0.7337 54.3600.2529 0.3746 45.339 0.7032 0.7748 55.3500.2997 0.4262 46.614 0.7475 0.8081 56.1190.3538 0.4815 48.002 0.7962 0.8446 56.9340.3997 0.5255 49.104 0.8497 0.8847 57.7870.4033 0.5288 49.215 0.8964 0.9199 58.4930.4500 0.5710 50.254 0.9442 0.9565 59.1720.4527 0.5734 50.362 0.9722 0.9781 59.5600.4976 0.6120 51.361 1.0000 1.0000 59.921
Experimental total pressure (P), liquid mole fraction (x1) and vapor molefraction (y1,calc) calculated using three-parameter Margules equation.
a set of isothermal pressure and total composition data,thermodynamics allows calculation of the compositions ofthe coexisting liquid and vapor phases. Thus, the equilib-rium vapor need not be sampled for analysis and the dataare thermodynamically consistent “per se”[22,23]. Data re-duction for the binary and ternary mixtures was done byBarker’s method[24] according to well established proce-dures[25,26].
The non-ideality of the vapor phase was taken into ac-count with the virial equation of state, truncated after thesecond term. The pure component and interaction secondvirial coefficients (Bij) are given inTable 1. They were cal-culated by the Hayden and O’Connell method[27] using theparameters given by Dymond and Smith[28].
The ternary system MTBE+ methanol+ n-hexane hasbeen measured together with the binary systems MTBE+n-hexane and methanol+ n-hexane at 313.15 K.
Table 3VLE data for methanol(1) + n-hexane(2) at 313.15 K
x1 y1,calc P (kPa) x1 y1,calc P (kPa)
0.0000 0.0000 37.313 0.5987 0.4795 68.9620.0386 0.4060 61.555 0.6043 0.4795 68.9600.0544 0.4390 64.676 0.6517 0.4796 68.9480.0667 0.4530 66.110 0.7008 0.4800 68.9270.1027 0.4698 67.822 0.7256 0.4810 68.9020.1856 0.4768 68.539 0.7516 0.4824 68.8500.2050 0.4779 68.664 0.7757 0.4840 68.7480.2273 0.4794 68.759 0.7986 0.4859 68.6160.2524 0.4811 68.831 0.8259 0.4890 68.3530.2770 0.4826 68.878 0.8489 0.4931 67.9350.3008 0.4839 68.912 0.8711 0.4992 67.2840.3449 0.4848 68.943 0.8968 0.5112 66.0160.4065 0.4849 68.948 0.9224 0.5336 63.7470.4163 0.4848 68.967 0.9472 0.5764 59.7030.5004 0.4821 68.960 0.9757 0.6925 50.5690.5008 0.4821 68.969 1.0000 1.0000 35.464
Experimental total pressure (P), liquid mole fraction (x1) and vapor molefraction (y1,calc) calculated using six-parameter Margules equation.
Table 4VLE data for MTBE(1) + methanol(2) + n-hexane(3) at 313.15 K
x1 x2 y1,calc y2,calc P (kPa)
1.00000 0.00000 1.00000 0.00000 59.8980.30151 0.69849 0.53442 0.46558 59.6680.29290 0.67809 0.46790 0.44882 62.0390.28610 0.66206 0.42703 0.43994 63.4150.27084 0.62614 0.35868 0.42837 65.4480.25690 0.59350 0.31360 0.42368 66.5300.24183 0.55835 0.27568 0.42189 67.2450.22651 0.52270 0.24425 0.42200 67.6900.21101 0.48673 0.21726 0.42327 67.9580.19709 0.45447 0.19591 0.42506 68.0970.18113 0.41754 0.17394 0.42762 68.1930.16659 0.38395 0.15578 0.43024 68.2330.15109 0.34817 0.13798 0.43315 68.2370.00000 1.00000 0.00000 1.00000 35.4960.72279 0.27721 0.72607 0.27393 66.3330.70478 0.27024 0.69863 0.27534 66.4360.68677 0.26327 0.67242 0.27695 66.5320.65068 0.24933 0.62332 0.28071 66.6390.61453 0.23537 0.57821 0.28504 66.6420.57836 0.22144 0.53652 0.28976 66.5860.54210 0.20749 0.49756 0.29476 66.4500.50599 0.19362 0.46106 0.29988 66.2680.46981 0.17973 0.42630 0.30507 66.0500.43360 0.16586 0.39296 0.31026 65.8030.39741 0.15201 0.36074 0.31538 65.5050.36123 0.13818 0.32936 0.32040 65.1701.00000 0.00000 1.00000 0.00000 59.9050.30002 0.00000 0.42651 0.00000 46.6340.28891 0.03718 0.31948 0.21160 56.9640.28111 0.06323 0.28385 0.27753 60.8730.26697 0.11043 0.24753 0.33900 64.5820.25498 0.15045 0.22920 0.36621 65.9850.23745 0.20892 0.21087 0.38964 67.1220.22211 0.26007 0.19857 0.40299 67.6620.20853 0.30536 0.18903 0.41210 67.9370.19313 0.35669 0.17898 0.42068 68.1260.17848 0.40553 0.16983 0.42779 68.2090.16542 0.44908 0.16183 0.43360 68.2370.15086 0.49760 0.15298 0.43975 68.2250.00000 0.00000 0.00000 0.00000 37.2710.70077 0.00000 0.77295 0.00000 55.3300.67906 0.03101 0.69657 0.08902 58.9550.65696 0.06256 0.64147 0.15194 61.5370.63029 0.10064 0.59328 0.20549 63.6410.59129 0.15632 0.54380 0.25809 65.4950.55562 0.20724 0.51101 0.29096 66.4400.51419 0.26639 0.48115 0.31903 67.0190.48972 0.30132 0.46600 0.33253 67.1920.45335 0.35323 0.44548 0.35006 67.2760.42218 0.39771 0.42900 0.36358 67.2110.38432 0.45174 0.40953 0.37905 67.0680.34997 0.50075 0.39185 0.39275 66.8520.00000 1.00000 0.00000 1.00000 35.5050.00000 0.29231 0.00000 0.48365 68.9140.02492 0.28501 0.02140 0.47358 68.7390.05391 0.27653 0.04677 0.46214 68.5500.10008 0.26305 0.08777 0.44439 68.2310.15049 0.24833 0.13290 0.42536 67.8920.20268 0.23309 0.17976 0.40566 67.5470.25265 0.21850 0.22483 0.38645 67.2120.29878 0.20504 0.26678 0.36814 66.8900.35280 0.18927 0.31658 0.34579 66.4940.40203 0.17490 0.36282 0.32441 66.110
160 C. Alonso et al. / Fluid Phase Equilibria 217 (2004) 157–164
Table 4 (Continued)
x1 x2 y1,calc y2,calc P (kPa)
0.45150 0.16046 0.41025 0.30192 65.6950.50148 0.14588 0.45923 0.27818 65.2680.00000 0.00000 0.00000 0.00000 37.2780.00000 0.70198 0.00000 0.48021 69.0220.02752 0.68260 0.03164 0.47550 68.7700.05684 0.66195 0.06546 0.46937 68.4910.09972 0.63175 0.11439 0.45896 68.1770.15045 0.59604 0.17059 0.44534 67.9120.20124 0.56032 0.22449 0.43097 67.7050.25015 0.52593 0.27407 0.41679 67.5650.30087 0.49030 0.32315 0.40184 67.4670.34978 0.45595 0.36850 0.38714 67.3910.40032 0.42047 0.41356 0.37151 67.3280.43154 0.39856 0.44062 0.36156 67.2820.46631 0.37417 0.47016 0.35012 67.234
Experimental total pressure (P), liquid mole fraction (xi) and vapor molefraction (yi,calc) calculated using Wohl expansion.
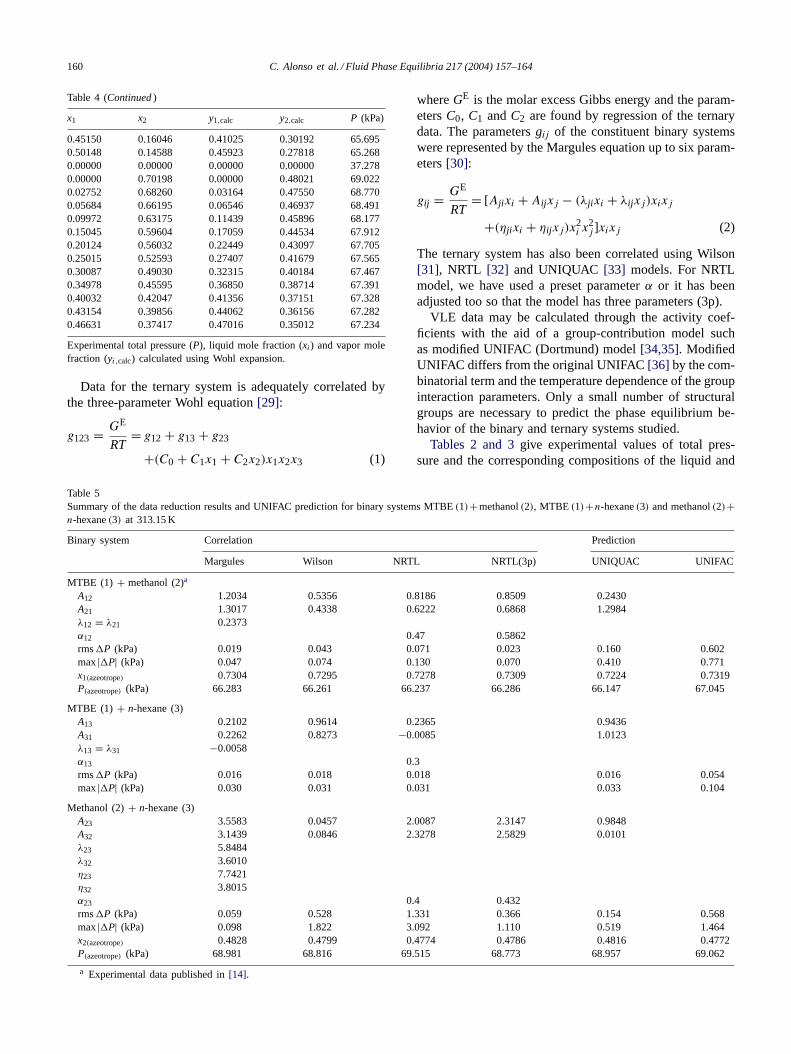
Data for the ternary system is adequately correlated bythe three-parameter Wohl equation[29]:
g123 = GE
RT= g12 + g13 + g23
+(C0 + C1x1 + C2x2)x1x2x3 (1)
Table 5Summary of the data reduction results and UNIFAC prediction for binary systems MTBE(1)+methanol(2), MTBE (1)+n-hexane(3) and methanol(2)+n-hexane(3) at 313.15 K
Binary system Correlation Prediction
Margules Wilson NRTL NRTL(3p) UNIQUAC UNIFAC
MTBE (1) + methanol (2)a
A12 1.2034 0.5356 0.8186 0.8509 0.2430A21 1.3017 0.4338 0.6222 0.6868 1.2984λ12 = λ21 0.2373α12 0.47 0.5862rms�P (kPa) 0.019 0.043 0.071 0.023 0.160 0.602max |�P| (kPa) 0.047 0.074 0.130 0.070 0.410 0.771x1(azeotrope) 0.7304 0.7295 0.7278 0.7309 0.7224 0.7319P(azeotrope) (kPa) 66.283 66.261 66.237 66.286 66.147 67.045
MTBE (1) + n-hexane (3)A13 0.2102 0.9614 0.2365 0.9436A31 0.2262 0.8273 −0.0085 1.0123λ13 = λ31 −0.0058α13 0.3rms�P (kPa) 0.016 0.018 0.018 0.016 0.054max |�P| (kPa) 0.030 0.031 0.031 0.033 0.104
Methanol (2)+ n-hexane (3)A23 3.5583 0.0457 2.0087 2.3147 0.9848A32 3.1439 0.0846 2.3278 2.5829 0.0101λ23 5.8484λ32 3.6010η23 7.7421η32 3.8015α23 0.4 0.432rms�P (kPa) 0.059 0.528 1.331 0.366 0.154 0.568max |�P| (kPa) 0.098 1.822 3.092 1.110 0.519 1.464x2(azeotrope) 0.4828 0.4799 0.4774 0.4786 0.4816 0.4772P(azeotrope) (kPa) 68.981 68.816 69.515 68.773 68.957 69.062
a Experimental data published in[14].
whereGE is the molar excess Gibbs energy and the param-etersC0, C1 andC2 are found by regression of the ternarydata. The parametersgij of the constituent binary systemswere represented by the Margules equation up to six param-eters[30]:
gij = GE
RT= [Ajixi + Aijxj − (λjixi + λijxj)xixj
+(ηjixi + ηijxj)x2i x
2j ]xixj (2)
The ternary system has also been correlated using Wilson[31], NRTL [32] and UNIQUAC [33] models. For NRTLmodel, we have used a preset parameterα or it has beenadjusted too so that the model has three parameters (3p).
VLE data may be calculated through the activity coef-ficients with the aid of a group-contribution model suchas modified UNIFAC (Dortmund) model[34,35]. ModifiedUNIFAC differs from the original UNIFAC[36] by the com-binatorial term and the temperature dependence of the groupinteraction parameters. Only a small number of structuralgroups are necessary to predict the phase equilibrium be-havior of the binary and ternary systems studied.
Tables 2 and 3give experimental values of total pres-sure and the corresponding compositions of the liquid and
C. Alonso et al. / Fluid Phase Equilibria 217 (2004) 157–164 161
Table 6Summary of the data reduction results obtained for the ternary systemMTBE (1) + methanol(2) + n-hexane(3) at 313.15 K
Wohl Wilson NRTL UNIQUAC UNIFAC
CorrelationC0 3.5139C1 0.7691C2 −1.2016A12 0.5699 0.8805 0.0881A21 0.4062 0.6563 1.4409A13 0.8597 0.1411 1.0562A31 0.9263 0.0870 0.9011A23 0.0564 2.4823 0.9840A32 0.0673 2.4896 0.0105α12 0.586α13 0.30α23 0.432rms�P (kPa) 0.059 0.060 0.065 0.059max |�P| (kPa) 0.161 0.171 0.194 0.145
Predictionrms�P (kPa) 0.126 0.121 0.161 2.501max |�P| (kPa) 0.214 0.314 0.508 10.490max |�P|/Pexp (%) 0.60 0.57 0.83 15.2
vapor phases for the binary systems MTBE+ n-hexane andmethanol+n-hexane, respectively. The vapor phase compo-sition was calculated using the Margules equation.Table 4gives similar information for the ternary system MTBE+methanol+ n-hexane, where the Wohl expansion has beenused in the data reduction.
Results of data correlation for both binary systems aresummarized inTable 5, it also includes the binary systemMTBE + methanol that has been published previously[14].For the ternary system, the results of the correlation are givenin Table 6. The equations forGE in multicomponent systemsin the Wilson, NRTL and UNIQUAC models only depend
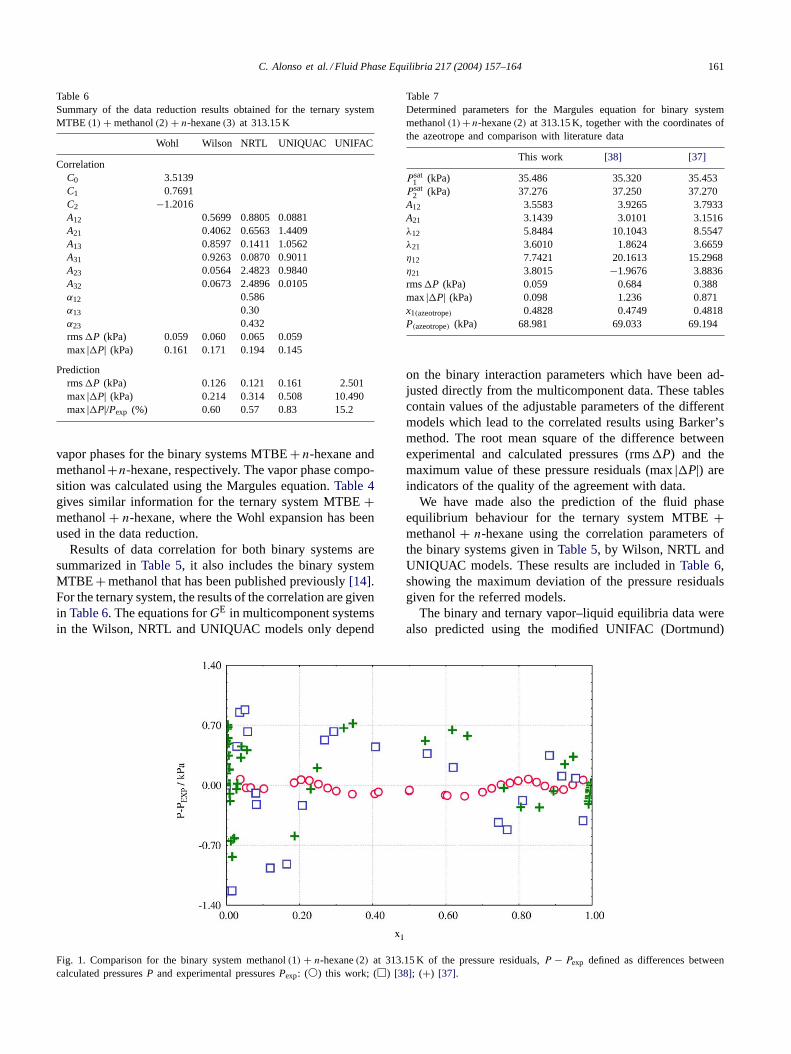
Fig. 1. Comparison for the binary system methanol(1) + n-hexane(2) at 313.15 K of the pressure residuals,P − Pexp defined as differences betweencalculated pressuresP and experimental pressuresPexp: (�) this work; (�) [38]; (+) [37].
Table 7Determined parameters for the Margules equation for binary systemmethanol(1)+n-hexane(2) at 313.15 K, together with the coordinates ofthe azeotrope and comparison with literature data
This work [38] [37]
Psat1 (kPa) 35.486 35.320 35.453
Psat2 (kPa) 37.276 37.250 37.270
A12 3.5583 3.9265 3.7933A21 3.1439 3.0101 3.1516λ12 5.8484 10.1043 8.5547λ21 3.6010 1.8624 3.6659η12 7.7421 20.1613 15.2968η21 3.8015 −1.9676 3.8836rms�P (kPa) 0.059 0.684 0.388max |�P| (kPa) 0.098 1.236 0.871x1(azeotrope) 0.4828 0.4749 0.4818P(azeotrope) (kPa) 68.981 69.033 69.194
on the binary interaction parameters which have been ad-justed directly from the multicomponent data. These tablescontain values of the adjustable parameters of the differentmodels which lead to the correlated results using Barker’smethod. The root mean square of the difference betweenexperimental and calculated pressures (rms�P) and themaximum value of these pressure residuals (max |�P|) areindicators of the quality of the agreement with data.
We have made also the prediction of the fluid phaseequilibrium behaviour for the ternary system MTBE+methanol+ n-hexane using the correlation parameters ofthe binary systems given inTable 5, by Wilson, NRTL andUNIQUAC models. These results are included inTable 6,showing the maximum deviation of the pressure residualsgiven for the referred models.
The binary and ternary vapor–liquid equilibria data werealso predicted using the modified UNIFAC (Dortmund)
162 C. Alonso et al. / Fluid Phase Equilibria 217 (2004) 157–164
group contribution model, and the results are given inTables 5 and 6, respectively.
As an example of the fits of models to the data (Fig. 1)shows a plot of the pressure residuals,P − Pexp defined asdifferences between calculated pressuresP and experimen-tal pressuresPexp, versus liquid composition for the binarymethanol+ n-hexane using Margules equation with six pa-rameters. We have found this system in the literature forcomparison[37,38] and it can be seen in this figure howour data lead to the best fit. InTable 7, we have comparedthe results of this system with those found in the literaturewhich have been reduced using a six-parameter Margulesequation, it also presents the coordinates of the azeotrope.
5. Discussion
The binary system MTBE+ n-hexane presents a positivedeviation from the ideality and the results of the correla-tion give a rms pressure residuals of 16 Pa with a maximumvalue of the absolute deviation of 30 Pa. This was obtainedusing the Margules equation with three parameters, but theother models lead to nearly the same results, for this sys-tem NRTL(3p) did not improve the adjustment and the re-sults are not included inTable 5. The system shows a ratherideal behaviour with a maximum value of the molar ex-cess Gibbs function around 145 J mol−1 at the equimolarcomposition.
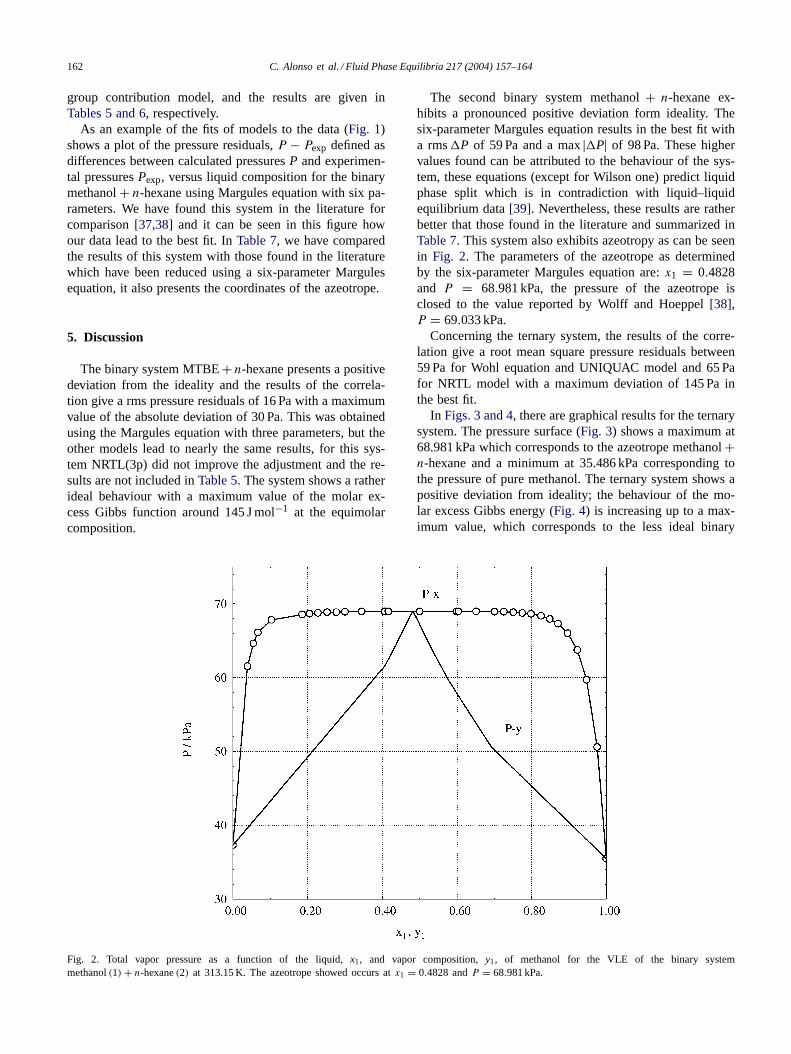
Fig. 2. Total vapor pressure as a function of the liquid,x1, and vapor composition,y1, of methanol for the VLE of the binary systemmethanol(1) + n-hexane(2) at 313.15 K. The azeotrope showed occurs atx1 = 0.4828 andP = 68.981 kPa.
The second binary system methanol+ n-hexane ex-hibits a pronounced positive deviation form ideality. Thesix-parameter Margules equation results in the best fit witha rms�P of 59 Pa and a max |�P| of 98 Pa. These highervalues found can be attributed to the behaviour of the sys-tem, these equations (except for Wilson one) predict liquidphase split which is in contradiction with liquid–liquidequilibrium data[39]. Nevertheless, these results are ratherbetter that those found in the literature and summarized inTable 7. This system also exhibits azeotropy as can be seenin Fig. 2. The parameters of the azeotrope as determinedby the six-parameter Margules equation are:x1 = 0.4828and P = 68.981 kPa, the pressure of the azeotrope isclosed to the value reported by Wolff and Hoeppel[38],P = 69.033 kPa.
Concerning the ternary system, the results of the corre-lation give a root mean square pressure residuals between59 Pa for Wohl equation and UNIQUAC model and 65 Pafor NRTL model with a maximum deviation of 145 Pa inthe best fit.
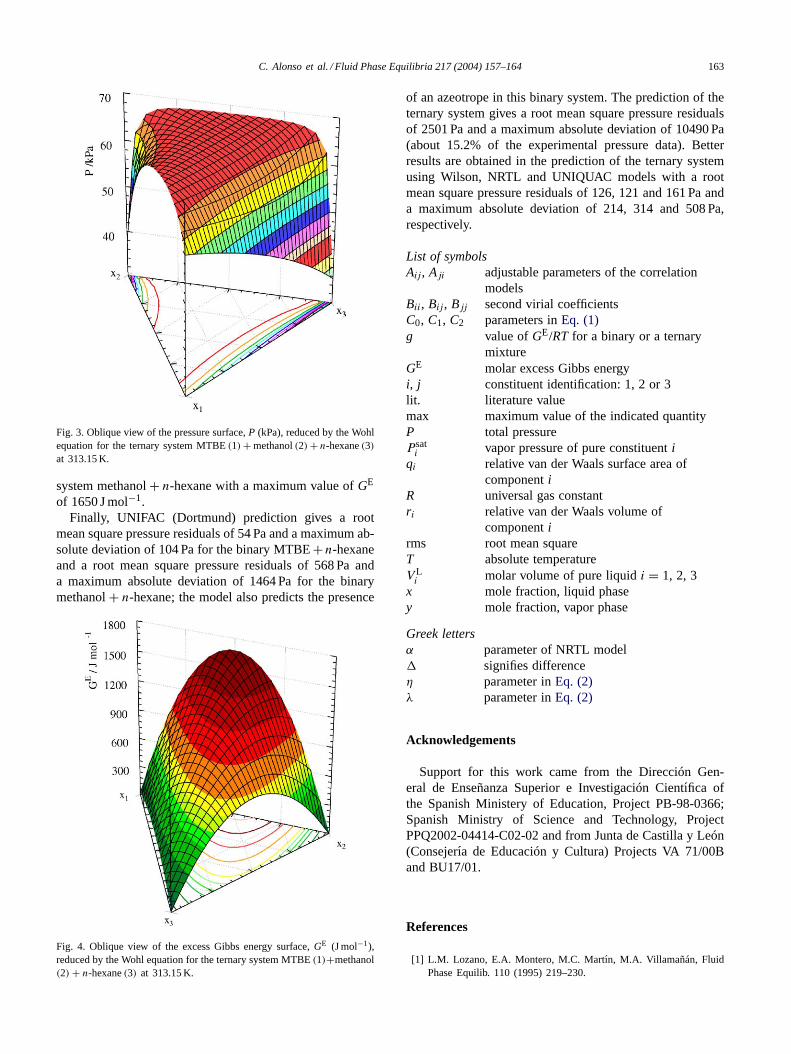
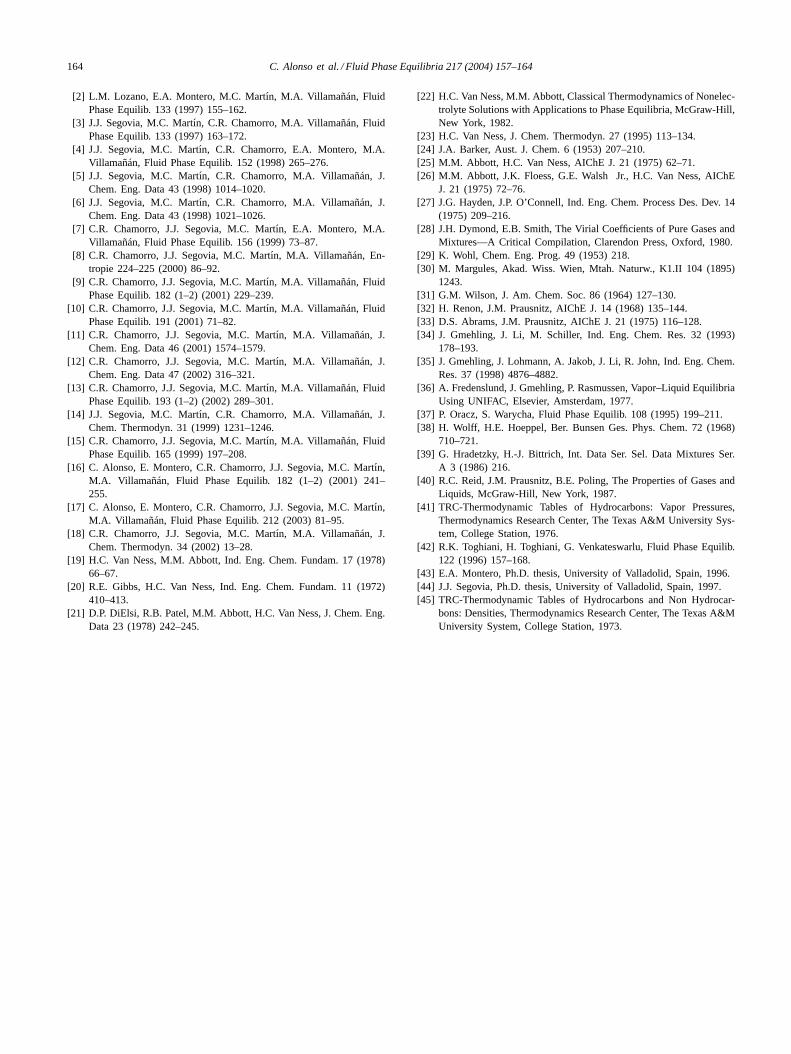
In Figs. 3 and 4, there are graphical results for the ternarysystem. The pressure surface (Fig. 3) shows a maximum at68.981 kPa which corresponds to the azeotrope methanol+n-hexane and a minimum at 35.486 kPa corresponding tothe pressure of pure methanol. The ternary system shows apositive deviation from ideality; the behaviour of the mo-lar excess Gibbs energy (Fig. 4) is increasing up to a max-imum value, which corresponds to the less ideal binary
C. Alonso et al. / Fluid Phase Equilibria 217 (2004) 157–164 163
Fig. 3. Oblique view of the pressure surface,P (kPa), reduced by the Wohlequation for the ternary system MTBE(1) + methanol(2) + n-hexane(3)
at 313.15 K.
system methanol+ n-hexane with a maximum value ofGE
of 1650 J mol−1.Finally, UNIFAC (Dortmund) prediction gives a root
mean square pressure residuals of 54 Pa and a maximum ab-solute deviation of 104 Pa for the binary MTBE+ n-hexaneand a root mean square pressure residuals of 568 Pa anda maximum absolute deviation of 1464 Pa for the binarymethanol+ n-hexane; the model also predicts the presence
Fig. 4. Oblique view of the excess Gibbs energy surface,GE (J mol−1),reduced by the Wohl equation for the ternary system MTBE(1)+methanol(2) + n-hexane(3) at 313.15 K.
of an azeotrope in this binary system. The prediction of theternary system gives a root mean square pressure residualsof 2501 Pa and a maximum absolute deviation of 10490 Pa(about 15.2% of the experimental pressure data). Betterresults are obtained in the prediction of the ternary systemusing Wilson, NRTL and UNIQUAC models with a rootmean square pressure residuals of 126, 121 and 161 Pa anda maximum absolute deviation of 214, 314 and 508 Pa,respectively.
List of symbolsAij, Aji adjustable parameters of the correlation
modelsBii, Bij, Bjj second virial coefficientsC0, C1, C2 parameters inEq. (1)g value ofGE/RT for a binary or a ternary
mixtureGE molar excess Gibbs energyi, j constituent identification: 1, 2 or 3lit. literature valuemax maximum value of the indicated quantityP total pressurePsat
i vapor pressure of pure constituentiqi relative van der Waals surface area of
componentiR universal gas constantri relative van der Waals volume of
componentirms root mean squareT absolute temperatureV L
i molar volume of pure liquidi = 1, 2, 3x mole fraction, liquid phasey mole fraction, vapor phase
Greek lettersα parameter of NRTL model� signifies differenceη parameter inEq. (2)λ parameter inEq. (2)
Acknowledgements
Support for this work came from the Dirección Gen-eral de Enseñanza Superior e Investigación Cientıfica ofthe Spanish Ministery of Education, Project PB-98-0366;Spanish Ministry of Science and Technology, ProjectPPQ2002-04414-C02-02 and from Junta de Castilla y León(Consejerıa de Educación y Cultura) Projects VA 71/00Band BU17/01.
References
[1] L.M. Lozano, E.A. Montero, M.C. Martın, M.A. Villamañán, FluidPhase Equilib. 110 (1995) 219–230.
164 C. Alonso et al. / Fluid Phase Equilibria 217 (2004) 157–164
[2] L.M. Lozano, E.A. Montero, M.C. Martın, M.A. Villamañán, FluidPhase Equilib. 133 (1997) 155–162.
[3] J.J. Segovia, M.C. Martın, C.R. Chamorro, M.A. Villamañán, FluidPhase Equilib. 133 (1997) 163–172.
[4] J.J. Segovia, M.C. Martın, C.R. Chamorro, E.A. Montero, M.A.Villamañán, Fluid Phase Equilib. 152 (1998) 265–276.
[5] J.J. Segovia, M.C. Martın, C.R. Chamorro, M.A. Villamañán, J.Chem. Eng. Data 43 (1998) 1014–1020.
[6] J.J. Segovia, M.C. Martın, C.R. Chamorro, M.A. Villamañán, J.Chem. Eng. Data 43 (1998) 1021–1026.
[7] C.R. Chamorro, J.J. Segovia, M.C. Martın, E.A. Montero, M.A.Villamañán, Fluid Phase Equilib. 156 (1999) 73–87.
[8] C.R. Chamorro, J.J. Segovia, M.C. Martın, M.A. Villamañán, En-tropie 224–225 (2000) 86–92.
[9] C.R. Chamorro, J.J. Segovia, M.C. Martın, M.A. Villamañán, FluidPhase Equilib. 182 (1–2) (2001) 229–239.
[10] C.R. Chamorro, J.J. Segovia, M.C. Martın, M.A. Villamañán, FluidPhase Equilib. 191 (2001) 71–82.
[11] C.R. Chamorro, J.J. Segovia, M.C. Martın, M.A. Villamañán, J.Chem. Eng. Data 46 (2001) 1574–1579.
[12] C.R. Chamorro, J.J. Segovia, M.C. Martın, M.A. Villamañán, J.Chem. Eng. Data 47 (2002) 316–321.
[13] C.R. Chamorro, J.J. Segovia, M.C. Martın, M.A. Villamañán, FluidPhase Equilib. 193 (1–2) (2002) 289–301.
[14] J.J. Segovia, M.C. Martın, C.R. Chamorro, M.A. Villamañán, J.Chem. Thermodyn. 31 (1999) 1231–1246.
[15] C.R. Chamorro, J.J. Segovia, M.C. Martın, M.A. Villamañán, FluidPhase Equilib. 165 (1999) 197–208.
[16] C. Alonso, E. Montero, C.R. Chamorro, J.J. Segovia, M.C. Martın,M.A. Villamañán, Fluid Phase Equilib. 182 (1–2) (2001) 241–255.
[17] C. Alonso, E. Montero, C.R. Chamorro, J.J. Segovia, M.C. Martın,M.A. Villamañán, Fluid Phase Equilib. 212 (2003) 81–95.
[18] C.R. Chamorro, J.J. Segovia, M.C. Martın, M.A. Villamañán, J.Chem. Thermodyn. 34 (2002) 13–28.
[19] H.C. Van Ness, M.M. Abbott, Ind. Eng. Chem. Fundam. 17 (1978)66–67.
[20] R.E. Gibbs, H.C. Van Ness, Ind. Eng. Chem. Fundam. 11 (1972)410–413.
[21] D.P. DiElsi, R.B. Patel, M.M. Abbott, H.C. Van Ness, J. Chem. Eng.Data 23 (1978) 242–245.
[22] H.C. Van Ness, M.M. Abbott, Classical Thermodynamics of Nonelec-trolyte Solutions with Applications to Phase Equilibria, McGraw-Hill,New York, 1982.
[23] H.C. Van Ness, J. Chem. Thermodyn. 27 (1995) 113–134.[24] J.A. Barker, Aust. J. Chem. 6 (1953) 207–210.[25] M.M. Abbott, H.C. Van Ness, AIChE J. 21 (1975) 62–71.[26] M.M. Abbott, J.K. Floess, G.E. Walsh Jr., H.C. Van Ness, AIChE
J. 21 (1975) 72–76.[27] J.G. Hayden, J.P. O’Connell, Ind. Eng. Chem. Process Des. Dev. 14
(1975) 209–216.[28] J.H. Dymond, E.B. Smith, The Virial Coefficients of Pure Gases and
Mixtures—A Critical Compilation, Clarendon Press, Oxford, 1980.[29] K. Wohl, Chem. Eng. Prog. 49 (1953) 218.[30] M. Margules, Akad. Wiss. Wien, Mtah. Naturw., K1.II 104 (1895)
1243.[31] G.M. Wilson, J. Am. Chem. Soc. 86 (1964) 127–130.[32] H. Renon, J.M. Prausnitz, AIChE J. 14 (1968) 135–144.[33] D.S. Abrams, J.M. Prausnitz, AIChE J. 21 (1975) 116–128.[34] J. Gmehling, J. Li, M. Schiller, Ind. Eng. Chem. Res. 32 (1993)
178–193.[35] J. Gmehling, J. Lohmann, A. Jakob, J. Li, R. John, Ind. Eng. Chem.
Res. 37 (1998) 4876–4882.[36] A. Fredenslund, J. Gmehling, P. Rasmussen, Vapor–Liquid Equilibria
Using UNIFAC, Elsevier, Amsterdam, 1977.[37] P. Oracz, S. Warycha, Fluid Phase Equilib. 108 (1995) 199–211.[38] H. Wolff, H.E. Hoeppel, Ber. Bunsen Ges. Phys. Chem. 72 (1968)
710–721.[39] G. Hradetzky, H.-J. Bittrich, Int. Data Ser. Sel. Data Mixtures Ser.
A 3 (1986) 216.[40] R.C. Reid, J.M. Prausnitz, B.E. Poling, The Properties of Gases and
Liquids, McGraw-Hill, New York, 1987.[41] TRC-Thermodynamic Tables of Hydrocarbons: Vapor Pressures,
Thermodynamics Research Center, The Texas A&M University Sys-tem, College Station, 1976.
[42] R.K. Toghiani, H. Toghiani, G. Venkateswarlu, Fluid Phase Equilib.122 (1996) 157–168.
[43] E.A. Montero, Ph.D. thesis, University of Valladolid, Spain, 1996.[44] J.J. Segovia, Ph.D. thesis, University of Valladolid, Spain, 1997.[45] TRC-Thermodynamic Tables of Hydrocarbons and Non Hydrocar-
bons: Densities, Thermodynamics Research Center, The Texas A&MUniversity System, College Station, 1973.