Embed Size (px)
Citation preview

VARIABILITY OF RAINFALL AND TEMPERATURE IN ILOCOS NORTE, PHILIPPINES
Evangeline S. Galacgac Science Research Specialist II Crops Researh Laboratory Mariano Marcos State University City of Batac, Ilocos Norte Charito G. Acosta Professor College of Agriculture, Food, and Sustainable Development Mariano Marcos State University City of Batac, Ilocos Norte Nathaniel R. Alibuyog Professor College of Engineering Mariano Marcos State University City of Batac, Ilocos Norte

Variability of Rainfall and Temperature in Ilocos Norte, Philippines
Abstract
The variability of rainfall and temperature in the Philippines had already been
generally analyzed but limited studies have been conducted so far to determine the extent of
this phenomenon in specific localities. Hence, 35 years of daily data on rainfall and air
temperature taken from MMSU-PAGASA Agrometeorological Station in Batac City, Ilocos
Norte, and 30-year tropical cyclone data from Laoag City, Ilocos Norte Synoptic Station were
analyzed. This study aimed to determine the variability of rainfall, air temperature, and
cyclone patterns in Ilocos Norte to provide decision-makers with the needed information and
tools to manage or mitigate the risks brought about by the changes of these weather
parameters in the province.
Results showed that there was an increase in annual temperature and this was found
to have deviated from the normal-base period. With respect to rainfall, the annual trend was
variable but there was a significant change in monthly pattern and a slight change in the
frequency of maximum rainfall events. On the other hand, the number and intensity of
tropical cyclone increased annually and deviated from the normal. Likewise, monthly trend
and intensity posted a remarkable change. Based from these results, appropriate cropping
calendars suitable to a given agro-ecological zone were developed.
Keywords: cropping calendar, Ilocos Norte, rainfall, temperature

Introduction
Due to the current changes of the weather patterns leading to either insufficient or
too much rainfall, as well as natural disasters such as flood and drought, tremendous crop
losses are now being exhibited. With these changes, climate change has become a
significant issue that needs to be addressed.
A recent study result reported that extreme precipitation events are already
increasing as the globe warms. Brian Soden (2000) of the University of Miami reported that
a warmer atmosphere contains larger amounts of moisture which boosts the intensity of
heavy downpours. An increase in the number of cyclones and hurricanes over the past few
years has been attributed to changes in temperature. Global temperatures have risen by
over 0.7oC in the last 100 years and eleven of the last twelve years (1995-2006) are the
warmest on record. In the UK, in 1990s were very warm about 0.6oC warmer than the mean
1961-1990 air temperature.
Climate change could result in a variety of impact on agriculture. Some of these
effects are changes in production patterns due to higher air temperature and changing
precipitation patterns. Plants need varying amounts of rainfall to survive, therefore, rain
being the most effective means of watering, is important to agriculture. Too much or too little
rainfall can be harmful, even devastating to crops. A drought can kill crops in massive
numbers, while overly wet weather can cause occurrence of diseases and harmful fungi.
Parasites, diseases, fungi and other pests tend to thrive and spread more rapaciously in
warmer and more humid climates. On the other hand, Erik Runkle (2000) of Michigan State
University reported that temperature is the primary factor that controls how fast or slow a
plant develops. Generally, the warmer the temperature, the faster a plant grows. Also, air
temperature regulates most plant processes i.e. germination, flowering, photosynthesis,
transpiration, respiration, etc. Photosynthesis and respiration of plants and microbes
increase with temperature, especially in temperate latitudes (http://www.fao.org). Forecast
changes in temperature and rainfall are likely to reduce crop yields overall, increasing the
risk of hunger. In the presentation of CG Lao of PAGASA (2009), rice yields are declining by
as much as 10% for every degree Celsius increase in temperature in the tropics.
The Philippines have experienced temperature spikes brought about by climate
change. It has been observed that warming is experienced most in the northern and
southern regions of the country, while Metro Manila has warmed less than most parts. In
addition, the regions that have warmed the most (northern Luzon, Mindanao) have also dried
the most. Largest precipitation trends are about 10 percent during the 20th century
(http://www.doe.gov.ph). Rainy season comes early, almost in an unexpected situation.
Landslides are being reported from provinces. Flash floods are also a major problem.
The effect of climate on agriculture is related to variability in local climates rather than
in global climate patterns. The most significant impact of climate change on agriculture is
probably changes in rainfall. Some regions are forecast to receive more rain, others to
receive less; above all, it will become more variable (http://www.absoluteastronomy.com).
It is therefore important to analyze the variability of temperature and rainfall in Ilocos
Norte to better understand and prepare for the coming changes. Results of the study will
provide decision-makers with the needed information and tools to assess the risks brought
about by the variability of rainfall and air temperature. Such information will lead to an
improved crop production management and a better long-term agricultural planning and
operation in Ilocos Norte.
Methodology
Thirty five-year (1976-2010) daily data on rainfall and air temperature from MMSU-
PAGASA Agrometeorological Station in Batac City, Ilocos Norte (18o 3’N latitude, 120o 32’ E
longitude, 17m AMSL) and 30-year (1981-2010) tropical cyclone data from Laoag City,
Ilocos Norte Synoptic Station were analyzed to determine the variability of rainfall,
temperature, and cyclone patterns, frequency and intensity in Ilocos Norte. Annual and
monthly variations were determined using descriptive statistics. Linear regression analysis
was used to determine the degree of annual change. Average data from 1976-1990
(standard base period for most climate change studies defined by the World Meteorological

Organization) considered Period 1, 1991-2010, Period 2, and 1976-2010 were compared to
find out if there were changes that occurred during these periods. The anomalies from the
average of 1976-2010 and Period 1 were likewise computed as follows:
Anomaly from average = yearly data 1976-2010 or Period 1 average yearly data of 1976-2010 or Period 1
Based from the result of the analysis, cropping calendar for a given agro-ecological
zone was developed.
Results and Discussion
Rainfall
The seasonal rainfall patterns fluctuated from year to year (Figure 1). The mean
annual rainfall was 2031.8 mm. Lowest recorded rainfall for the last 35 years was about
1,100 mm and highest was 3,500 mm. Although the amount is variable, it can be said that
the annual change was 11.74 mm. Comparing the amount of rainfall during Period 1 (1976-
1990) and Period 2 (1991-2010), it can be noted that the average rainfall increased by 92.7
mm.
Figure 1. Yearly rainfall in Ilocos Norte, Philippines from 1976-2010.

There were more years with rainfall below the normal amount both from the mean of
1976-2010 and Period 1. Deviation was as high as 1,500 mm (Figure 2). Rainfall anomaly
between 1976-2010 and Period 1 was the same. There was no consistent increase or
decrease in rainfall as recorded.
The peak of rainfall from 1976-2010 was during August (Figure 3), However,
comparing periods 1 and 2 (Figure 4), it was observed that the peak of rainfall shifted from
August (Period 1) to July (Period 2). Such shifting of rainfall pattern may affect the current
cropping pattern and management in the study area. Despite of this, the amount of rainfall
per month did not show any abrupt change in the last 20 years except in July.
The number of days with moderate to heavy rainfall (>160 mm to >180 mm) was less
variable from 2001-2010 compared to the other years. Over a period of 35 years however,
Figure 2. Rainfall anomaly in Ilocos Norte from the average rainfall of 1976-2010 and Period 1 (1976-1990).
Figure 3. Monthly rainfall in Ilocos Norte from the average rainfall of 1976-
2010.
Figure 4. Comparison of the monthly rainfall in Ilocos Norte between the 2
Periods.

the range was 2-15 days (Figure 5). In Figure 6, the most number of days with heavy rainfall
(>180 mm) was in 2000 and 2009.
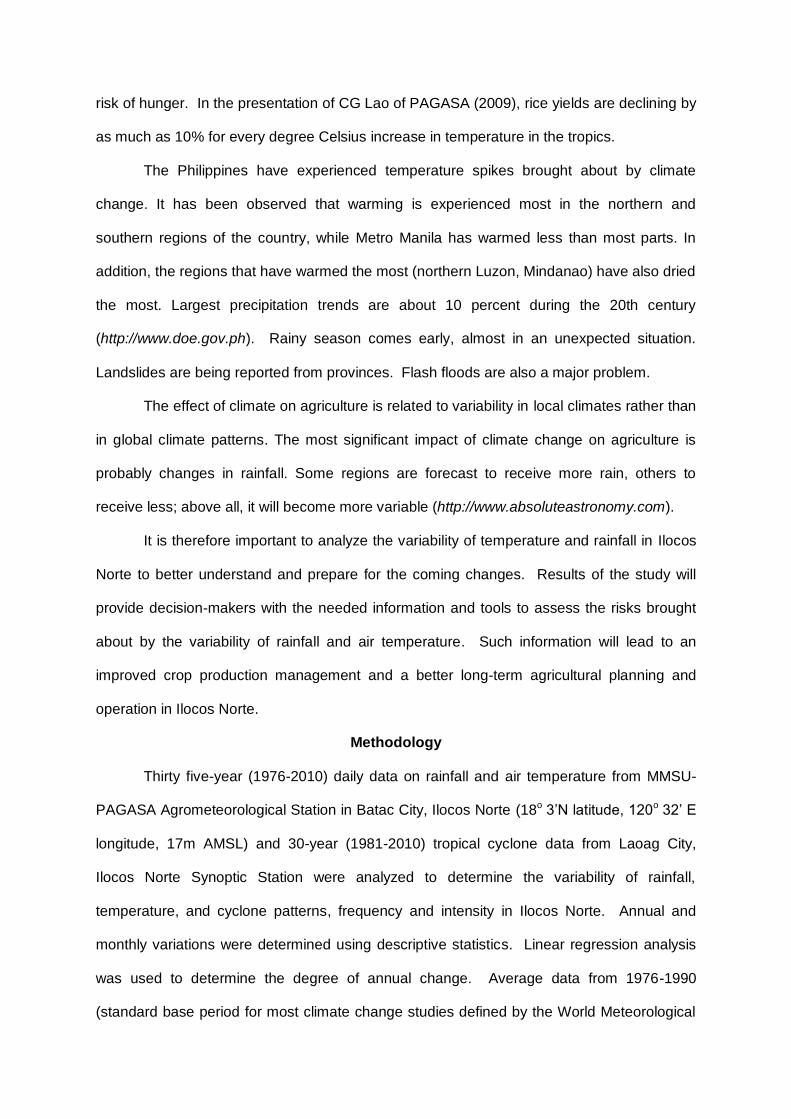
In spite of the fluctuation of rainfall pattern and frequency of maximum rainfall events
from year to year, analysis on the mean rainfall between periods 1 and 2 showed no
considerable difference (Figure 7). The frequency of maximum rainfall events however, was
observed to have slightly increased from period 1 to period 2 during the months of July and
August (Figure 8). This could be attributed to global climate change which triggered for more
intense rainfall.
Figure 5. Number of days with moderate rainfall (>60 mm/day) per year from
1976-2010.
Figure 6. Number of days with heavy rainfall (>180 mm/day) per year from 1976-2010.
Air Temperature
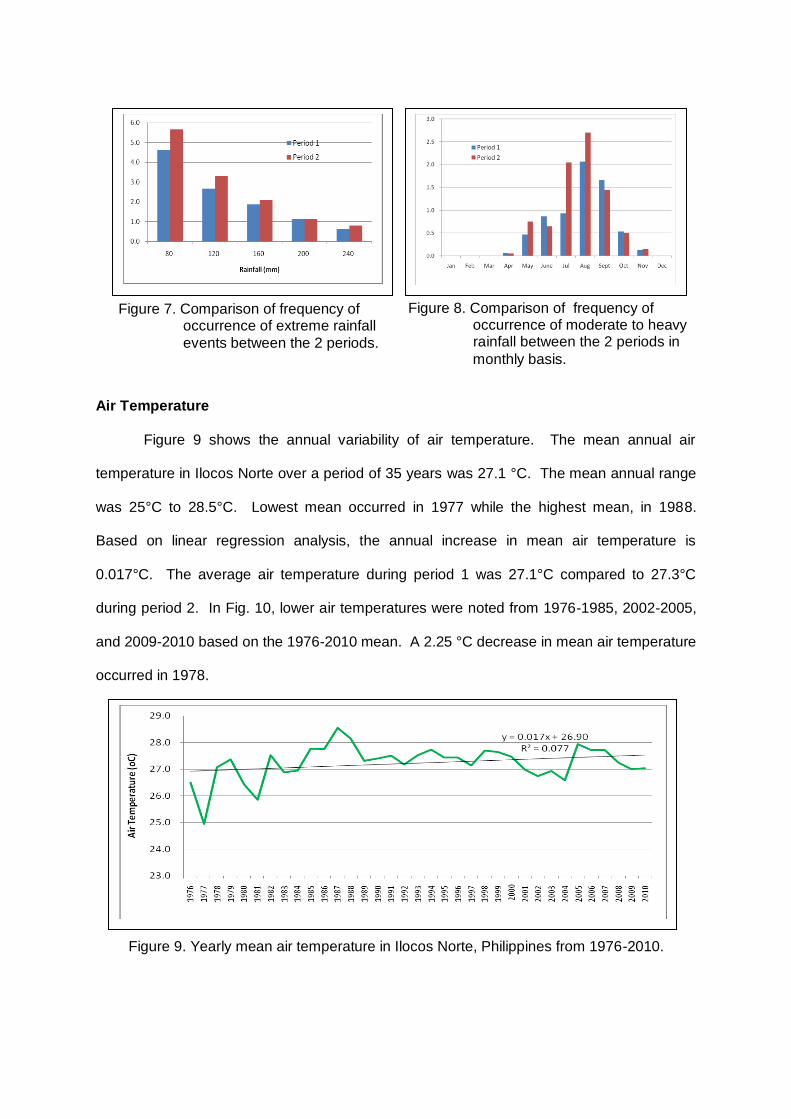
Figure 9 shows the annual variability of air temperature. The mean annual air
temperature in Ilocos Norte over a period of 35 years was 27.1 °C. The mean annual range
was 25°C to 28.5°C. Lowest mean occurred in 1977 while the highest mean, in 1988.
Based on linear regression analysis, the annual increase in mean air temperature is
0.017°C. The average air temperature during period 1 was 27.1°C compared to 27.3°C
during period 2. In Fig. 10, lower air temperatures were noted from 1976-1985, 2002-2005,
and 2009-2010 based on the 1976-2010 mean. A 2.25 °C decrease in mean air temperature
occurred in 1978.
Figure 7. Comparison of frequency of occurrence of extreme rainfall
events between the 2 periods.
Figure 8. Comparison of frequency of occurrence of moderate to heavy rainfall between the 2 periods in
monthly basis.
Figure 9. Yearly mean air temperature in Ilocos Norte, Philippines from 1976-2010.

Generally, from 1985-2000, mean air temperature increased variably from 0.2°C to
1.4 °C. A consistent increase (from 0.4 to 0.7) was noted from 2006-2008. More consistent
air temperature increase from 1985-2000 and 2006-2008 could be noted if mean air
temperature was based from Period 1 (Figure 11).
The mean annual maximum air temperature was 32.5°C. The range of maximum air
temperature was 31.4°C to 33.4°C, with the lowest recorded in 1981 and the highest in
1998, 2003, and 2004. Higher trend of maximum air temperature values occurred in 1998.
The increase in maximum air temperature was about 0.03°C annually (Figure 12). The
average maximum air temperature during Period 1 was 32.1°C compared to 32.7°C during
Period 2.
Figure 10. Yearly mean air temperature anomaly from the average mean air temperature of 1976-2010.
Figure 11. Yearly mean air temperature anomaly from the average mean air temperature of Period 1 (1976-1990).

From 1998-2008, maximum air temperature was consistently higher (0.3 to 0.9°C)
based on the 1976-2010 mean (Figure 13). However, based on Period 1 (Figure 14), an
increase in the maximum air temperature was evident from 1993-2010 (0.3 to 1.3°C) except
in 2009.
Figure 12. Yearly maximum air temperature in Ilocos Norte, Philippines from 1976-2010.
Figure 13. Yearly maximum air temperature anomaly from the average maximum air
temperature of 1976-2010.
Figure 14. Yearly maximum air temperature anomaly from the average maximum air
temperature of Period 1 (1976-1990).

Tropical Cyclones
Annually, the average number of tropical cyclones crossing and affecting Ilocos Norte
was 7. However, the average number of cyclones during period 2 had increased to 9
cyclones as compared to that of Period 1 which was 5. Based on linear regression analysis,
the annual increase on the number of cyclones crossing and affecting the study area was
0.288 (Figure 15). The number of tropical cyclones crossing and affecting Ilocos Norte
varies from 2-16 per year. Since 1990, anomaly increased from the normal was evident
(Figures 16-17).
Figure 15. Yearly number of tropical cyclones that passed or crossed Ilocos Norte
from 1981-2010.
Figure 16. Yearly frequency of tropical cyclones anomaly from the average tropical cyclones of 1981-2010.

Figure 18 shows that the number of tropical depressions, storms and typhoons
increased since 1990. Likewise, in Figure 19, it can be noted that tropical cyclones occurred
almost every month during the wet season since 1990. From 1981-1990, tropical cyclones
mostly occurred during the months of June to October but from 1991-2010, it started as early
as April (2003) and ended as late as December (2004 and 2006).
Figure 20 shows that the frequency of tropical cyclones increased except in June
when compared from the average of Period 1 and Period 2. The months of July, August and
September increased by almost one cyclone.
Comparing the probability of tropical cyclone occurrence between the two periods,
there was an evident increase from 10-40% tropical cyclone (Figure 21) either tropical
depression, tropical storm, or typhoon (Figures 22-24).
Figure 17. Yearly frequency of tropical cyclones anomaly from the average tropical
cyclones of 1981-1990.

Figure 18. Yearly number of tropical cyclones according to strength that passed or crossed Ilocos Norte from 1981-
2010 .

Figure 19. Number of monthly tropical cyclones in Ilocos Norte from 1981-2010.
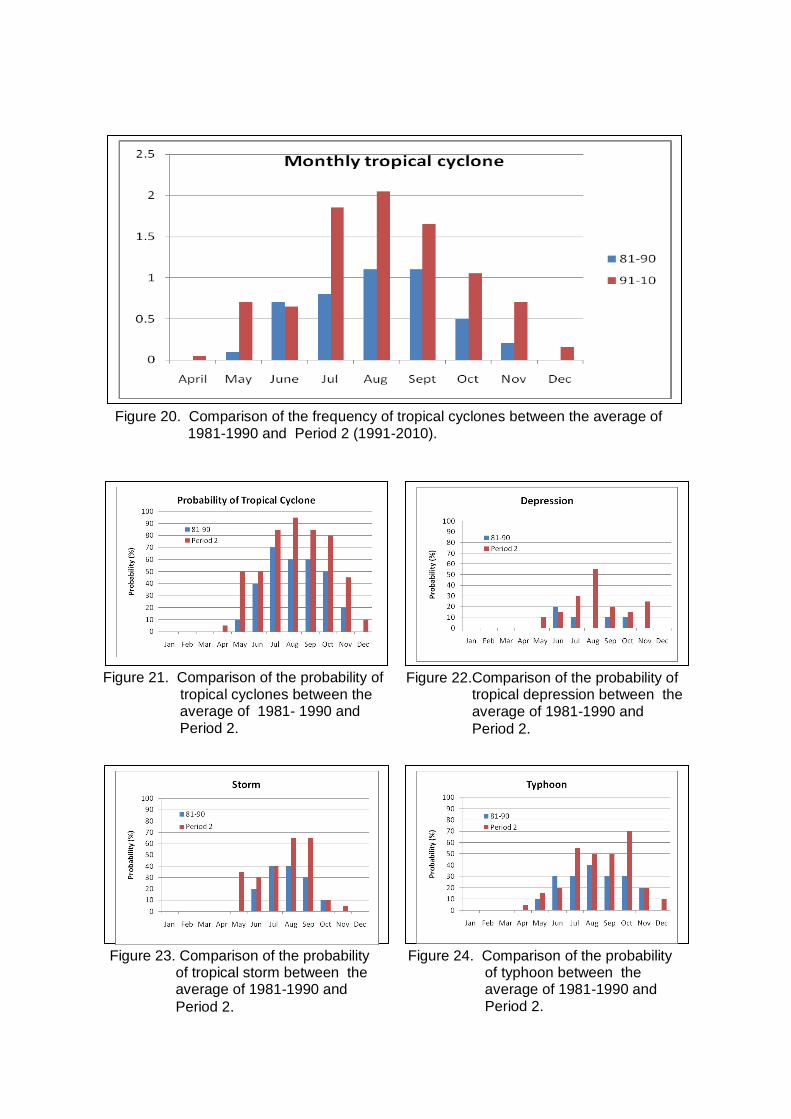
Figure 21. Comparison of the probability of tropical cyclones between the average of 1981- 1990 and Period 2.
Figure 22.Comparison of the probability of tropical depression between the average of 1981-1990 and
Period 2.
Figure 23. Comparison of the probability of tropical storm between the average of 1981-1990 and
Period 2.
Figure 24. Comparison of the probability of typhoon between the average of 1981-1990 and Period 2.
Figure 20. Comparison of the frequency of tropical cyclones between the average of 1981-1990 and Period 2 (1991-2010).

Cropping Calendar
Based from the result of the analysis of the rainfall data and tropical cyclone
occurrences, cropping calendar for a given agro-ecological zone was developed using the
data from 1991-2010 (Period 2). The cropping calendars presented below are the
modification of the cropping calendars developed by CG Acosta, et al.:
a. Submerge-prone lowlands. Cropping pattern with two (2) rice crops followed by a
drought resistant crop (mungbean) is recommended in relatively low lying areas (Figure
25). The first rice crop starts as early as the 3rd decade of June when rainfall is about to
set-in. Supplemental irrigation may be needed during seeding periods because there is
still high probability of having a 10-day dry spell. Transplanting is done as early as the
2nd decade of July. Rainfall will be sufficient during the vegetative and reproductive
stages of the rice crop considering a high rainfall amount during these stages. The risk
that a farmer may face due to early transplanting is the high probability of tropical
cyclone occurrences during panicle to early heading stages and wet soil condition at the
time of harvesting. Harvesting is done as early as the 2nd decade of October or towards
the end of October when rainfall begins to recede.
A second rice crop may start as early as the 1st decade of November. The
reproductive stage falls in the first decade of January. The ripening and harvesting
stages are favorable in the third decade of February to March.
b. Drought-prone lowlands. For relatively high lying areas, rice – upland crops (rice-garlic-
mungbean) is recommended (Figure 26). The first crop is rice which starts as early as
the 1st decade of July and then followed by garlic (or corn, pepper, tomato, eggplant)
which starts in the 3rd decade of November when rainfall already receded or 2nd decade
of November if garlic is planted right away after the harvest of rice. The probability of
tropical cyclones is negligible during these days. Although rainfall may occur in lesser
amounts, this may seem favorable for crop establishment.

Figure 25. Cropping calendar in submerge-prone lowlands.
Submerge-prone lowlands

Figure 26. Cropping calendar in drought-prone lowlands.
Drought-prone lowlands

With supplemental irrigation from shallow tubewells during periods of low moisture
from late December to February, garlic and other cash crops are expected to attain their
optimum yield.
Utilization of residual moisture is made possible by planting a drought tolerant crop
like mungbean from first decade of March through April. This crop is preferred during
these months.
c. Upland areas – A vegetable-based cropping pattern is recommended in upland or non-
bunded areas wherein water is hard to maintain. With this pattern, off-season
vegetables such as tomato, onion as shallots, ginger, gabi, peanut (unshelled), corn, etc.
can be planted (Figure 27).
Conclusion and Recommendations
The evidence of climate change is clearly shown in this study and consequences are
also alarming as it may hamper development effort in the province. Efficient use of water
resources as policies toward working land degradation and forest denudation should be
considered to minimize potential impact of climate change. On the other hand, the
information derived from the study and the cropping calendars developed are useful tools to
minimize the risk in farming, and helpful for agricultural planning and operation.
To showcase the importance of this information, it is therefore recommended that a
demo farm or pilot area be established to show the effectiveness of the proposed cropping
calendars. Likewise, a wider dissemination of the information through IEC, focus group
discussion, and print and broadcast media be done.
References
http://www.absoluteastronomy.com/topics/Climat_change_and_agriculture http://www.ecifm.rdg.ac.uk/climate_change.htm http://www.doe.gov.ph/cc/ccp.htm http://www.fao.org/docrep/W5183E/W5183e08.htm#lont term effect of high temperature on
crops http://www.gravity.wikia.com/wiki/Climate_ change_and_ agriculture CG Acosta, ES Galacgac, CM Pascual, HL Layaoen, RA Natividad. 2000. Agroclimatic
characterization for crop suitability assessment in Ilocos Norte

Figure 27. Cropping calendar in upland areas.