Embed Size (px)
Citation preview
Seediscussions,stats,andauthorprofilesforthispublicationat:https://www.researchgate.net/publication/280118055
Variablenutrientstoichiometry(carbon:nitrogen:phosphorus)acrosstrophiclevelsdeterminescommunityandecosystempropertiesinanoligotrophicmangrovesystem
ARTICLEinOECOLOGIA·JULY2015
ImpactFactor:3.09·DOI:10.1007/s00442-015-3379-2·Source:PubMed
READS
210
13AUTHORS,INCLUDING:
RobertE.Ulanowicz
UniversityofFlorida
172PUBLICATIONS6,986CITATIONS
SEEPROFILE
MyrnaEJacobson
UniversityofSouthernCalifornia
31PUBLICATIONS436CITATIONS
SEEPROFILE
IlkaCFeller
SmithsonianInstitution
89PUBLICATIONS2,316CITATIONS
SEEPROFILE
KarenLMcKee
UnitedStatesGeologicalSurvey
137PUBLICATIONS5,200CITATIONS
SEEPROFILE
Availablefrom:IsabelC.Romero
Retrievedon:09January2016

1 3
OecologiaDOI 10.1007/s00442-015-3379-2
ECOSYSTEM ECOLOGY - ORIGINAL RESEARCH
Variable nutrient stoichiometry (carbon:nitrogen:phosphorus) across trophic levels determines community and ecosystem properties in an oligotrophic mangrove system
U. M. Scharler1 · R. E. Ulanowicz2,3 · M. L. Fogel4,5 · M. J. Wooller6,7 · M. E. Jacobson‑Meyers8 · C. E. Lovelock9 · I. C. Feller10 · M. Frischer11 · R. Lee12 · K. McKee13 · I. C. Romero14 · J. P. Schmit15 · C. Shearer16
Received: 4 November 2014 / Accepted: 16 June 2015 © Springer-Verlag Berlin Heidelberg 2015
difference in C:N:P, and C, N, and P biomass, between the functional groups mangrove trees, other primary produc-ers, heterotrophs, and abiotic components. C:N:P decreased with increasing trophic level. Nutrient recycling in the food webs was highest for P, and high transfer efficiencies between trophic levels of P and N also indicated an over-all shortage of these nutrients when compared to C. Hetero-trophs were sometimes, but not always, limited by the same nutrient as the primary producers. Mangrove trees and the primary tree consumers were P limited, whereas the inver-tebrates consuming leaf litter and detritus were N limited. Most compartments were limited by P or N (not by C), and the relative depletion rate of food sources was fastest for P. P transfers thus constituted a bottleneck of nutrient transfer on Twin Cays. This is the first comprehensive ecosystem
Abstract Our study investigated the carbon:nitrogen: phosphorus (C:N:P) stoichiometry of mangrove island of the Mesoamerican Barrier Reef (Twin Cays, Belize). The C:N:P of abiotic and biotic components of this oligotrophic ecosystem was measured and served to build networks of nutrient flows for three distinct mangrove forest zones (tall seaward fringing forest, inland dwarf forests and a transi-tional zone). Between forest zones, the stoichiometry of primary producers, heterotrophs and abiotic components did not change significantly, but there was a significant
Communicated by Michael Madritch.
Electronic supplementary material The online version of this article (doi:10.1007/s00442-015-3379-2) contains supplementary material, which is available to authorized users.
* U. M. Scharler [email protected]
1 School of Life Sciences, University of KwaZulu-Natal, Westville Campus, Durban 4001, South Africa
2 Arthur R. Marshall Laboratory, Department of Biology, University of Florida, Gainesville, FL 32611-8525, USA
3 Chesapeake Biological Laboratory, University of Maryland Center for Environmental Science, Solomons, MD 20688-0038, USA
4 Geophysical Laboratory, Carnegie Institution of Washington, 5251 Broad Branch Road NW, Washington, DC 20015, USA
5 School of Natural Science, University of California at Merced, Merced, CA 95343, USA
6 School of Fisheries and Ocean Sciences, Institute of Marine Science, University of Alaska Fairbanks, Fairbanks, AK 99775-5860, USA
7 Alaska Stable Isotope Facility, Water and Environmental Research Center, University of Alaska Fairbanks, P.O. Box 755860, Fairbanks, AK 99775-5860, USA
8 University of Southern California Dana and David Dornsife College of Letters, Arts and Sciences, 3616 Trousdale Parkway AHF 139, Los Angeles, CA 90089-0371, USA
9 School of Biological Sciences, The University of Queensland, St Lucia, QLD 4072, Australia
10 Smithsonian Environmental Research Center, Edgewater, MD 21037, USA
11 Skidaway Institute of Oceanography, Savannah, GA 31411, USA
12 Center for Dark Energy Biosphere Investigations, University of Southern California, AHF 209, Los Angeles, CA 90089-0371, USA
13 US Geological Survey, National Wetlands Research Center, Lafayette, LA 70506, USA
14 College of Marine Science, University of South Florida, St Petersburg, FL 33701, USA
15 National Capital Region Inventory and Monitoring Network, National Park Service, 4598 MacArthur Boulevard NW, Washington, DC 20007, USA

Oecologia
1 3
study of nutrient transfers in a mangrove ecosystem, illus-trating some mechanisms (e.g. recycling rates, transfer effi-ciencies) which oligotrophic systems use in order to build up biomass and food webs spanning various trophic levels.
Keywords Oligotrophic environment · Recycling · Nutrient limitation · Mangrove food web · Transfer efficiency
Introduction
Nutrient dynamics in aquatic ecosystems have been stud-ied in recent decades mainly due to concerns over eutrophi-cation, resulting algal blooms and their impacts on other biotic communities. As such, eutrophic systems have gained much attention, especially with regards to the nutri-ent-algae link (e.g. Smith et al. 1999; Anderson et al. 2014). However, there are two areas regarding nutrient dynamics that have received less consideration. Higher trophic levels are rarely included in studies, and oligotrophic systems are relatively unrepresented in the literature. Nutrient dynam-ics in oligotrophic systems differ from those in eutrophic systems by having considerably lower availability of nutri-ents in their dissolved and non-living particulate form (e.g. Zhang et al. 2007). This lower nutrient availability implies that in order to satisfy nutrient demands of higher trophic levels, recycling rates should be high and transfers of nutri-ents efficient across trophic levels.
Studies of elemental stoichiometry in ecosystems, espe-cially that of macronutrients [i.e. carbon (C), nitrogen (N) and phosphorus (P)], have become important to explain a wide range of community and ecosystem properties. Such properties include taxa-specific variability and ontogenetic shifts, effects of consumer-driven nutrient cycling, and the integration of stoichiometric and metabolic theory to explain ecosystem functioning and stability (e.g. Sterner and Elser 2002; Vanni et al. 2002; Cross et al. 2005; Allen and Gillooly 2009; Hillebrand et al. 2009; Persson et al. 2010). In this regard, ecological stoichiometry is an integral part of community and food web ecology. In this paper we use C:N:P stoichiometry to infer both ecosystem and com-munity-level properties of recycling, transfer efficiency and nutrient limitation of a mangrove forest.
In the past, aquatic ecosystems have generally been divided into those that are limited, sensu Liebig, by N (marine) or P (freshwater). These generalisations were mostly derived from nutrient limitations investigated in growth experiments, or nutrient concentrations of algae
which were assumed to reflect their nutrient environment (Redfield 1934). However, nutrient limitations are not con-fined to primary producers, and can be exacerbated and sometimes switched at higher trophic levels. For example, algae may be N limited in a particular ecosystem, whereas fish in the same ecosystem may be P limited due to their higher requirement of P for bone synthesis (Ulanowicz and Baird 1999; Sterner and George 2000; Vanni et al. 2002). Limiting nutrients may vary between ecosystem compo-nents and it is difficult, if not impossible, to label an entire ecosystem as limited by one particular nutrient.
The overall aim of our study was to investigate the nutri-ent dynamics in an oligotrophic mangrove ecosystem. We established the stoichiometry (C:N:P) of biotic and abiotic ecosystem components and then used these data to calcu-late nutrient transfer efficiencies between trophic levels, stoichiometry at the various trophic levels and extent of recycling. We hypothesised that the nutrient stoichiometry changes between trophic levels and that recycling rates are higher for the limiting nutrients. Lastly, we investigated the changes of nutrient limitations of ecosystem components.
Materials and methods
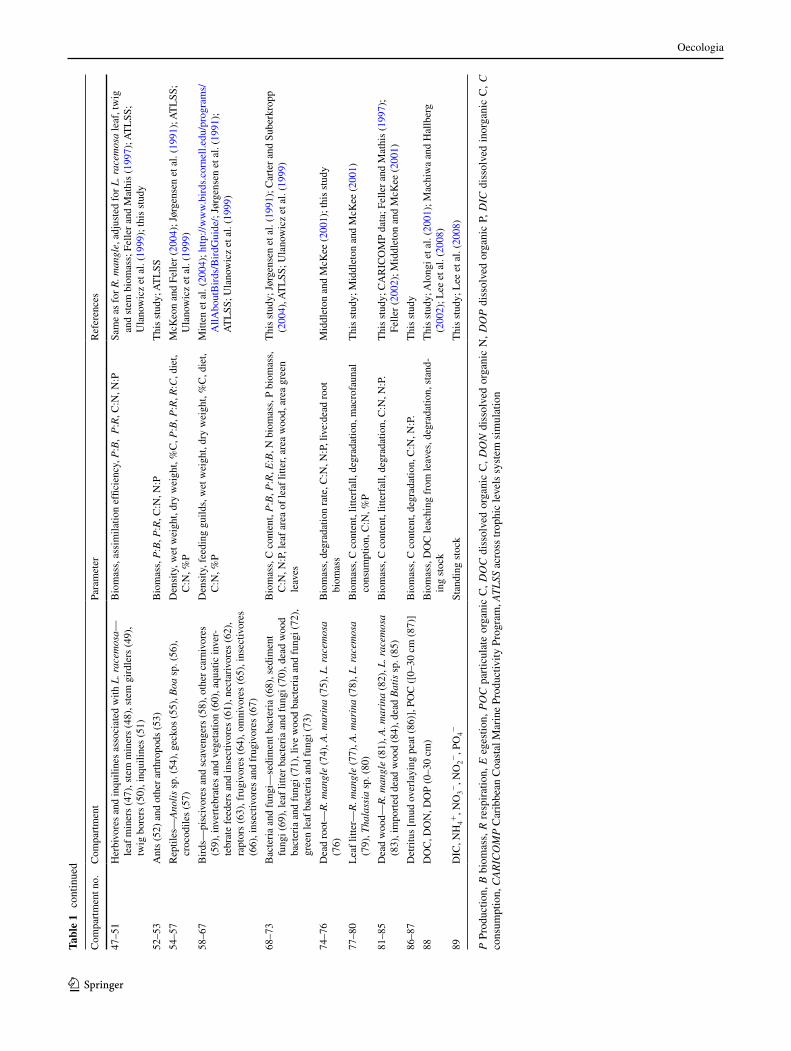
We established the stoichiometry (C:N:P) of the biotic and abiotic ecosystem components, and nutrient flows between them for three different forest zones on the mangrove islands Twin Cays, Belize. Data were gathered during a 5-year USA-National Science Foundation Biocomplexity programme, which included ten research groups focussing on biochemistry, physiology and ecology of various eco-system components (Table 1). Data emanating from this research served to establish the C:N:P stoichiometry of various abiotic and biotic components, and to build trophic-flow networks for three tree growth zones by quantifying standing stocks and trophic links.
Study site
This study was conducted on Twin Cays (16°50′N, 88°06′W), Belize, a 92-ha pair of mangrove islands situ-ated about 12 km offshore (MacIntyre et al. 2004) that is part of a system of mangrove islands between the Belizean mainland and the Mesoamerican barrier reef. In the 1990s, fertilisation experiments examined nutrient limitations of the mangrove trees in each of three forest zones (fringe, transition, dwarf) (Feller et al. 2002). These studies dem-onstrated that mangrove trees were N limited in the fringe zone, N+P limited in the adjacent transition zone, and P limited in the interior dwarf zone (Feller et al. 2002). The fringe zone on Twin Cays is composed primarily of Rhiz-ophora mangle L. (red mangrove), with lesser amounts of
16 Department of Plant Biology, University of Illinois at Urbana-Champaign, Room 265 Morrill Hall, 505 South Goodwin Avenue, Urbana, IL 61801, USA

Oecologia
1 3
Tabl
e 1
Dat
a so
urce
s fo
r st
ocks
and
flow
s us
ed to
bui
ld th
e ca
rbon
(C
), n
itrog
en (
N)
and
phos
phor
us (
P) n
etw
orks
for
the
frin
ge, t
rans
ition
and
dw
arf
man
grov
e fo
rest
zon
es
Com
part
men
t no.
Com
part
men
tPa
ram
eter
Ref
eren
ces
1R
hizo
phor
a m
angl
eL
eaf
biom
ass,
pro
duct
ion,
res
pira
tion,
woo
d bi
omas
s,
woo
d pr
oduc
tion,
C c
onte
nt, p
rop-
root
bio
mas
s, p
ropo
r-tio
n of
bel
owgr
ound
roo
t bio
mas
s, b
elow
grou
nd r
oot
prod
uctio
n, p
rop-
root
pro
duct
ion
P:B
, C:N
, nut
rien
t so
urce
s, N
:P
Thi
s st
udy;
CA
RIC
OM
P da
ta; C
intr
ón a
nd S
chae
ffer
N
ovel
li (1
984)
; Jin
-Eon
g et
al.
(199
5); F
elle
r an
d M
athi
s (1
997)
; Kol
tes
et a
l. (1
998)
; McK
ee e
t al.
(200
7); M
cKee
(2
011)
2A
vice
nnia
mar
ina
Woo
d/le
af b
iom
ass,
P:B
, P:R
, woo
d bi
omas
s, C
con
tent
, w
ood
litte
rfal
l, ro
ot b
iom
ass,
C:N
, nut
rien
t sou
rces
, N:P
Thi
s st
udy;
CA
RIC
OM
P da
ta; K
olte
s et
al.
(199
8); C
intr
ón
and
Scha
effe
r N
ovel
li (1
984)
; McK
ee e
t al.
(200
7);
McK
ee (
2011
)
3L
agun
cula
ria
race
mos
aW
ood/
leaf
bio
mas
s, P
:B, P
:R, w
ood
litte
rfal
l, ro
ot b
io-
mas
s, C
:N, n
utri
ent s
ourc
es, N
:PT
his
stud
y; C
AR
ICO
MP
data
; Kol
tes
et a
l. (1
998)
; Cin
trón
an
d Sc
haef
fer
Nov
elli
(198
4); M
cKee
et a
l. (2
007)
; M
cKee
(20
11)
4L
iche
nA
eria
l cov
erag
e, tr
ee s
urfa
ce, w
eigh
t, C
con
tent
, pho
tosy
n-th
etic
C g
ain,
mea
n di
el C
loss
, %N
, N:P
Thi
s st
udy;
Lan
ge e
t al.
(200
0)
5M
acro
alga
e—su
bmer
ged
P:B
, % c
over
, pro
duct
ion,
per
imet
er o
f is
land
, siz
e of
fr
inge
zon
e, C
:N, N
:P, e
xuda
tes
Thi
s st
udy;
Tay
lor
et a
l. (1
986)
; Litt
ler
et a
l. (1
985)
; Rod
ri-
guez
and
Fel
ler
(200
4); L
apoi
nte
et a
l. (1
992)
6M
acro
alga
e—B
ostr
ychi
aB
iom
ass,
pho
tosy
nthe
tic O
2 pr
oduc
tion/
cons
umpt
ion,
re
spir
atio
n, C
:N, N
:PT
his
stud
y; Z
ucca
rello
et a
l. (2
001)
7M
icro
bial
mat
sB
iom
ass,
pro
duct
ion,
res
pira
tion,
cov
erag
e, N
fixa
tion,
de
nitr
ifica
tion,
bio
mas
sT
his
stud
y; J
oye
and
Lee
(20
04);
Lee
(20
06);
Lee
and
Joy
e (2
006)
; Lee
et a
l. (2
008)
8H
eter
otro
phic
mic
rofa
una
B, P
, R, E
, C, C
:N, N
:PT
his
stud
y; A
TL
SS; U
lano
wic
z et
al.
(199
9)
9–12
Cra
bs—
Uca
spp
. (9)
, Uci
des
sp. (
10),
Gon
iops
is s
p. (
11),
A
ratu
s pi
soni
i (12
)D
ensi
ty, d
ry w
eigh
t, P
:B, R
:B, d
iet,
C:N
, %P
Thi
s st
udy;
McK
eon
and
Felle
r (2
004)
; McK
eon
pers
onal
co
mm
unic
atio
n; K
och
and
Wol
ff (
2002
); K
athi
resa
n an
d B
ingh
am (
2001
); N
ordh
aus
(200
4); M
cKee
(19
95)
13–1
5L
arge
r ga
stro
pods
—C
erit
hide
a sp
. (13
), L
itto
rina
ang
ulif
-er
a (1
4), M
elam
pus
coffe
us (
15)
Den
sity
, dry
wei
ght/C
con
tent
, ass
imila
tion
effic
ienc
y, P
:B
ratio
, die
t, C
:N, N
:PT
his
stud
y; K
ohlm
eyer
and
Beb
out (
1986
); A
TL
SS; U
lano
-w
icz
et a
l. (1
999)
16-2
8Fa
una
asso
ciat
ed w
ith le
af li
tter—
harp
actic
oid
cope
pods
(1
6), C
opep
oda
(17)
, Am
phip
oda
(18)
, Tan
aida
cea
(19)
, Is
opod
a (2
0), O
stra
coda
(21
), B
ival
via
(22)
, Gas
trop
oda
(23)
, Ply
chae
ta (
24),
Olig
ocha
eta
(25)
, Nem
atod
a (2
6),
flatw
orm
s (2
7), m
ites
(28)
.
Den
sity
, dry
wei
ght/C
con
tent
, ass
imila
tion
effic
ienc
y,
P:R
, C:N
, N:P
Thi
s st
udy;
Jør
gens
en e
t al.
(199
1); A
TL
SS; U
lano
wic
z et
al.
(199
9)
29–3
6Fa
una
asso
ciat
ed w
ith s
ubm
erge
d R
. man
gle
root
s—hy
droi
ds (
29),
ser
pulid
s (3
0), t
unic
ates
(31
), s
pong
es (
32),
se
a sl
ugs
(33)
, sea
urc
hins
(34
), w
ood-
bori
ng is
opod
s (3
5), L
epto
stra
ca (
36)
Inge
stio
n ra
te/b
ody
wei
ght,
cove
rage
, len
gth
of c
oast
line,
da
ily in
gest
ion
rate
, res
pira
tion
rate
, exc
retio
n ra
te, C
:N,
%P
Com
a et
al.
(199
8); E
lliso
n an
d Fa
rnsw
orth
(19
92);
Rod
ri-
guez
and
Fel
ler
(200
4); G
ili a
nd C
oma
(199
8); C
lark
and
D
eFre
ese
(198
7); M
cCla
naha
n (1
998)
; Jør
gens
en e
t al.
(199
1); P
erry
(19
88);
Sch
win
gham
er e
t al.
(198
6); K
ens-
ley
and
Scho
tte (
1989
); M
odlin
(19
96);
this
stu
dy
37–4
1H
erbi
vore
s an
d in
quili
nes
asso
ciat
ed w
ith R
. man
gle—
leaf
m
iner
s (3
7), s
tem
min
ers
(38)
, ste
m g
irdl
ers
(39)
, tw
ig
bore
rs (
40),
inqu
iline
s (4
1)
Den
sity
, dry
wei
ght,
%C
, ass
imila
tion
effic
ienc
y, d
ensi
ty
per
tree
, tre
e de
nsity
, P:B
, P:R
, C:N
, N:P
Thi
s st
udy;
Fel
ler
and
Mat
his
(199
7); F
elle
r (2
002)
; AT
LSS
; U
lano
wic
z et
al.
(199
9)
42–4
6H
erbi
vore
s an
d in
quili
nes
asso
ciat
ed w
ith A
. mar
ina—
leaf
m
iner
s (4
2), s
tem
min
ers
(43)
, ste
m g
irdl
ers
(44)
, tw
ig
bore
rs (
45),
inqu
iline
s (4
6)
Bio
mas
s, a
ssim
ilatio
n ef
ficie
ncy,
P:B
, P
:R, C
:N, N
:PSa
me
as f
or R
. man
gle,
adj
uste
d fo
r A
. mar
ina
leaf
, tw
ig
and
stem
bio
mas
s; F
elle
r an
d M
athi
s (1
997)
; AT
LSS
; U
lano
wic
z et
al.
(199
9); t
his
stud
y
Oecologia
1 3
P P
rodu
ctio
n, B
bio
mas
s, R
res
pira
tion,
E e
gest
ion,
PO
C p
artic
ulat
e or
gani
c C
, D
OC
dis
solv
ed o
rgan
ic C
, D
ON
dis
solv
ed o
rgan
ic N
, D
OP
dis
solv
ed o
rgan
ic P
, D
IC d
isso
lved
ino
rgan
ic C
, C
co
nsum
ptio
n, C
AR
ICO
MP
Car
ibbe
an C
oast
al M
arin
e Pr
oduc
tivity
Pro
gram
, AT
LSS
acr
oss
trop
hic
leve
ls s
yste
m s
imul
atio
n
Tabl
e 1
con
tinue
d
Com
part
men
t no.
Com
part
men
tPa
ram
eter
Ref
eren
ces
47–5
1H
erbi
vore
s an
d in
quili
nes
asso
ciat
ed w
ith L
. rac
emos
a—le
af m
iner
s (4
7), s
tem
min
ers
(48)
, ste
m g
irdl
ers
(49)
, tw
ig b
orer
s (5
0), i
nqui
lines
(51
)
Bio
mas
s, a
ssim
ilatio
n ef
ficie
ncy,
P:B
, P
:R, C
:N, N
:PSa
me
as f
or R
. man
gle,
adj
uste
d fo
r L
. rac
emos
a le
af, t
wig
an
d st
em b
iom
ass;
Fel
ler
and
Mat
his
(199
7); A
TL
SS;
Ula
now
icz
et a
l. (1
999)
; thi
s st
udy
52–5
3A
nts
(52)
and
oth
er a
rthr
opod
s (5
3)B
iom
ass,
P:B
, P:R
, C:N
, N:P
Thi
s st
udy;
AT
LSS
54–5
7R
eptil
es—
Ano
lis
sp. (
54),
gec
kos
(55)
, Boa
sp.
(56
),
croc
odile
s (5
7)D
ensi
ty, w
et w
eigh
t, dr
y w
eigh
t, %
C, P
:B, P
:R, R
:C, d
iet,
C:N
, %P
McK
eon
and
Felle
r (2
004)
; Jør
gens
en e
t al.
(199
1); A
TL
SS;
Ula
now
icz
et a
l. (1
999)
58–6
7B
irds
—pi
sciv
ores
and
sca
veng
ers
(58)
, oth
er c
arni
vore
s (5
9), i
nver
tebr
ates
and
veg
etat
ion
(60)
, aqu
atic
inve
r-te
brat
e fe
eder
s an
d in
sect
ivor
es (
61),
nec
tari
vore
s (6
2),
rapt
ors
(63)
, fru
givo
res
(64)
, om
nivo
res
(65)
, ins
ectiv
ores
(6
6), i
nsec
tivor
es a
nd f
rugi
vore
s (6
7)
Den
sity
, fee
ding
gui
lds,
wet
wei
ght,
dry
wei
ght,
%C
, die
t, C
:N, %
PM
itten
et a
l. (2
004)
; http
://w
ww
.bir
ds.c
orne
ll.ed
u/pr
ogra
ms/
AllA
bout
Bir
ds/B
irdG
uide
/; Jø
rgen
sen
et a
l. (1
991)
; A
TL
SS; U
lano
wic
z et
al.
(199
9)
68–7
3B
acte
ria
and
fung
i—se
dim
ent b
acte
ria
(68)
, sed
imen
t fu
ngi (
69),
leaf
litte
r ba
cter
ia a
nd f
ungi
(70
), d
ead
woo
d ba
cter
ia a
nd f
ungi
(71
), li
ve w
ood
bact
eria
and
fun
gi (
72),
gr
een
leaf
bac
teri
a an
d fu
ngi (
73)
Bio
mas
s, C
con
tent
, P:B
, P:R
, E:B
, N b
iom
ass,
P b
iom
ass,
C
:N, N
:P, l
eaf
area
of
leaf
litte
r, ar
ea w
ood,
are
a gr
een
leav
es
Thi
s st
udy;
Jør
gens
en e
t al.
(199
1); C
arte
r an
d Su
berk
ropp
(2
004)
, AT
LSS
; Ula
now
icz
et a
l. (1
999)
74–7
6D
ead
root
—R
. man
gle
(74)
, A. m
arin
a (7
5), L
. rac
emos
a (7
6)B
iom
ass,
deg
rada
tion
rate
, C:N
, N:P
, liv
e:de
ad r
oot
biom
ass
Mid
dlet
on a
nd M
cKee
(20
01);
this
stu
dy
77–8
0L
eaf
litte
r—R
. man
gle
(77)
, A. m
arin
a (7
8), L
. rac
emos
a (7
9), T
hala
ssia
sp.
(80
)B
iom
ass,
C c
onte
nt, l
itter
fall,
deg
rada
tion,
mac
rofa
unal
co
nsum
ptio
n, C
:N, %
PT
his
stud
y; M
iddl
eton
and
McK
ee (
2001
)
81–8
5D
ead
woo
d—R
. man
gle
(81)
, A. m
arin
a (8
2), L
. rac
emos
a (8
3), i
mpo
rted
dea
d w
ood
(84)
, dea
d B
atis
sp.
(85
)B
iom
ass,
C c
onte
nt, l
itter
fall,
deg
rada
tion,
C:N
, N:P
.T
his
stud
y; C
AR
ICO
MP
data
; Fel
ler
and
Mat
his
(199
7);
Felle
r (2
002)
; Mid
dlet
on a
nd M
cKee
(20
01)
86–8
7D
etri
tus
[mud
ove
rlay
ing
peat
(86
)], P
OC
([0
–30
cm (
87)]
Bio
mas
s, C
con
tent
, deg
rada
tion,
C:N
, N:P
.T
his
stud
y
88D
OC
, DO
N, D
OP
(0–3
0 cm
)B
iom
ass,
DO
C le
achi
ng f
rom
leav
es, d
egra
datio
n, s
tand
-in
g st
ock
Thi
s st
udy;
Alo
ngi e
t al.
(200
1); M
achi
wa
and
Hal
lber
g (2
002)
; Lee
et a
l. (2
008)
89D
IC, N
H4+
, NO
3−, N
O2−
, PO
4−St
andi
ng s
tock
Thi
s st
udy;
Lee
et a
l. (2
008)

Oecologia
1 3
Avicennia germinans (L.) Stearn. (black mangrove) and Laguncularia racemosa (L.) C.F. Gaertn. (white man-grove). The transition zone was populated by a mixture of the three tree species, and the interior dwarf zone by mono-specific stands of R. mangle.
Field data
Representative species of various functional groups (see Table 1) were sampled in each of the three forest zones and their dry weight per area was determined as described below.
Primary producers
Leaf, wood and root biomass (grams per square metre) was calculated for the mangrove tree species R. mangle, L. racemosa and A. germinans. Leaf biomass of R. man-gle was estimated from the leaf area index assessed using hemispherical photography analysed with the Hemiview software package (Delta T Devices, UK) and wood and prop-root biomass from allometric relationships based on tree height and diameter (Cintrón and Schaeffer Novelli 1984) measured on nine replicate trees in each forest zone. Wood biomass of A. germinans and L. racemosa was obtained from Caribbean Coastal Marine Productivity Pro-gram (CARICOMP) data (CARICOMP—UNESCO; see also Koltes et al. 1998). To determine belowground root biomass, 50-cm deep cores were taken with a Russian peat corer (cross-sectional area 5 cm2) in the transition zone, which contained primarily A. germinans and L. racemosa. Live and dead roots were separated from the background material, washed, dried at 80 °C, and weighed. Leaf pro-duction was measured from litterfall (CARICOMP data). Belowground accumulation rates of mangrove roots were determined using an implanted mass technique (McKee et al. 2007; McKee 2011).
Total lichen cover on the bark of trees was estimated for each tree species in the three different zones from per-cent cover estimations and an estimate of tree surface area, based on main stem height and diameter. Macroalgae were divided into two groups including submerged macroalgae and the most conspicuous intertidal macroalgae, Bostrychia sp., Bostrychia sp. biomass was measured in nine replicate 25 × 25-cm plots in each vegetation zone, whereas data on submerged macroalgae were taken from the literature (Table 1). Microbial mats were abundant on Twin Cays, especially in the dwarf zone, often building thick layers of floc (unconsolidated microbial layers). Coverage, bio-mass, productivity, respiration, N fixation, denitrification and P content of microbial mats were assessed (Joye and Lee 2004; Lee and Joye 2006; Lee et al. 2008). These mats
were dominated by cyanobacteria and exhibited high rates of primary production, respiration, and N fixation. Micro-bial mats exhibited unique stable isotopic signatures (Lee 2006) and contributed to ecosystem productivity, especially in the dwarf forest zone.
Heterotrophic compartments
The heterotrophic compartments of the habitats on Twin Cays consisted of several crab species, molluscs, fauna inhabiting leaf litter and detritus (micro-, meio- and mac-rofauna), arthropods utilising the mangrove trees as a food source or for shelter, reptiles, birds, bacteria and fungi, and in the fringe forest zone root-fouling organisms on sub-merged R. mangle roots. Mammals were not part of the Twin Cays food web due to a lack of land-based mammals. Fish were excluded from the network due to a lack of quan-titative data.
Densities of the largest and most conspicuous gastro-pods that were not part of the smaller litter fauna, namely Cerithidea sp., Littorina angulifera and Melampus cof-feus, were sampled in three transects across all three zones at the CARICOMP site where leaf litter was taken. Snails were dried at 60 °C, weighed, and stored for stable iso-tope analysis. Leaf litter fauna was sampled at eight tran-sects in April and November 2001. Three replicates were taken in the fringe, transition and dwarf zones. An area of 25 × 25 cm of leaf litter and underlying detritus (soft mud on peat surface) was sampled, and detritus and leaves were rinsed above a fine-mesh sieve (63 µM). The organisms were grouped into Harpacticoidea, Copepoda, Amphipoda, Isopoda, Tanaidacea, Ostracoda, Nematoda, Oligochaeta, Polychaeta, Gastropoda, Turbellaria and Acari. An ini-tial examination on invertebrate infauna in mangrove peat revealed extremely low numbers. As extraction of fauna from mangrove peat is highly time consuming, the fauna in mangrove peat was not included in this study.
Information on arthropods utilising the mangrove trees was collated from the literature (Feller and Mathis 1997; Feller 2002) and data generated during the present study. The density of leaf miners and stem miners on R. mangle was measured according to methods in Feller and Cham-berlain (2007). Tree density measurements obtained from CARICOMP (Koltes et al. 1998) were used to estimate arboreal arthropod density in each forest zone.
Biomass of sediment bacteria from peat samples was estimated by epifluorescent counting and biovolume esti-mation after staining with 4′,6-diamidino-2-phenylindole (Alongi 1988; see Online Resource 1). Bacteria associated with decaying leaf litter and fresh leaves were extracted similarly to peat samples, except that ten hole punches (0.625 cm diameter) from each leaf were formalin fixed.

Oecologia
1 3
Biomass of fungi was estimated by determining the activity of chitinase in the peat, following Miller et al. (1998). Estimation was a two-part process. First, enzyme activity in peat was measured in the field. Secondly, fungi from peat samples were cultivated, their enzyme activ-ity measured, standard curves were developed, and fungal biomass was calculated from enzyme activity (see Online Resource 1).
Abiotic components
Dead root biomass for A. germinans and L. racemosa was measured from cores taken in the transition zone as described above. Leaf litter sampled during the leaf litter invertebrate sampling was separated into R. mangle, A. ger-minans and L. racemosa trees and Thalassia sp., rinsed, dried at 60 °C and weighed. To measure dead wood bio-mass, dead wood on the ground and in the canopy was col-lected in three replicate 4 × 4-m plots in the three forest zones. The coarse woody debris was sorted by species, fresh and dry weight measured, and nutrient content deter-mined. Plots were resampled after 2 years in order to deter-mine input rate into each forest zone.
A thin layer termed ‘detritus’ sometimes overlaid the mangrove peat. The mass of this detrital layer was deter-mined by measuring the thickness of this layer, which ranged from 0 to 2 cm, and dry weight from a known vol-ume. The mangrove peat below the thin detrital layer was termed ‘particulate organic matter’, and its dry mass was determined by drying a known volume of peat.
Dissolved organic nutrients were measured using a high temperature catalytic oxidation system [for dis-solved organic C (DOC), and dissolved organic N] and ash hydrolysis-spectrophotometry for dissolved organic P (Lee et al. 2008). DOC leaching from leaves was determined from two decomposition experiments starting in April and November 2001, respectively (see Online Resource 1). Dissolved inorganic N [nitrate (NO3
−), nitrite (NO2−),
ammonia and phosphate (PO43−)] were measured using the
phenol hypochlorite method for ammonium, the cadmium reduction method for NO3
− + NO2−, spectrophotometry
for NO2−, and PO4
3− was analysed colorimetrically using the molybdate blue method (see Lee et al. 2008 for meth-odological details).
Determination of C, N, and P contents
Samples for total C, N and P analysis were dried at the Carrie Bow Cay field station laboratory at 50–80 °C in air, brought back to the Carnegie Institution of Washing-ton, where they were completely dried at 50 °C under N2. Samples were weighed (0.2–2 mg) into tin boats for fur-ther analysis (Wooller et al. 2003). The C and N contents
of primary producers, heterotrophs, and detrital compo-nents were measured using an elemental analyser (Carlo Erba 2500) attached to a Thermo Finnigan Delta Plus XL isotope ratio mass spectrometer (Fogel et al. 2008) (see Table 1 for exceptions). P content was analysed using methods modified from Aspila et al. (1976) for the vari-ous ecosystem components by comparing digestion of weighed, dried and combusted samples which were sub-sequently measured spectrophotometrically for total P concentration normalized for dry weight (see Table 1 for exceptions). Organic PO4
3− was determined by subtraction.
The C, N and P contents (as % of dry weight) were used to express the stoichiometry of individual compartments by weight, and to calculate C, N and P standing stock per area for each compartment in each forest zone.
Network building
We calculated biomass in C, N and P and quantified trophic and respiratory flows for all identified compartments (see Table 1). With these, balanced C, N and P budgets for all compartments and for all three forest zones were produced as described below.
Species abundance and biomass were measured for the components included in the networks. Productivity (P) and/or respiration (R) for certain species were meas-ured during this project and metabolic parameters not measured were estimated using P:biomass (P:B), P:R, and consumption (C):B ratios from the literature. Where C, N or P contents were not available for a certain com-partment, that of a compartment similar in feeding guild, taxonomic group and size was used. All biomass was expressed as grams of C or N or P per square metre and all flows as grams of C or N or P/square metre per year. Sources for data, ratios, and equations used to calcu-late flows are listed in Table 1. In addition to the trophic and respiratory flows, boundary flows were included as imports and/or exports to and from the systems (Online Resource 1).
Using this information, quantities were assigned to feeding links among and between biotic and abiotic com-partments following the method of Ulanowicz and Schar-ler (2008) (see Online Resource 1). This resulted in nine networks, i.e. a C, N and P network for each of the three mangrove forest zones. Networks were mass balanced so that the nutrient balance for autotrophic nodes becomes—gross primary production (GPP) = net primary production (NPP) + R; and for all heterotrophic nodes—consumption (C) = P + R + E. R is included only for the C networks; N networks feature gaseous exchange only for microbial mats (denitrification); and there is no gaseous exchange for P.

Oecologia
1 3
Calculation of nutrient limitations and limiting sources
To identify the element limiting a given recipient compart-ment, the criterion of Liebig (1840) is usually invoked. In the network context, this translates into finding the element with the longest residence, or turnover time, in the given compartment. Furthermore, the limiting flow originating from a particular source compartment was calculated. The Liebig procedure normally cannot be applied to identify which particular source of that limiting nutrient is most crucial to the given compartment. Ulanowicz and Abarca-Arenas (1997), however, generalised the Liebig procedure by showing that both limiting elements and limiting flows are those to which the overall biomass inclusive system ascendency is most sensitive (see Online Resource 1).
Ascendency is a system-level index that quantifies jointly the degree of trophic-flow organisation inherent in the network and its total system throughput (TST) (Hirata and Ulanowicz 1984). The theory of the ascendency index and associated calculations are outlined in Online Resource 1, whereas the specific equations (1, 2) used for the sensi-tivity calculations are presented here to demonstrate which changes in biomass and flows impact the ascendency value. Applying the ascendency calculations to identify (1) lim-iting nutrients and (2) limiting flows, the activities on the compartmental level are put into context of the ecosystem level. For each forest zone, the turnover time for each nutri-ent in each recipient compartment was calculated to iden-tify the limiting nutrient (1). In the ascendency calculation, an increased biomass of an element (k), and a slower turno-ver time of k in the node (p) compared to the turnover time of the entire system, contribute to a higher value of ascend-ency (Eq. 1; Online resource 1):
where AB is the biomass inclusive ascendency, Bpk the bio-mass of node p in terms of element k, T the total throughput and B the total biomass.
Nutrients with a faster turnover time compared to that of the system contribute negatively to the system’s ascend-ency, and nutrients with an equal turnover time in a com-partment to that of a system contribute a very small amount to the system’s ascendency. The system is therefore most sensitive to the slowest compartmental turnover times in relation to the system’s turnover time for the same element.
As the ascendency calculations in the identification of limiting nutrients have not yet been widely applied, we also calculated the turnover time for each compartment for comparison.
Then, the limiting flows (2) were calculated from the rate of depletion of a specific nutrient in a source node rela-tive to its standing stock, where the nutrient flow with the
(1)∂AB
∂Bpk
= 2
(
T...
B..
−1
2
Tpk + Tpk
Bpk
)
,
highest relative depletion rate constitutes the limiting flow (Ulanowicz and Abarca-Arenas 1997). This limiting flow results in a high ascendency value (Eq. 2; Online Resource 1).
The highest sensitivity value from the above equation is calculated for the limiting flow that depletes its source at the fastest rate compared to its availability.
The limiting nutrient, and the limiting flow are not nec-essarily the same, since Eq. 1 is calculated for recipient nodes, and Eq. 2 is calculated for source nodes (see details in Online Resource 1).
To investigate the stoichiometry of and transfer effi-ciencies between trophic levels, the individual compart-ments were then apportioned over the various trophic lev-els according to their feeding activity (Ulanowicz 1986; Ulanowicz and Kay 1991). Investigations on the elements C, N and P per trophic level, their transfer efficiencies and recycling rates were conducted by analysing all networks using the software WAND (Allesina and Bondavalli 2004).
Results
C:N:P stoichiometry of biota and trophic levels
General biotic and abiotic groups
The C:N:P stoichiometry differed strongly between living and non-living compartments in all three mangrove forest zones (Fig. 1). High SDs of mean C:N, C:P and N:P resulted from considerable variability of C:N:P within groups (as in Fig. 1). Therefore, results of a two-way ANOVA (on log-transformed data) showed statistically significant differ-ences only between the three major groups including pri-mary producers, heterotrophic compartments and abiotic compartments (C:N, F = 346.7, p < 0.001; C:P, F = 309.47, p < 0.001; N:P, F = 20.64, p < 0.001), but not between zones (p > 0.05) nor for a compartment groups × zone interaction (p > 0.05). Heterotrophs showed lower C:N and C:P and had less variable ratios than primary producers or abiotic compartments (Fig. 1).
Functional groups and compartments
R. mangle green and senescent leaves and microbial mats are two of the most important primary producer groups in terms of biomass and occur in all three forest zones (Table 2). The C:N for R. mangle green leaves was similar from one zone to another, whereas the C:N for microbial
(2)∂AB
∂Trp= log
(
TrpB2
T..BrBp
)

Oecologia
1 3
mats was halved in the dwarf zone compared to the fringe and transition zones. The C:P and N:P increased from the fringe to the dwarf zone for R. mangle green leaves, illustrating the relative decrease of P in the dwarf zone.
Microbial mats, however, showed a decreasing C:P and an increasing N:P from the fringe to the dwarf zone (Table 2), which is due to the greater presence of N and P relative to C. R. mangle leaf litter had higher C:N and C:P com-pared to those of green leaves in all three zones. Primary tree consumers (Fig. 1) had, in general, a higher C:N ratio, but a lower C:P and N:P ratio compared to organisms feed-ing primarily on leaf litter (Fig. 1) in all three zones. These ratios may reflect the lower P content in source material such as leaf litter compared to e.g. R. mangle green leaves (Table 2). The higher C:P and N:P of leaf litter in the dwarf zone compared to the fringe and transition zone support the assertion that there was a lower amount of available P in this zone. However, overall differences between C, N and P biomass (in grams per square metre; Online Resource 2) of all compartments were not statistically different between the three forest zones (p > 0.05), but there were significant differences (for C, F = 81.38, p < 0.001; for N, F = 47.79, p < 0.001; for P, F = 39.88, p < 0.001) between functional groups (trees, other primary producers, heterotrophs, abi-otic compartments). Across trophic levels, both N and P were incorporated in higher relative proportions compared to C in organisms feeding on trophic levels ≥II (Fig. 2). In addition, P is accumulated at a higher rate relative to N in heterotrophs in comparison to trophic level I (Fig. 2).
Nutrient limitations
Limiting nutrient of recipient compartment: ascendency calculations
The nutrient limitation of individual compartments was calculated by the system ascendency’s sensitivity to changes in turnover rates of a particular nutrient in a particular compartment, and also by calculating com-partmental turnover rates for each nutrient and compart-ment as a reference. From the ascendency analysis it was apparent that in all zones mangrove trees were primarily P limited. Sensitivity values for N were in most cases slightly lower, in contrast to those for C, which diverged considerably more, indicating a possible co-limitation by N (Online Resource 2). Similarly, microbial mats were P limited, and their co-limitation by N was less pronounced compared to that of mangrove trees. Sensitivity values for N and P were more similar at higher trophic levels
a
b
c
Fig. 1 Mean (±SD) of C:N (a), C:P (b) and N:P (c), by weight, for major abiotic and biotic groups in the fringe, transition and dwarf zone. MT Mangrove trees, OPP other primary producers, CR crabs, GA gastropods, LF litter fauna, SMF sessile macrofauna, MMF mobile macrofauna, IN insects, OA other arthropods, RE reptiles, BI birds, BF bacteria and fungi, AB abiotic
Table 2 C:N:P (by weight) of two primary producer groups (R. mangle leaves and microbial mats) and R. mangle leaf litter in the three mangrove forest zones on Twin Cays, Belize
Mangrove forest zones R. mangle green leaves R. mangle leaf litter Microbial mats
C:N C:P N:P C:N C:P N:P C:N C:P N:P
Fringe 46.7 1570.2 33.6 58.4 4018.5 68.8 21.7 479.9 22.1
Transition 45.2 1537.6 34.0 76.4 4697.4 61.5 19.9 390.9 19.6
Dwarf 45.4 2136.5 47.1 63.8 6037.0 94.6 11.6 391.8 33.1

Oecologia
1 3
(indicating a higher degree of co-limitation by P and N) and were most similar at the highest trophic levels (rep-tiles, selected compartments of birds, crabs, leaf litter fauna, insects; Fig. 3). Bacteria and fungi (compartments 68–73) were P limited throughout all zones, as were the first-order consumers of trees (insects consuming green leaves, twigs and wood, compartments 37–51). Crabs, larger gastropods and leaf litter fauna (compartments 9–28) were limited by N. More than 50 % of reptile and bird compartments (compartments 54–67) were limited by N, followed by C and P. The fauna associated with submerged R. mangle prop roots in the fringe zone (com-partments 29–36) were limited by P.
Limiting nutrient of recipient compartment: turnover/biomass calculations
There was nearly a 100 % overlap in the compartmental nutrient limitations derived from ascendency analysis and those calculated by individually comparing supply (total input stoichiometry) to requirement (biomass stoichiom-etry) for comparison (Online Resource 2). Only one of 174 compartmental nutrient limitations of all three forest zones differed and showed C limitation from the sensitivity value, and P limitation from the calculation of turnover rates. The latter were very similar for the two elements, differing by only 0.3 %. In summary, both P and N showed slower turnover rates in individual compartments in relation to the system from the ascendency analysis, causing nutrient limi-tation. Nutrient limitations apparent from the stoichiometry calculation of supply and requirement (the check to the sensitivity values) arise when the stoichiometry of the flow entering a compartment is dissimilar to the stoichiometry of the node.
Limiting flows emanating from source compartment: ascendency calculations
The limiting flows in the systems, which convey the high-est depletion rate of a nutrient from a source compartment in relation to depletion of other sources (Ulanowicz and Abarca-Arenas 1997), were almost exclusively those for P transport (P, 97 %; N, 2 %; C, 0 %). The proportionally
a
b
c
Fig. 2 Mean (±SD) of C:N (a), C:P (b) and N:P (c), by weight, across trophic levels for the fringe, transition and dwarf zone
a
b
c
Fig. 3 Sensitivity values for C (a), N (b) and P (c) for all compart-ments. Compartments have been plotted according to the trophic level they belong to. Sensitivity values are given in Online Resource 2. Fr Fringe, Tr transition, Dw dwarf
Oecologia
1 3
highest depletion rate, and therefore possible bottlenecks in P transport in all three zones predominantly originated from the sediment bacteria and fungi compartments (68–73), followed by non-living compartments (74–89) and insect compartments (37–52). Overall, of the three nutrients inves-tigated, P was depleted at the fastest rate from the various source compartments, highlighting P transfers between compartments as bottlenecks in the Twin Cays ecosystem.
Ecosystem‑level characteristics
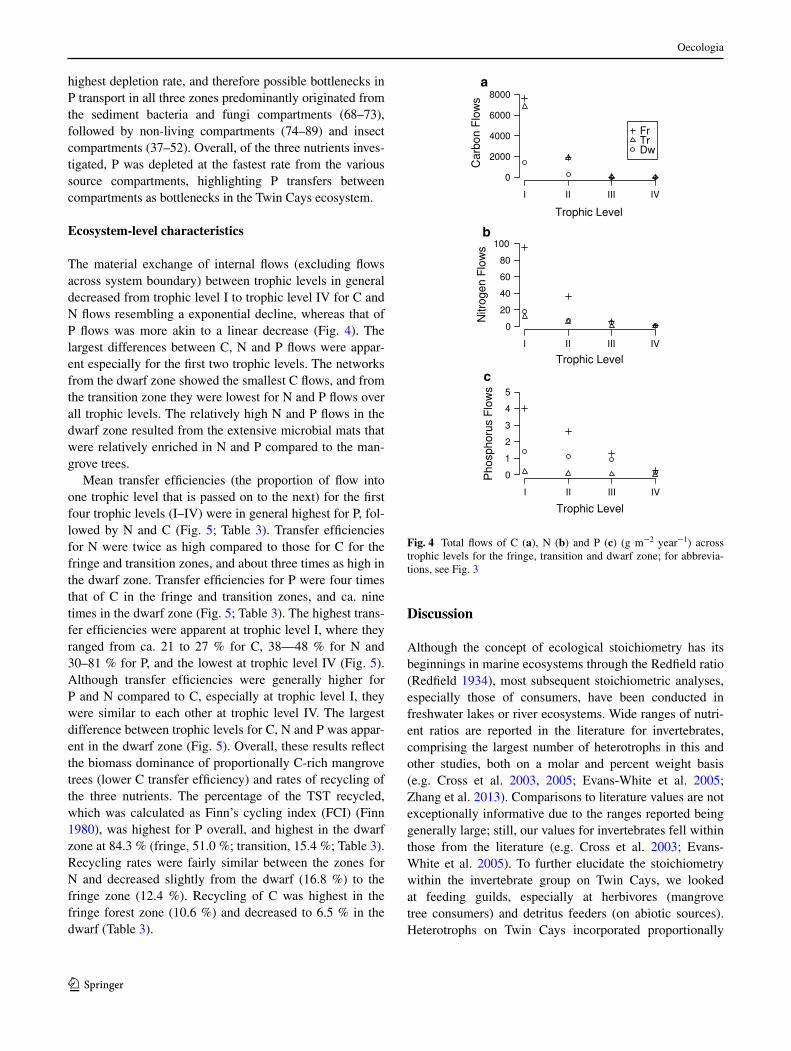
The material exchange of internal flows (excluding flows across system boundary) between trophic levels in general decreased from trophic level I to trophic level IV for C and N flows resembling a exponential decline, whereas that of P flows was more akin to a linear decrease (Fig. 4). The largest differences between C, N and P flows were appar-ent especially for the first two trophic levels. The networks from the dwarf zone showed the smallest C flows, and from the transition zone they were lowest for N and P flows over all trophic levels. The relatively high N and P flows in the dwarf zone resulted from the extensive microbial mats that were relatively enriched in N and P compared to the man-grove trees.
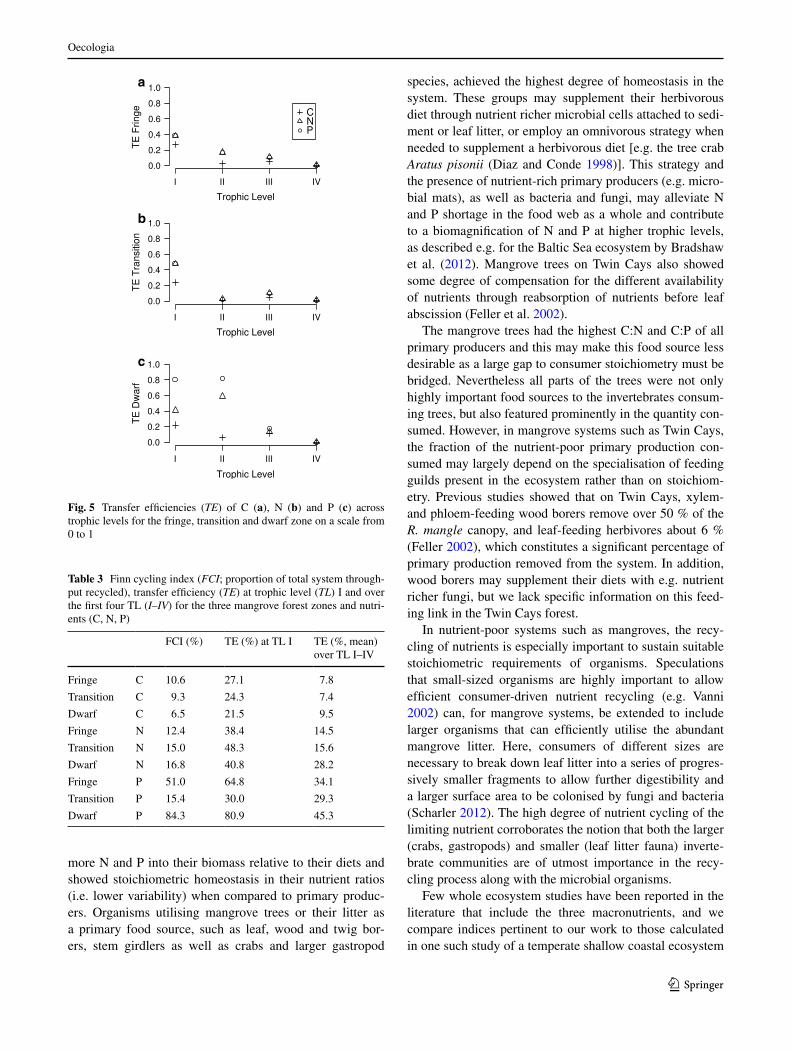
Mean transfer efficiencies (the proportion of flow into one trophic level that is passed on to the next) for the first four trophic levels (I–IV) were in general highest for P, fol-lowed by N and C (Fig. 5; Table 3). Transfer efficiencies for N were twice as high compared to those for C for the fringe and transition zones, and about three times as high in the dwarf zone. Transfer efficiencies for P were four times that of C in the fringe and transition zones, and ca. nine times in the dwarf zone (Fig. 5; Table 3). The highest trans-fer efficiencies were apparent at trophic level I, where they ranged from ca. 21 to 27 % for C, 38—48 % for N and 30–81 % for P, and the lowest at trophic level IV (Fig. 5). Although transfer efficiencies were generally higher for P and N compared to C, especially at trophic level I, they were similar to each other at trophic level IV. The largest difference between trophic levels for C, N and P was appar-ent in the dwarf zone (Fig. 5). Overall, these results reflect the biomass dominance of proportionally C-rich mangrove trees (lower C transfer efficiency) and rates of recycling of the three nutrients. The percentage of the TST recycled, which was calculated as Finn’s cycling index (FCI) (Finn 1980), was highest for P overall, and highest in the dwarf zone at 84.3 % (fringe, 51.0 %; transition, 15.4 %; Table 3). Recycling rates were fairly similar between the zones for N and decreased slightly from the dwarf (16.8 %) to the fringe zone (12.4 %). Recycling of C was highest in the fringe forest zone (10.6 %) and decreased to 6.5 % in the dwarf (Table 3).
Discussion
Although the concept of ecological stoichiometry has its beginnings in marine ecosystems through the Redfield ratio (Redfield 1934), most subsequent stoichiometric analyses, especially those of consumers, have been conducted in freshwater lakes or river ecosystems. Wide ranges of nutri-ent ratios are reported in the literature for invertebrates, comprising the largest number of heterotrophs in this and other studies, both on a molar and percent weight basis (e.g. Cross et al. 2003, 2005; Evans-White et al. 2005; Zhang et al. 2013). Comparisons to literature values are not exceptionally informative due to the ranges reported being generally large; still, our values for invertebrates fell within those from the literature (e.g. Cross et al. 2003; Evans-White et al. 2005). To further elucidate the stoichiometry within the invertebrate group on Twin Cays, we looked at feeding guilds, especially at herbivores (mangrove tree consumers) and detritus feeders (on abiotic sources). Heterotrophs on Twin Cays incorporated proportionally
a
b
c
Fig. 4 Total flows of C (a), N (b) and P (c) (g m−2 year−1) across trophic levels for the fringe, transition and dwarf zone; for abbrevia-tions, see Fig. 3
Oecologia
1 3
more N and P into their biomass relative to their diets and showed stoichiometric homeostasis in their nutrient ratios (i.e. lower variability) when compared to primary produc-ers. Organisms utilising mangrove trees or their litter as a primary food source, such as leaf, wood and twig bor-ers, stem girdlers as well as crabs and larger gastropod
species, achieved the highest degree of homeostasis in the system. These groups may supplement their herbivorous diet through nutrient richer microbial cells attached to sedi-ment or leaf litter, or employ an omnivorous strategy when needed to supplement a herbivorous diet [e.g. the tree crab Aratus pisonii (Diaz and Conde 1998)]. This strategy and the presence of nutrient-rich primary producers (e.g. micro-bial mats), as well as bacteria and fungi, may alleviate N and P shortage in the food web as a whole and contribute to a biomagnification of N and P at higher trophic levels, as described e.g. for the Baltic Sea ecosystem by Bradshaw et al. (2012). Mangrove trees on Twin Cays also showed some degree of compensation for the different availability of nutrients through reabsorption of nutrients before leaf abscission (Feller et al. 2002).
The mangrove trees had the highest C:N and C:P of all primary producers and this may make this food source less desirable as a large gap to consumer stoichiometry must be bridged. Nevertheless all parts of the trees were not only highly important food sources to the invertebrates consum-ing trees, but also featured prominently in the quantity con-sumed. However, in mangrove systems such as Twin Cays, the fraction of the nutrient-poor primary production con-sumed may largely depend on the specialisation of feeding guilds present in the ecosystem rather than on stoichiom-etry. Previous studies showed that on Twin Cays, xylem- and phloem-feeding wood borers remove over 50 % of the R. mangle canopy, and leaf-feeding herbivores about 6 % (Feller 2002), which constitutes a significant percentage of primary production removed from the system. In addition, wood borers may supplement their diets with e.g. nutrient richer fungi, but we lack specific information on this feed-ing link in the Twin Cays forest.
In nutrient-poor systems such as mangroves, the recy-cling of nutrients is especially important to sustain suitable stoichiometric requirements of organisms. Speculations that small-sized organisms are highly important to allow efficient consumer-driven nutrient recycling (e.g. Vanni 2002) can, for mangrove systems, be extended to include larger organisms that can efficiently utilise the abundant mangrove litter. Here, consumers of different sizes are necessary to break down leaf litter into a series of progres-sively smaller fragments to allow further digestibility and a larger surface area to be colonised by fungi and bacteria (Scharler 2012). The high degree of nutrient cycling of the limiting nutrient corroborates the notion that both the larger (crabs, gastropods) and smaller (leaf litter fauna) inverte-brate communities are of utmost importance in the recy-cling process along with the microbial organisms.
Few whole ecosystem studies have been reported in the literature that include the three macronutrients, and we compare indices pertinent to our work to those calculated in one such study of a temperate shallow coastal ecosystem
a
b
c
Fig. 5 Transfer efficiencies (TE) of C (a), N (b) and P (c) across trophic levels for the fringe, transition and dwarf zone on a scale from 0 to 1
Table 3 Finn cycling index (FCI; proportion of total system through-put recycled), transfer efficiency (TE) at trophic level (TL) I and over the first four TL (I–IV) for the three mangrove forest zones and nutri-ents (C, N, P)
FCI (%) TE (%) at TL I TE (%, mean) over TL I–IV
Fringe C 10.6 27.1 7.8
Transition C 9.3 24.3 7.4
Dwarf C 6.5 21.5 9.5
Fringe N 12.4 38.4 14.5
Transition N 15.0 48.3 15.6
Dwarf N 16.8 40.8 28.2
Fringe P 51.0 64.8 34.1
Transition P 15.4 30.0 29.3
Dwarf P 84.3 80.9 45.3

Oecologia
1 3
of the Sylt-Rømø Bight, Germany (Baird et al. 2008). We calculated a higher TST for C (from two to ten times), highest contributors to which were the mangrove trees and throughputs through the dissolved organic and inorganic nutrient compartments. On the contrary, the TST of N and P were considerably lower on Twin Cays (0.1–0.5 times for N and 0.01–0.2 times for P) compared to the Sylt-Rømø Bight. Recycling of nutrients (as FCI) was lower on Twin Cays for C and N as compared to the Sylt-Rømø Bight, and recycling of P was comparable only for the Twin Cays dwarf zone (ca. 80 %), but lower in the fringe and transi-tion zones. Mangrove trees, which contribute a consider-able amount to throughput, have overall lower recycling rates compared to the prominent primary producers in the Sylt-Rømø Bight. When comparing the FCI normalised by P, we obtained a C:N:PFCI of 0.2:0.5:1 for the Bight, and 0.2:0.3:1 for Twin Cays (mean of zones). N recycling was thus proportionally lower on Twin Cays, perhaps as a result of the microbial mat activities. The recycling of N was, however, lower only in the fringe and dwarf zones (0.2:0.2:1 and 0.1:0.2:1, respectively), whereas it was high-est in the transition zone (0.6:1:1). In the fringe, there was probably some N supplied by the sea, whereas in the dwarf zone it was supplied by the extensive microbial mats.
A comparison of the nutrient limitations between the oligotrophic Twin Cays system to one such other study of the meso- to eutrophic Chesapeake Bay system (Ulanowicz and Baird 1999) revealed both similarities and differences. In both ecosystems, about 50 % of recipient compartments were limited by P. However, a large proportion of these comprised fish species in the Chesapeake system, which were absent from the Twin Cays model. Only 3 % of com-partments were C limited in the former, whereas 12 % were C limited on Twin Cays. The limiting flows from the source compartments revealed further differences. Where 98 % of flows from source compartments were P limited on Twin Cays, this amounted to 52 % for P, and 43 % for N in Ches-apeake Bay (Ulanowicz and Baird 1999). Although the two studies used the same algorithms to calculate nutrient limitations, there are two major differences due to network construction which may influence this comparison. Firstly, the network structure is different, which is mainly due to the nature of the ecosystems (e.g. mangrove trees and asso-ciated insects, lack of water column on Twin Cays). Sec-ondly, whereas for the Twin Cays networks, the integrity of the measured stoichiometry of compartments was car-ried through network building and the layered balancing procedure (Online Resource 1), the Chesapeake C, N and P networks were constructed and balanced separately (Ulano-wicz, personal communication).
Recycling was an important mechanism on Twin Cays to provide adequate amounts of nutrients to the food web, aided by the relatively high transfer efficiencies of
especially N and P between trophic levels, resulting in a substantial decrease of C:N and C:P at trophic levels ≥II. Calculations of the compartmental nutrient limitations have revealed the dominance of P limitation, followed by N, implying that both P and N demands are sometimes unmet. Efficiencies of transfer were of similar magnitude at all trophic levels, but higher for P in the dwarf forest zone compared to the fringe or transition forest zones. In a previ-ous study, the severe P limitation of mangrove trees in the dwarf forest zone has been highlighted through fertilisation experiments and growth responses, and a N or N+P limita-tion in the fringe and transition zones (Feller et al. 2002). Although our study calculated P limitations for all trees in all forest zones, the sensitivity coefficients for N were very close to those of P. The analysis of limiting flows on the other hand showed that P was depleted proportionally the fastest from most compartments, revealing an overall shortage of P on Twin Cays. The microbial mats on the other hand may have contributed to the enrichment in N relative to P across the food web supporting various trophic levels. Overall, the P limitation of the primary producers was repeated in some, but not all compartments at higher trophic levels. Although the first-order tree consumers were similarly limited by P, the leaf litter consumers (crabs, larger gastropods, leaf litter fauna) were limited by N. This pattern was repeated in all forest zones.
In conclusion, we found high recycling rates for the nutrient that showed higher transfer efficiencies and was the limiting nutrient. The compartmental nutrient limitation of the primary producers was repeated for some, but not for all higher trophic level groups. Significant differences in C:N:P were found between primary producers, hetero-trophs and abiotic compartments, however not between forest zones. C:N:P decreased with trophic level, where the largest differences between trophic levels were appar-ent for C:P. The analysis of flows revealed a comparatively faster source node depletion rate for P. P was thus the limit-ing flow constituting a bottleneck for nutrient transfers in the Twin Cays ecosystem which possibly influences food web structure (e.g. Sterner and Elser 2002), and population (Andersen et al. 2004) and system growth.
The results and conclusions from this study are based on networks that were partly constructed from system-specific data, and partly from data originating from the literature. As it is not possible to measure each flow in a network, supplements from the literature are in general necessary in ecological network analysis; however, these may intro-duce errors in model structure. In addition, another com-mon drawback in network construction, applicable to the Twin Cays networks, is the lack of species-specific infor-mation for each single species and changes thereof over time, resulting in a temporal snapshot. The interpretations from our study arose from networks that were constructed
Oecologia
1 3
as best as possible within the framework of this study. To increase the level of confidence more system-specific data are needed, especially increased temporal resolution would assist in interpreting variability.
Author contribution statement U. M. S. collated data, built and analysed networks, and wrote the manuscript. R. E. U. developedthe network analysis methodology. All authors provided input data to the network analysis andto the manuscript.
Acknowledgments Funding for this study was provided by a US-National Science Foundation Biocomplexity grant (DEB-998 1483). Fieldwork was conducted on the Carrie Bow Cay field station of the Smithsonian Institute. M. Carpenter and A. Chamberlain, Q. Roberts, V. Brenneis, B. Smallwood and D. Thornton are gratefully acknowledged for assistance in the field. Q. Roberts, V. Brenneis and P. Zelanko helped with C and N elemental analysis at the Geo-physical Laboratory, Carnegie institution of Washington. M. F. and M. J. W. gratefully acknowledge support from the Smithsonian Insti-tution’s Loeb Fellowship and the Carnegie Institution of Washington, M. E. J. M. gratefully acknowledges the laboratory of D. Capone for material and instrumental support. Any use of trade, product, or firm names is for descriptive purposes only and does not imply endorse-ment by the US government.
References
Allen AP, Gillooly JF (2009) Towards an integration of ecological sto-ichiometry and the metabolic theory of ecology to better under-stand nutrient cycling. Ecol Lett 12:369–384
Allesina S, Bondavalli C (2004) WAND: an ecological network analy-sis user-friendly tool. Environ Model Softw 19:337–340
Alongi DM (1988) Bacterial productivity and microbial biomass in tropical mangrove sediments. Microb Ecol 15:59–79
Alongi DM, Wattayakorn G, Pfitzner J et al (2001) Organic carbon accumulation and metabolic pathways in sediments of mangrove forests in southern Thailand. Mar Geol 179:85–103
Andersen T, Elser JJ, Hessen DO (2004) Stoichiometry and popula-tion dynamics. Ecol Lett 7:884–900
Anderson DM, Glibert PM, Burkholder JM (2014) Nutrient sources, harmful algal blooms and eutrophication: composition, and con-sequences. Estuaries 25:704–726
Aspila K, Agemian H, Chau A (1976) A semi-automated method for the determination of inorganic, organic and total phosphatein sediments. Analyst 101:186–197
ATLSS (across trophic levels system simulation). http://www.cbl.umces.edu/~atlss/ATLSSdetail.html. Accessed July 2010
Baird D, Asmus H, Asmus R (2008) Nutrient dynamics in the Sylt-Rømø Bight ecosystem, German Wadden Sea: an ecological net-work analysis approach. Estuar Coast Shelf Sci 80:339–356
Bradshaw C, Kautsky U, Kumblad L (2012) Ecological stoichiometry and multi-element transfer in a coastal ecosystem. Ecosystems 15:591–603
Carter MD, Suberkropp K (2004) Respiration and annual fungal pro-duction associated with decomposing leaf litter in two streams. Freshwater Biol 49:1112–1122
Cintrón G, Schaeffer Novelli Y (1984) Methods for studying mangrove structure. In: Snedaker SC, Snedaker JG (eds) Mangrove ecosys-tem: research methods. UNESCO/SCOR, Paris, pp 91–113
Clark KB, DeFreese D (1987) Population ecology of Caribbean Asco-glossa (Mullusca: Opisthobranchia): a study of specialized algal herbivores. Am Malacol Bull 5:259–280
Coma R, Ribes M, Gili J-M, Zabala M (1998) An energectic approach tot he study of life-history traits of two modular colonial benthic invertebrates. Mar Ecol Prog Ser 162:89–103
Cross WF, Benstead JP, Rosemond AD, Bruce Wallace J (2003) Con-sumer-resource stoichiometry in detritus-based streams. Ecol Lett 6:721–732
Cross WF, Benstead JP, Frost PC, Thomas SA (2005) Ecological stoichiometry in freshwater benthic systems: recent progress and perspectives. Freshwater Biol 50:1895–1912
Diaz H, Conde JE (1998) On the food sources for the mangrove tree crab Aratus pisonii (Brachyura: Grapsidae). Biotropica 20:348–350
Ellison AM, Farnsworth EJ (1992) The ecology of Belizean mangrove-root fouling communities: patterns of epibiont distribution and abundance, and effects on root growth. Hydrobiologia 247:87–98
Evans-White MA, Stelzer RS, Lamberti GA (2005) Taxonomic and regional patterns in benthic macroinvertebrate elemental compo-sition in streams. Freshwater Biol 50:1786–1799
Feller IC (2002) The role of herbivory by wood-boring insects in mangrove ecosystems in Belize. Oikos 97:167–176
Feller IC, Chamberlain A (2007) Herbivore responses to nutrient enrichment and landscape heterogeneity in a mangrove ecosys-tem. Oecologia 153:607–616
Feller IC, Mathis WN (1997) Primary herbivory by wood-boring insects along an architectural gradient of Rhizophora mangle. Biotropica 29:440–451
Feller IC, McKee KL, Whigham DF, O’Neill JP (2002) Nitrogen vs. phosphorus limitation across an ecotonal gradient in a mangrove forest. Biogeochemistry 62:145–175
Finn JT (1980) Flow analysis of models of the Hubbard Brook eco-system. Ecology 61:562–571
Fogel ML, Wooller MJ, Cheeseman J et al (2008) Unusually negative nitrogen isotopic compositions (δ15N) of mangroves and lichens in an oligotrophic, microbially-influenced ecosystem. Biogeo-sciences 5:1693–1704
Gili J-M, Coma R (1998) Benthic suspension feeders: their paramount role in littoral marine food webs. Trends Ecol Evol 13:316–321
Hillebrand H, Borer ET, Bracken MES et al (2009) Herbivore metab-olism and stoichiometry each constrain herbivory at different organizational scales across ecosystems. Ecol Lett 12:516–527
Hirata H, Ulanowicz RE (1984) Information theoretical analysis of ecological networks. Int J Syst Sci 3:261–270
Jin-Eong O, Khoon G, Clough B (1995) Structure and productivity of a 20-year-old stand of Rhizophora apiculata Bl. mangrove for-est. J Biogeogr 22:417–424
Jørgensen LA, Jørgensen SE, Nielsen SN (1991) ECOTOX: ecologi-cal modelling and ecotoxicology. Elsevier
Joye SB, Lee RY (2004) Benthic microbial mats: Important sources of fixed nitrogen and carbon to the Twin Cays, Belize ecosystem. Atoll Res Bull 528:1–24. doi:10.5479/si.00775630.528.1
Kathiresan K, Bingham BL (2001) Biology of mangroves and man-grove ecosystems. Adv Mar Biol 40:81–251
Kensley B, Schotte M (1989) Guide to the marine isopod crustaceans of the Caribbean
Koch V, Wolff M (2002) Energy budget and ecological role of man-grove epibenthos in the Caeté estuary, North Brazil. Mar Ecol Prog Ser 228:119
Kohlmeyer J, Bebout B (1986) On the occurrence of marine fungi in the diet of Littorina angulifera and observations on the behavior of the periwinkle. Mar Ecol 7:333–343
Koltes KH, Tschirky JJ, Feller IC (1998) Carrie bow Cay, Belize. In: Kjerfve B (ed) CARICOMP—Caribb. coral reef, Seagrass man-grove sites. UNESCO, Paris, pp 79–94

Oecologia
1 3
Lange OL, Büdel B, Meyer A et al (2000) Lichen carbon gain under tropical conditions: water relations and CO2 exchange of three Leptogium species of a lower montane rainforest in Panama. Flora 195:172–190
Lapointe BE, Littler MM, Littler DS (1992) Nutrient availability to marine macroalgae in siliclastic versus carbonate-rich coastal waters. Estuaries 15:75–82
Lee RY (2006) Primary production, nitrogen cycling and the ecosys-tem role of mangrove microbial mats on Twin Cays, Belize
Lee R, Joye S (2006) Seasonal patterns of nitrogen fixation and deni-trification in oceanic mangrove habitats. Mar Ecol Prog Ser 307:127–141
Lee RY, Porubsky WP, Feller IC et al (2008) Porewater biogeochem-istry and soil metabolism in dwarf red mangrove habitats (Twin Cays, Belize). Biogeochemistry 87:181–198
Liebig JJ (1840) Chemistry and its application to agriculture and physiology. Taylor and Walton, London
Littler MM, Taylor PR, Littler DS et al (1985) The distribution, abun-dance and primary productivity of submerged macrophytes in a Belize barrier-reef mangrove system. Atoll Res Bull 289:1–22. doi:10.5479/si.00775630.289.1
Machiwa JF, Hallberg RO (2002) An empirical model of the fate of organic carbon in a mangrove forest partly affected by anthropo-genic activity. Ecol Modell 147:69–83
MacIntyre IG, Toscano MA, Lighty RG, Bond GB (2004) Holocene history of the mangrove islands of Twin Cays, Belize, Central America. Atoll Res Bull 510:1–18
McClanahan TR (1998) Predation and the distribution and abun-dance of tropical sea urchin population. J Exp Mar Bio Ecol 221:231–255
McKee KL (1995) Mangrove species distribution and propagule predation in Belize: an exception to the dominance predation hypothesis. Biotropica 27:334–345
McKee KL (2011) Biophysical controls on accretion and elevation change in Caribbean mangrove ecosystems. Estuar Coast Shelf Sci 91:475–483
McKee KL, Cahoon DR, Feller IC (2007) Caribbean mangroves adjust to rising sea level through biotic controls on change in soil elevation. Glob Ecol Biogeogr 16:545–556
McKeon CS, Feller IC (2004) The supratidal fauna of Twin Cays, Belize. Atoll Res Bull 526:1–22. doi:10.5479/si.00775630.526.1
Middleton BA, McKee KL (2001) Degradation of mangrove tissues and implications for peat formation in Belizean island forests. J Ecol 89:818–828
Miller M, Palojärvi A, Rangger A et al (1998) The use of fluorogenic substrates to measure fungal presence and activity in soil. Appl Environ Microbiol 64:613–617
Mitten S, McKeon CS, Feller IC (2004) Winter and summer bird communities of Twin Cays, Belize. Atoll Res Bull 527:1–20. doi:10.5479/si.00775630.527.1
Modlin RF (1996) Contributions to the ecology of Paranebalia beli-zensis from the waters off central Belize, Central America. J Crustac Biol 16:529–534
Nordhaus I (2004) Feeding ecology of the semi-terrestrial crab Ucides cordatus cordatus (Decapoda: Brachyura) in a mangrove forest in northern Brazil. Thesis, Zentrum für Tropenökologie, Univer-sity of Bremen
Perry DM (1988) Effects of associated fauna on growth and produc-tivity in the red mangrove. Ecology 69:1064–1075
Persson J, Fink P, Goto A et al (2010) To be or not to be what you eat: regulation of stoichiometric homeostasis among autotrophs and heterotrophs. Oikos 119:741–751
Redfield AC (1934) On the proportions of organic derivatives in sea water and their relation to the composition of plankton. In: Labo-ratory LS-F (ed) James Johnstone memorial volume. University Press, Liverpool, pp 176–192
Rodriguez W, Feller IC (2004) Mangrove landscape characteriza-tion and change in Twin Cays, Belize, using aerial photography and Ikonos satellite data. Atoll Res Bull 513:1–24. doi:10.5479/si.00775630.513.1
Scharler U (2012) Whole food-web studies: mangroves. In: Wolanski E, McLusky DS (eds) Treatise on estuarine coastal science. Aca-demic Press, Waltham, pp 271–286
Schwinghamer P, Hargrave B, Peer D, Hawkins CM (1986) Partition-ing of production and respiration among size groups of organ-isms in an intertidal benthic community. Mar Ecol Prog Ser 31:131–142
Smith VH, Tilman GD, Nekola JC (1999) Eutrophication: impacts of excess nutrient inputs on freshwater, marine, and terrestrial eco-systems. Environ Pollut 100:179–196
Sterner RW, Elser JJ (2002) Ecological stoichiometry: the biology of elements from molecules to the biosphere. Princeton University Press, Princeton
Sterner RW, George NB (2000) Carbon, nitrogen, and phosphorus stoichiometry of cyprinid fishes. Ecology 81:127–140
Taylor PR, Littler MM, Littler DS (1986) Escapes from herbivory in relation to the structure of mangrove island macroalgal commu-nities. Oecologia 69:481–490
Ulanowicz RE (1986) Growth and developmentUlanowicz RE, Abarca-Arenas LG (1997) An informational synthesis
of ecosystem structure and function. Ecol Modell 95:1–10Ulanowicz RE, Baird D (1999) Nutrient controls on ecosystem
dynamics: the Chesapeake mesohaline community. J Mar Syst 19:159–172
Ulanowicz RE, Kay JJ (1991) A package for the analysis of ecosys-tem flow networks. Environ Softw 6:131–143
Ulanowicz RE, Scharler UM (2008) Least-inference methods for con-structing networks of trophic flows. Ecol Model 210:278–286
Ulanowicz RE, Bondavalli C, Heymans JJ, Egnotovich MS (1999) Network analysis of trophic dynamics in South Florida Ecosys-tem, FY 98: the mangrove ecosystem. http://www.cbl.umces.edu/~atlss/mngrv701.html. Accessed Nov 2012
Vanni MJ (2002) Nutrient cycling by animals in freshwater ecosys-tems. Annu Rev Ecol Syst 33:341–370
Vanni MJ, Flecker S, Hood JM (2002) Stoichiometry of nutrient recy-cling by vertebrates in a tropical stream: linking species identity and ecosystem processes. Ecol Lett 5:285–293
Wooller M, Smallwood B, Jacobson M, Fogel M (2003) Carbon and nitrogen stable isotopic variation in Laguncularia racemosa (L.) (white mangrove) from Florida and Belize: implications for trophic level studies. Hydrobiologia 499:13–23
Zhang J, Liu SM, Ren JL et al (2007) Nutrient gradients from the eutrophic Changjiang (Yangtze River) Estuary to the oligo-trophic Kuroshio waters and re-evaluation of budgets for the East China Sea Shelf. Prog Oceanogr 74:449–478
Zhang Z-S, Song X-L, Lu X-G, Xue Z-S (2013) Ecological stoichi-ometry of carbon, nitrogen, and phosphorus in estuarine wetland soils: influences of vegetation coverage, plant communities, geo-morphology, and seawalls. J Soils Sediments 13:1043–1051
Zuccarello GC, Yeates PH, Wright JT, Bartlett J (2001) Population structure and physiological differentiation of haplotypes of Calo-glossa leprieurii (Rhodophyta) in a mangrove intertidal zone. J Phycol 37:235–244