Embed Size (px)
Citation preview

DOI: 10.1111/mice.12436
O R I G I N A L A R T I C L E
Variance-based global sensitivity analysis for fuzzy randomstructural systems
Mohammad Mahdi Javidan Jinkoo Kim
Department of Civil & Architectural
Engineering, Sungkyunkwan University,
Suwon, Republic of Korea
CorrespondenceJinkoo Kim, Department of Civil & Architec-
tural Engineering, Sungkyunkwan University,
Suwon, Republic of Korea.
Email: [email protected]
Funding informationNational Research Foundation of
Korea (NRF), Ministry of Education
NRF2016R1D1A1B03932880
AbstractThere have been increasing advances in the sophisticated approaches like fuzzy
randomness to handle different uncertainties in civil engineering; however, less
attention has been paid to the formulation of a sensitivity analysis for fuzzy random
structural systems. In this study, the main objective is to present the formulation of
fuzzy Sobol sensitivity indices to quantify the influence of fuzzy random structural
parameters. Meanwhile, uncertainty in derivation of limit states and acceptance
criteria in collapse analysis is addressed briefly and treated using fuzzy model
parameters. To show the application of the established sensitivity test, the collapse
behavior of a steel moment frame subjected to sudden column removal is evaluated
thoroughly. The proposed fuzzy sensitivity indices are determined for the problem
and the overall influence of fuzzy acceptance criteria on the collapse assessment is
shown using fragility analysis. The results show that the presented fuzzy sensitivity
analysis can give detailed insight into the characteristics of fuzzy random systems,
and the epistemic uncertainty in derivation of limit states can have significant effects
on the reliability-based collapse analysis. It is worth mentioning that to alleviate high
computational demands in fuzzy probabilistic collapse analysis, a neural network
metamodel is applied in conjunction with the genetic algorithm which is also of
practical value to engineers and researchers.
1 INTRODUCTION
Many studies have been conducted in different fields of civil
engineering based on the fuzzy set theory such as control of
building structures (Jiang & Adeli, 2008; Nomura, Furuta,
& Hirokane, 2007), life cycle cost optimization of structures
(Sarma & Adeli, 2000, 2002), and decision making (Adeli &
Sarma, 2006; D'Urso, Masi, Zuccaro, & De Gregorio, 2018;
Jin & Doloi, 2009; Ponz-Tienda, Pellicer, Benlloch-Marco,
& Andrés-Romano, 2015). Meanwhile, fuzzy random relia-
bility has been developed in the past two decades to handle
uncertainties in structural engineering and computational
mechanics (Jahani, Muhanna, Shayanfar, & Barkhordari,
2014; Möller & Beer, 2004; Möller, Beer, Graf, & Hoffmann,
1999; Möller, Graf, & Beer, 2003; Muhanna & Mullen,
© 2019 Computer-Aided Civil and Infrastructure Engineering
1999). Various sources of uncertainty can be categorized
into two major groups, stochastic and informal uncertainties.
Stochastic uncertainty is related to the intrinsic variability
whereas informal uncertainty is associated with the lack of
knowledge and modeling simplifications. Although stochastic
uncertainty has been considered properly using probability
theory, this approach is based on the presumption that there
is sufficient information about the probability distribution
parameters such as mean and standard deviation values.
By using fuzzy randomness, insufficient knowledge about
model parameters and informal uncertainty in distribution
parameters are described using fuzzy numbers.
As a powerful uncertainty model, fuzzy randomness
has been implemented in many studies to quantify uncer-
tain parameters and conduct fuzzy reliability analysis
Comput Aided Civ Inf. 2019;1–14. wileyonlinelibrary.com/journal/mice 1

2 JAVIDAN AND KIM
(Graf, Hoffmann, Möller, Sickert, & Steinigen, 2007; Möller,
Beer, Graf, & Sickert, 2006; Möller, Liebscher, Schweiz-
erhof, Mattern, & Blankenhorn, 2008; Wang, Ma, Zhang,
& Liu, 2012). Besides these research contributions, few
attempts have been made to formulate sensitivity indices for
fuzzy random structural systems. As mentioned by Saltelli,
Tarantola, Campolongo, and Ratto (2004), sensitivity tests
are conducted for several purposes which are quite useful
for coping with uncertainties in any scientific model and
risk management. For instance, sensitivity tests can indicate
influential factors (Boscato, Russo, Ceravolo, & Fragonara,
2015; Castillo, Grande, Mora, Lo, & Xu, 2017) which need
better control to decrease the output variability. In addition to
reducing output variance below a given tolerance, they can be
used for model simplification by identifying less important
parameters. To this end, Cui, Lu, and Wang (2011) proposed a
reliability sensitivity method to deal with systems consisting
of fuzzy and random variables. Recently, Jafari and Jahani
(2016) presented a gradient-based sensitivity test to find
the influence of informal uncertainty of fuzzy distribution
parameters on the failure probability. To have aforementioned
applications, a general sensitivity test is required to address
the influence of both informal and stochastic uncertainties not
only on the failure probability, but also on any type of output
variance for risk reduction, model simplification, or other
applications.
In this study, a sensitivity test is proposed for fuzzy random
structural systems, which in turn, yields fuzzy sensitivity
indices. Effects of stochastic uncertainty in structural parame-
ters are quantified using the variance-based global sensitivity
analysis (Saltelli et al., 2008), and the intervals of these
indices corresponding to each 𝛼-level show the overall effect
of informal uncertainty in their contribution. The variance-
based sensitivity test or the Sobol method, extended to fuzzy
random systems, is one of the well-known methods which
has been applied to structural engineering in recent years
(Arwade, Moradi, & Louhghalam, 2010; Kala, 2011, 2016).
In the present research, fundamentals of fuzzy randomness
and fuzzy probabilistic collapse analysis are explained briefly.
Then the implementation of fuzzy sensitivity indices for the
uncertainty model is described. To demonstrate the proposed
method, the collapse behavior of a steel moment-resisting
frame is analyzed under sudden column removal using
fragility analysis and the proposed sensitivity test. There is
also a short discussion about incorporating informal uncer-
tainty in derivation of limit states and acceptance criteria
for the collapse analysis as fuzzy model parameters. As
nonlinear dynamic collapse analysis is quite time-consuming
especially for the considered probabilistic analyses, an arti-
ficial neural network (ANN) is applied systematically to the
problem which can be also of practical value to engineers and
researchers.
2 FUZZY RANDOMNESS
2.1 FundamentalsFuzzy randomness is an uncertainty model which can allow
for different sources of uncertainty in the model and data.
Stochastic and informal uncertainties are treated by represent-
ing parameters of probability distributions and model param-
eters using fuzzy numbers, respectively. A fuzzy number is a
set of elements �̃� on the fundamental set 𝑈 along with their
corresponding functional values 𝜇(𝑎),
𝐴 = {(𝑎, 𝜇(𝑎))|𝑎 ∈ 𝑈} (1)
where 𝜇 is called the membership function and the func-
tional values show the achievement of assessment criterion
and uncertainty level. For a fuzzy number, the membership
function is piecewise continuous and it is normalized as
∀𝑎 ∈ 𝑈, 𝜇(𝑎) ∈ [0, 1] (2)
The functional values should be convex which means they
decrease monotonically on each side of the maximum value.
Two other definitions which are used subsequently for the
treatment of uncertainty are support set and 𝛼-level set. The
support 𝑆(�̃�) of the fuzzy set �̃� is defined as a crisp set which
contains all elements having membership values greater than
zero,
𝑆(𝐴) = {𝑎 ∈ 𝑈 |𝜇(𝑎) > 0} (3)
The crisp subsets 𝐴𝛼𝑘of �̃� with elements having membership
values greater than or equal to 𝛼𝑘 are called 𝛼-level sets which
are also subsets of the support 𝑆(�̃�),
𝐴𝛼𝑘= {𝑎 ∈ 𝑈 |𝜇(𝑎) ≥ 𝛼𝑘} (4)
A fuzzy number with its membership function, support, and
𝛼-level set are shown in Figure 1. The 𝛼-level set 𝐴𝛼𝑘speci-
fies the interval [𝑎𝛼𝑘,𝑙, 𝑎𝛼𝑘,𝑟] for the considered parameter with
μ(a)
aaαk,l aαk,r
αk
1.0
0.0
Aαk
S(Ã)
F I G U R E 1 A fuzzy number and its support and 𝛼-level set

JAVIDAN AND KIM 3
f(x)
x
F(x)
x
p
1.0
1.0
0.0
Fuzzy distribution parameter
μ=1
μ=0
μ=1
μ=0
(a) (b) (c)
P̃(X̃)
μ(p)
F I G U R E 2 Fuzzy probabilistic basic variable: (a) fuzzy distribution parameter; (b) fuzzy probability density function; and (c) associated fuzzy
probability distribution function
regard to the uncertainty level 𝛼𝑘. To approximate the mem-
bership function, a triangular membership function is usually
used which is also utilized in this study. A fuzzy number with
a triangular membership function is called fuzzy triangular
number and is represented by
�̃� = < 𝑎1, 𝑎2, 𝑎3 > (5)
where 𝑎1 and 𝑎3 are, respectively, the smallest and the largest
values of the support and 𝑎2 corresponds to the maximum
membership value 𝜇(𝑎2) = 1.
2.2 Stochastic and informal uncertaintyInformal uncertainties in the model can be accounted for by
representing model parameters as fuzzy numbers. On the
other hand, stochastic uncertainty and imperfect knowledge
about distribution parameters can be treated using fuzzy ran-
dom numbers which consider stochastic characteristics of a
parameter using classical probability models and imprecision
of the considered probability models using fuzzy distribution
parameters. Considering distribution parameters, such as
mean and standard deviation for a probabilistic basic variable
in structural analysis, leads to the fuzzy probabilistic basic
variable �̃� with the fuzzy distribution parameter 𝑃 (�̃�). This
definition characterizes the fuzzy probability density func-
tion 𝑓 (𝑥) and the associated fuzzy probability distribution
function 𝐹 (𝑥). Probability functions for a fuzzy probabilistic
basic variable are depicted in Figure 2. The solid curves
represent the probability functions corresponding to the
membership value of 1, and the dashed curves correspond to
the membership value of zero. Therefore, all possible proba-
bility functions called trajectories are contained between the
dashed curves.
3 FUZZY PROBABILISTICCOLLAPSE ANALYSIS
In this part, fuzzy probabilistic collapse analysis is described
briefly using the Zadeh's general extension principle (Zadeh,
1965) with the aim of providing better insight into the fuzzy
input space and mapping onto the output space of failure prob-
ability. After the reader becomes familiar with the problem at
hand and the fuzzy input space, determining fuzzy sensitivity
indices for the input space is explained in the same way and
then the efficient 𝛼-level optimization method is explained in
the next part.
In fuzzy probabilistic collapse analysis, model parameters
are described using fuzzy numbers and probabilistic basic
variables are defined using fuzzy distribution parameters.
The 𝑗th fuzzy model parameter is denoted using �̃�𝑗 and the
𝑖th fuzzy probabilistic basic variable along with its corre-
sponding fuzzy distribution parameter is shown by �̃�𝑖 and
𝑃 (�̃�𝑖), respectively. Originals of input variables are defined
with small letters without tilde, for example, 𝑚𝑗 and 𝑝(�̃�𝑖).The general way of conducting numerical solution is to define
the fuzzy input space by assigning fundamental sets of fuzzy
distribution parameters 𝑃 (�̃�𝑖) and fuzzy model parameters
�̃�𝑗 to axes of the Cartesian coordinate system. The coordi-
nates of points in this space characterize a Cartesian product
space. The membership degree of each point, that is, each
original, in this space is equal to the minimum membership
value of its components. This procedure forms the fuzzy
input space which is illustrated for two input variables in
Figure 3.
The coordinates 𝑝(�̃�𝑖) of an arbitrary point in this fuzzy
input space specifies exactly one original for each fuzzy
probabilistic basic variable and therefore one trajectory of the
joint fuzzy probability density function. The coordinates 𝑚𝑗
give precisely one element for each fuzzy model parameter
in structural analysis and thus one crisp limit state function.
Accordingly, the joint probability density function and
the limit state give in turn one element of fuzzy failure
probability 𝑃𝑓 which can be found by conventional reliability
methods. By having virtually infinite originals in the fuzzy
input space, failure probability elements are obtained and
the final membership degree for each element is equal to
the maximum membership value of originals leading to the
same element (Figure 3). This procedure using the max-min
operator is called Zadeh's extension principle (Zadeh, 1965).

4 JAVIDAN AND KIM
m
1.0
0.0
μ(p)
μ(m)
p
1.0
0.0
Fuzzy model parameter M̃
Fuzzy distribution parameter P̃(X̃)
Cartesian product
Failure probabilityfor each original
(Min operator)
m
μ(k)
K̃ = M̃ × P̃(X̃) (Fuzzy input set)
p
Virtually infiniteorginials
Extension principle(Max operator)
μ(pf)
pf
1.0
0.0
Fuzzy failure probability P̃f
Fuzzy input variables
F I G U R E 3 Fuzzy probabilistic collapse analysis
Failure probability elements can be approximated using
reliability methods such as the first-order reliability method
or the Monte Carlo simulation (MCS). Although MCS
requires high computational demands, it provides a general
solution for any kind of problems regardless of nonlinearity
and complexity (Jahani et al., 2014).
4 FUZZY GLOBAL SENSITIVITYANALYSIS
Each original of the fuzzy input space �̃� outlines a reliability
problem for an uncertain output response. In the aforemen-
tioned fuzzy input space, the coordinates of each original con-
sists of distribution parameters 𝑝(�̃�𝑖) for probabilistic basic
variables and model parameters 𝑚𝑗 . As the coordinates 𝑚𝑗 do
not contribute to the output variability for the current original
of the fuzzy input space, the sensitivity indices are not calcu-
lated for them. The coordinates 𝑝(�̃�𝑖) of each original in the
fuzzy input space specify precisely one element of the joint
fuzzy probability density function. This joint density func-
tion leads to the variability in the output response which stems
from the role of probabilistic basic variables in the model and
their distribution parameters 𝑝(�̃�𝑖). To evaluate the influence
of probabilistic basic variables on the current output variance,
Sobol's sensitivity indices are determined for this original of
the joint fuzzy probability density function. Given 𝑧 as the
output and function of input variables, the main contribution
of the 𝑖th probabilistic basic variable to the total variance of
the considered output 𝑉 (𝑍) is termed the first-order index in
the literature and can be calculated as
𝑠𝑖 =𝑉 (𝐸(𝑧|𝑥𝑖))
𝑉 (𝑧)(6)
The numerator indicates that the variance of the inner expec-
tation is determined by only changing 𝑥𝑖 and for each fixed
𝑥𝑖 the output is averaged for all possible variation of other
variables. Therefore, the effects of the 𝑖th probabilistic basic
variable on the total variance are quantified and the influence
of other variables is excluded by averaging which is called the
conditioned variance.
When there is no interaction between input variables, the
model is called additive and summing up the first-order sen-
sitivity indices will be equal to one,
∑𝑠𝑖 = 1 (7)
When the above-mentioned equation does not hold for
obtained first-order indices, it indicates that the model is non-
additive and the interaction of input variables also influences
the output variability. The interaction here does not refer to the
mutual dependency of input variables that must be considered
in mapping or generating the fuzzy input set or probabilistic
samples. In fact, it is the interaction of input variables inside
the model for generating the output response. The interaction

JAVIDAN AND KIM 5
between the 𝑖th and the 𝑙th probabilistic basic variables can
be obtained similarly using higher order indices as
𝑠𝑖,𝑙 =𝑉 (𝐸(𝑧|𝑥𝑖, 𝑥𝑙))
𝑉 (𝑧)− 𝑠𝑖 − 𝑠𝑙 (8)
However, determining all higher order indices for a function
with 𝑛 probabilistic basic variable requires to calculate 2𝑛 − 1terms which seems impossible due to the curse of dimension-
ality. Hence, another measure termed the total effect is utilized
which is obtained as
𝑠𝑇 𝑖 = 1 −𝑉 (𝐸(𝑧|𝑥∼𝑖))
𝑉 (𝑧)(9)
where 𝑥∼𝑖 indicates that the expectation in the numerator
is conditional upon all probabilistic basic variables exclud-
ing the 𝑖th variable. Hence, 𝑉 (𝐸(𝑧|𝑥∼𝑖)) contains the output
variance from all input variables except the 𝑖th probabilistic
basic variable, and therefore the total effect of the variable
is obtained by deducting the conditioned variance from the
total variance. It has been shown that the first-order sensitiv-
ity indices along with the described total effects can clearly
indicate the general characteristics of a model (Saltelli et al.,
2004). These indices can be determined using estimators rec-
ommended by Saltelli et al. (2008). For further information
on global sensitivity and calculations, readers are referred to
Saltelli et al. (2008).
For each original of the fuzzy input space, the previous
procedure is done, which provides one sensitivity index for
each probabilistic basic variable. Each calculated sensitivity
index is an element of the fuzzy sensitivity index �̃�𝑖 for the
𝑖th fuzzy probabilistic basic variable. By applying the Max
operator, membership degrees for each element of fuzzy sen-
sitivity indices are determined.
5 FUZZY GLOBAL SENSITIVITYANALYSIS USING 𝜶-LEVELOPTIMIZATION METHOD
As stated before, the aforementioned procedure was men-
tioned using the general extension principle for the sake of
clarity. Although this approach is a general procedure for
mapping fuzzy input variables onto fuzzy results and pro-
vides clear understanding, it is a computationally inefficient
approach (Möller & Beer, 2004). In this reference, two reasons
are mentioned: first one is that the precision of the member-
ship of a fuzzy result highly depends on the number of orig-
inals evaluated, and the next one is the curse of dimension-
ality. Therefore, the 𝛼-level optimization method is usually
employed instead which employs a search algorithm (Möller,
Graf, & Beer, 2000). The main idea in this approach is that
instead of a large number of numerical evaluations from the
input space and finding the membership function using the
envelope of functional values corresponding to the obtained
results (Figure 3), an optimization can be done to find the
range of the fuzzy value corresponding to each 𝛼-level. In this
approach, all fuzzy input variables,𝑃 (�̃�𝑖) and �̃�𝑗 , are divided
similarly into 𝑟 𝛼-level sets, 𝑘 = 1, 2,… , 𝑟. The 𝛼𝑘 level of
input variables represents the crisp subspace 𝐾𝛼𝑘of the fuzzy
input space �̃� and can be mapped onto the corresponding
crisp subspaces𝑆𝑖,𝛼𝑘and 𝑃𝑓,𝛼𝑘 of the fuzzy sensitivity indices
and fuzzy failure probability. As 𝑆𝑖,𝛼𝑘can be fully described
by finding the maximum 𝑠𝑖,𝛼𝑘,𝑟and the minimum 𝑠𝑖,𝛼𝑘,𝑙
for
each 𝛼-level subspace, there is no need to find all other ele-
ments 𝑠𝑖,𝛼𝑘,𝑙 < 𝑠𝑖 < 𝑠𝑖,𝛼𝑘,𝑟. Therefore, 𝐾𝛼𝑘
is considered as the
search domain for finding the boundaries of 𝑆𝑖,𝛼𝑘. As shown
in Figure 4, each 𝛼-level subspace of fuzzy input variables is
considered as the search domain and the maximum and mini-
mum of each sensitivity index are found for the corresponding
𝛼-level of each fuzzy probabilistic basic variable. There are
different search algorithms and optimization methods that can
be applied. In this research, the genetic algorithm (GA) (Adeli
& Kumar, 1995; Adeli & Sarma, 2006) which is inspired by
the natural selection was utilized. To give a better understand-
ing of conducting fuzzy global sensitivity test using GA, the
flowchart of the procedure is illustrated in Figure 5.
6 APPLICATION TO MODELSTRUCTURE
6.1 Structural propertiesTo show the application of the proposed method, a hypo-
thetical steel structure subjected to sudden column removal
on the first story was assumed and assessed in this research.
The structure is a three-story moment frame designed for the
dead load of 5 kN∕m2 and the live load equal to 3 kN∕m2.
The height of all stories is 4 m except the first story which is
5 m. The nominal dimensions of the used sections and the plan
layout are depicted in Figure 6. The nominal elastic modulus
of all structural members is equal to 2 × 10⁵ MPa whereas the
yield strengths of beams and columns are 330 and 370 MPa,
respectively.
It was assumed that the reproduction conditions for the
aforementioned properties were unknown, and the influential
parameters in collapse analysis were described using fuzzy
random variables. The stochastic uncertainty of parameters
was considered based on distribution types and parameters
recommended in the codes, and the coefficient of variations
was assumed to be a constant. Based on informal uncer-
tainty and the subjective assessment of the objective data,
the parameters were fuzzified and the results of fuzzification
are summarized in Table 1. Distribution types and all related
assumptions considered are based on the literature (CEN,
1993; Ellingwood, Galambos, MacGregor, & Cornell, 1980;
Javidan, Kang, Isobe, & Kim, 2018; JCSS, 2001). The live

6 JAVIDAN AND KIM
μ(pi)
pipi,αk,l pi,αk,r
αk
1.0
0.0
Pi,αk
P̃(X̃i)
μ(mj)
mjmj,αk,l mj,αk,r
αk
1.0
0.0
M̃j
Mj,αk
Search Domainfor α-level optimization
MCS for failure probabilityand global sensitivity indices
Fuzzy distribution parameters Fuzzy model parameters
μ(pf)
pf
1.0
0.0
Fuzzy failure probability P̃f
αk
pf,αk,l pf,αk,r
Min Max
μ(si)
si
1.0
0.0
Fuzzy sensitivity indices S̃i
Min Maxαk
si,αk,l si,αk,r
F I G U R E 4 𝛼-level optimization
load consists of two components, the intermittent load and the
arbitrary-point-in-time load (JCSS, 2001). The latter denotes
the average load during lifetime of the structure with a specific
occupancy whereas the intermittent load is associated with a
short time like renovation or special events (Ellingwood et al.,
1980). As extreme events are indeed a type of arbitrary-point-
in-time accident, the only source of variability was assumed to
be the sustainable component of the live load. It was assumed
that there is no spatial variation in the parameters.
The corner column on the first story marked in Figure 6b
was assumed to be removed suddenly under an extreme
action. The damage states of structural members were
evaluated using the limit states specified in the ASCE 41-13
(ASCE, 2013). Another uncertainty considered herein is
the informal uncertainty in derivation of acceptance criteria
and limit states for collapse analysis. Acceptance criteria for
strength and deformation in guidelines are based on idealized
experimental force-deformation curves. However, there is no
denying that this evaluation of objective information entails
informal uncertainty. Moreover, these criteria are designated
for deterministic geometrical properties whereas analyses
in this study were conducted in a probabilistic fashion.
Therefore, as can be seen in Table 2, limit states provided in
ASCE 41-13 were adopted while allowing for the informal
uncertainty. These criteria are associated with three perfor-
mance levels which are immediate occupancy (IO), life safety
(LS), and collapse prevention (CP) levels. The same criteria
are also recommended in guidelines (DoD, 2016; GSA, 2016)
for progressive collapse which is the subject of this section.
The fuzzy limit state enters the numerical solution as a fuzzy
model parameter. Because it solely affects the fuzzy limit
state surface which divides the joint fuzzy probability density
function into the survival region and the failure region.
It should be noticed that the viewpoint on limit states
is different from the fuzzy performance level which has
been addressed in the previous studies (Kirke & Hao, 2004;
Thinley & Hao, 2017) and it should not be misunderstood.
In those studies, the probability density function f(x) of the
structural output response was determined using the clas-
sical probabilistic analysis while having a specific perfor-
mance level was considered as a fuzzy variable. The degree
of truth, that is, the membership degree, for each performance

JAVIDAN AND KIM 7
Build the α-level subspace of fuzzy input variables
Generate the population for different combinations of variables in the search domain
Calculate the Sobol sensitivity index of the ith probabilistic basic variable for each individual using MCS
Run the evolutionaryalgorithm
Increase α
Build the membership function of theith fuzzy sensitivity index
α = 0
Building the search domain
Determining the fuzzy sensitivity indices
i = i + 1
{
{{
End
and fulfill the convergence
criterion?
α < 1
Yes
No
Yes
No
Start with the first fuzzy probabilistic basic variable, i = 1 out of n
i < nYes
No
Multi-objective optimization corresponding tothe α-level subspace for finding the maximum
and minimum sensitivity indices, si,αk,r and si,αk,l
F I G U R E 5 Flowchart of 𝛼-level optimization for fuzzy global sensitivity analysis using GA
Beams Columns Column removal scenario175mm 175mm
7.5mm7.5mm
11mm
11mm
350m
m
175m
m
5m 5m 5m
5m
5m
5m
(a) (b)
F I G U R E 6 Details of the considered structure: (a) nominal dimensions of beam and column sections; (b) plan of the structure and the
considered column removal scenario
level was calculated using the expectation of the membership
function,
𝐸[𝜇(𝑥)] = ∫𝐷𝑈
𝐷𝐿
𝜇(𝑥)𝑓 (𝑥)𝑑𝑥 (10)
where 𝐷𝑈 and 𝐷𝐿 are the upper and lower boundaries of the
fuzzy limit state, respectively. In the present research, infor-
mal uncertainty in derivation of definitive limit states was
taken into account.
8 JAVIDAN AND KIM
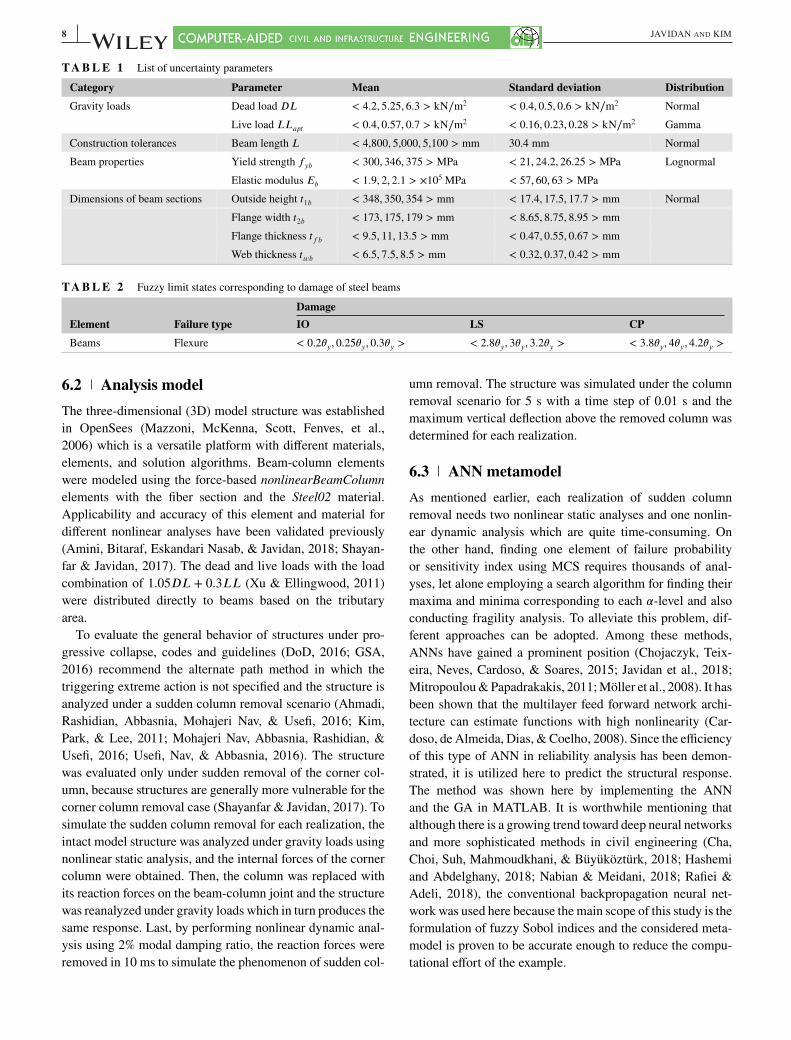
T A B L E 1 List of uncertainty parameters
Category Parameter Mean Standard deviation DistributionGravity loads Dead load 𝐷𝐿 < 4.2, 5.25, 6.3 > kN∕m2 < 0.4, 0.5, 0.6 > kN∕m2 Normal
Live load 𝐿𝐿𝑎𝑝𝑡 < 0.4, 0.57, 0.7 > kN∕m2 < 0.16, 0.23, 0.28 > kN∕m2 Gamma
Construction tolerances Beam length 𝐿 < 4,800, 5,000, 5,100 > mm 30.4 mm Normal
Beam properties Yield strength 𝑓𝑦𝑏 < 300, 346, 375 > MPa < 21, 24.2, 26.25 > MPa Lognormal
Elastic modulus 𝐸𝑏 < 1.9, 2, 2.1 > ×105 MPa < 57, 60, 63 > MPaDimensions of beam sections Outside height 𝑡1𝑏 < 348, 350, 354 > mm < 17.4, 17.5, 17.7 > mm Normal
Flange width 𝑡2𝑏 < 173, 175, 179 > mm < 8.65, 8.75, 8.95 > mmFlange thickness 𝑡𝑓𝑏 < 9.5, 11, 13.5 > mm < 0.47, 0.55, 0.67 > mmWeb thickness 𝑡𝑤𝑏 < 6.5, 7.5, 8.5 > mm < 0.32, 0.37, 0.42 > mm
T A B L E 2 Fuzzy limit states corresponding to damage of steel beams
DamageElement Failure type IO LS CPBeams Flexure < 0.2𝜃𝑦, 0.25𝜃𝑦, 0.3𝜃𝑦 > < 2.8𝜃𝑦, 3𝜃𝑦, 3.2𝜃𝑦 > < 3.8𝜃𝑦, 4𝜃𝑦, 4.2𝜃𝑦 >
6.2 Analysis modelThe three-dimensional (3D) model structure was established
in OpenSees (Mazzoni, McKenna, Scott, Fenves, et al.,
2006) which is a versatile platform with different materials,
elements, and solution algorithms. Beam-column elements
were modeled using the force-based nonlinearBeamColumnelements with the fiber section and the Steel02 material.
Applicability and accuracy of this element and material for
different nonlinear analyses have been validated previously
(Amini, Bitaraf, Eskandari Nasab, & Javidan, 2018; Shayan-
far & Javidan, 2017). The dead and live loads with the load
combination of 1.05𝐷𝐿 + 0.3𝐿𝐿 (Xu & Ellingwood, 2011)
were distributed directly to beams based on the tributary
area.
To evaluate the general behavior of structures under pro-
gressive collapse, codes and guidelines (DoD, 2016; GSA,
2016) recommend the alternate path method in which the
triggering extreme action is not specified and the structure is
analyzed under a sudden column removal scenario (Ahmadi,
Rashidian, Abbasnia, Mohajeri Nav, & Usefi, 2016; Kim,
Park, & Lee, 2011; Mohajeri Nav, Abbasnia, Rashidian, &
Usefi, 2016; Usefi, Nav, & Abbasnia, 2016). The structure
was evaluated only under sudden removal of the corner col-
umn, because structures are generally more vulnerable for the
corner column removal case (Shayanfar & Javidan, 2017). To
simulate the sudden column removal for each realization, the
intact model structure was analyzed under gravity loads using
nonlinear static analysis, and the internal forces of the corner
column were obtained. Then, the column was replaced with
its reaction forces on the beam-column joint and the structure
was reanalyzed under gravity loads which in turn produces the
same response. Last, by performing nonlinear dynamic anal-
ysis using 2% modal damping ratio, the reaction forces were
removed in 10 ms to simulate the phenomenon of sudden col-
umn removal. The structure was simulated under the column
removal scenario for 5 s with a time step of 0.01 s and the
maximum vertical deflection above the removed column was
determined for each realization.
6.3 ANN metamodelAs mentioned earlier, each realization of sudden column
removal needs two nonlinear static analyses and one nonlin-
ear dynamic analysis which are quite time-consuming. On
the other hand, finding one element of failure probability
or sensitivity index using MCS requires thousands of anal-
yses, let alone employing a search algorithm for finding their
maxima and minima corresponding to each 𝛼-level and also
conducting fragility analysis. To alleviate this problem, dif-
ferent approaches can be adopted. Among these methods,
ANNs have gained a prominent position (Chojaczyk, Teix-
eira, Neves, Cardoso, & Soares, 2015; Javidan et al., 2018;
Mitropoulou & Papadrakakis, 2011; Möller et al., 2008). It has
been shown that the multilayer feed forward network archi-
tecture can estimate functions with high nonlinearity (Car-
doso, de Almeida, Dias, & Coelho, 2008). Since the efficiency
of this type of ANN in reliability analysis has been demon-
strated, it is utilized here to predict the structural response.
The method was shown here by implementing the ANN
and the GA in MATLAB. It is worthwhile mentioning that
although there is a growing trend toward deep neural networks
and more sophisticated methods in civil engineering (Cha,
Choi, Suh, Mahmoudkhani, & Büyüköztürk, 2018; Hashemi
and Abdelghany, 2018; Nabian & Meidani, 2018; Rafiei &
Adeli, 2018), the conventional backpropagation neural net-
work was used here because the main scope of this study is the
formulation of fuzzy Sobol indices and the considered meta-
model is proven to be accurate enough to reduce the compu-
tational effort of the example.

JAVIDAN AND KIM 9
MAE = 0.36MSE = 0.28r2 = 0.99968t = 76037 s
MAE = 7.14MSE = 81.32r2 = 0.90801t = 19016 s
MAE = 2.31MSE = 9.98r2 = 0.98871t = 38022 s
0
-50
-100
-150-100-150 -50 0
Pred
icte
d ve
rtica
l dis
plac
emen
t (m
m)
FE-based vertical displacement (mm)
0
-50
-100
-150-100-150 -50 0
Pred
icte
d ve
rtica
l dis
plac
emen
t (m
m)
FE-based vertical displacement (mm)
0
-50
-100
-150-100-150 -50 0
Pred
icte
d ve
rtica
l dis
plac
emen
t (m
m)
FE-based vertical displacement (mm)
(c)(a) (b)
F I G U R E 7 Precision of ANN metamodels: (a) trained by 100 samples; (b) trained by 200 samples; and (c) trained by 400 samples
The maximum vertical deflection above the removed
column, during 5 s after sudden column removal, was
considered as the output of the ANN and was used to find
the maximum demand of beam rotations. By trial and error,
ANNs with one hidden layer and 10 neurons seemed to be
applicable. Tan-sigmoid was used as the transfer function
because of continuity and nonlinearity. Three training sets
with 100, 200, and 400 samples were prepared by utilizing
Latin-hypercube sampling uniformly all over the support
space of input variables and considering 99.9% confidence
interval (CI) for probabilistic variables. Each set of samples
were generated after five iterations for maximizing the
minimum distance between samples, to provide samples with
good space-filling characteristics. The Levenberg–Marquardt
algorithm was chosen to train the ANN metamodels.
The accuracy of the ANNs trained with three different sets
was evaluated using another 100 samples, and the results are
shown in Figure 7. The mean absolute error M𝐴𝐸, mean
squared error M𝑆𝐸, and coefficient of determination 𝑅2 were
used to quantify the goodness of prediction. The computa-
tional time is also shown in the results. It can be observed that
the ANN trained with 400 samples is able to produce quite
accurate results and it was employed for further analyses.
7 RESULTS AND DISCUSSION
7.1 Fuzzy fragility analysisQuantifying the robustness of the structure at this stage can
provide a better understanding for sensitivity analysis at the
next stage. The general collapse performance of the struc-
ture was evaluated by fragility analysis. Given 𝑥 as the inten-
sity measure I𝑀 , the fragility curve 𝐹𝑑(𝑥) here was obtained
based on the probability that the damage measure D𝑀 is
larger than the considered damage state 𝑑,
𝐹𝑑(𝑥) = 𝑃 (D𝑀 ≥ 𝑑|I𝑀 = 𝑥) (11)
As mentioned earlier, the maximum demand of beam
rotations was considered as the damage measure, and was
determined using the maximum vertical deflection above the
removed corner column. The limits for the damage states
were previously explained and listed in Table 2. The intensity
measure was assumed to be the gravity load, and was normal-
ized to the nominal gravity load with the aforementioned load
combination. The failure probabilities were determined using
MCS up to the load factor of 4.0 for which the ANN was
trained practically. The range of the load factor was divided
into steps of 0.1, and the fuzzy failure probability correspond-
ing to each load factor was determined when 𝛼 = 0 and 𝛼 = 1.
The GA was employed using 100 individuals and 10 genera-
tions for both fragility and sensitivity analysis in this research.
The DoubleVector option was chosen for the population type
and the mutation function was chosen to be the adaptive fea-sible function which provides step lengths satisfying the con-
straints and adaptive generations based on the success of the
previous generation. The scattered crossover option with the
fraction of 0.8 was used. To carry out the MCS while applying
search algorithm, 105 samples were used to find each failure
probability. The fragility analysis was performed for crisp
limit states and also fuzzy limit states to compare the results.
The fragility curves for three damage states are shown in
Figure 8. It is observed that the fuzzy collapse probabilities
under the nominal gravity load are zero for the LS and CP
damage states and the structure is robust against the progres-
sive collapse. The fuzzy median collapse load factors related
to the LS damage state are, respectively, < 2.29, 2.87, 4.08 >and < 2.37, 2.87, 3.89 >, with and without consideration of
fuzzy limit states. The same trend can be observed for the IO
damage state with the load factors of < 0.18, 0.25, 0.41 > and
< 0.2, 0.25, 0.34 >. As can be seen, consideration of the infor-
mal uncertainty in derivation of limit states and acceptance
criteria can widen the support of the fuzzy load factor related
to a specific collapse probability. Therefore, the fragility
curves with consideration of fuzzy limit states include a wider

10 JAVIDAN AND KIM
1
0.8
0.6
0.4
0.2
00 0.2 0.4 0.6 0.8 1
Load factor α
Exce
edan
ce p
roba
bilit
y
(a)
1
0.8
0.6
0.4
0.2
00 0.5 1 1.5 2 2.5 3 3.5 4
Load factor α
Exce
edan
ce p
roba
bilit
y
(b)
1
0.8
0.6
0.4
0.2
00 0.5 1 1.5 2 2.5 3 3.5 4
Load factor α
Exce
edan
ce p
roba
bilit
y
(c)
μ=1
μ=0 (w/o fuzzy limit state)
μ=0 (w/ fuzzy limit state)
μ=1
μ=0 (w/o fuzzy limit state)
μ=0 (w/ fuzzy limit state)
μ=1
μ=0 (w/o fuzzy limit state)
μ=0 (w/ fuzzy limit state)
Fuzzy median value
0.18 0.410.25 0.340.2
1
μ
α
Fuzzy median value
2.29 4.082.87 3.892.37
1
μ
α
F I G U R E 8 Fragility curves of the model structure: (a) IO damage level; (b) LS damage level; and (c) CP damage level
interval due to the other source of informal uncertainty which
is the fuzzy limit state. The difference between failure proba-
bilities of a specific load factor for fuzzy and crisp limit states
could seem more significant. Based on the fragility curves, it
can be conceived how considering the informal uncertainty in
definitive limit states can affect the results and incorporating
them as a fuzzy model parameter in the numerical solution is
quite practical and useful.
The fuzzy fragility curve can describe the whole response
of the system considering both informal and stochastic
uncertainties. Conventional fragility curves only consider
stochasticity and in some cases implicitly informal uncer-
tainty. However, fuzzy probabilistic collapse analysis leads
to fuzzy fragility curves which account for informal uncer-
tainty in another dimension and the stochastic output response
varies in this dimension. Given 𝜇 = 1 the fragility curve is the
same as the result of a conventional fragility analysis. At this
𝛼-level, there is only one original in the fuzzy input space and
the system seems similar to an ordinary stochastic problem.
As can be seen above, fuzzy fragility curves determine how
the informal uncertainty affects the intensity measure corre-
sponding to a certain exceedance probability. This can be used
when epistemic uncertainty exists, and for decision making
the effect of this uncertainty needs to be determined. The
results can be also defuzzified and turned into the conven-
tional fragility curves in which the informal uncertainty is also
incorporated, however, the current format also contains inter-
esting information on the uncertainties involved in the model.
7.2 Fuzzy global sensitivity analysisThe fuzzy sensitivity indices including the total effects and
the first-order sensitivity indices of the considered variables
were obtained using the MCS approach recommended by
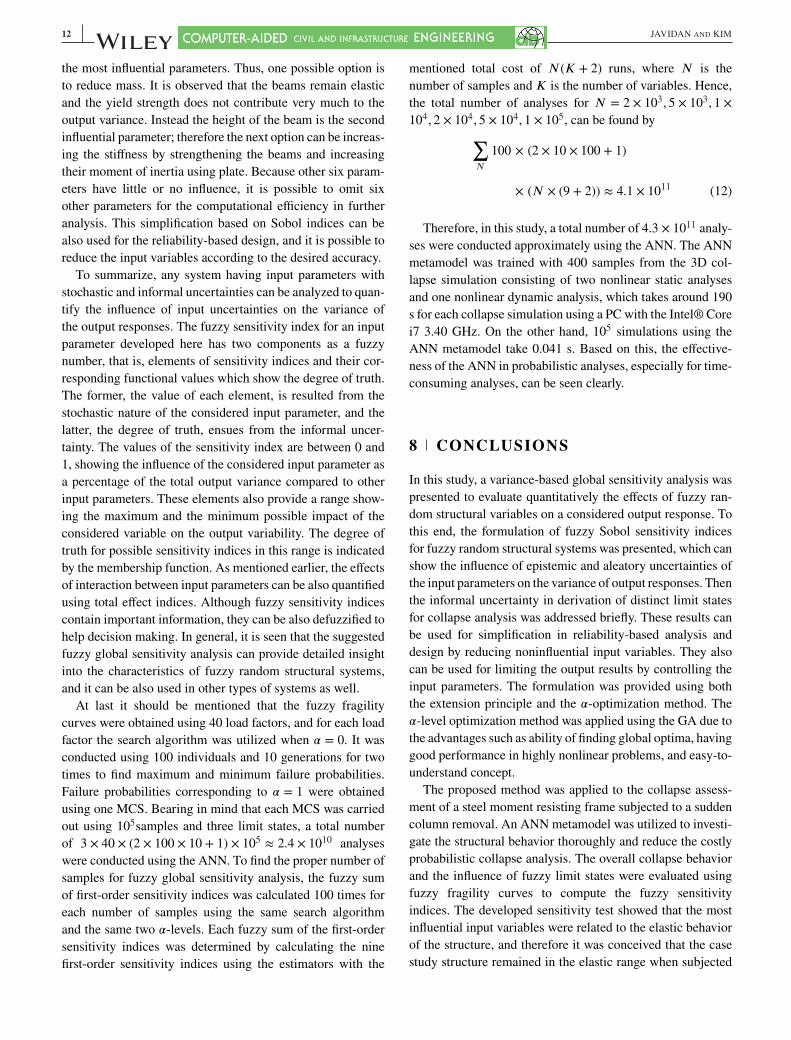
Saltelli et al. (2008). In this way, the total number of runs is
𝑁(𝐾 + 2), where 𝑁 and 𝐾 are the number of samples and
variables, respectively. The fuzzy sensitivity indices were cal-
culated when 𝛼 = 0 and 𝛼 = 1. To find the appropriate number
of samples 𝑁 by calculating the CI, different number of sam-
ples were considered and the fuzzy sensitivity analysis was
conducted 100 times for each considered 𝑁 and the 95% CI
was calculated. The CI for the fuzzy sum of first-order indices
corresponding to each number of samples is demonstrated
in Figure 9. It is observed that by increasing the samples in
abscissa, the CI converges and the MCS provides a better
accuracy. According to the results, 105 samples were utilized

JAVIDAN AND KIM 11
Sum
of fi
rst-o
rder
indi
ces
2000 5000 10000 20000 50000 100000
0.90
0.95
1.00
1.05
1.10
Number of samples
μ = 10 10 10 10 10 10
μ=1μ=0
F I G U R E 9 Fuzzy sum of first-order sensitivity indices and
convergence of the 95% CI
to give an acceptable approximation, and the fuzzy sensitivity
indices were calculated using this number of samples.
The fuzzy sum of first-order sensitivity indices is equal
to < 97.5%, 98.5%, 99.2% >. As this sum is close to unity,
the interaction between variables has subtle effects on the
output variance and the fuzzy number implies that it can
account for 2.5% at most. Hence, there is not noticeable dif-
ference between the results of first-order sensitivities and
total effects. These results are depicted in Figure 10 and as
can be seen the main variables contributing to the output
variance are the dead load, modulus of elasticity, and the
height of the beam section. Their fuzzy first-order indices
are < 31.5%, 35.4%, 38.3% >, < 26.2%, 31.5%, 36.8% >, and
< 20.6%, 22.9%, 26.2% >, respectively, which implies that
they can alone account for at least 73.8% of the output vari-
ance. These three parameters are followed by the beam length,
width and thickness of the beam flange, sustainable live load,
web thickness of the beam section, and last the yield strength
of the beam. Based on these results and the results from
the fragility analysis, it is conceived that the structure is
completely robust against progressive collapse and it mostly
remains elastic under gravity loads. As a result, the modulus
of elasticity and the height of the beam section play the most
significant roles among structural properties whereas the yield
strength has the lowest effect. Although the dead load is the
most influential input variable, the sustainable component of
the live load has minute contribution to the output variance.
The reason is that this component is very small with slight
variation and the main part of the live load is dedicated to the
intermittent component. Finally, as beams need to span the
damaged part and the flexural action is dominant, it is quite
rational that the properties of the beam flange are more influ-
ential compared to that of the beam web.
The total effects of the dead load, modulus of elastic-
ity, and the height of the beam section are, respectively,
< 32.5%, 36.1%, 38.7% >, < 27.8%, 31.9%, 38.1% >, and
< 20.6%, 23.3%, 26.7% >. It is seen that there are 6.2%,
10.3%, and 6.1% differences between the lower and upper
boundaries of their fuzzy total effects, respectively. It can be
seen that the effects of informal uncertainty associated with
a specific uncertainty level could be significantly different,
which should be quantified. This shows the ability of the
fuzzy global sensitivity analysis to quantify the maximumand minimum possible contribution of fuzzy random input
variables.
The above-mentioned results can be used in simplifica-
tions for further analysis or controlling the considered out-
put response. For instance, one might want to retrofit the case
study structure against progressive collapse to reach the IO
performance level. To control the vertical displacement under
the column removal, the sensitivity indices show that the dead
load, modulus of elasticity, and the height of the beam are
0 0.05 0.1 0.15 0.2 0.25 0.3 0.35 0.4 0.45
DL
Eb
t1b
l
t2b
tfb
LLapt
twb
fyb
0 0.05 0.1 0.15 0.2 0.25 0.3 0.35 0.4 0.45
DL
Eb
t1b
l
t2b
tfb
LLapt
twb
fyb
(a) (b)
μ=1μ=0
μ=1μ=0
Sensitivity Sensitivity
F I G U R E 1 0 Fuzzy sensitivity indices: (a) first-order sensitivities and (b) total effects
12 JAVIDAN AND KIM
the most influential parameters. Thus, one possible option is
to reduce mass. It is observed that the beams remain elastic
and the yield strength does not contribute very much to the
output variance. Instead the height of the beam is the second
influential parameter; therefore the next option can be increas-
ing the stiffness by strengthening the beams and increasing
their moment of inertia using plate. Because other six param-
eters have little or no influence, it is possible to omit six
other parameters for the computational efficiency in further
analysis. This simplification based on Sobol indices can be
also used for the reliability-based design, and it is possible to
reduce the input variables according to the desired accuracy.
To summarize, any system having input parameters with
stochastic and informal uncertainties can be analyzed to quan-
tify the influence of input uncertainties on the variance of
the output responses. The fuzzy sensitivity index for an input
parameter developed here has two components as a fuzzy
number, that is, elements of sensitivity indices and their cor-
responding functional values which show the degree of truth.
The former, the value of each element, is resulted from the
stochastic nature of the considered input parameter, and the
latter, the degree of truth, ensues from the informal uncer-
tainty. The values of the sensitivity index are between 0 and
1, showing the influence of the considered input parameter as
a percentage of the total output variance compared to other
input parameters. These elements also provide a range show-
ing the maximum and the minimum possible impact of the
considered variable on the output variability. The degree of
truth for possible sensitivity indices in this range is indicated
by the membership function. As mentioned earlier, the effects
of interaction between input parameters can be also quantified
using total effect indices. Although fuzzy sensitivity indices
contain important information, they can be also defuzzified to
help decision making. In general, it is seen that the suggested
fuzzy global sensitivity analysis can provide detailed insight
into the characteristics of fuzzy random structural systems,
and it can be also used in other types of systems as well.
At last it should be mentioned that the fuzzy fragility
curves were obtained using 40 load factors, and for each load
factor the search algorithm was utilized when 𝛼 = 0. It was
conducted using 100 individuals and 10 generations for two
times to find maximum and minimum failure probabilities.
Failure probabilities corresponding to 𝛼 = 1 were obtained
using one MCS. Bearing in mind that each MCS was carried
out using 105samples and three limit states, a total number
of 3 × 40 × (2 × 100 × 10 + 1) × 105 ≈ 2.4 × 10¹⁰ analyses
were conducted using the ANN. To find the proper number of
samples for fuzzy global sensitivity analysis, the fuzzy sum
of first-order sensitivity indices was calculated 100 times for
each number of samples using the same search algorithm
and the same two 𝛼-levels. Each fuzzy sum of the first-order
sensitivity indices was determined by calculating the nine
first-order sensitivity indices using the estimators with the
mentioned total cost of 𝑁(𝐾 + 2) runs, where 𝑁 is the
number of samples and 𝐾 is the number of variables. Hence,
the total number of analyses for 𝑁 = 2 × 10³, 5 × 10³, 1 ×10⁴, 2 × 10⁴, 5 × 10⁴, 1 × 10⁵, can be found by
∑𝑁
100 × (2 × 10 × 100 + 1)
× (𝑁 × (9 + 2)) ≈ 4.1 × 10¹¹ (12)
Therefore, in this study, a total number of 4.3 × 10¹¹ analy-
ses were conducted approximately using the ANN. The ANN
metamodel was trained with 400 samples from the 3D col-
lapse simulation consisting of two nonlinear static analyses
and one nonlinear dynamic analysis, which takes around 190
s for each collapse simulation using a PC with the Intel® Core
i7 3.40 GHz. On the other hand, 105 simulations using the
ANN metamodel take 0.041 s. Based on this, the effective-
ness of the ANN in probabilistic analyses, especially for time-
consuming analyses, can be seen clearly.
8 CONCLUSIONS
In this study, a variance-based global sensitivity analysis was
presented to evaluate quantitatively the effects of fuzzy ran-
dom structural variables on a considered output response. To
this end, the formulation of fuzzy Sobol sensitivity indices
for fuzzy random structural systems was presented, which can
show the influence of epistemic and aleatory uncertainties of
the input parameters on the variance of output responses. Then
the informal uncertainty in derivation of distinct limit states
for collapse analysis was addressed briefly. These results can
be used for simplification in reliability-based analysis and
design by reducing noninfluential input variables. They also
can be used for limiting the output results by controlling the
input parameters. The formulation was provided using both
the extension principle and the 𝛼-optimization method. The
𝛼-level optimization method was applied using the GA due to
the advantages such as ability of finding global optima, having
good performance in highly nonlinear problems, and easy-to-
understand concept.
The proposed method was applied to the collapse assess-
ment of a steel moment resisting frame subjected to a sudden
column removal. An ANN metamodel was utilized to investi-
gate the structural behavior thoroughly and reduce the costly
probabilistic collapse analysis. The overall collapse behavior
and the influence of fuzzy limit states were evaluated using
fuzzy fragility curves to compute the fuzzy sensitivity
indices. The developed sensitivity test showed that the most
influential input variables were related to the elastic behavior
of the structure, and therefore it was conceived that the case
study structure remained in the elastic range when subjected

JAVIDAN AND KIM 13
to the sudden removal of the corner column. The results
were consistent with the fuzzy fragility curves because the
exceedance probability of the LS performance level under the
load factor of 1 is almost zero. However, the structure failed to
meet the IO performance level. One can retrofit the structure
by directly controlling the influential parameters obtained
using the computed fuzzy sensitivity indices. In this way,
the proposed fuzzy global sensitivity analysis can provide
detailed insight into the behavior of a fuzzy random structural
model. Finally, it was observed that the informal uncertainty
in derivation of acceptance criteria and limit states could
affect the reliability analysis considerably, and the application
of the ANN could reduce the computational cost drastically.
Nevertheless, the high computational cost for nonlinear
structural analysis is still a barrier to practical applications.
Sensitivity analysis is commonly utilized in the context of
stochasticity and therefore the sensitivity indices here were
formulated for fuzzy random input variables. Some models
may contain both fuzzy random and fuzzy input variables
and the effects of fuzzy input variables should be quantified
in addition to fuzzy random input variables. The formulation
of such sensitivity analysis still needs further research.
ACKNOWLEDGMENTSThis research was supported by Basic Science Research
Program through the National Research Foundation of Korea
(NRF) funded by the Ministry of Education (NRF2016R1D1-
A1B03932880). The authors would like to thank the Editor
and the five anonymous reviewers for their constructive
comments and valuable suggestions to improve the quality of
the article.
R E F E R E N C E SAdeli, H., & Kumar, S. (1995). Distributed genetic algorithm for struc-
tural optimization. Journal of Aerospace Engineering, 8(3), 156–
163.
Adeli, H., & Sarma, K. C. (2006). Cost optimization of structures: Fuzzylogic, genetic algorithms, and parallel computing. Hoboken: John
Wiley & Sons.
Ahmadi, R., Rashidian, O., Abbasnia, R., Mohajeri Nav, F.,
& Usefi, N. (2016). Experimental and numerical evalua-
tion of progressive collapse behavior in scaled RC Beam-
Column subassemblage. Shock and Vibration, 2016, 3748435,
https://doi.org/10.1155/2016/3748435.
Amini, F., Bitaraf, M., Eskandari Nasab, M. S., & Javidan, M. M. (2018).
Impacts of soil-structure interaction on the structural control of non-
linear systems using adaptive control approach. Engineering Struc-tures, 157, 1–13.
Arwade, S. R., Moradi, M., & Louhghalam, A. (2010). Variance decom-
position and global sensitivity for structural systems. EngineeringStructures, 32(1), 1–10.
ASCE. (2013). Seismic rehabilitation of existing buildings (ASCE/SEI
41-13). Reston, VA.
Boscato, G., Russo, S., Ceravolo, R., & Fragonara, L. Z. (2015).
Global sensitivity-based model updating for heritage structures.
Computer-Aided Civil and Infrastructure Engineering, 30(8), 620–
635.
Cardoso, J. B., de Almeida, J. R., Dias, J. M., & Coelho, P. G. (2008).
Structural reliability analysis using Monte Carlo simulation and
neural networks. Advances in Engineering Software, 39(6), 505–
513.
Castillo, E., Grande, Z., Mora, E., Lo, H. K., & Xu, X. (2017). Com-
plexity reduction and sensitivity analysis in road probabilistic safety
assessment Bayesian network models. Computer-Aided Civil andInfrastructure Engineering, 32(7), 546–561.
CEN. (1993). EN 10034: 1993–Structural steel I and H sections—Tolerances on shape and dimensions. CEN (European Committee for
Standardization), Brussels.
Cha, Y.-J., Choi, W., Suh, G., Mahmoudkhani, S., & Büyüköztürk, O.
(2018). Autonomous structural visual inspection using region-based
deep learning for detecting multiple damage types. Computer-AidedCivil and Infrastructure Engineering, 33(9), 731–747.
Chojaczyk, A., Teixeira, A., Neves, L. C., Cardoso, J., & Soares, C. G.
(2015). Review and application of artificial neural networks models
in reliability analysis of steel structures. Structural Safety, 52, 78–89.
Cui, L., Lu, Z., & Wang, P. (2011). Reliability sensitivity analysis with
mixture of random and fuzzy variables. International Conferenceon Quality, Reliability, Risk, Maintenance, and Safety Engineering(ICQR2MSE), IEEE, 833–838.
DoD. (2016). Unified facilities criteria: Design of buildings to resistprogressive collapse. Department of Defense (DoD) UFC 4-023-03,
Washington, DC.
D'Urso, M. G., Masi, D., Zuccaro, G., & De Gregorio, D. (2018). Multi-
criteria fuzzy analysis for a GIS-based management of earthquake
scenarios. Computer-Aided Civil and Infrastructure Engineering,
33(2), 165–179.
Ellingwood, B., Galambos, T. V., MacGregor, J. G., & Cornell, C.
A. (1980). Development of a probability based load criterion forAmerican National Standard A58 - Building Code Requirementsfor minimum design loads in buildings and other structures. Wash-
ington, DC: US Department of Commerce, National Bureau of
Standards.
Graf, W., Hoffmann, A., Möller, B., Sickert, J. U., & Steinigen, F. (2007).
Analysis of textile-reinforced concrete structures under considera-
tion of non-traditional uncertainty models. Engineering Structures,
29(12), 3420–3431.
GSA. (2016). Alternate path analysis & design guidelines for progressivecollapse resistance. Washington, DC: General Services Administra-
tion (GSA).
Hashemi, H., & Abdelghany, K. (2018). End-to-end deep learning
methodology for real-time traffic network management. Computer-Aided Civil and Infrastructure Engineering, 33(10), 849–863.
Jafari, P., & Jahani, E. (2016). Reliability sensitivities with fuzzy ran-
dom uncertainties using genetic algorithm. Structural Engineeringand Mechanics, 60(3), 413–431.
Jahani, E., Muhanna, R. L., Shayanfar, M. A., & Barkhordari, M. A.
(2014). Reliability assessment with fuzzy random variables using
interval Monte Carlo simulation. Computer-Aided Civil and Infras-tructure Engineering, 29(3), 208–220.

14 JAVIDAN AND KIM
Javidan, M. M., Kang, H., Isobe, D., & Kim, J. (2018). Computationally
efficient framework for probabilistic collapse analysis of structures
under extreme actions. Engineering Structures, 172, 440–452.
JCSS. (2001). Probabilistic model code Joint Committee on Structural
Safety, https://www.jcss.byg.dtu.dk/.
Jiang, X., & Adeli, H. (2008). Dynamic fuzzy wavelet neuroemulator
for nonlinear control of irregular building structures. InternationalJournal for Numerical Methods in Engineering, 74(7), 1045–1066.
Jin, X.-H., & Doloi, H. (2009). Modeling risk allocation in privately
financed infrastructure projects using fuzzy logic. Computer-AidedCivil and Infrastructure Engineering, 24(7), 509–524.
Kala, Z. (2011). Sensitivity analysis of steel plane frames with initial
imperfections. Engineering Structures, 33(8), 2342–2349.
Kala, Z. (2016). Global sensitivity analysis in stability problems of steel
frame structures. Journal of Civil Engineering and Management,22(3), 417–424.
Kim, J., Park, J., & Lee, T. (2011). Sensitivity analysis of steel buildings
subjected to column loss. Engineering Structures, 33, 421–432
Kirke, A., & Hao, H. (2004). Estimation of failure probabilities of RC
frame structures in Singapore to the simulated largest credible ground
motion. Engineering Structures, 26(1), 139–150.
Mazzoni, S., McKenna, F., Scott, M. H., Fenves, G. L. et al. (2006).
OpenSees command language manual. Pacific Earthquake Engineer-
ing Research (PEER) Center.
Mitropoulou, C. C., & Papadrakakis, M. (2011). Developing fragility
curves based on neural network IDA predictions. Engineering Struc-tures, 33(12), 3409–3421.
Mohajeri Nav, F., Abbasnia, R., Rashidian, O., & Usefi, N. (2016). The-
oretical resistance of RC frames under the column removal scenario
considering high strain rates. Journal of Performance of ConstructedFacilities, 30(5), 04016025.
Möller, B., & Beer, M. (2004). Fuzzy randomness: Uncertainty in civilengineering and computational mechanics. Berlin: Springer Science
& Business Media.
Möller, B., Beer, M., Graf, W., & Hoffmann, A. (1999). Possibility the-
ory based safety assessment. Computer-Aided Civil and Infrastruc-ture Engineering, 14(2), 81–91.
Möller, B., Beer, M., Graf, W., & Sickert, J.-U. (2006). Time-dependent
reliability of textile-strengthened RC structures under consideration
of fuzzy randomness. Computers & Structures, 84(8-9), 585–603.
Möller, B., Graf, W., & Beer, M. (2000). Fuzzy structural analysis using
𝛼-level optimization. Computational Mechanics, 26(6), 547–565.
Möller, B., Graf, W., & Beer, M. (2003). Safety assessment of structures
in view of fuzzy randomness. Computers & Structures, 81(15), 1567–
1582.
Möller, B., Liebscher, M., Schweizerhof, K., Mattern, S., & Blanken-
horn, G. (2008). Structural collapse simulation under consideration
of uncertainty—Improvement of numerical efficiency. Computers &Structures, 86(1920), 1875–1884.
Muhanna, R. L., & Mullen, R. L. (1999). Formulation of fuzzy finite-
element methods for solid mechanics problems. Computer-AidedCivil and Infrastructure Engineering, 14(2), 107–117.
Nabian, M. A., & Meidani, H. (2018). Deep learning for accelerated seis-
mic reliability analysis of transportation networks. Computer-AidedCivil and Infrastructure Engineering, 33(6), 443–458.
Nomura, Y., Furuta, H., & Hirokane, M. (2007). An integrated fuzzy con-
trol system for structural vibration. Computer-Aided Civil and Infras-tructure Engineering, 22(4), 306–316.
Ponz-Tienda, J. L., Pellicer, E., Benlloch-Marco, J., & Andrés-Romano,
C. (2015). The fuzzy project scheduling problem with minimal gener-
alized precedence relations. Computer-Aided Civil and InfrastructureEngineering, 30(11), 872–891.
Rafiei, M. H., & Adeli, H. (2018). A novel unsupervised deep learning
model for global and local health condition assessment of structures.
Engineering Structures, 156, 598–607.
Saltelli, A., Ratto, M., Andres, T., Campolongo, F., Cariboni, J., Gatelli,
D., & Tarantola, S. (2008). Global sensitivity analysis: The primer.
Chichester: John Wiley & Sons.
Saltelli, A., Tarantola, S., Campolongo, F., & Ratto, M. (2004). Sensitiv-ity analysis in practice: A guide to assessing scientific models. Chich-
ester: John Wiley & Sons.
Sarma, K. C., & Adeli, H. (2000). Fuzzy genetic algorithm for optimiza-
tion of steel structures. Journal of Structural Engineering, 126(5),
596–604.
Sarma, K. C., & Adeli, H. (2002). Life-cycle cost optimization of steel
structures. International Journal for Numerical Methods in Engi-neering, 55(12), 1451–1462.
Shayanfar, M. A., & Javidan, M. M. (2017). Progressive collapse-
resisting mechanisms and robustness of RC frame–shear wall struc-
tures. Journal of Performance of Constructed Facilities, 31(5),
04017045.
Thinley, K., & Hao, H. (2017). Seismic performance of reinforced con-
crete frame buildings in Bhutan based on fuzzy probability analysis.
Soil Dynamics and Earthquake Engineering, 92, 604–620.
Usefi, N., Nav, F. M., & Abbasnia, R. (2016). Finite element analysis of
RC elements in progressive collapse scenario. Gradevinar, 68(12),
1009–1022.
Wang, L., Ma, Y., Zhang, J., & Liu, Y. (2012). Probabilistic analysis
of corrosion of reinforcement in RC bridges considering fuzziness
and randomness. Journal of Structural Engineering, 139(9), 1529–
1540.
Xu, G., & Ellingwood, B. R. (2011). Probabilistic robustness assessment
of pre-Northridge steel moment resisting frames. Journal of Struc-tural Engineering, 137(9), 925–934.
Zadeh, L. A. (1965). Fuzzy sets. Information and Control, 8(3), 338–353.
How to cite this article: Javidan MM, Kim J.
Variance-based global sensitivity analysis for fuzzy
random structural systems. Comput Aided Civ Inf.2019;1–14. https://doi.org/10.1111/mice.12436