Embed Size (px)
Citation preview

© The Author 2015. Published by Oxford University Press. All rights reserved. For Permissions, please email: [email protected]
Tree Physiology 35, 148–159doi:10.1093/treephys/tpu107
Variation in foliar respiration and wood CO2 efflux rates among species and canopy layers in a wet tropical forest
Shinichi Asao1,2,5, Ricardo Bedoya-Arrieta3 and Michael G. Ryan2,4
1Graduate Degree Program in Ecology, Colorado State University, Fort Collins, CO 80523-1401, USA; 2Natural Resources Ecology Laboratory, Colorado State University, Fort Collins, CO 80523-1499, USA; 3La Selva Biological Station, Organization for Tropical Studies, Puerto Viejo de Sarapiqui, Costa Rica; 4Emeritus, USDA Forest Service, Rocky Mountain Research Station, 240 West Prospect Street, Fort Collins, CO 80526, USA; 5Corresponding author ([email protected])
Received July 25, 2014; accepted November 11, 2014; published online January 16, 2015; handling Editor David Tissue
As tropical forests respond to environmental change, autotrophic respiration may consume a greater proportion of carbon fixed in photosynthesis at the expense of growth, potentially turning the forests into a carbon source. Predicting such a response requires that we measure and place autotrophic respiration in a complete carbon budget, but extrapolating mea-surements of autotrophic respiration from chambers to ecosystem remains a challenge. High plant species diversity and complex canopy structure may cause respiration rates to vary and measurements that do not account for this complexity may introduce bias in extrapolation more detrimental than uncertainty. Using experimental plantations of four native tree species with two canopy layers, we examined whether species and canopy layers vary in foliar respiration and wood CO2 efflux and whether the variation relates to commonly used scalars of mass, nitrogen (N), photosynthetic capacity and wood size. Foliar respiration rate varied threefold between canopy layers, ∼0.74 μmol m−2 s−1 in the overstory and ∼0.25 μmol m−2 s−1 in the understory, but little among species. Leaf mass per area, N and photosynthetic capacity explained some of the variation, but height explained more. Chamber measurements of foliar respiration thus can be extrapolated to the canopy with rates and leaf area specific to each canopy layer or height class. If area-based rates are sampled across canopy layers, the area-based rate may be regressed against leaf mass per area to derive the slope (per mass rate) to extrapolate to the canopy using the total leaf mass. Wood CO2 efflux varied 1.0–1.6 μmol m−2 s−1 for overstory trees and 0.6–0.9 μmol m−2 s−1 for understory species. The variation in wood CO2 efflux rate was mostly related to wood size, and little to species, canopy layer or height. Mean wood CO2 efflux rate per surface area, derived by regressing CO2 efflux per mass against the ratio of surface area to mass, can be extrapolated to the stand using total wood surface area. The temperature response of foliar respiration was similar for three of the four species, and wood CO2 efflux was similar between wet and dry seasons. For these species and this forest, vertical sampling may yield more accurate estimates than would temporal sampling.
Keywords: autotrophic respiration, carbon fluxes and pools, ecophysiology, leaf dry mass per area, photosynthesis, rainforest, vertical gradient.
Introduction
Autotrophic respiration consumes 30–70% of the carbon fixed in photosynthesis to supply energy for metabolism and growth (Charles-Edwards 1981, Ryan et al. 1997, Chambers et al. 2004, DeLucia et al. 2007, Litton et al. 2007, Luyssaert et al. 2007). It remains uncertain, however, whether autotrophic respiration will consume a greater fraction of photosynthesis at the expense
of growth as forests respond to changes in temperature, precipi-tation and species composition. Because of this uncertainty, pre-dictions of future carbon balance remain difficult, particularly for tropical forests (Chambers et al. 2004, Malhi et al. 2011, Malhi 2012): will tropical forests turn from a carbon sink (Fan et al. 1990, Grace et al. 1995, Cao and Woodward 1998, Malhi et al. 1998, Phillips et al. 1998, Loescher et al. 2003) to a carbon
Research paper
at DigiT
op USD
A's D
igital Desktop L
ibrary on July 7, 2015http://treephys.oxfordjournals.org/
Dow
nloaded from
Tree Physiology Online at http://www.treephys.oxfordjournals.org
source as temperatures increase (Kindermann et al. 1996, Braswell et al. 1997, Tian et al. 1998, Cox et al. 2000, White et al. 2000, Cramer et al. 2001, Clark et al. 2003)?
Crucial to the prediction are the fundamental questions about autotrophic respiration that can only be answered by measuring autotrophic respiration and placing it in a whole-forest carbon budget. Is autotrophic respiration a constant fraction of photo-synthesis (Waring et al. 1998, DeLucia et al. 2007, Litton et al. 2007)? Why then do black spruce (Picea mariana (Mill.) Britton, Sterns and Poggenburg (Ryan et al. 1997)) and wet primary tropical forests (Chambers et al. 2004, Luyssaert et al. 2007, Malhi 2012) consume ∼70% of photosynthesis compared with the assumed 50% (Waring et al. 1998, Litton et al. 2007)? Will the fraction of respiration to photosynthesis change as tem-peratures increase (Ryan 1991, Atkin 2003, Atkin et al. 2005)? We will only answer these questions by placing autotrophic respiration in the context of a complete carbon balance (Ryan et al. 2004), by measuring the autotrophic respiration for stud-ies where we have all of the other components of the carbon budget (Litton et al. 2007) and by developing robust sampling and extrapolation protocols (Sprugel et al. 1995, Cavaleri et al. 2006, 2008).
Foliar respiration and wood CO2 efflux rates can vary over 20-fold within a forest (Sprugel et al. 1995), so schemes to sample, understand and extrapolate respiration rates are criti-cally important to producing estimates of aboveground foliar dark respiration and wood CO2 efflux. Because respiration sup-ports biochemical and physiological processes at the cellular level (Amthor 2000, Thornley and Cannell 2000), foliar respira-tion and wood CO2 efflux rates per unit surface area generally scale with mass (Ryan 1990, Sprugel 1990, Wright et al. 2004), nitrogen (N) content (Penning de Vries 1975, Field and Mooney 1986, Evans 1989, Ryan 1995, Reich et al. 2006), growth rate (Williams et al. 1987, 1989) and chemical composition of new tissue (Penning de Vries et al. 1974, Chapin 1989, Poorter and Bergkotte 1992). These scalars in turn vary with many factors such as species, irradiance and nutrient availability, to create some of the variation in foliar respiration and wood CO2 efflux both vertically and horizontally within a stand. The variation is accounted for if the relationship between the scalars and respi-ration is adequately captured in the sampling and extrapolating procedure.
Knowledge of these sources of variation does not yield simple schemes to extrapolate from the chamber to the ecosystem, if foliar respiration and wood CO2 efflux vary independently of the scalars. The relationships between respiration and these scalar variables change within a stand, throughout the year, and with ontogeny (Ryan 1990, Sprugel et al. 1995, Ryan et al. 2009). Other less known sources of variation, such as phloem trans-port, waste respiration and translocation of CO2 from elsewhere (Amthor 2000, Thornley and Cannell 2000, Teskey et al. 2008), also may alter the relationship between CO2 efflux and scaling
variables. The few extant studies in tropical forests showed that species differences in wood CO2 efflux were related to wood size (Yoda et al. 1965, Yoda 1967) and also to growth rate that differed among dominant tree species, other canopy tree spe-cies and understory plants independently of mass or N content (Cavaleri et al. 2006, 2008). Both foliar respiration and wood CO2 efflux increased with height independently of commonly used scalars as well (Cavaleri et al. 2006, 2008). Such variation causes bias in plot level and thus ecosystem-level estimates of autotrophic respiration when sampling and extrapolation fails to account for the variation. This bias is much more detrimental than uncertainty. Within-plot variance adds approximately zero to total variance in field studies (Giardina and Ryan 2002), but within-plot bias is propagated to the ecosystem level estimates.
In this study, we examine how rates of foliar dark respiration and wood CO2 efflux vary among species and canopy layers so we can understand where to best sample rates, what causes the variation in rates and how to extrapolate those fluxes to produce unbiased estimates of aboveground autotrophic res-piration. We hypothesized that foliar respiration and wood CO2 efflux rates would vary among species and canopy lay-ers because: (i) for foliar respiration, leaves of different spe-cies and in different canopy layers have very different cellular activity related to differences in protein (N concentration), pho-tosynthetic activity and mass; (ii) for foliar respiration, short-term temperature response will vary with respiration rate as it did for a primary forest (Cavaleri et al. 2008); (iii) for wood CO2 efflux, growth process dominate over maintenance of bio-mass and stems and branches of different species and canopy layers grow at different rates (Ryan et al. 1994); and (iv) this variability with species and canopy layers thus produce biased estimates of aboveground respiration flux if measurements are taken at a single point.
Materials and methods
Study site
We conducted this study at La Selva Biological Station, in the Atlantic Lowlands of Costa Rica (10°26′N, 84º00′W). La Selva's climate is classified as tropical wet forest in the Holdridge sys-tem (McDade 1994), with annual mean rainfall and tempera-ture of 4000 mm and 26 °C, respectively. For 2009 and 2010, when measurements were taken, the rainfall was 4500 mm and the temperature averaged 25 °C. Soils at the site are acidic, highly leached, high in organic matter content and clas-sified as Mixed Haplic Haploperox (Kleber et al. 2007).
The site was cleared of primary forest in 1955, converted to pasture in 1956 and then continually grazed until 1987. In 1988, an experiment was established with 11 tree spe-cies and an abandoned pasture control, replicated over four blocks in a randomized complete block design (Fisher 1995). Plot dimensions were 50 × 50 m (0.25 ha), with a single-tree
Foliar respiration and wood CO2 efflux of a tropical forest 149
at DigiT
op USD
A's D
igital Desktop L
ibrary on July 7, 2015http://treephys.oxfordjournals.org/
Dow
nloaded from
Tree Physiology Volume 35, 2015
species planted in each plot except for the unplanted control. The trees were planted during 1988. Understory plants were cleared for the first 3 years until the trees were established, but then allowed to regenerate naturally. By 2009, only four species had enough surviving trees for plot-level measure-ments, and these were the subjects of this study.
The four species studied were Hieronyma alchorneoides Allemao, Pentaclethra macroloba (Willd.) Kunth., Virola koschnyi Warb. and Vochysia guatemalensis Donn. Sm. All are native to the surrounding primary forest, and Pentaclethra is the domi-nant species of canopy trees at La Selva, and the only N-fixing species of the four. The stands had aboveground biomass measuring 5410–9870 g C m−2 comparable to 7200 g C m−2 of the surrounding primary forest, and an leaf area index (LAI) of 5.2–6.5 similar to 6.0 in the surrounding forest. The planted trees dominated each species stand with them consisting on average 88% of the aboveground biomass. Stand character-istics are given in Table 1, and further details of the site and its history can be found in Fisher (1995) and Russell et al. (2010). We conducted this study as part of a larger project, ECOS (http://www.nrem.iastate.edu/ECOS/home, 10 December 2014, date last accessed), examining tree species effects on ecosystem processes (Raich et al. 2007, 2009, Russell et al. 2010, Russell and Raich 2012).
Sampling
Canopy at the site consisted of two distinct layers, overstory in the upper 15–35 m and understory in the lower 0–15 m. The overstory was occupied by foliage of the planted trees, but the understory included the naturally sprouted seedlings and saplings of the planted species, and other trees, forbs, grasses and ferns from the surrounding forest. The planted trees had very little foliage in the understory: overstory refers to the planted tree species and their foliage, and understory refers to all the other individuals. Species composition in the understory differed among the overstory species.
Foliar respiration for the overstory trees was measured on ∼20 branches (∼16 near the top of the canopy and ∼4 from lower in the canopy) from two to four individuals per plot using a 30-m scaffolding tower (Upright, Inc., Dublin, Ireland) for
access. Measurements were taken on one plot per species in 2009 during the wetter summer months and on a different plot in 2010 during the less wet winter and spring months. In the understory, 10–15 individuals were sampled per plot in all four blocks (two in summer 2009 and two in winter 2010).
Wood CO2 efflux of the overstory trees was measured at 1.4 m height on 15 trees per plot for all four plots per species in summer 2009 and winter 2010. Wood CO2 efflux was also measured from the scaffold tower on one to three stems at 1.8 m intervals >1.4 m and on 10–15 branches in the upper canopy in two of the four blocks (one in summer 2009 and one in winter 2010). Wood CO2 efflux for woody understory plants was made on all four plots for the same sampling periods (zero to six trees per plot), but the sample was limited as only a few of the understory plants were large enough for measurement.
Ecophysiological measurements
Foliar respiration was measured on one to five leaves of sam-pled branches in a 1580-ml volume polycarbonate chamber on detached foliage at night. Branches were cut underwater in the afternoon, placed in a floral tube with water without exposing the cut surface to air and CO2 efflux measured at the lab in the dark from 20:00 and 02:00 (after >2 h of darkness). Attached and detached foliage had a similar respiration rate in a previous study at La Selva (Cavaleri et al. 2008) and in several studies at other locations (Mitchell et al. 1999, Turnbull et al. 2005). Immediately after measurement, the foliage was measured for leaf area with a leaf area meter (LI-3100, LI-COR, Inc., Lincoln, NE, USA). The foliage was then dried for 48 h at 65 °C and measured for leaf dry mass, and ground to a powder with a Wiley mill and measured for leaf N with a CN analyzer (TruSpec CN, LECO, Inc., St Joseph, MI, USA).
Wood CO2 efflux was measured using clear polycarbonate chambers on intact stems or branches between 07:00 and 17:00. Because the chambers were clear, they allowed bark photosynthesis and our measurement was thus a sum of wood tissue respiration (+flux), bark photosynthesis (−flux) and CO2 dissolved in the xylem sap (Cernusak and Marshall 2000, McGuire and Teskey 2004, Bowman et al. 2005, Teskey et al. 2008). However, the contribution of bark photosynthesis may
150 Asao et al.
Table 1. Mean and maximum values of density, diameter at breast height and height, and LAI for overstory (planted) trees and understory plants of each species' plot. Data taken in 2009 survey as part of a larger study (ECOS, http://www.nrem.iastate.edu/ECOS/home), and LAI taken from Russell et al. (2010).
Planted species Stem density (trees ha−1)
Diameter (cm) Height (m) LAI
Mean Max Mean Max Mean Max Overstory Understory
Hieronyma alchorneoides 165 176 25 33 23 47 3.7 1.6Pentaclethra macroloba 294 380 21 27 14 52 5.0 1.5Virola koschnyi 226 284 24 30 20 43 3.7 2.6Vochysia guatemalensis 255 280 31 40 24 62 3.1 3.1
at DigiT
op USD
A's D
igital Desktop L
ibrary on July 7, 2015http://treephys.oxfordjournals.org/
Dow
nloaded from
Tree Physiology Online at http://www.treephys.oxfordjournals.org
be small, and the influence of CO2 dissolved in the xylem sap may be relatively constant, as a previous study in the surround-ing forest found that the monthly mean wood CO2 efflux did not vary with daily temperature, precipitation or photosyntheti-cally active radiation (Cavaleri et al. 2006). Wood surface area was estimated as the area inside the gasket creating the seal between the chamber and the wood. Wood volume sampled by the chamber was estimated by multiplying the volume of the underlying wood cylinder (height equal to chamber height) by the ratio of the surface area inside the chamber gasket to the surface area of the wood cylinder (amounting to a wedge-shaped slice). The volume was then converted to mass using species-specific wood density.
All chambers had neoprene gaskets to form a seal and a small fan to mix the air inside and were attached to an infrared gas analyzer. Chambers varied in size and shape to ensure fit on wood with different diameters. Chamber volume ranged from 16 to 47 ml for wood CO2 efflux (enclosed wood surface area of 3–28 cm2). Chamber seals were checked with a flow meter, and wood and foliage surface temperature were measured with an infrared thermometer (OS423-LS, OMEGA Engineering, Stamford, CT, USA). CO2 efflux was measured with an open-system LCA-3 (Analytical Development Company, Hoddeson, UK) infrared gas analyzer (IRGA) for 2009 measurements, or a lab-built closed-system instrument with Li-820 (LI-COR, Inc.) and CR10X data logger (Campbell Scientific, Logan, UT, USA) for 2010 measurements. The open-system IRGA drew ambient air from a 19 l mixing container to maintain stable concentration of reference CO2 during measurements, and the airflow rates through the chamber ranged between 200 and 340 μmol s−1 for measurements. Both instruments were regularly calibrated with a CO2 standard, and produced similar values (P = 0.26; repeated measures ANOVA; see Discussion).
Before detaching the branches to measure foliar respiration at night, the intact leaves were measured for photosynthesis using an open-system portable IRGA (LI-6400, LI-COR, Inc.). The measurements were taken on five fully expanded leaves, on the same branches sampled for respiration for foliage in the overstory but on different branches for foliage in the under-story. Each leaf was measured once a day for 2–9 days for canopy foliage, and once for understory foliage. Photosynthesis was measured under a reference CO2 of 390 μmol mol−1; at an air flow rate of 500 μmol s−1 and with a saturating level of pho-tosynthetic photon flux density (2000 μmol m−2 s−1 for leaves at the canopy top and 1500 μmol m−2 s−1 for lower canopy and understory leaves) after the readings stabilized. Temperature and humidity were not controlled, and were in the range 24.5–39 °C and 0.5–2 kPa in vapor pressure deficit. Values reported are averages for each branch.
A subset of the foliage was also measured at night for the temperature response of foliar respiration by estimating Q10 from a temperature response curve. Of the foliage sampled for
foliar respiration measurement, four branches from the overstory trees and three individuals of the understory plants from one block per species were measured for temperature response. Temperature response was quantified with Q10, the change in respiration rate with 10 °C change in temperature, for foliar res-piration measured 15, 20, 25, 30 and 35 °C in a temperature-controlled cuvette (Hubbard et al. 1995) and the closed-system IRGA described above. Foliar respiration was standardized to 25 °C using Q10 specific to each of the four species and two canopy layers. Wood CO2 efflux was also standardized to 25 °C, using a Q10 of 2, because the wood of two tree species in the surrounding forest had Q10 of 2.1 and 2.2 (Ryan et al. 1994), and trees in tropical rainforests in Cameroon and Brazil had 1.8 and 1.6 (Meir and Grace 2002).
Data analysis
Foliar respiration and wood CO2 efflux rates, standardized to 25 °C, and Q10 values were compared among species and between canopy layers using both a linear model ANOVA and a linear mixed-effects model ANOVA at an experiment-wise α = 0.05. A mixed-effects model was used because the over-story trees and understory plants were sampled in different blocks in 2009 than in 2010 with unequal block replicates, and block nested within a year was included as a random inter-cept. The model's independent variables were linear combina-tions of species and canopy layers, and the dependent variable was foliar respiration, the natural log of wood CO2 efflux or Q10. The Tukey–Kramer multiple comparison procedure was used to account for unbalanced sample sizes. The procedure yielded the same result for both fixed-effects only and mixed-effects models, and we present the results of the simpler fixed-effects only model.
Models of foliar respiration and wood CO2 efflux and vari-ous predictor variables were constructed using both fixed- and mixed-effect models. Both the model types produced compa-rable significance and R2 values for the same candidate variable combinations. For simplicity, we report the result of fixed-effects model, but the reported R2 values may slightly overes-timate the true value. Foliar respiration rate was modeled using three predictor variables: canopy layer (categorical: overstory or understory), species of planted trees (categorical: Hieronyma, Pentaclethra, Virola or Vochysia), and a continuous variable of either LMA (g m−2), leaf N content (g m−2) or photosynthetic capacity (μmol m−2 s−1). Because all understory samples were taken at ground level (at the same height), we examined the contribution of height of the foliage using height as the continu-ous variable replacing the canopy layer. The predictor variables and their interactions were sequentially omitted from the full model (with all three variables and their interactions) and exam-ined for their significance in predicting foliar respiration.
Wood CO2 efflux was modeled with three predictor variables: canopy layer, species and a continuous variable of wood surface
Foliar respiration and wood CO2 efflux of a tropical forest 151
at DigiT
op USD
A's D
igital Desktop L
ibrary on July 7, 2015http://treephys.oxfordjournals.org/
Dow
nloaded from
Tree Physiology Volume 35, 2015
area to mass ratio enclosed within the measurement chamber. The ratio was used to determine whether wood CO2 efflux was related to surface area or mass (Levy and Jarvis 1998). The ratio was defined as mass per surface area for modeling area-based rate, and as surface area per mass for mass-based rate: if wood CO2 efflux per unit surface area is related to mass per surface area, wood CO2 efflux is related to mass, and if wood CO2 efflux per unit mass is related to surface area per mass, wood CO2 efflux is related to surface area (Levy and Jarvis 1998). We separately examined the contribution of wood height as the continuous variable. All analyses were done in R (R Core Team 2014), with lme4 (Bates et al. 2012), multcomp (Hothorn et al. 2008) and MASS (Venables and Ripley 2002) packages, and plotted with the ggplot2 package (Wickham 2009).
Results
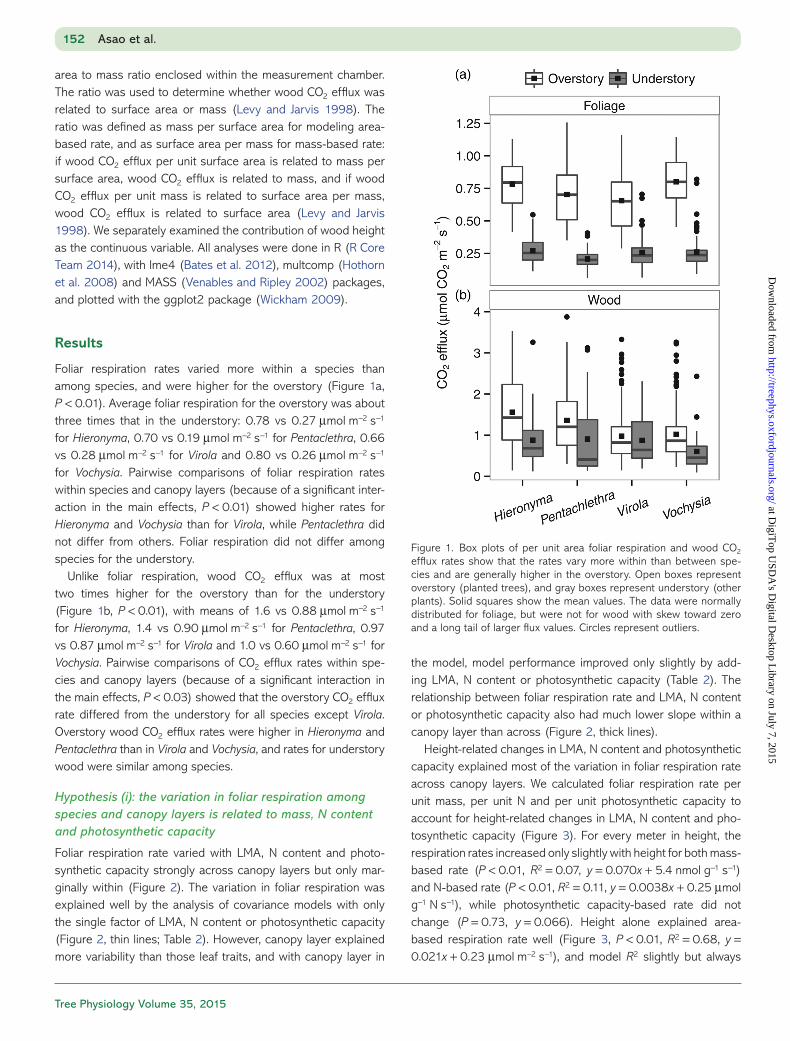
Foliar respiration rates varied more within a species than among species, and were higher for the overstory (Figure 1a, P < 0.01). Average foliar respiration for the overstory was about three times that in the understory: 0.78 vs 0.27 μmol m−2 s−1 for Hieronyma, 0.70 vs 0.19 μmol m−2 s−1 for Pentaclethra, 0.66 vs 0.28 μmol m−2 s−1 for Virola and 0.80 vs 0.26 μmol m−2 s−1 for Vochysia. Pairwise comparisons of foliar respiration rates within species and canopy layers (because of a significant inter-action in the main effects, P < 0.01) showed higher rates for Hieronyma and Vochysia than for Virola, while Pentaclethra did not differ from others. Foliar respiration did not differ among species for the understory.
Unlike foliar respiration, wood CO2 efflux was at most two times higher for the overstory than for the understory (Figure 1b, P < 0.01), with means of 1.6 vs 0.88 μmol m−2 s−1 for Hieronyma, 1.4 vs 0.90 μmol m−2 s−1 for Pentaclethra, 0.97 vs 0.87 μmol m−2 s−1 for Virola and 1.0 vs 0.60 μmol m−2 s−1 for Vochysia. Pairwise comparisons of CO2 efflux rates within spe-cies and canopy layers (because of a significant interaction in the main effects, P < 0.03) showed that the overstory CO2 efflux rate differed from the understory for all species except Virola. Overstory wood CO2 efflux rates were higher in Hieronyma and Pentaclethra than in Virola and Vochysia, and rates for understory wood were similar among species.
Hypothesis (i): the variation in foliar respiration among species and canopy layers is related to mass, N content and photosynthetic capacity
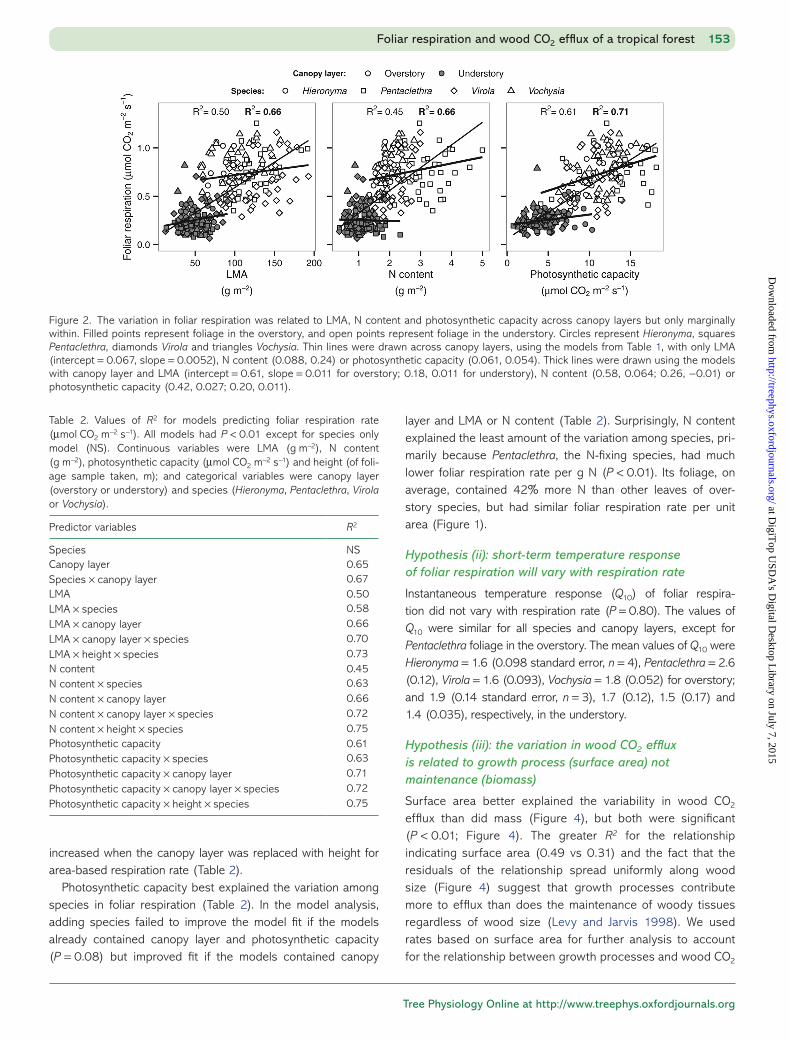
Foliar respiration rate varied with LMA, N content and photo-synthetic capacity strongly across canopy layers but only mar-ginally within (Figure 2). The variation in foliar respiration was explained well by the analysis of covariance models with only the single factor of LMA, N content or photosynthetic capacity (Figure 2, thin lines; Table 2). However, canopy layer explained more variability than those leaf traits, and with canopy layer in
the model, model performance improved only slightly by add-ing LMA, N content or photosynthetic capacity (Table 2). The relationship between foliar respiration rate and LMA, N content or photosynthetic capacity also had much lower slope within a canopy layer than across (Figure 2, thick lines).
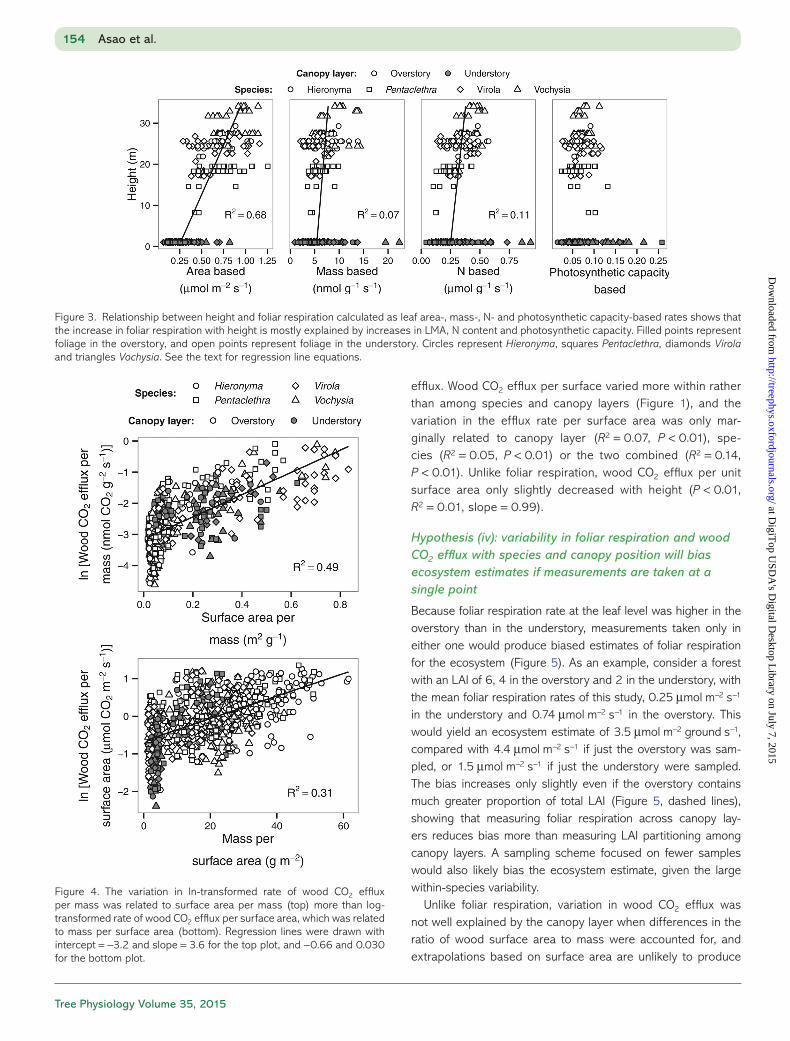
Height-related changes in LMA, N content and photosynthetic capacity explained most of the variation in foliar respiration rate across canopy layers. We calculated foliar respiration rate per unit mass, per unit N and per unit photosynthetic capacity to account for height-related changes in LMA, N content and pho-tosynthetic capacity (Figure 3). For every meter in height, the respiration rates increased only slightly with height for both mass-based rate (P < 0.01, R2 = 0.07, y = 0.070x + 5.4 nmol g−1 s−1) and N-based rate (P < 0.01, R2 = 0.11, y = 0.0038x + 0.25 μmol g−1 N s−1), while photosynthetic capacity-based rate did not change (P = 0.73, y = 0.066). Height alone explained area-based respiration rate well (Figure 3, P < 0.01, R2 = 0.68, y = 0.021x + 0.23 μmol m−2 s−1), and model R2 slightly but always
152 Asao et al.
Figure 1. Box plots of per unit area foliar respiration and wood CO2 efflux rates show that the rates vary more within than between spe-cies and are generally higher in the overstory. Open boxes represent overstory (planted trees), and gray boxes represent understory (other plants). Solid squares show the mean values. The data were normally distributed for foliage, but were not for wood with skew toward zero and a long tail of larger flux values. Circles represent outliers.
at DigiT
op USD
A's D
igital Desktop L
ibrary on July 7, 2015http://treephys.oxfordjournals.org/
Dow
nloaded from
Tree Physiology Online at http://www.treephys.oxfordjournals.org
increased when the canopy layer was replaced with height for area-based respiration rate (Table 2).
Photosynthetic capacity best explained the variation among species in foliar respiration (Table 2). In the model analysis, adding species failed to improve the model fit if the models already contained canopy layer and photosynthetic capacity (P = 0.08) but improved fit if the models contained canopy
layer and LMA or N content (Table 2). Surprisingly, N content explained the least amount of the variation among species, pri-marily because Pentaclethra, the N-fixing species, had much lower foliar respiration rate per g N (P < 0.01). Its foliage, on average, contained 42% more N than other leaves of over-story species, but had similar foliar respiration rate per unit area (Figure 1).
Hypothesis (ii): short-term temperature response of foliar respiration will vary with respiration rate
Instantaneous temperature response (Q10) of foliar respira-tion did not vary with respiration rate (P = 0.80). The values of Q10 were similar for all species and canopy layers, except for Pentaclethra foliage in the overstory. The mean values of Q10 were Hieronyma = 1.6 (0.098 standard error, n = 4), Pentaclethra = 2.6 (0.12), Virola = 1.6 (0.093), Vochysia = 1.8 (0.052) for overstory; and 1.9 (0.14 standard error, n = 3), 1.7 (0.12), 1.5 (0.17) and 1.4 (0.035), respectively, in the understory.
Hypothesis (iii): the variation in wood CO2 efflux is related to growth process (surface area) not maintenance (biomass)
Surface area better explained the variability in wood CO2 efflux than did mass (Figure 4), but both were significant (P < 0.01; Figure 4). The greater R2 for the relationship indicating surface area (0.49 vs 0.31) and the fact that the residuals of the relationship spread uniformly along wood size (Figure 4) suggest that growth processes contribute more to efflux than does the maintenance of woody tissues regardless of wood size (Levy and Jarvis 1998). We used rates based on surface area for further analysis to account for the relationship between growth processes and wood CO2
Foliar respiration and wood CO2 efflux of a tropical forest 153
Figure 2. The variation in foliar respiration was related to LMA, N content and photosynthetic capacity across canopy layers but only marginally within. Filled points represent foliage in the overstory, and open points represent foliage in the understory. Circles represent Hieronyma, squares Pentaclethra, diamonds Virola and triangles Vochysia. Thin lines were drawn across canopy layers, using the models from Table 1, with only LMA (intercept = 0.067, slope = 0.0052), N content (0.088, 0.24) or photosynthetic capacity (0.061, 0.054). Thick lines were drawn using the models with canopy layer and LMA (intercept = 0.61, slope = 0.011 for overstory; 0.18, 0.011 for understory), N content (0.58, 0.064; 0.26, −0.01) or photosynthetic capacity (0.42, 0.027; 0.20, 0.011).
Table 2. Values of R2 for models predicting foliar respiration rate (μmol CO2 m−2 s−1). All models had P < 0.01 except for species only model (NS). Continuous variables were LMA (g m−2), N content (g m−2), photosynthetic capacity (μmol CO2 m−2 s−1) and height (of foli-age sample taken, m); and categorical variables were canopy layer (overstory or understory) and species (Hieronyma, Pentaclethra, Virola or Vochysia).
Predictor variables R2
Species NSCanopy layer 0.65Species × canopy layer 0.67LMA 0.50LMA × species 0.58LMA × canopy layer 0.66LMA × canopy layer × species 0.70LMA × height × species 0.73N content 0.45N content × species 0.63N content × canopy layer 0.66N content × canopy layer × species 0.72N content × height × species 0.75Photosynthetic capacity 0.61Photosynthetic capacity × species 0.63Photosynthetic capacity × canopy layer 0.71Photosynthetic capacity × canopy layer × species 0.72Photosynthetic capacity × height × species 0.75
at DigiT
op USD
A's D
igital Desktop L
ibrary on July 7, 2015http://treephys.oxfordjournals.org/
Dow
nloaded from
Tree Physiology Volume 35, 2015
efflux. Wood CO2 efflux per surface varied more within rather than among species and canopy layers (Figure 1), and the variation in the efflux rate per surface area was only mar-ginally related to canopy layer (R2 = 0.07, P < 0.01), spe-cies (R2 = 0.05, P < 0.01) or the two combined (R2 = 0.14, P < 0.01). Unlike foliar respiration, wood CO2 efflux per unit surface area only slightly decreased with height (P < 0.01, R2 = 0.01, slope = 0.99).
Hypothesis (iv): variability in foliar respiration and wood CO2 efflux with species and canopy position will bias ecosystem estimates if measurements are taken at a single point
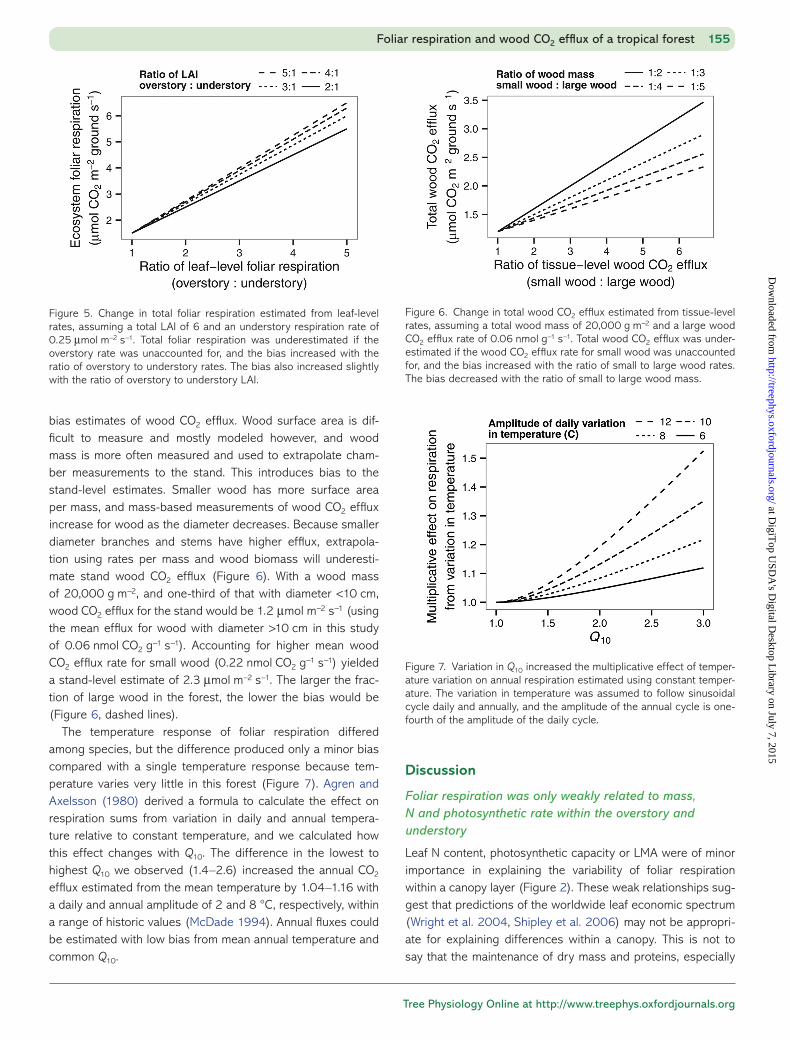
Because foliar respiration rate at the leaf level was higher in the overstory than in the understory, measurements taken only in either one would produce biased estimates of foliar respiration for the ecosystem (Figure 5). As an example, consider a forest with an LAI of 6, 4 in the overstory and 2 in the understory, with the mean foliar respiration rates of this study, 0.25 μmol m−2 s−1 in the understory and 0.74 μmol m−2 s−1 in the overstory. This would yield an ecosystem estimate of 3.5 μmol m−2 ground s−1, compared with 4.4 μmol m−2 s−1 if just the overstory was sam-pled, or 1.5 μmol m−2 s−1 if just the understory were sampled. The bias increases only slightly even if the overstory contains much greater proportion of total LAI (Figure 5, dashed lines), showing that measuring foliar respiration across canopy lay-ers reduces bias more than measuring LAI partitioning among canopy layers. A sampling scheme focused on fewer samples would also likely bias the ecosystem estimate, given the large within- species variability.
Unlike foliar respiration, variation in wood CO2 efflux was not well explained by the canopy layer when differences in the ratio of wood surface area to mass were accounted for, and extrapolations based on surface area are unlikely to produce
154 Asao et al.
Figure 3. Relationship between height and foliar respiration calculated as leaf area-, mass-, N- and photosynthetic capacity-based rates shows that the increase in foliar respiration with height is mostly explained by increases in LMA, N content and photosynthetic capacity. Filled points represent foliage in the overstory, and open points represent foliage in the understory. Circles represent Hieronyma, squares Pentaclethra, diamonds Virola and triangles Vochysia. See the text for regression line equations.
Figure 4. The variation in ln-transformed rate of wood CO2 efflux per mass was related to surface area per mass (top) more than log- transformed rate of wood CO2 efflux per surface area, which was related to mass per surface area (bottom). Regression lines were drawn with intercept = −3.2 and slope = 3.6 for the top plot, and −0.66 and 0.030 for the bottom plot.
at DigiT
op USD
A's D
igital Desktop L
ibrary on July 7, 2015http://treephys.oxfordjournals.org/
Dow
nloaded from
Tree Physiology Online at http://www.treephys.oxfordjournals.org
bias estimates of wood CO2 efflux. Wood surface area is dif-ficult to measure and mostly modeled however, and wood mass is more often measured and used to extrapolate cham-ber measurements to the stand. This introduces bias to the stand-level estimates. Smaller wood has more surface area per mass, and mass-based measurements of wood CO2 efflux increase for wood as the diameter decreases. Because smaller diameter branches and stems have higher efflux, extrapola-tion using rates per mass and wood biomass will underesti-mate stand wood CO2 efflux (Figure 6). With a wood mass of 20,000 g m−2, and one-third of that with diameter <10 cm, wood CO2 efflux for the stand would be 1.2 μmol m−2 s−1 (using the mean efflux for wood with diameter >10 cm in this study of 0.06 nmol CO2 g−1 s−1). Accounting for higher mean wood CO2 efflux rate for small wood (0.22 nmol CO2 g−1 s−1) yielded a stand-level estimate of 2.3 μmol m−2 s−1. The larger the frac-tion of large wood in the forest, the lower the bias would be (Figure 6, dashed lines).
The temperature response of foliar respiration differed among species, but the difference produced only a minor bias compared with a single temperature response because tem-perature varies very little in this forest (Figure 7). Agren and Axelsson (1980) derived a formula to calculate the effect on respiration sums from variation in daily and annual tempera-ture relative to constant temperature, and we calculated how this effect changes with Q10. The difference in the lowest to highest Q10 we observed (1.4–2.6) increased the annual CO2 efflux estimated from the mean temperature by 1.04–1.16 with a daily and annual amplitude of 2 and 8 °C, respectively, within a range of historic values (McDade 1994). Annual fluxes could be estimated with low bias from mean annual temperature and common Q10.
Discussion
Foliar respiration was only weakly related to mass, N and photosynthetic rate within the overstory and understory
Leaf N content, photosynthetic capacity or LMA were of minor importance in explaining the variability of foliar respiration within a canopy layer (Figure 2). These weak relationships sug-gest that predictions of the worldwide leaf economic spectrum (Wright et al. 2004, Shipley et al. 2006) may not be appropri-ate for explaining differences within a canopy. This is not to say that the maintenance of dry mass and proteins, especially
Foliar respiration and wood CO2 efflux of a tropical forest 155
Figure 5. Change in total foliar respiration estimated from leaf-level rates, assuming a total LAI of 6 and an understory respiration rate of 0.25 μmol m−2 s−1. Total foliar respiration was underestimated if the overstory rate was unaccounted for, and the bias increased with the ratio of overstory to understory rates. The bias also increased slightly with the ratio of overstory to understory LAI.
Figure 6. Change in total wood CO2 efflux estimated from tissue-level rates, assuming a total wood mass of 20,000 g m−2 and a large wood CO2 efflux rate of 0.06 nmol g−1 s−1. Total wood CO2 efflux was under-estimated if the wood CO2 efflux rate for small wood was unaccounted for, and the bias increased with the ratio of small to large wood rates. The bias decreased with the ratio of small to large wood mass.
Figure 7. Variation in Q10 increased the multiplicative effect of temper-ature variation on annual respiration estimated using constant temper-ature. The variation in temperature was assumed to follow sinusoidal cycle daily and annually, and the amplitude of the annual cycle is one-fourth of the amplitude of the daily cycle.
at DigiT
op USD
A's D
igital Desktop L
ibrary on July 7, 2015http://treephys.oxfordjournals.org/
Dow
nloaded from
Tree Physiology Volume 35, 2015
those associated with photosynthesis, is unrelated to foliar respiration. Across canopy layers, the variability of foliar respi-ration did follow the predictions of the spectrum as we hypoth-esized (Figure 2), consistent with existing data on neotropics (Oberbauer and Strain 1986, Meir et al. 2001, Domingues et al. 2005, Cavaleri et al. 2008, Ryan et al. 2009, Metcalfe et al. 2010). However, the weak relationships within a canopy layer suggest that foliar respiration in these species includes compo-nents unrelated to maintenance respiration, such as overflow respiration to decrease excess carbohydrates, respiration to fuel phloem loading and respiration for ion gradient mainte-nance (Penning de Vries 1975, Bouma et al. 1995, Amthor 2000, Cannell and Thornley 2000). The presence of these components is supported by existing data as well. In the sur-rounding primary forest, foliar respiration increased with height even for mass-based and N-based rates accounting for height-related changes in LMA and N content (∼0.08 nmol g−1 s−1 and ∼0.004 μmol g−1 N s−1 for every meter; Cavaleri et al. 2008). Mass-based foliar respiration rate increased by 43% under imposed drought from rainfall exclusion (Metcalfe et al. 2010), and area-based foliar respiration rate increased by 60–250% during the dry season in the Amazon (Miranda et al. 2005). Hourly rates of foliar respiration varied diurnally between 0.34 and 0.74 μmol m−2 s−1 without a clear pattern (Chambers et al. 2004). Determining how foliar respiration reflects components unrelated to maintenance respiration will not only improve the accuracy of stand-level estimates and account for special and temporal variations, but will also improve the prediction of foliar respiration response under climate change.
Wood CO2 efflux rates and patterns between plantation secondary forests and primary forests
Wood CO2 efflux rates and their variability were generally sim-ilar to studies in the primary forests. The rates we observed are consistent with those measured at the ground level on two different species of the primary forest in an earlier study (∼1.0 μmol m−2 s−1, Ryan et al. 1994), on wood >10 cm in diam-eter in a lowland Amazon forest (∼1.1 μmol m−2 s−1, Robertson et al. 2010) and in Eucalyptus plantations in Hawaii and Brazil (0.06 nmol g−1 s−1 this study; ∼0.06 nmol g−1 s−1, Ryan et al. 2009). We found that wood CO2 varies considerably from 0.09 to 3.9 μmol m−2 s−1, and the variation was mostly unrelated to species and canopy layer. The variability was also large in the primary forests (in μmol m−2 s−1: 0.1–5.2, Meir and Grace 2002, 0.03–3.6, Chambers et al. 2004, ∼0–4.5, Cavaleri et al. 2006, ∼0–4.5, Robertson et al. 2010), but smaller for two species of trees in the surrounding primary forest (0.3–2.1, Ryan et al. 1994) perhaps due to smaller sample size. The variability was related to both growth and maintenance processes, and the rela-tionships were fairly similar among species and canopy layers, also consistent with other studies (Ryan et al. 1994, Meir and Grace 2002, Robertson et al. 2010). Respiratory cost of growth
and maintenance may be well conserved within a functional group in tropical forests.
An exception was the higher wood CO2 efflux from large diameter wood and the lack of increase in wood CO2 efflux with height compared with the observations in the primary for-est (Cavaleri et al. 2006). Wood CO2 efflux for larger diameter wood averaged 1.2 μmol m−2 s−1 at ground level and slightly decreased with height in the secondary forest, compared with ∼0.8 at the ground level increasing to ∼1.7 μmol m−2 s−1 in the upper canopy of the primary forest (Cavaleri et al. 2006). The difference may be related to some combination of greater pro-portion of large size classes, higher growth rate for branches in the upper canopy (Ryan et al. 1994, 2009), or composition of species or functional groups (Cavaleri et al. 2006). These interpretations are complicated by limits to radial diffusion of CO2 in wood. The interpretations assume that local processes alone cause the variation in chamber measurements, but wood tissue, especially cambium, limits radial diffusion of CO2 and causes CO2 from elsewhere in the stem or roots to dissolve in xylem and phloem streams and be transported to the site of measurement (McGuire and Teskey 2004, Spicer and Holbrook 2005, Teskey et al. 2008, Aubrey and Teskey 2009, Trumbore et al. 2012). However, monthly mean wood CO2 efflux did not vary with rainfall, temperature or photosynthetically active irra-diation (Cavaleri et al. 2006). The diffusion barrier itself may explain why wood CO2 efflux was proportional to surface in this study. This complicates the interpretation of wood CO2 efflux as woody tissue respiration, but likely does not bias the stand-level estimates of wood CO2 efflux as the results of this study and Cavaleri et al. (2006) show.
Sampling scheme reduces bias in estimating annual aboveground autotrophic respiration
Our results suggest that vertical transect reduces bias in esti-mates of annual aboveground autotrophic respiration for a wet tropical forest. Sampling within a canopy layer or at any posi-tion within the canopy fails to measure the substantial variation in foliar respiration within the upper and lower canopy and with height (Figure 2), primarily driven by the differences in respira-tion rates among sampling positions and not the distribution of LAI (Figure 5). Cavaleri et al. (2008) showed that when full vertical transect is taken, the overall mean respiration rate and LAI produces similar estimates compared with more complex models with height structure. Taken together, they suggest that simple extrapolation models with mean respiration rate and stand LAI produce unbiased estimates of ecosystem foliar res-piration as long as the vertical transect is made to capture the variability in respiration rate along height. Similarly, unbiased estimates of ecosystem wood CO2 efflux may require a verti-cal transect, although our results suggest that stand-level esti-mates may be made with little bias if enough small diameter wood can be sampled at the ground level, as wood size was
156 Asao et al.
at DigiT
op USD
A's D
igital Desktop L
ibrary on July 7, 2015http://treephys.oxfordjournals.org/
Dow
nloaded from
Tree Physiology Online at http://www.treephys.oxfordjournals.org
the primary cause of variation in wood CO2 efflux. Our finding contradicted the observations in the primary forest, and thus vertical transect should be sampled, if only to test whether wood CO2 efflux changes with height.
Though ecosystem respiration may be uniquely aseasonal in wet tropical forests, the variation in foliar respiration and wood CO2 efflux may be common in all forests. The forest in this study has some seasonality in air temperature and rainfall, with slightly less wet season in the spring months (McDade 1994). We measured wood CO2 efflux during the wet season in 2009 and again during the less wet season in 2010 on the same individual, and all species had similar wood CO2 efflux at 1.4 m height (P = 0.26), except Hieronyma. The difference in wood CO2 efflux for Hieronyma was small, 1.9 μmol m−2 s−1 in 2009 and decreased to 1.6 μmol m−2 s−1 in 2010 (P < 0.01). Wood CO2 efflux at breast height showed no clear seasonal-ity in a more detailed measurement in the primary forest (Cavaleri et al. 2006). The smaller temperature fluctuation also reduces the effect of Q10 on annual estimates of respiratory flux (Figure 7). These evidences combined support the idea that plant respiration can be estimated and studied from measure-ments made once or twice a year (Yoda et al. 1965, Ryan et al. 1994, Chambers et al. 2004, Cavaleri et al. 2006). However, tropical forests may not be unique in the variation in foliar res-piration and wood CO2 efflux within and among canopy layers. Foliar respiration varies within a canopy in other forests likely as a function of light and height (Brooks et al. 1991, Bolstad et al. 1999, Griffin et al. 2001, Law et al. 2001, Rayment et al. 2002, Turnbull et al. 2003). Wood CO2 efflux varies within canopy also, as a function of size and height (Lavigne 1988, Sprugel 1990, Edwards and Hanson 1996, Ceschia et al. 2002, Damesin et al. 2002).
Conclusions
Foliar respiration varied a little among species and more sub-stantially between canopy layers. The variation was related to LMA, leaf N and photosynthetic capacity across canopy layers, but only marginally within, perhaps because foliar respiration includes a substantial contribution from components unrelated to maintenance. Wood CO2 efflux varied slightly among species and canopy layers and much more within, and the variation was related to the ratio of wood mass to surface area. Wood CO2 efflux may depend on wood growth, but other factors such as diffusion and CO2 dissolved in the xylem stream may need to be accounted for. Temperature response was similar for all but Pentaclethra, and the relatively constant temperature reduced the effect of different Q10 in producing a bias in annual esti-mates. Our results suggest that chamber measurements of foliar respiration can be extrapolated to the canopy with rates and leaf area specific to each canopy layer or height class. Alternatively, if area-based rates are sampled throughout the canopy, mean
respiration rate per unit mass derived by regressing the area-based rate against leaf mass per area can be extrapolated to the stand using total leaf mass. Mean wood CO2 efflux rate per unit surface area, derived by regressing CO2 efflux per unit mass against the ratio of surface area to mass, can be extrapolated to the stand using total woody tissue surface area. Although wider applicability remains unclear, the results of this study compared with the studies in the surrounding primary forest indicate that vertical sampling may yield more accurate estimates than would temporal sampling for these species and this forest.
Acknowledgments
We thank Ann Russell and James Raich, the PIs of ECOS project (http://www.nrem.iastate.edu/ECOS/home) of which this research was a part. We thank Flor Cascante, Eduardo Paniagua, Marlon Hernández and tower crew for assistance with field data collection and Benjamin Bird for assistance with statistical analysis. We also thank the Organization for Tropical Studies (OTS) for logistical support.
Conflict of interest
None declared.
Funding
This research was supported by National Science Foundation grants EF-0236502 and DEB-0703561. M.G.R. was par-tially supported by Australia’s Commonwealth Scientific and Industrial Research Organization (CSIRO) McMaster Fellowship.
References
Agren GI, Axelsson B (1980) Population respiration: a theoretical approach. Ecol Model 11:39–54.
Amthor JS (2000) The McCree–de Wit–Penning de Vries–Thornley respiration paradigms: 30 years later. Ann Bot (Lond) 86:1–20.
Atkin O (2003) Thermal acclimation and the dynamic response of plant respiration to temperature. Trends Plant Sci 8:343–351.
Atkin OK, Bruhn D, Hurry VM, Tjoelker MG (2005) The hot and the cold: unravelling the variable response of plant respiration to tem-perature. Funct Plant Biol 32:87–105.
Aubrey DP, Teskey RO (2009) Root-derived CO2 efflux via xylem stream rivals soil CO2 efflux. New Phytol 184:35–40.
Bates D, Maechler M, Bolker B (2012) lme4: linear mixed-effects model using S4 classes. R Package http://CRAN.Rproject.org/package=lme4.
Bolstad PV, Mitchell K, Vose JM (1999) Foliar temperature–respiration response functions for broad-leaved tree species in the southern Appalachians. Tree Physiol 19:871–878.
Bouma TJ, De Visser R, Van Leeuwen PH, De Kock MJ, Lambers H (1995) The respiratory energy requirements involved in nocturnal carbohydrate export from starch-storing mature source leaves and their contribution to leaf dark respiration. J Exp Bot 46:1185–1194.
Bowman WP, Barbour MM, Turnbull MH, Tissue DT, Whitehead D, Griffin KL (2005) Sap flow rates and sapwood density are critical factors
Foliar respiration and wood CO2 efflux of a tropical forest 157
at DigiT
op USD
A's D
igital Desktop L
ibrary on July 7, 2015http://treephys.oxfordjournals.org/
Dow
nloaded from
Tree Physiology Volume 35, 2015
in within- and between-tree variation in CO2 efflux from stems of mature Dacrydium cupressinum trees. New Phytol 167:815–828.
Braswell BH, Schimel DS, Linder E, Moore B (1997) The response of global terrestrial ecosystems to interannual temperature variability. Science 278:870–873.
Brooks JR, Hinckley TM, Ford ED, Sprugel DG (1991) Foliage dark respiration in Abies amabilis (Dougl.) Forbes: variation within the canopy. Tree Physiol 9:325–338.
Cannell MGR, Thornley JHM (2000) Modelling the components of plant respiration: some guiding principles. Ann Bot 85:45–54.
Cao M, Woodward FI (1998) Dynamic responses of terrestrial ecosystem carbon cycling to global climate change. Nature 393:249–252.
Cavaleri MA, Oberbauer SF, Ryan MG (2006) Wood CO2 efflux in a primary tropical rain forest. Glob Change Biol 12:2442–2458.
Cavaleri MA, Oberbauer SF, Ryan MG (2008) Foliar and ecosystem respiration in an old-growth tropical rain forest. Plant Cell Environ 31: 473–483.
Cernusak LA, Marshall JD (2000) Photosynthetic refixation in branches of western White Pine. Funct Ecol 14:300–311.
Ceschia E, Damesin C, Lebaube S, Pontailler J-Y, Dufrêne E (2002) Spatial and seasonal variations in stem respiration of beech trees (Fagus sylvatica). Ann For Sci 59:801–812.
Chambers JQ, Tribuzy ES, Toledo LC et al. (2004) Respiration from a tropical forest ecosystem: partitioning of sources and low carbon use efficiency. Ecol Appl 14:S72–S88.
Chapin FS (1989) The cost of tundra plant structures—evaluation of concepts and currencies. Am Nat 133:1–19.
Charles-Edwards DA (1981) The mathematics of photosynthesis and productivity. Academic Press, London.
Clark DA, Piper SC, Keeling CD, Clark DB (2003) Tropical rain forest tree growth and atmospheric carbon dynamics linked to interannual temperature variation during 1984–2000. Proc Natl Acad Sci USA 100:5852–5857.
Cox PM, Betts RA, Jones CD, Spall SA, Totterdell IJ (2000) Acceleration of global warming due to carbon-cycle feedbacks in a coupled cli-mate model. Nature 408:184–187.
Cramer W, Bondeau A, Woodward FI et al. (2001) Global response of terrestrial ecosystem structure and function to CO2 and climate change: results from six dynamic global vegetation models. Glob Change Biol 7:357–373.
Damesin C, Ceschia E, Le Goff N, Ottorini JM, Dufrêne E (2002) Stem and branch respiration of beech: from tree measurements to estima-tions at the stand level. New Phytol 153:159–172.
DeLucia EH, Drake JE, Thomas RB, Gonzalez-Meler M (2007) Forest carbon use efficiency: is respiration a constant fraction of gross pri-mary production? Glob Change Biol 13:1157–1167.
Domingues TF, Berry JA, Martinelli LA, Ometto J, Ehleringer JR (2005) Parameterization of canopy structure and leaf-level gas exchange for an eastern Amazonian tropical rain forest (Tapajos National Forest, Para, Brazil). Earth Interact 9:1–23.
Edwards NT, Hanson PJ (1996) Stem respiration in a closed-canopy upland oak forest. Tree Physiol 16:433–439.
Evans JR (1989) Photosynthesis and nitrogen relationship in leaves of C-3 plants. Oecologia 78:9–19.
Fan S-M, Wofsy SC, Bakwin PS, Jacob DJ, Fitzjarrald DR (1990) Atmosphere–biosphere exchange of CO2 and O3 in the central Amazon forest. J Geophys Res 95:16851.
Field CB, Mooney HA (1986) The photosynthesis–nitrogen rela-tionship in wild plants. In: Givnish TJ (ed) On the economy of plant form and function. Cambridge University Press, Cambridge, pp 22–55.
Fisher RF (1995) Amelioration of degraded rain forest soils by planta-tions of native trees. Soil Sci Soc Am J 59:544–549.
Giardina CP, Ryan MG (2002) Total belowground carbon allocation in a fast-growing Eucalyptus plantation estimated using a carbon bal-ance approach. Ecosystems 5:487–499.
Grace J, Lloyd J, McIntyre J et al. (1995) Carbon dioxide uptake by an undisturbed tropical rain forest in southwest Amazonia, 1992 to 1993. Science 270:778–780.
Griffin KL, Tissue DT, Turnbull MH, Schuster W, Whitehead D (2001) Leaf dark respiration as a function of canopy position in Nothofagus fusca trees grown at ambient and elevated CO2 partial pressures for 5 years. Funct Ecol 15:497–505.
Hothorn T, Bretz F, Westfall P (2008) Simultaneous inference in gen-eral parametric models. Biom J 50:346–363.
Hubbard RM, Ryan MG, Lukens DL (1995) A simple, battery-operated, temperature-controlled cuvette for respiration measurements. Tree Physiol 15:175–179.
Kindermann J, Wurth G, Kohlmaier GH, Badeck FW (1996) Interannual variation of carbon exchange fluxes in terrestrial ecosystems. Glob Biogeochem Cycles 10:737–755.
Kleber M, Schwendenmann L, Veldkamp E, Rößner J, Jahn R (2007) Halloysite versus gibbsite: silicon cycling as a pedogenetic process in two lowland neotropical rain forest soils of La Selva, Costa Rica. Geoderma 138:1–11.
Lavigne MB (1988) Stem growth and respiration of young balsam fir trees in thinned and unthinned stands. Can J For Res 18:483–489.
Law BE, Kelliher FM, Baldocchi DD, Anthoni PM, Irvine J, Moore D, Van Tuyl S (2001) Spatial and temporal variation in respiration in a young ponderosa pine forest during a summer drought. Agric For Meteorol 110:27–43.
Levy PE, Jarvis PG (1998) Stem CO2 fluxes in two Sahelian shrub spe-cies (Guiera senegalensis and Combretum micranthum). Funct Ecol 12:107–116.
Litton CM, Raich JW, Ryan MG (2007) Carbon allocation in forest eco-systems. Glob Change Biol 13:2089–2109.
Loescher HW, Oberbauer SF, Gholz HL, Clark DB (2003) Environmental controls on net ecosystem-level carbon exchange and productivity in a Central American tropical wet forest. Glob Change Biol 9: 396–412.
Luyssaert S, Inglima I, Jung M et al. (2007) CO2 balance of boreal, temperate, and tropical forests derived from a global database. Glob Change Biol 13:2509–2537.
Malhi Y (2012) The productivity, metabolism and carbon cycle of tropi-cal forest vegetation. J Ecol 100:65–75.
Malhi Y, Nobre AD, Grace J, Kruijt B, Pereira MGP, Culf A, Scott S (1998) Carbon dioxide transfer over a Central Amazonian rain for-est. J Geophys Res 103:31593.
Malhi Y, Doughty C, Galbraith D (2011) The allocation of ecosystem net primary productivity in tropical forests. Philos Trans R Soc Lond B Biol Sci 366:3225–3245.
McDade LA (1994) La Selva: ecology and natural history of a neo-tropical rain forest. University of Chicago Press, Chicago.
McGuire MA, Teskey RO (2004) Estimating stem respiration in trees by a mass balance approach that accounts for internal and external fluxes of CO2. Tree Physiol 24:571–578.
Meir P, Grace J (2002) Scaling relationships for woody tissue respira-tion in two tropical rain forests. Plant Cell Environ 25:963–973.
Meir P, Grace J, Miranda AC (2001) Leaf respiration in two tropical rainforests: constraints on physiology by phosphorus, nitrogen and temperature. Funct Ecol 15:378–387.
Metcalfe DB, Lobo-do-Vale R, Chaves MM et al. (2010) Impacts of experimentally imposed drought on leaf respiration and morphology in an Amazon rain forest. Funct Ecol 24:524–533.
Miranda EJ, Vourlitis GL, Filho NP, Priante PC, Campelo JH, Suli GS, Fritzen CL, de Almeida Lobo F, Shiraiwa S (2005) Seasonal vari-ation in the leaf gas exchange of tropical forest trees in the rain
158 Asao et al.
at DigiT
op USD
A's D
igital Desktop L
ibrary on July 7, 2015http://treephys.oxfordjournals.org/
Dow
nloaded from
Tree Physiology Online at http://www.treephys.oxfordjournals.org
forest–savanna transition of the southern Amazon Basin. J Trop Ecol 21:451–460.
Mitchell KA, Bolstad PV, Vose JM (1999) Interspecific and environ-mentally induced variation in foliar dark respiration among eighteen southeastern deciduous tree species. Tree Physiol 19:861–870.
Oberbauer SF, Strain BR (1986) Effects of canopy position and irradi-ance on the leaf physiology and morphology of Pentaclethra mac-roloba (Mimosaceae). Am J Bot 73:409–416.
Penning de Vries FWT (1975) The cost of maintenance processes in plant cells. Ann Bot 39:77–92.
Penning de Vries FWT, Brunsting AHM, van Laar HH (1974) Products, requirements and efficiency of biosynthesis: a quantitative approach. J Theor Biol 45:339–377.
Phillips OL, Malhi Y, Higuchi N et al. (1998) Changes in the carbon balance of tropical forests: evidence from long-term plots. Science 282:439–442.
Poorter H, Bergkotte M (1992) Chemical composition of 24 wild species differing in relative growth rate. Plant Cell Environ 15: 221–229.
Raich JW, Russell AE, Bedoya-Arrieta R (2007) Lignin and enhanced litter turnover in tree plantations of lowland Costa Rica. For Ecol Manag 239:128–135.
Raich JW, Russell AE, Valverde-Barrantes O (2009) Fine root decay rates vary widely among lowland tropical tree species. Oecologia 161:325–330.
Rayment MB, Loustau D, Jarvis PJ (2002) Photosynthesis and respira-tion of black spruce at three organizational scales: shoot, branch and canopy. Tree Physiol 22:219–229.
R Core Team (2014) R: a language and environment for statistical computing. R Foundation for Statistical Computing, Vienna, Austria. http://www.R-project.org.
Reich PB, Tjoelker MG, Machado JL, Oleksyn J (2006) Universal scal-ing of respiratory metabolism, size and nitrogen in plants. Nature 439:457–461.
Robertson AL, Malhi Y, Farfa-Amexquita F, Aragao LEOC, Espejo JES, Robertson MA (2010) Stem respiration in tropical forests along an elevation gradient in the Amazon and Andes. Glob Change Biol 16:3193–3204.
Russell AE, Raich JW (2012) Rapidly growing tropical trees mobilize remarkable amounts of nitrogen, in ways that differ surprisingly among species. Proc Natl Acad Sci USA 109:10398–10402.
Russell AE, Raich JW, Arrieta RB, Valverde-Barrantes O, González E (2010) Impacts of individual tree species on carbon dynamics in a moist tropical forest environment. Ecol Appl 20:1087–1100.
Ryan MG (1990) Growth and maintenance respiration in stems of Pinus contorta and Picea engelmannii. Can J For Res 20:48–57.
Ryan MG (1991) Effects of climate change on plant respiration. Ecol Appl 1:157–167.
Ryan MG (1995) Foliar maintenance respiration of subalpine and boreal trees and shrubs in relation to nitrogen content. Plant Cell Environ 18:765–772.
Ryan MG, Hubbard RM, Clark DA, Sanford RL (1994) Woody-tissue respiration for Simarouba amara and Minquartia guianensis, two tropical wet forest trees with different growth habits. Oecologia 100:213–220.
Ryan MG, Lavigne MB, Gower ST (1997) Annual carbon cost of auto-trophic respiration in boreal forest ecosystems in relation to species and climate. J Geophys Res Atmos 102:28871–28883.
Ryan MG, Binkley D, Fownes JH, Giardina CP, Senock RS (2004) An experimental test of the causes of forest growth decline with stand age. Ecol Monogr 74:393–414.
Ryan MG, Cavaleri MA, Almeida AC, Penchel R, Senock RS, Stape JL (2009) Wood CO2 efflux and foliar respiration for Eucalyptus in Hawaii and Brazil. Tree Physiol 29:1213–1222.
Shipley B, Lechowicz MJ, Wright I, Reich PB (2006) Fundamental trade-offs generating the worldwide leaf economics spectrum. Ecology 87:535–541.
Spicer R, Holbrook NM (2005) Within-stem oxygen concentration and sap flow in four temperate tree species: does long-lived xylem parenchyma experience hypoxia? Plant Cell Environ 28:192–201.
Sprugel D (1990) Components of woody-tissue respiration in young Abies amabilis (Dougl.) Forbes trees. Trees 4:88–98.
Sprugel DG, Ryan MG, Brooks RJ, Vogt KA, Martin TA (1995) Respiration from the organ level to the stand. In: Smith WK, Hinckley TM (eds) Resource physiology of conifers. Academic Press, Inc., San Diego, pp 255–299.
Teskey RO, Saveyn A, Steppe K, McGuire MA (2008) Origin, fate and significance of CO2 in tree stems. New Phytol 177:17–32.
Thornley JHM, Cannell MGR (2000) Modelling the components of plant respiration: representation and realism. Ann Bot 85:55–67.
Tian H, Melillo JM, Kicklighter DW, McGuire AD, Helfrich JVK, Moore B, Vörösmarty CJ (1998) Effect of interannual climate variability on carbon storage in Amazonian ecosystems. Nature 396:664–667.
Trumbore SE, Angert A, Kunert N, Muhr J, Chambers JQ (2012) What's the flux? Unraveling how CO2 fluxes from trees reflect underlying physiological processes. New Phytol 197:353–355.
Turnbull MH, Whitehead D, Tissue DT, Schuster WSF, Brown KJ, Griffin KL (2003) Scaling foliar respiration in two contrasting forest cano-pies. Funct Ecol 17:101–114.
Turnbull MH, Tissue DT, Griffin KL, Richardson SJ, Peltzer DA, Whitehead D (2005) Respiration characteristics in temperate rain-forest tree species differ along a long-term soil-development chro-nosequence. Oecologia 143:271–279.
Venables WN, Ripley BD (2002) Modern applied statistics with S, 4th edn. Springer, New York.
Waring RH, Landsberg JJ, Williams M (1998) Net primary production of forests: a constant fraction of gross primary production? Tree Physiol 18:129–134.
White A, Cannell MGR, Friend AD (2000) CO2 stabilization, climate change and the terrestrial carbon sink. Glob Change Biol 6:817–833.
Wickham H (2009) ggplot2: elegant graphics for data analysis. Springer, New York.
Williams K, Percival F, Merino J, Mooney HA (1987) Estimation of tis-sue construction cost from heat of combustion and organic nitrogen content. Plant Cell Environ 10:725–734.
Williams K, Field CB, Mooney HA (1989) Relationships among leaf construction cost, leaf longevity, and light environment in rain-forest plants of the genus Piper. Am Nat 133:198–211.
Wright IJ, Reich PB, Westoby M et al. (2004) The worldwide leaf eco-nomics spectrum. Nature 428:821–827.
Yoda K (1967) Comparative ecological studies on three main types of forest vegetation in Thailand. III. Community respiration. Nat Life SE Asia 5:65.
Yoda K, Shinozaki K, Ogawa H, Hozumi K, Kira T (1965) Estimation of the total amount of respiration in woody organs of trees and forest communities. J Biol 16:15–26.
Foliar respiration and wood CO2 efflux of a tropical forest 159
at DigiT
op USD
A's D
igital Desktop L
ibrary on July 7, 2015http://treephys.oxfordjournals.org/
Dow
nloaded from


![CHOPtrey: contextual online polynomial extrapolation for ... · In [10], context-based extrapolation is exclusively intended for FMU models and extrapolation is per-formed on integration](https://img.pdfslide.net/doc/110x75/5eab92861431d863cb1b1b5b/choptrey-contextual-online-polynomial-extrapolation-for-in-10-context-based.jpg)