Embed Size (px)
Citation preview

VARIATION IN SPECIES AND STAND-LEVEL WATER USE
FOR NATIVE FOREST AND NON-NATIVE TIMBER PLANTATION
IN HONAUNAU, HAWAI'I
A THESIS SUBMITTED TO THE GRADUATE DMSION OF THE UNIVERSITY OF HA WAI'I IN PARTIAL FULFILLMENT
OF THE REQUIREMENTS FOR THE DEGREE OF
MASTER OF SCIENCE
IN
BOTANY (ECOLOGY, EVOLUTION, AND CONSERVATION BIOLOGy)
MAY 2008
By Aurora Ke'a1ohilani Kagawa
Thesis Committee:
Lawren Sack, Chairperson T. Ka'eo Duarte Shelley James

We certifY that we have read this thesis and that, in our opinion, it is satisfactory in scope and quality as a thesis for the degree of Master of Science in Botany (Ecology, Evolution, and Conservation Biology).
THESIS COMMITTEE
Chairperson
ii

iii
ACKNOWLEDGEMENTS
I would like to thank my committee members: Ka'eo Duarte, mentor and friend. through whom I
found my way into this project and back home to Hawai'i. Shelley James provided me not only
the necessary expertise to carry out this project, but also provided continual encouragement
through some very tough times. Finally, Lawren Sack has guided me through the last and most
difficult portion of my thesis research and has challenged me to do my best by setting the bar high
and sailing over it His passion for science is a constant source of inspiration and energy.
Mahalo to Dale and Jody Fergerstrom for being my 'ohana away from home during my field
season. Maha\o also to Kate Brauman, who taught me both about myself and about being a grad
student as we worked through sommer '06 and to Malia Kipapa and Chris Nakabashi, who,
whether they knew it or not, gave meaning to my time as a graduate student Thanks to Sharon
Ziegler-Chong and UH-HIP for helping me understand how I can contribute to resource
management and for the logistical support. Thanks to Marguerite Butler, for mobilizing the
math-bio community that has helped me so much with my data analysis. Thanks also to Molly
Cavaleri, for providing advice and through whom I know this work will be continued. Mahalo to
the rest of the Sack Lab- Mashuri, Maggie, Chris, Marian for kilkua at various points and moral
support. I am grateful for the many, many hands that have helped me at every stage of this thesis
research whose contributions fill the following pages.
I would \ike to acknowledge Kamehameha Schools for site access and logistical support as well
as financial support provided by their 'Imi Na'auao and 'Aina U1u programs. This research was
also supported by scholarships from the Kahuewai Ola Program and Native Hawaiian Science

iv and Engineering Mentorship Program at the University ofHawai'i at Mlinoa. Research funding
was provided by USGS contract #2004ID57B to K. Duarte at the University ofHawai'i Water
Resources Research Center, NSF grant 108-0753233 to L. Sack, and the Sigma Xi GIAR and
University ofHawai'i at Minoa Ecology, Evolution, and Conservation Biology programs.
Finally, 1 would like to acknowledge all my 'ohana for their encouragement and love and for
keeping me grounded. To mom and dad especially- thank you for all the help, funding, advice,
and unconditional suppon. To Jim, thank you for being there for me through this difficult
graduate project and crazy work schedule. IfI've done well, it is because you have provided me a
solid foundation and 1 have had a small anny of supporters.
Mahalo to my many kumu and to Kona and Honaunau for the lessons. May 1 honor you through
my work. This is dedicated to the coming generations, that we may understand and mlilama our
wai a Kine and all the life that depends on it with our best efforts. 'Amama, ua noa.

TABLE OF CONTENTS
ACKN"OWLEDGEMENTS _______________ ... _____________ ill
LIST OF TABLES .. _______ ..... _ ...... _. _______________ .. _____ .. vi
LIST OF FIGURES __ ..... __ ..... ________ .. ____ ........... __ ... _______ . vB
CHAYfER 1: INTRODUcrION ....... _ .. ___ ..... ___ ..... _______________ 1
CHAPTER 2:
DOES NATIVE FOREST CONSERVE WATER RELATIVE TO ALIEN PLANTATION? SPECIES COMPOSITION AND STAND STRUCTURE INFLUENCE WATER USE IN A HAWAIIAN WET FOREST ___ " __ "_" __ 6
CHAPTER 3:
SAP FLOW RESPONSES TO MICROCLIMATE: APPLYING MULTI-MODEL INFERENCE TO ASSESS VARIATION AMONG SPECIES ___ .. __ ........ ___ ........... _ ................... __________ ... 39
CHAP'rER 4: CONCLUSION ... ____ ..... __ ........ __________ .. ______ .58
REFERENCES .. ____ .... _______ ........ __ ..... _____ ... ____ ... _______ 61
v

vi LIST OF TABLES
TABLES PAGE
2.S I Allometries for predicting tree sapwood area and fern frond area ....................... 34
2.S2 Analysis of variance and repeated-measures analysis of variance results comparing tree sap flow patterns ..................................................................... 35
2.S3 Leaf traits for four study species: Metroslderos polymorpha, Eucalyptus sallgna, Fraxlnus uhdei, and Clbotium glaucum .......................... 36
2.S4 Species composition in three stand types: Metroslderos-, Eucalyptus-, and Fraxinus-dominated ............................................................. 37
3.1 Three best sap flow models for each of four study species: Metroslderos po/ymorpha, Eucalyptus sallgna, Fraxinus uhdei, and Cibotium glaucum: ................................................................................... 53-54
3.8 I Candidate models relating sap flow and photosynthetically active radiation, tempemture, and vapor pressure deficit ........................................................... 56-57

LIST OF FIGURES
FIGURES PAGE
2.1 Whole-plant diurnal sap flow curves for four study species on a representative day (08/3012006) .••.•.•.......................•.•.•..•...............•......... 31
2.2 Mean maximum and daily sap flow for three canopy tree species: Metrosideros po/ymorpha, Eucalyptus saligno, and Fraxinus uhdel ............. 32
2.3 Stand structure and estimated water use for three stand types: Metrosideros-, Euca/yptus-, and Fraxinus-dominated .................................... 33
2.S I Nocturnal sap flow for four study species ............................................................ 38
3.1 Diurnal patterns in sap flow and photosynthetically active radiation, temperature, and vapor pressure deficit on a representative day (0812612008) •.••.••••.••.••••••.••.•.••.•.••••••.•••••••••.••..••.......•......... 51
3.2 Normalized whole-plant sap flow vs. photosynthetically active radiation, temperature, and vapor pressure deficit ........................................................... 52
3.3 Fitted and observed values for best sap flow models for each study species .•....•. SS
v

CHAPTER 1
Introduction
This research was inspired by a desire to understand the dynamics ofland use and vegetation
change and their impacts on the water resources ofHawai'i. I carried out a case study of plant
and stand water use in Honaunau Forest Reserve on the island of Hawai'i. The research focused
on species and stand transpiration in native forest and non-native timber plantations growing
under similar environmental conditions. I also modeled relationships of xylem sap flow and
micrometeorological parameters to further explore species-specific variation in water use.
EcohydroJogy: Considering the hydroJogIeaJlmpaets ofvegetatloo
I
In the last 50 years, humans have modified the global landscape at rates taster than in any other
period in history. In the acquisition of food, water, fuel, timber, and fiber, human activities have
negatively affected the ecosystem services sustaining the production of these very resources
(DeFries et aI. 2004, Foley et aI. 2005, Millennium Ecosystem Assessment 2005). Water supplies,
for example, have been affected by hydrological changes associated with changes in land use and
vegetation cover (Huxman et aI. 2005, Millennium Ecosystem Assessment 2005, Braurnan et aI.
2007). As demand for fresh water increases, it is increasingly critical that we understand the
hydrological implications of different land uses.
To this end, the rapidly developing field of ecohydrology aims to characterize the
dynamic role of vegetation in the land-based water cycle (see Baird and Wilby 1999, Eagleson
2002, Rodriguez-Jturbe and Porporato 2004, Earnus et aI. 2006). Plants play an important role in
not only local water balance but global atmospheric circulation by altering patterns of evapomtion
at the land-atmosphere interface (Sellers et aI. 1997). Total evapomtive losses are usually

2 referred to as evapotranspiration (ET); these include evaporation from the soil surfuce and
vegetation-mediated evaporation: water intercepted by plant surfuces (interception) and water
used by the plant directly as a consequence of stomata opening for photosynthesis (transpiration).
Although the contribution of transpiration to ET varies depending on precipitation (frequency and
intensity), microclimate, and the vegetation itself; transpiration is typically a large component of
ET, 20-90% in different forested systems (Barbour et aI. 2005).
Evidence of hydrological-ecological interactions can be found in various environments
around the world where hydrological changes have followed vegetation change. Streamflow
increases have followed deforestation (Bosch and Hewlett 1982) and conversely, streamflow
decreases have followed the afforestation of grasslands (Farley et aI. 2005). While this evidence
supports the conclusion that vegetation types differ in hydrological impacts, Farley et aI. (2005)
demonstrated additionally that not all forests are equal. Different species can have varying
effects on surfuce runoff; afforestation with eucalyptus. in particular, caused significantly larger
decreases in annual surfuce runoff than afforestation with pines (-202 mm year" and -167 mm
year", respectively).
These hydrologic changes are generally attributed to changes in transpiration rates as
transpiration can vary strongly between different vegetation types (Roberts 2000). Even among
forests of different species, transpiration estimates range from 151 mm year" for oak to 427 mm
year" for scots pine (Baird and Wilby 1999); however, these stand-level values do not control for
site environmental differences or stand age. Among forest stands of the same species but
different age, studies in Australia and Europe indicate that younger stands transpire more than old
stands (Roberts et aI. 2001, Vertessy et ai, 2001, Delzon and Loustau 2005) with a possible
explanation being a decrease in plot sapwood area or leaf area index (LAJ) with stand age.
A particular interest in the effects of invasive species on stand-level transpiration has
driven comparative studies of species-level water use. This research on species water use has,

3 however, focused on only a few hydrologic systerns-arid, semi-arid, riparian--and especially
on certain taxa, including Tamarlx ramos/ss/ma (e.g., Sala et aI. 1996, Nagler et aI. 2003), and
vegetation types, such as grasslands or shrublands (e.g., Le Maitre et aI. 1996, Cayrol et aI. 2000).
These studies have provided valuable ecohydrologica1 insight: for a given leaf area, Tamarlx
water use varies little from other native species but is able to operate at lower leaf water
potentials than native phreatophytes. Thus Tamarlx is able to maintain high leaf area even under
stressful conditions (Sala et aI. 1996, Cleverly et aI. 1997, Nagler et aI. 2003) and use more water
at stand-level.
Eeohydrology In Hawal'l: Do rates of Dative aDd alleD tronsplrotiOD differ?
The accurate quantification and modeling of forest evapotranspiration is especially important in
small watershed systems as found in Hawai'i, where wet, montane forested areas of catchments
capture orographic rainfall and recharge groundwater supplies for growing Dumbers of
downstream users. The spatially-explicit quantification of water balance fluxes becomes even
more important when we consider that the rapid spread of non-native trees and the current trend
of afforestation to mitigate soil erosion in Hawai'i's watersheds maybe affecting recharge in
these high rainfall and recharge areas. However, there have been very few studies of p1ant- and
stand-level water balance studies for Hawaiian forests (Santiago et aI. 2000, Restom Gaskill
2004).
In my first study, I utilized thermal dissipation and heat balance sap flow technology to
address whether native and non-native trees under similar wet climates transpire at different rates
and whether stands dominated by these species differ in rates of ground area-based transpiration.
In the second study, I used concurrent measurements of sap flow and micrometeorology to
determine species-specific relationships between sap flow and environmental conditions and gain
insight into species' ecophysiology.
4 Comparing species
Comparative leaf-level studies in Hawai'i of alien and native plants raise the possibility that alien
species may often use more water than native species. While the differences have not always
been significant (Cordell et a1. 2002), past studies in Hawai'i show, on average, higher rates of
net C02 assimilation and relative growth (RGR) for alien plants compared to native plants
(Pattison et a1. 1998, Baruch and Goldstein 1999, Baruch et a1. 2000, Stratton and Goldstein
200 I, Cordell et a1. 2002, Funk and Vitousek 2007). These higher rates of photosynthesis for
alien plants also suggest higher leaf-scaled rates of water use since photosynthesis and
transpiration are simultaneously controlled by stomatal conductance. Based on these
observations, I expected transpiration to be higher for individual trees of alien species compared
to native when leaf area per individual was similar; in cases where leaf area is higher for an
individual, whole plant water use should also be greater for the alien tree. This research,
conducted in a wet forest system. will be useful for indicating how native and non-native species
under non-water limiting conditions may vIII)' in their water use due simply to intrinsic species
differences.
Comparing stands
While alien forests in Hawai'i consist of relatively recent introductions, the forests of native
species are usually unmanaged older forests resulting from natural succession and regeneration;
there are likely differences of several hundred years in the ages of trees at the two forests. Stand
transpiration is also affected by forest structure. While the a1ien-dominated forests are often
characterized by a monotypic closed-canopy and little understory, in Hawai'i, the native forest is
more open with a mid-canopy and thick understory layer of tree ferns, shrubs, and epiphytes.
These differences in forest structure may lead to even transpiration, with the developed
understory of the native forest compensating for decreased canopy transpiration. Or it is possible

that a denser understory might not fully compensate for decreased canopy as leaf area-based
transpiration has been found to be lower for the understory than for the dominant canopy species
{Vertessy, 2001 #107}.
5
For stand level estimates, when alien-dominated forest is younger than native forest as
they are in our system, one would further expect the alien stands to have higher rates of
transpiration. Thus I hypothesized that stands of native trees and alien trees will differ in their
respective rates of stand transpiration with alien-dominated stands having higher transpiration due
to higher individual plant water use and equal or higher tree density and sapwood area.
Comparing respanses
Bulk sap flow methodologies, such as the methods employed here, facilitate the modeling of sap
flow and stomatal conductance as a response to environmental variables at diurua\, daily and even
seasonal and ioteraooual timesca1es (Jarvis 1976, Meinzer et at. 1993, Sturm et a1. 1998, Oren et
a1. 1999a, Oren et a1. 1999b, Granier et a1. 2000, Oren and Pataki 200 I, Oren et a1. 200 I, Phillips
and Oren 2001, Pataki and Oren 2003, Ford et al. 2005). This work has led to the development of
empirical models describing relationships between sap flow or canopy conductance and
environmental variables, including irradiance, temperature, and vapor pressure deficit on diurua\
timescales. Species-specific coefficients may be obtained to allow estimation of sap flow from
environmental conditions; however, there is not yet a standard simple model for characterizing
this response. I used a model-selection approach to assess the suite of empirical and statistical
models appropriate for each species studied. By fitting mUltiple models, I investigated
differences among species' responses to environment

Abstract
CHAPTER:!
Does native forest conserve water relative to allen plantation?
Species composition and stand strnctore Inflnence water nse
in a Hawallan wet forest
6
Native forest trees have been claimed to use water conservatively and enhance groundwater
recharge relative to faster-growing non-native species. This argument, if true, could increase the
value of native forest preservation and restoration, especially where forests also playa role in
mitigating soil erosion, as in watersheds in Hawai'i. Few studies have examined whether native
and non-native plant water use differ at tree and stand level or to what extent species composition
matters for stand level water use. We measured plant transpiration for over eight weeks in a
continuous mosaic of native Metrosideros polymorpluJ forest and non-native Eucalyptus saligna
or Fraxlnus uhdel plantation in H6naunaU, Hawai'i, for dominant tree species and dominant
understory Cibotium tree ferns. Heat dissipation and heat balance sap flow methods were used to
measure plant sap flow, and we estimated total stand water use by scaling up sap flow
measurements by ground area-based sapwood and leaf area estimates from vegetation surveys. M
polymorpluJ had the lowest whole-tree daily water use (8 kg day·' or 200 kg m·2 of sapwood day·
I), less than half that of the average E. sallgna or F. uhdei; M polymorpluJ also had the lowest
maximum instantaneous transpiration rate. Stands dominated by F. uhdel had higher scaled-up
water use than stands dominated by M polymorpluJ due to 2.5-fold greater sapflow rates, five
fold greater sapwood allocation, and two-fold greater dominant tree density. In native stands
dominated by M polymorpha, Clbotiwn leaf area contributed to over 70% of water use,
indicating the critical role of tree ferns in native wet forest water balance. Scaled-up forest water

7 use was influenced by various factors, including species composition, stem density, tree sizes,
tree species' sapwood allocation, and understory Clbotium contribution. These findings highlight
the importance of constituent species and tree sizes in forest water uptake and indicate the
potential for substantially more conservative water use bY native wet tropical forests.
Introduction
In the last 50 years, humans have modified the g1obal1andscape at rates faster than in any other
period in history. In the acquisition offood, water, fuel, timber, and fiber, these activities have
negatively affected the ecosystem services sustnining the production of these very resources
(DeFries et a1. 2004, Foley et a1. 2005, Millennium Ecosystem Assessment 2005). For instance,
changes in land use and vegetation cover have hydrological impacts that affect water supplies
(Huxman et a1. 2005, Millennium Ecosystem Assessment 2005, Braurnan et a1. 2007). As demand
for fresh water increases, it becomes increasingly critical that we understand the hydrological
implications of different land uses.
Recognition of the important and dynamic role of vegetation in shaping terrestrial water
balance has grown tremendously with recent developments in the field of ecohydrology (see
Baird and WilbY 1999, Eagleson 2002, Rodriguez-Iturbe and Porporato 2004). Plant
transpiration, or water use, is a particularly important vegetation-controlled evaporative flux that
removes precipitation otherwise contributing to streamflow or groundwater recharge. Numerous
catchment-level studies highlight the effects of vegetation change on hydrology, where
streamflow increases followed deforestation (Bosch and Hewlett 1982) and streamflow decreases
followed the afforestation of grasslands, shrublands and croplands (Farley et a1. 2005, Jackson et
a1. 2005). It is well established that vegetation types vary in water use; however, data on water
use bY assemblages of different species compositions within a given vegetation type (forest,
shrubland, grassland) are scarce. We are far from having a predictive understanding of the current

8 and future impacts of land use and land cover change at a range of scales. A common hypothesis
is that catchment-level water use should be influenced most strongly by climate and soil, not
species traits, and similar rates of canopy water use would be expected for sites with similar
rainfall and leaf area index (Hatton et aI. 1998, Zeppel et al. 2006). However, stand-level
differences in water use have been observed between young and older stands of eucalyptus (e.g.,
Roberts et aI. 200 I, Vertessy et aI. 2001, Moore et aI. 2004, Delzon and Loustau 2005), due to a
greater tree density, sapwood-specific water uptake and/or leaf area index, and this evidence
suggests we could find water use differences also among stands varying in species composition.
In Hawai'i, rainfall in upland areas feeds the ground- and surfuce waters that support ail
urban and agricultural activities. Thus, accurately quantifying the hydrological impacts ofland
management in these regions is critical for managing water supplies for a growing population. Of
particular concern are the impacts of alien plant species on hydrology, as non-native species are
an increasingly large percent of the islands' vegetated cover. As energy initiatives encourage the
establishment ofbiofuel crops and tree plantations for local timber and carbon credits, the
incentive for fast-growing alien crops with high invasive potential may create new problems for
water management (Richardson 1998, Jackson et aI. 2005). Physiological studies assessing alien
plant water use in Hawai'i indicate higher leaf-level gas exchange rates for alien plants relative to
co-occurring or phylogenetically related native plant species (pattison et aI. 1998, Baruch and
Goldstein 1999, Baruch et aI. 2000, Stratton and Goldstein 2001, Cordell et aI. 2002, Funk and
Vitousek 2007). As photosynthesis and transpiration are coordinated through stomatal
conductance, this suggests alien species may use more water than native species at leaf level.
However, few studies of alien species in Hawai'j focus on the whole plant and stand scales
relevant to hydrology; data at these scales are available only for single species in different sites
(Santiago et aI. 2000), for alien species at a single site (Restom Gaskill 2004), or for irrigated
agricultural crops (e.g., Ekern 1970).

9 We measured the water use in forest stands representing two forested land use types
found across the Hawaiian Islands: native forest dominated by Metrosideros polymorpha and
timber plantation dominated by alien trees Fraxinus uhdei and Eucalyptus saligna. Whether
native and alien species differ in water use at the individual and stand levels bas implications for
land management, restoration, and conservation. Our study addressed, for a particular forest site
in Hawai'i: I) whether different tree species transpire at different rates, and 2) whether stands
dominated by these different species would differ in rates of ground area-based transpiration. We
expected transpiration might be higher for alien timber species compared to native tree species on
a per-leaf area, on a per-sapwood area and on a whole-tree basis. We hypothesized that a1ien
dominated stands would differ from native-dominated stands in total water use. We hypothesized
stand-level water use would be mediated by adjustments in tree sizes and stem densities, and
contrasting abundances of understory tree ferns. We further determined the differences among
species in daytime versus noctuma\ water use and the degree to which water use per unit leaf area
was consistent with other leaf functional traits.
Methods
Study site and species
The study was conducted at HOnaunau Forest Reserve, a 4250-hectare patchwork of forest and
tree plantations owned by native Hawaiian legacy trust Kamehameha Schools on the leeward
slope of Mauna Loa, Hawai'i Island. Wild cattle populations had strongly impacted the forest by
the time they were removed in the 195050 and 350 ha were cleared and planted with 37 primarily
nonnative timber species (Carlson and Bryan 1959). Since then, the area bas been left largely
.mmanaged. We selected two sites to represent native and a1ien-dominated vegetation in the
ahupuo'a (land divisions) ofKabauloa (N 19.482°, W 155.869°) and HOnaunau (N 19.435°, W
155.844°), respectively. The sites are 5 km apart, at 1000 m elevation on 750-1500 year old 'a'a

10 lava flows (Lockwood 1995) ofPuna-Udarent soil type (Soil Survey Staff, Niemeyer 2006).
These sites were selected for their high substrate permeability and low slope which minimize
horizontal fluxes; runoff occurs only in large storm events. At Kahauloa and Hjlnaunau, mean
annual precipitation is respectively 1520 and 1450 mm, mean annual temperature 17.5 and 17.3
"C, and relative humidity annual minimum/maximum 67.9/97.8% and 67.6/98.0% (Giambelluca
and Cuo in prep).
In the native old-growth forest ofKahauloa, the study species were endemic canopy tree
Metroslderos polymorpha Gaud. (Myrtaceae; common name 'ohi 'a; Wagner et aI. 1999) and
endemic tree ferns Cibotium glaucum (Sm.) Hook. & Am. and Clbotium menziesll Hook
(Cibotiaceae; common name hiipu 'u pulu and hiipu 'u 'I'i; Palmer 2002, Smith et aI. 2006). At the
non-native tree plantation site in Honaunau, we studied Eucalyptus saligna Sm (Myrtaceae;
Wagner et aI. 1999) and Fraxinus uhdel (Wenzig) Lingelsh (Oleaceae; Wagner et aI. 1999) in
monotypic stands of approximately 2 ha and 25 ha respectively.
Sapjlow metlSUremenJs
Measuring sapj/ow for tree species
From August through September 2006, we monitored sapwood sap flux density for six
individuals of each dominant tree species. All studied individuals of a given species were located
within a 20x20m plot. We measured tree sapflow using modified Granier-style heat dissipation
probes with I em long sensor tips (James et aI. 2002). To account for circumferential and radial
variation in sapflow, two to five sensors were installed in each tree at 2-6 em depth, positioned
around the circumference at 1.3m height. The heated and reference probe tips of each sensor were
positioned 10 em apan vertically, and replicate sensors were installed at least 10 em apart around
the tree circumference to avoid heating the reference probes. We wrapped the trees with bubble
wrap and aluminum foil to protect the sensors and reduce the effects of external thermal gradients
II (Lu et al. 2004). The heated probe tips were supplied with continuous power via a voltage
regulator circuit connected to 6V deep-cycle batteries (models TI 05 and T125, Trojan, Santa Fe
Springs, CA, USA). We measured differential voltage between the two probe tips eveIY minute
and recorded averages every 10 minutes with AMI 6132 multiplexers connected to CRlOOO
data!oggers (Campbell Scientific, Logan, UT) powered by 7Ah 12V sealed lead-acid batteries
(Radio Shack, Fort Worth, TX).
We calculated sap flux density (v) for each interval using the calibration developed by
Granier (1985) and recently validated for our modified probe design (McCulloh et al. 2007). Sap
flux density can be estimated from the temperature difference between heated and reference
probe tips (AT), which is proportional to the measured voltage difference between probes (A V;
Lu et al. 2004):
(6Vm - 6V)I.231
V= 119. 6V
where A V m is the maximum voltage difference corresponding to the maximum temperature
difference during (theoretical) zero flow each night, and AV is the voltage difference
corresponding to the temperature difference at any point in time, which decreases as flow
increases. While AV m is usually assumed to be constant, we found that AV m decreased over time
as our deep cycle batteries discharged, so we used linear interpolation to estimate a A V m value for
each IO-minute interval between the measured A V m values for successive nights.
To account for radial variation within the tree, we calculated whole-tree sap flux by
weighting the measured sap flux density for each probe by an associated sapwood annulus
(Hatton et al. 1990). We defined concentric annuli below the cambium as delimited by an outer
and inner radius (rl and ri.') midway between successive probe tips. Sap flux for each annulus was
calculated by multiplying the measured sap flux density at a given depth (VI) by the corresponding
annulus area; these were summed for n probed depths to obtain whole-tree sapflow (Q):

n
Q = L 1f(rf - rf_dv; i=1
12
(g's") eqn 2
We determined sapwood-area specific sapflow rates by dividing these whole tree flow
rate values by tree sapwood area (see Measuring tree sapwood area). The resulting data were
used to plot diurnal curves for individual trees (Fig I). We characterized daily parameters of these
curves to compare sapflow between species (see Water use parameters and statistical analysis).
Measuring tree sapwood area
We determined cross-sectional sapwood area of the study trees from trunk cores extracted at the
end of the study (to avoid any possible impacts of coring on sapflow patterns). For each tree, we
measured diameter at 1.3m with a dbh tape and extracted cores ofS-15 em length with a4.3mm
increment borer, noting outer bark and phloem depth.
We used several methods to detennine sapwood depth, including staining ofliving
parenchyma with triphenyl tetrazolium chloride in a phosphate buffer solution (Sigma-Aldrich;
Spicer and Holbrook 2005), visual observation of vessel translucency, and projection from
sapflow profiles of the depth at which flow was zero. F. uhdei had living parenchyma across the
full extent of the cores, and sapflow measurements indicated that maximum flow did not
significantly decrease with depth, so we assumed all of its sapwood was unifonnly water-
conducting. The R saligna sapwood-heartwood boundmy was detennined by visually inspecting
the point at which vessels were no longer translucent; sapflow depth profile data showed very low
flow beyond this transition. Water-conducting sapwood in M polymorpha was less distinct than
in E. sallgna hut could be resolved similarly.

We calculated sapwood area as the difference between the area of the cross-sectional
disc from the cambium inward and the area of the heartwood cross-section (nr...., -nr_), where r ..... =dbbl2- (bark+phloem depth) and r_ =dbbl2-(bark+phloem+sapwood depths).
Estimating tree leqf area
13
We estimated total leaf area for the trees measured for sapflow by multiplying by the number of
tree branches by an average leaf area per branch, determined from branches sampled from three
other similar trees for each species (using a L1-COR 31 OOC leaf area meter; L1-COR, Lincoln,
NE, USA). For E. saligna, branches were inaccessible, and we used fallen branches. In
cases where branch leaf area was very large, we estimated leaf area by dividing total branch leaf
dry mass by leaf mass per area calculated from a subsample of 10 or more leaves on the branch,
with dry mass determined after oven drying at 70·C for 48h. We estimated the number of
branches on the sapflow trees by visual inspection of photographs (Santiago et aI. 2000). While
these estimates are subject to uncertainty, like those in previous studies that have estimated leaf
area of tall canopy trees, they should allow robust comparisons of sapflow per leaf area across
species (e.g., Meinzer et aI. 1999, Santiago et aI. 2000).
Measuring sapflow for tree ferns
From August through October 2006, we measured bulk sapflow for healthy fronds of seven
individuals of dominant tree fern Cibotlum glaucum. Although we measured sapflow for two C.
menzlesl/, results are not reported here as low densities in the field did not allow sufficient
replication. We took measurements every minute and recorded I S-min averages using a
commercial stem heat balance collar system placed on frond stipes (Dynamax Flow32 system,
Dynamax, Houston, TIC, USA) powered by l2V deep-cycle batteries connected in parallel (model
30XHS Trojan, Santa Fe Springs, CA, USA; 8SAh Kirkland, Issaquah, WA, USA; 60 Ah Daleco,

14 Kailua-Kona, m, USA). We calculated bulk sapflow from voltages offourthermocouples per
collar using the manufacturer's calculation procedures (Sakuratan11981, Baker and van Bavel
1987), and determined sapflow per frond area by dividing by frond area (minus that of the stipe)
determined after the study using a L1-COR 31 OOC leaf area meter.
Measurements 0/ lea/functional traits
We measured leaf functional traits for both tree and tree fern species using samples from
branches and fronds collected for branch and frond area measurement We determined specific
leaf area (SLA, cm2g'!) as leaf area divided by mass after drying at 70°C for 48 hours. Leaves of
three individuals per species were analyzed for nitrogen concenttation per mass (N"""" g g.t) and
carbon isotope composition (Ii t3C, %0) using high temperature combustion in an elemental
analyzer (Costech ECS 40 I 0; Valencia, CA, USA), with effluent passed into a continuous flow
isotope ratio mass spectrometer (CF-lRMS; ThermoFinnigan Delta V Advantage with a Conflo
lIT interface; ThermoFisher Scientific; Waltham, MA, USA; (Fry et aI. 1996). Samples were dry
ashed in glass vials (Miller 1998), dissolved in 1M hydrochloric acid and analyzed for
phosphorus per mass (P"""", g g'!) using inductively-coupled plasma-optical emission
spectrometry (ICP-OES; Varian Vista MPX Instrument, Varian Inc., Palo Alto, CA, USA;
(porder et aI. 2005). Concentrations of nitrogen and phosphorus per area (N .... and P"", g m·2)
were determined as N""" and P """ divided by SLA.
We measured stomatal traits from nail polish impressions of the undersides of tree leaves,
imaged at lOO-400x magnification under a light microscope and analyzed using ImageJ
(http://rsb.info.nih.govlij); leaves of all species were hypostomatous (having stomata only on leaf
undersides). For trees, we assessed average stomatal density and pore length for three fields of
view for each impression, and averaged values for one impression for each of three leaves per
branch sampled, and then averaged for three branches per individual tree, for three individuals per

15 species (except two individuals for E. saligna, as branches were too high to sample). For tree
fem fronds, we made measurements on fronds from seven C. glaucum individuals. We calculated
an index of stomatal pore area per leaf area (SPI) as the product of stomatal density and the
square of pore length (Sack et aI. 2003).
Scaling sapjlow to the sttuuI
Allometries for sapwood area and frond area
For our three study tree species, we scaled sapflow rates up to the stand level using sapwood area.
We determined species-specific sapwood area versus dbh relationships by combining data from
our six sapflow study trees per species with dbh and trunk core data for 9-24 additional trees of
each species sampled along 100 m transects within each stand type. We calculated sapwood area
for given trees (see Measuring tree sapwood area) and determined the coefficients of the least
squares linear regression ofln-transformed sapwood area against In-transformed dbh
(Supplementary Material, Table 2.S I).
For the tree fem, C. glaucum, we scaled sapflow rates to stand level using frond leaf area.
We determined frond area for tree ferns using an allometry relating In-transformed frond leaf area
to In-transformed frond length index (FLI), an easily-measured characteristic, the projected
horizontal frond length from its base at caudex insertion to its distal tip (Arcand et aI.ln press).
We used an allometric relationship based on ten mature fronds from our site, including our seven
sapflow study fronds (see Measuring sap flow for tree ferns), and eight C. glaucum in a similar
Hawaiian wet forest (Arcand et aI. In press), since the allometric relationships were statistically
similar in slopes and intercepts.

16 &itimating total stand water use
For each of the three stand types (M polymorpha, E. saligna, and F. uhdei-dominated), we
surveyed five to six 20m x 20m plots to determine total sapwood and Cibotitml leaf area on a
ground-area basis. In eight plots with high Cibotitml densities, we surveyed these in a 10m x 20
m plot within the larger plot In each plot, we recorded species and dbh for every stem with dbh
greaterthan I em. For Cibotitml, we recorded species (C. glaucwn or C. menziesii Hook), number
of live fronds, and FLI. From these data, we applied our species-specific allometries
(Supplementary Material, Table 2.S I) to obtain estimates of plot sapwood area for each tree of
our study species (SAplot) and plot Cibotitml frond area (F Aplot). For each plot with n trees and m
Cibotitml,
n
SAp/at = I: Cd • Dl' . c ;=1 ..
F Aplat = I: c" • L? . c· j. forj fronds i=l
where D and L are tree diameter and tree fern projected frond length, a and b are allometric
coefficients, and c is the allometric correction coefficient (see Supplementary Material, Table
2.SI; Baskerville 1972, SprugeI1983). We estimated total tree fern leafarea using the C.
glaucum leaf area-FLI relationship as C. glaucwn was the dominant tree fern species across stand
types.
We estimated total sapflow for each plot by multiplying the daily-integrated sapflow for
each study species by its stand sapwood area (for trees) or frond area (tree ferns). We summed
these components to estimate combined canopy tree and understory Clbotitml transpiration.

Waler use plll'fll1U!lJ!rs and stIltIsticlll analysis
Comparing species
17
We extracted daily parameters from diurnal sapflow curves (Fig. 1) using R version 2.5.1 (R Core
Development Team 2007; all scripts available on request). We detennined integrated diurnal
sapflow rate (Eu.. kg/day), daily maximum sapflow rate (E".., g/s), time of maximum sapflow
(I ..... hhmm), "peak" period of sap flow (defined as the period with >50% of maximum sapflow;
Atpcalu hours), and nocturnal sapflow as a proportion of total diurnal sapflow (with nocturnal flow
defined as occuning between 1830 and 0630; EJEu.. percent). Data for each parameter were
averaged over the 2-month measuring period for each individual tree, and these individual means
were In-transformed to achieve better homogeneity of variance. These data were compared using
a one-way analysis of variance, followed by Tukey's HSD comparisons with family-wise
confidence level of 0.05 (using aov and TukeyHSD functions in R version 2.5.1; Zar 1999). We
performed the same analyses for the parameters scaled by sapwood area and leaf area. To account
for the importaoce of day-to-day variation in sapflow, we also compared species for each
parameter in a repeated-measures analysis of variance, blocking by individual trees and tree ferns.
The analyses were performed for the study periods during which data were collected
simultaneously for every individual tree (19 days) and for individual trees and tree ferns
combined (12 days).
Comparing stands
To determine stand-level sapflow, we utilized nonparametric bootstrapping methods that
accounted for the multiple sources of error (Blukacz et aI. 2005). For each of the 5-6 plots
surveyed per stand type, we estimated sapwood area (or, for tree ferns, frond area) and sapflow
for each measured individual and summed these for plot-level areas and rates. We repeated this
procedure 2000 times, each time using a new set of allometric coefficients obtained by
18 resampliog our dbh-SA and FLI-FA datasets with no replacement and calculating sapwood
area or frond area for each individual tree or tree fem (see Scaling sapjlow to the stand); we
added a resampled aIlometIy residual to account for variance of the estimate. We multiplied this
corrected estimate of individual sapwood area or frond area by a resampled daily rate of sapflow
per sapwood area (or frond area) for the appropriate species to determine an overall daily sap
flow estimate for each individual in the plot We then summed for ail trees in a given plot to
obtain stand sapwood area and tree sapflow; we summed across ail tree ferns to obtain stand
frond area and tree fem sapflow. We found the mean values of the 2000 bootstrap replicates and
from these determined bias-corrected and accelerated confidence interva1s for mean stand traits
(Efron and TIbshirani 1993).
Our approach to estimating stand-level water uptake rates should be robust for resolving
any substantiaI differences across stands of vlIIYing composition, as using sapwood to scale up
sapflow rates by has been used previously to estimate stand water use in multi-species forests of
Tennessee and the Pacific Northwest (e.g., WuUschleger et aI. 2001, Moore et aI. 2004). We note
that our estimates of stand-level water use are conservative and include a level of uncertainty
because they neglect on average 13% percent of stand basa1 area made up by species not
measured for sapflow. Our estimates also assume the sapflow measurements and diameters of our
study trees to be representative of their species for a wide range of individual sizes across the
stand. We conducted additional calculations to ensure that these uncertainties would not have
affected our findings of differences across stands in estimated sapflow.
Results
Species difj'e,ences In wale, uptake
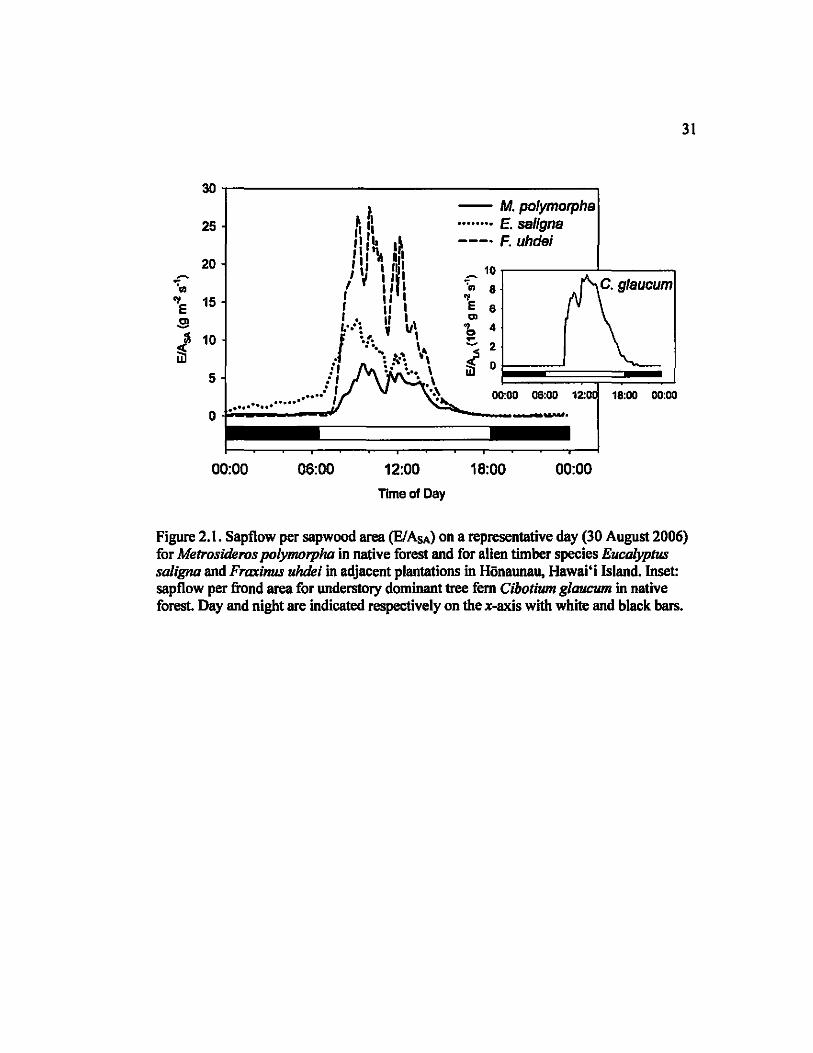
The mean maximum instantaneous sapflow per sapwood area varied four-fold from M.
po/ymorpha (7.9 ±1.9 g m·2s·', mean ± SE) to F. uhdel (31.1 ±4.& g m,2s"), with E. saligna

19 intermediate (16.0 ± 2.8 g m·2s·'; Fig. 2A). At whole-tree level, maximum sapflow rates varied
seven-fold, with that of M polymorpha (0.27 ±0.19 g s") less than half that of E. saJigna (1.08
± 0.34 g s") which in turn was half that of F. uhdei (2.03 ±O.46 g s"; Fig. 2A, inset).
Species also varied strongly in total daily sapflow, with M polymorpha having less than
50% the sapwood area-specific sapflow of the other two species, 207 ± 53 kg m,2, compared with
488 ± 80 kg m,2 and 513 ± 81 kg m,2 for E. saligna and F. uhdel respectively, which did not differ
significantly (Fig. 2B). At the whole-plant level, M polymorpha mean diurnal water use (7.6 ±
5.4 kg) was less than 30% that of E. sallgna (33.3 ± 11,1 kg) andF. uhdei (33.8 ± 7.9 kg; Fig. 2B,
inset).
Species showed strong variation in temporal sapflow patterns, quantified as the timing of
maximum flow, the duration ofpeak flow, and the proportion of diurnal flow occurring outside of
daylight homs (see Fig. I). On average, E. saJigna reached maximum flow at 0937 (±7 min), over
an hour earlier than M polymorpha, F. uhdel and C. glaucum (1048 ±8 min, 1052 ±3 min and
1105 ±6 min lespectively). The duration of peak flow was over 50% longer for E. saJlgna and M
polymorpha than for F. uhdel (6.9±0.5, 6.0±0.3, and 3.9±0.3 homs respectively); the duration of
peak flow for C. glaucum was intermediate at 4.7±O.6 h, Both E. saJigna and M polymorpha
exhibited strong nocturnal sapflow at 30 ± 3% and 24±4% of total sapflow lespectively, while F.
uhdei and C. glaucum showed relatively low rates of nocturnal sapflow (5± 2% and 4±1 %
respectively; Supplementary Material, Table 2.S2 and Figure 2.SI),
Leaf area-scaled sapflow varied strongly among tree species. M polymorpha and E.
saligna had maximum sapflow rates per leaf area of2.05 ± 0.59 xlO" g m,2 s" and 4.66 ± 0.79
xlO"' g m,2 s" respectively, while F. uhdei had a rate of31.9 ± 4.6 xl 0" g m,2 s". Understory C.
glaucum leaf-area specific sapflow rates fell within the same range as for the tree species at 9.49
± 1.10 xlO"' g m,2 s" (data not shown).

20 Tree species also varied strongly in several leaf timctional traits (Supplementary
Material, Table 2.S3). M polymorpha had lowest N and P concentrations per-mass and per-area,
and E. saligna highest N and P per mass and per area. SPI was lowest for M polymorpha and
highest for F. uhdel. Tree species were indistinguishable in their a"c discrimination and SLA. C.
glaucum had higher SLA and SPI values, 1.5 to 2.5 times larger than the highest tree species
values, and C. glaucum had N and P per mass values comparable to the highest tree species
values.
Stand-level differences In water uptake
The three stand types studied were each dominated by one of the study tree species. In native old
growth stands, M polymorpha accounted for 87.7 ±5.0% of the total living tree basal area, with
the remainder consisting largely of Rex anomala (4.9"A.) and Acacia koa (23%; SupplementarY
Material, Table 2.84). In the E. saligna- and F. uhdel-dominated timber plantations, E. saligna
and F. uhdel accounted for 89.6 ±3.5% and 84.7 ±5.7% of the living basal area respectively, with
the remainder consisting largely of remnant M polymorpha (43 and 9.3%) and Acacia koa (1.6
and 6.0%).
The three stand types differed strongly in tree sizes and tree densities (Fig. 3A-C). The
live stem density of the dominant species ranged two-fold from stands of E. sallgna and M
polymorpha (415 ± 57 and 580 ± 106 stems hal respectively) to stands ofF. uhdei (1020 ± 99
stems ha·'). Mean dominant tree species diameter (> 5cm dbh) also ranged two-fold, from E.
sallgna to M polymorpha to F. uhdei (39.7 ±2.2 em, 25.8 ±3.9 cm and 19.9 ±1.3 cm
respectively). F. uhdel had highest sapwood allocation (see SupplementarY Materia1, Table 2.SI).
The variation in stem density, stem diameters, and sapwood allocation led to a four-fold variation
in sapwood area per ground area among stands, (31.4 ±2.t, 12.2 ±3.5, and 8.7 ±2.6 mZ ha", for
stands dominated by F. uhdel, E. sallgna and M polymorpha respectively; Fig. 3A-C).

Stand types also varied strongly in Ciboliul/J abundance (Fig. 4D-F). Native stands
dominated by M. polyl/Jorpha had especially dense Ciboliul/J understory (2ISO± I OS individuals
ha" ), twice that of timber stands dominated by E. saligna or F "hdei (1580± 190 ha' and
21
I 060± 150 ha' respectively). The number of fronds per tree fern did not vary among stand types;
however the average estimated Ciboliul/J frond was SO-65% larger in native forest stands
dominated by M. polymorpha than in plantations dominated by F "hdei or E. saligna (2.79±0.25
m', 1.99±O.09 m' and 1.69±0.14 m' respectively). Due to the larger fronds and more abundant
tree ferns in M. polymorpha-dominated stands, estimated stand Cibolium frond area was two to
three times higher than for E. saligna or F uhdei plantations (33.0±2.8 10' m' ha', IS . I±3.1 10'
m' ha', and 12.S±2.6 10' m' ha' respectively; Fig. 3D-F).
Estimated total stand water use varied 2.5-fold among stands (Fig. 3G). Stands dominated
by Fuhdei used an estimated 1.78 ±0.09 mm day", over twice the amount used by stands
dominated by E. saligna or M. polymorpha (0.84 ±0.18 mm day" and 0.71 ±0.03 mm day"
respectively). In native forest dominated by M. polymorpha, Cibolium water use was responsible
for 75.3 ±6.7% of total stand water use. By contrast, for stands dominated by F uhdei or E.
saligna, the water use ofCibolium was secondary to that of the dominant tree species, though still
substantial ( 11.8±2.6% and 32.2±5.6% respectively).
Discussion
The goal of this study was to compare water use of native forest vegetation with alien timber
plantations to determine whether native tropical forest may be conservative in its water use. We
used a well-drained, wet forest in Hawai ' i as a case study. We found that tree species varied
strongly in their water use even within forests facing similar climates, and that, when water use
was scaled up, stands dominated by different species varied strongly in their water use. Water use
at plant and stand level depended on several factors which varied independently and contributed

22 to total water uptake differences among species and among contrasting stands. Our findings
provide the first strong evidence that Hawaiian native forest can be conservative of water relative
to alien plantations. This finding extends previous work comparing leaf and whole plant traits in
native and non-native species in Hawai'i (Pattison et al. 1998, Stratton 1998, Cordell et al. 2002,
Daehler 2003, Funk and Vitousek 2007) and comparisons of native and non-native riparian tree
water use in the southwestern U.S. that found trees did not vary in leaf area-scaled sap now (Sala
et al. 1996, Glenn et al. 1998) though high stand-level rates could be facilitated by high leaf area.
While other studies in semi-arid areas of Australia and South Africa assessed native vegetation
water use of fynbos or eucalyptus forest without comparing native vs. alien (e.g., Le Maitre et al.
1996, Calder and Dye 200 I), our work for Hawai ' i shows that contrasting water use can be as
important in a wet forest system as has been expected for water limited or riparian systems.
Strong differences in waler use among native and alien species
Hawaiian forest dominant species M polymorpha exhibited the lowest rates of maximum sapflow
on a sapwood-area, leaf-area, and whole-tree basis in our study, whereas F. uhde; had the highest
rates. These differences would arise from intrinsic differences in wood and leaf properties. The
higher maximum sapwood-area specific uptake rates of F. uhde; would arise from a higher
canopy conductance, reflecting a higher whole-plant conductance and/or water potential gradient
across the plant (Tyree and Zimmermann 2002). Large earlywood vessels in deciduous F. uhde;
may contribute to a higher hydraulic conductance for F. uhde; relative to the two Myrtaceaous
species.
The relationship among species' sapwood-scaled sap flow was maintained even when
scaling up to the whole tree, as F. uhde; had high sapwood allocation relative to basal area
compared to E. saligna and M polymorpha. F. uhde; had greater maximum sapflow rates than M
polymorpha with E. saligna intermediate, but when accounting also for the large sizes of the E.

23 saligna trees, F. uhdet and E. saligna both had greater maximum whole-tree sapflow rates than
M polymorpha. Similar patterns were found for daily total water uptake with M polymorpha
having the lowest uptake. However, daily rates for K saligna and F. uhdei were similar due to
tempoml variation in sapflow patterns among species. F. uhdei had short intervals of high flow
rates whereas E. saltgna had long periods of lower flow rates. Indeed, we noted a strong early
peak of K saltgna, potentially due to open stomata, tall trees, or steep leaf angle facilitating light
interception at low sun angles at dawn and dusk (King 1997). M polymorpha also had long
intervals ofpeak flow, but these were not enough to compensate for its very low flow rates. The
understory Ctbottum had even later sapflow peaks; it is likely that shading from canopy trees
delays the onset of photosynthesis and transpiration in the morning.
We found substantial rates ofnoctumal sapflow in our species, ranging from 4-30% of
total sapflow. Higher proportions of nighttime flow in K saltgna and M polymorpha may be due
to tissue recharge and/or nocturnal transpiration. Nighttime sapflow has been documented for M
polymorpha (Dawson et aI. 2007) and Eucalyptus grandis (Benyon 1999) and attributed to
transpiration. Other studies have found nighttime percentages of total flow as large as 13-28% for
trees in the Brazilian cerrado (Bucci et aI. 2004) and 30-70% for Drimys granadensts in Costa
Rican cloud forest (Feild and Holbrook 2000). Possible explanations for noctumal transpiration
include cuticular conductance or leakage from incomplete stomatal closure (Caird et aI. 2007,
Cavender-Bares et aI. 2007). Possible functional roles include allowing carbon fixation to begin
earlier in the day (Caird et aI. 2007, Dawson et aI. 2007), facilitating nutrient transport to the root
surfaces in nutrient-limited systems (Scholz et aI. 2007), improving oxygen supply in respiring
sapwood (Gansert 2003), and/or preventing C~ buildup in the leaves due to nighttime respiration
(Marks and Lechowicz 2007).
Leaf area-sca1ed rates indicating low water uptake for M polymorpha and high uptake for
F. uhdei parallel some of their leaf-level traits. In particular, high stomata1 pore area per leaf area

24 (SPI) of F. uhdel relative to M polymorpha suggests high leaf-level stomatal conductance
(Sack et a1. 2003), and the observed high leafN and P concentrations of the high water-using
alien species relative to that of M polymorpha suggest higher relative growth rates (Niklas 2006),
consistent with the paradigm of faster growing alien species with associated higher water uptake
rates (Daehler 2003, Brauman et a1. 2007). However, the degree to which differences in whole
plant traits are determined by leaf functional traits alone is contentious (Cordell et a1. 2002,
Poorter and Bongers 2006, Funk and Vitousek 2007). We note that sapflow per leaf area as
determined in this study involved calculation based on estimated total canopy leaf area. Thus,
while leaf-area specific rates will depend on the relative activity of transpiring leaves, they may
also be decreased according to the amount of self-shaded, relatively inactive foliage. The
structure of the tree crown may reduce wind and increase leaf boundary layers thus further
reducing leaf-area specific transpiration rates (Larcher 2003).
We found C. glaucum to have an SP! much higher than that of tree species, suggesting a
high leaf-level stomatal conductance, a potential adaptation for maximizing photosynthesis in the
fluctuating light conditions of the understory (Hollinger 1987). While conductance may be higher
for ferns than for trees, lower vapor pressure deficit in the understory means the tree ferns are not
subjected to the same high atmospheric demand as at the canopy, and overall, understory
C.glaucum had leaf area scaled transpiration rates similar to those of the canopy trees.
Strong dJ.fferences In water use between native forest stands and oIIen timber plantations
Estimates of water use for forest stands varied according to differences in stand structure and
composition. Stand types varied in structure, with F. uhdel stands characterized by a high stem
density of relatively small trees, whereas E. sallgna stands had lower densities of larger trees, and
M polymorpha had yet lower densities of trees that were on average slightly larger than those in
F. uhdel stands. Although basal area per ground area tended to be highest in E. sallgna stands,

when F. uhdefs high sapwood allocation was taken into account, F. uhdel stands emmged as
having the most sapwood area per hectare.
25
We found significant differences in water use among stand types, even when we
accounted for other less-abundant species' sapwood and water use contributions. When we tested
a scenario in which all other species contributed 100% of their basal area to sapwood, F. uhdei
stands still had significantly higher sapwood area relative to the two other stand types. We also
tested different sapflow rate scenarios to assess the robustness of the differences among stands.
We accounted for sapflow in all trees other than the study species and found, even in the
situations minimizing differences among stands (high rates for M po/ymorpha non-study species
and low rates for F. uhdel non-study species), that the same trend of high stand-level water use by
F. uhdel stands versus either M po/ymorpha or E. sallgna stands was maintained. This further
demonstrates native M po/ymorpha has conservative water use relative to certain non-native
timber covers and also that stand transpiration can vary among alien timber stands of similar age
but different dominant species.
Another finding of our study is that site history affects stand water use. While native M
polymorpha stands at this site are the result of natura1 succession, the alien timber stands were
planted in areas previously cleared of M po/ymorpha forest during the 1950s (Carlson and Bryan
1963). As a result, these plantations consist of younger trees, and their lespective sizes and
densities are reflective of their growth rates and planting densities. E. saligna grows to larger
sizes than F. uhdei; M po/ymorpha can achieve large sizes, but has notably slow growth
(Zimmerman et aI. in press). The plantations' understory tree fern densities also reflect this
disturbance history as old-growth M po/ymorpha stands have had a longer period of time to
develop high densities of tree ferns, and high fern frond cover is common in Hawaiian M
polymorpho-<iominated wet forest (Drake and Mueller-Dombois t 993).

26 Even accounting for the high tree fem cover in M po/ymorpha stands, stand-level
water use differed strongly among stand types. Tree fem water use estimates obtained from high
Cibotiwn frond area and sapflow mtes more than doubled overall water use of M polymorpha
dominated stands. Despite this, F. uhdel stands still used twice as much water as stands
dominated by M po/ymorpha and E. sal/gna on a daily basis. We tested different scenarios
applying measured (but unpublished) C. menzlesll flow rates (n=2) to all C. menzlesll frond area
or all Cibotiwn frond area to assess whether differences in overall stand water use were robust to
variation in tree fern sapflow rates; the trends did not change.
In native M po/ymorpha-dominated forest, understory tree ferns contribute significantly
to overall stand transpiration. Understory components including bracken fem have previously
been observed to strongly influence sland water use in studies assessing the partitioning of
transpiration (Roberts et aI. 1980, Hollinger 1987, Black et aI. 1989, Kostner 2001). Vertessy et
aI. (200 1) found that as overstory leaf area index (LAI) decreased with forest age, understory LA!
increased, suggesting a corresponding increase in understory transpiration, which is consistent
with our findings of high understory frond area in old-growth M polymorpha-dominated forest
versus the alien timber plantations. However, Vertessy et aI. (2001) observed mtes ofleaf area
based transpiration that were only 63% that of the overstory on a leaf area basis, while our data
indicate, in forests with more open canopy, tree ferns use water at mtes comparable to or
sometimes greater than those of the dominant canopy trees. It is clear that tree ferns are playing a
significant role in the water balance ofHawai'i's native forests, and, on a leaf-for-leafbasis, ferns
may be exerting more control over local water than the dominant canopy species, with
implications for ecology and competitive interactions between dominant canopy species and tree
ferns. Is it possible tree ferns are intercepting and transpiring water that would otherwise support
more deeply-rooted tree species? While we did not investigate the depletion of soil water by our
study species, tree ferns and trees are likely partitioning water resources as bas been shown for

27 other ecosystems (e.g., Stratton et aI. 2000). Thus, a forest's composition and site history (and
resulting tree and understory cover) can contribute to major differences in stand water uptake and
may influence ecological dynamics across sites.
Study IlmltatJons,future research needs, and Implkallons/or forest ecology and conservation
This study demonstrated strong species differences in sapflow within a given forest type, between
native and alien tree species, and indicated that these scale up to whole-stand water use for
contrasting forest compositions. However, logistical challenges Iimted our ability to determine
the full water budget of the study forests. While our sites were chosen to have comparable soil
and climate, an advantage of siting model forests in Hawai'i, a fully explicit quantification of the
degree of variation within versus across stand types would require replication of sapflow and
vegetation surveys across multiple sites. Further work should confirm the findings at a larger
scale, with replication of native and alien plantation forests.
Because we were only able to measure Cibotium sapflow in the native M polymorpha
forest, we assumed for this study the measured C. glaucum sapflow rates were representative of
all Cibotium in the F. uhdei and E. saligna stands. While ideally one would measure rates of
Cibotium water use for all species in all sites, we expect that variation in rates between sites and
species is minimal and thus would not change our conclusions on total stand water use; both C.
menziesi; and C. glaucum, the two native species found in our stands, co-occur in wet forest and
have similar stomatal conductances in a range of environments (Durand and Goldstein 200 I).
Likewise, we also assumed our study trees were representative of all trees in a given stand type,
though differences in site microclimate, soil water availability, and forest structure also may
mean individuals in a stand are being subjected to different controls on transpiration. Further,
differences in tree age may partially determine the findings of our species comparisons. However,
our measured rates are useful for showing how such differences can indeed arise. Future

technological and methodological innovations will enable measurements on more trees to
better allow quantifilllltion of variation within and among trees within given stands.
28
Another limitation of our study was the relatively short study length, covering only a period
in which soil water was abundant, as is typical for this study system. Future work should consider
water use by contrasting forest types across a whole year or multiple years. Such work would be
particularly useful given that one of the stand-dominants, F. uhdel, is winter-deciduous, and
remains leafless for up to four months. However, we expect that the F. uhdel-dominated stands
are likely to have higher water uptake even if integrated over a year, all else being equal, as the 4-
fold greater uptake rates during 8-9 months with leaves would not be obviated even if uptake was
zero during the 3-4 months of the year without leaves. Future studies should also take into
account seasonal variation and scale water use by leaf area to enable incorporation of remotely
sensed LA! to model annual and interannual water use.
We note that our work focuses on one component of a forest water budgeL Plant water use,
i.e., sapflow, explains only a part of the evapotranspiration flllXes of the water balance. We did
not assess potential differences in canopy interception and evaporation between sites, which
would also reduce the plant available soil water and thus groundwater recharge. There is a strong
need for work focusing simultaneously on all components of the water balance, including canopy
interception, evaporation, stemflow, throughfall, infiltration, and soil water availability. Including
species-specific water use with these measurements will create an interdisciplinary ecohydrology
necessary for detailed forest water budgeting. The more complex structure of native stands may
also have impacts on other aspects of the terrestrial water balance (increasing infiltration and
decreasing runoft) and reducing wind speed (and thus transpiration) through the forest However,
the main principle shown by our study, that major differences in transpiration can arise among
species in a given climate, and the conservative transpiration of a native forest, suggests the
potential for higher recharge rates and water conservation through informed forest management

29 We note that work on forest ecohydrology win eventuaUy allow the elucidation of fuJI forest
water budgets, with implications for soil water availability to benefit forest plants, as well as
groundwater recharge, as the interaction of forests and water has impacts on species-level biology
to wateJshed hydrology. Future work on model ecohydrology systems can clarify these impacts at
a wide range of scales.
Our findings indicate that water uptake of the contrasting forest species and stands should
be assessed as a potentially critical factor in determining forest ecosystem services and informing
land management decisions. In the case ofHiinaunau Forest, Hawaiian native wet forest has
conservative water uptake, and further studies can determine whether the groundwater recharge
enabled by the lower forest water uptake can contribute enough value to further motivate
conservation and restoration oflhis forest type in appropriate areas. However, we caution against
using these results in isolation, for example, to justify planting E. saligna or harvesting Clbotirun.
In all cases, the seeming benefits for water use must be considered together with other values and
motivations, such as preservation of native habitat, biodiversity and ecological processes.
Acknowledgements
Mahalo nui to James Hardison, the HolKagawa and Fergerstrom 'ohana for logistical support
throughout the project; Travis Idol, Becky Ostertag, Mike Parsons, Don Drake, Tom
Giambelluca, John Delay and Kainaliu Research Station staff for equipment; Sterling Higashi,
Joanne Birch, Dana Crompton, Michelle Elmore, ~dy Moorman, Lara Reynolds, Alex
Wegmann for assistance in sensor-building; Sharon Ziegler-Chong, Bernice Akamine, Stephanie
Bento, Michele Harman, Kanoa Kimball, Malia Kipapa, Imiola Lindsey, Zach McCorkhill, Dean
Meason, Narnaka Whitehead, HawCC and West Hawaii CC Forest TEAMS Program- Pamela
Scheffler, Mick Castillo; Amy Greenwell Garden staff for assistance in field data collection;
Rachel Spicer, Jen Funk, JB Friday, Patrick Niemeyer, Susan Cordell, Creighton Litton, Jan

•
30 Haraguchi, Paul Scowcroft, Christian Giardina for data and method insight; Randi Schneider
for assistance with leaf nutrient analyses; Marguerite Butler, Marco Kienzle, Orou Gaoue, Jeff
Scales, and Alex Gottlieb for assistance with data analysis; Kate Brauman, Mashuri Waite,
Maggie Sporck, Chris Nakahashi, and Molly Cavaleri for helpful discussion and comments on the
manuscript; Kamehameba Schools for access and logistical support. Funding was provided by
USGS contract #2004ID57B to K. Duarte at the University ofHawai'i Water Resources Research
Center, NSF grant IOS-0753233 to L. Sack, Kamehameba Schools' 'Imi Na'auao and 'Aina Ulu
programs, Sigma Xi GlAR, and the University of Hawai'i at MAnoa Ecology, Evolution, and
Conservation Biology, Kahuewai Ola, and Native Hawaiian Science and Engineering Mentorship
programs •
~ -'1Il
'1'e S
l
30
A 25 ~ " I I "," I~
20 "''\t~' I " , I 'V III I II I 15 ' /I I , If I
,. II I L-.': , ", 10 f" , .:~. ,
-'.' .. : ::(~ Ii, : J :. .... \
5 : , . \ ... .: , ",\ .. •••••••• I .,
••••• 'O ••
0
00:00 06:00 12:00
TIme of Day
31
- M. po/ymorpha ........ E. saligna ---. F. uhdei
10 ~ 8 ~E
6 D>
b 4 :::. 2
i 0
00:00 06:00 12: 18:00 00:00 _ ......
18:00 00:00
Figure 2.1. Sapflow per sapwood area (EI AsA) on a representative day (30 August 2006) for Metrositkros polymorpha in native forest and for alien timber species Eucalyptus saligruz and Fraxinus uhdei in adjacent plantations in Honaunau, Hawai'i Island. Inset: sapflow per frond area for understory dominant tree fern Cibotium glaucum in native forest. Day and night are indicated respectively on the x-axis with white and black bars.

32
A ~ 2 5 b
60
., '"
~ 2.0
.L ~ ~ 15 g 1.0
'" 0.5
0.0
C! 40 E
~
MP ES FU
T ()i
~ • 20 E W
af ~
0 1000
800 <f'
B SO · b ~ .-, 40 J ~ 3() ~
UJf 20 j ~ ' 0 I
0 E MP ES FU 0> 600 6 «
.... '" T T
--". 400 • ~ w
200 T
0 MP ES FU
Figure 2.2. Sap fl ow parameters for native and alien tree species in Honaunau Forest, Hawai ' i Island. (A) maximum instantaneous sap flow rate per sapwood area (Emax/A sA )' and per tree (Erna" inset), and (B) mean diurnal sap flow per sapwood area (Ed,y/AsA), and for the whole plant (Eday, inset). Species abbreviations: MP, Metrosideros polymorpha; ES, Eucalyptus saligna; FU, Fraxinlls lIhdei (n = 6) . Bars indicate means and standard errors, with same lower case letters indicating statistically indistinguishable means (at P = 0.05; post-hoc Tukey compari sons of In-transformed data).

'7>, 2.0 to "0 1,5
~ 1.0
~ u 0.5 UJ
0.0
Metrosideros forest
Ae • • • dbtl* 2S" t 3.i
o _saO :lloe • • : : ~~~ : ~¥-
v~66~ ~\~<S u ~!\ / \ y\Z ~ ' ''''02' . ' / 0 _ 2 15 t O.l 0 F.c, " SlO t 1 8
G
a
r- r-- 1 Metrosideros forest
33
Eucalyptus plantation Fra'Kinus plantation
B • C ® @
• ® • ® ®
® ® H."
• (Ibn - 39.7J: :t.1 ® cIlh • 1 ~.8 ! 1.3 o * .,5 1: 57 o • 10 21) t 9Si SA_ 7nO tIJ ®@ BA "'3ft1 t2 5 SA "' 12 2;tl5 54 -3'" t2 1
E ~ 1\/ F
/\/?!\
~4; .. _~ [{; ~66 6 6 .. _, ... 0.00 o .' 58 t OI. o . ,00:10,15 FA - IS.1 " . 1 " ... .. 12.5 :1 2.5
b
- I -a
Eucalyptus plantation Fraxfnus plantation
Figure 2.3. Stand structure and estimated stand-level water use for Melrosideros poly morpha-dominated native forest versus alien timber plantations dominated by Eucalyptus saligna and Fraxinus uhdei (n=5, 5 and 6 stands respectively) . (A-C) Schematic of trees in a 10m x 10m plot for each stand type represent ing average values of the several factors important in determining stand-level water use: dominant tree densities, sizes, and sapwood allocation patterns (data prov ided in inset boxes: dbh, diameter at breast heiF,ht, cm; D, densi ty, stems ha' t; BA , basal area, m2 ha' l; SA, sapwood area, m2 ha') . In the schematic, tree dbh is indicated by outer circles, sapwood area by gray, and heartwood area in black; the scale line on the right represents distance along the ground in the plot. (D-F) Schematic of understory Cibotiulll in each stand type representing densities, with triangle sizes reflecting average total frond area per individual, i.e., frond area x number of fronds per individual (data prov ided in inset boxes: At averaF,e area per frond, m2
; D, density, 103 caudices ha' t; FA, stand-level fro nd area, 10 m2 ha') . (G) Scaled-up mean stand diurnal sap flow as the sum of tree (gray) and tree fern (white) components. Error bars indicate 95% confidence intervals with lower case letters indicating statistica lly indistingui shable means according to post-hoc Tukey comparisons at P = 0.05.

CHAPTER 2 SUPPLEMENTARY MATERIAL
Table 2.S I. Mean traits of tree and tree fern species and sapwood and frond area allometric coefficients. Columns on the left indicate mean values: for tree species, diameter at l.3m height (x, dbh) and sapwood area (y, SA), and for the tree fern species: frond length index (x, FLI; see text) and individual frond area (y, FA). Maximum heights in parentheses are those observed for the species. Columns on the right indicate coefficients a and b fitted to the relationship In y = a + b In x with a dataset of sample size n. When applying the coefficients using the power-law y = eO * xb, the estimate is multiplied by a correction factor c to account for systematic bias arising from coefficients fitted to log-transformed data; c was calculated as e,,2/2 (Baskerville 1972, Sprugel 1983).
x ): a b c n ,,= dbh (em), y = SA (em,>
M po/ymorpha 35.0% 8.5 261 % 107 (6) I .().779 % 0.412 1.73 % 0.12 1.02 15 (-30m max ht) (6)
E. sal/gna 73.3 %9.4 605 % 158 (6) I .().87U 0.417 1.68%0.10 1.03 22 (-55m max btl (6)
F. uJuk/ 30.0%2.1 609% 84 (6) I '().654 % 0.034 2.07%0.01 1.00 30 (-30m max btl (6)
,,= FLI (m), y = FA (mI) 2.43 % 0.19 C. glaucum 2.40 % 0.25 (7) I -1.07% 0.21 2.13%0.24 1.06 18 (-7m max hI, median-1m) (7)
~

Table 2.S2. Mean squares (MS) of analyses of variance compari ng water use parameters of tree species Metrosideros polymorpha, Eucalyptus sa/igna, and Fraxil1us uhdei. We tested for differences among species' sap flow rates for integrated diurnal sapflow (E" .. kg day- ') and daily max imum sap flow (£""" g s') on a whole-tree basis (Eto .. kg day"; E",." g s'), sapwood-scaled basis (E"/AsA, E,=/AsA), and leaf area-scaled basis (E.o/ALA' E~/ALA) ; we also compared parameters of temporal sap flow patterns, including time at maximum sapflow (t=, hour), time duration at which sapflow was greater than 50% of max imum sap flow (M", •• , hours), and proportion of total sap flow occurring at night ( 1830-0630; E.JE.ot, percent). The left columns contain the results of a one-way ANOY A, testing species difTerences for data for all species over the enti re measurement period. The right columns contain the results of a repeated-measures ANOYA, testi ng species, day and species' day interaction for the 19 days that all individual trees were measured simultaneously. Error"di, refers to variation between individuals and Error,ot~ refers to overall variation from all observations. ·0 .05>~0.0 I; •• 0.0 I >~O.OO I; ••• P<O.OO 1.
Whole-tree
In(E",,)
In(E_ l
I'er sapwood area
In(E,.IASA)
In(~IAsAl
Per lea f area
In(E,oIALA)
In(E",.,.IALAl
Temporal patterns
I~
lltpeu.
£'/£'01
One-way ANOVA
Species E rrOrindiv
df=2 df=15
9.19" 1.37
11.5 •• 1.30
1.70' 0.339
3.04u 0.355
8.20··· 0.275
12.4··· 0.259
2.975" 0.41 1
14.013'" 0.808
0.09987'" 0.00508
Species df=2
203"
237"
45.1'
65 .9"
176·"
247···
50.103'
225 .05'"
2,1331'"
Repeated-measures ANOVA
Errorindiv Day df=15 df=18
28.9
28 .6
7,73
8.60
6.48
6.65
10.798
11.99
0.1217
2.18·"
0.932'"
2, 18'"
0.932·"
2.IS···
0.932'"
12.5 1'
33.31'"
0,05850'"
Species x Dav df=36
0.466'"
0.198"
0.466'"
0. 198"
0.466'"
0.198"
11.49"
5.86'
0.02242"
Errortolal df=270
0.1 67
0.108
0.167
0. 108
0.167
0.108
6.74
3.83
0.0 11 63 v.> v.

Table 2.S3. Leaf traits for tree and tree fern species measured for sap flow in Honaunau Forest, Hawai' i Island: specific leaf area (S LA), stomatal pore length (L_), stomatal density (D.o"",,), stomatal pore index (S PI = Lpo,,' x D"oom"), nitrogen concentration per mass (Nm.,,) and per leaf area (Nu,,), phosphorus concentration per leaf mass (P"",.) and per leaf area (P~,,), and carbon isotope discrimination (o l3C). Mean values ± standard errors are given; n ranged from 3-1 0 except for E. saligna (n=2). Tree species differed in all traits except for SLA and O"C (ANOYA, · 0 . 05>~0.0 1; .. 0.0 1 >~0.00 I; ••• P<O.OO 1). For each trait, lower-case letters indicate no significant difference between tree species according to post-hoc Tukey comparisons (P=O.05).
SLA D Slomat8 " SPi ' (cm2 (mm" ) (mm2mm"Z)
Tree species M. polymorpha 6 1.6 ± 17.3 ± 195 ± 0.0578 ±
5.4 a 0.8 b 12 b 0.00l6 b
E. saligna 72.7 ± 15.4 ± 318 ± 0.0748 ± 4.S a 0.7 b 20 a 0.OOl2 ab
F IIhdei 99.8 ± 24.5 ± 137 ± 0.0849 ± 24.4 a 0.2 a 5c 0.0046 a
Tree (ern species C. glalicunJ 151 ± 1 24.4 ± 362 ± 0.215 ±
II O.S lO 0.0 19
Nm:us .. Nuea
, (%) (g mO
')
0.778 ± 1.28 ± 0.040 b 0. i4 b 1.66 ± 2.29 ± O.OS a 0.04 a 1.28 ± 1.37 ± O. l l a 0.18 b
1.91 ± 1.08 ± 0.14 0.17
PmallS ..
(%)
0.041 ± 0.003 b 0.091 ± 0.006 a 0.075 ± 0.006 a
0.113 ± 0.015
Pruu ,
(g n'-' )
0.068 ± 0.006 b 0.126 ± 0.00 1 a 0.082 ± 0.015 ab
0.064 ± O.Oll
S"C (%0)
-32.0 ± O.l a
-31.7 ± 0.1 a
-32.2 ± 1.0 a
-30.3 ± 1.3
v.>
'"

Table 2.S4. Percentages ofbasal area by component tree species as means ± standard error and total living tree basal area for each of the stand types represented in this study. Within each stand type, five to six plots were surveyed for all living stems greater than lem diameter at breast height; species are listed in order of decreasing abundance.
MetrosideroslCibotiwn forest Eucalyptus saligna plantation Fraxinus uhdei plantation
Metrosideros polymorpha 87.7 ±5.0 Eucalyptus saligna 89.6 ± 3.5 Fraxinus uhdei R4.7±5.7 Rexanomala 4.9 ±3.4 Metrosideros po/ymorpha 4.3 ± 3.3 Metrosideros po/ymorpha 9.3±5.2 Acaciakoa 2.3 ±2.3 Acaciakoa 1.6 ± 1.0 Acaciakoa 6.0 ± 1.7 Coprosma spp. 1.3 ±0.6 Fraxinus uhdei 1.3 ± 1.3 Toono ciliata 1.1 ± 1.2 Oexanomala 1.1 ± 0.7 Cheirodendron trigynwn 1.1 ± 1.0 Pe"oUetia sandwicensis 0.8± 0.5
Total basal area (m2 ha·l)
43.8 ± 12.3 79.0 ± 15.7 43.0 ± 2.6
.....
...:J
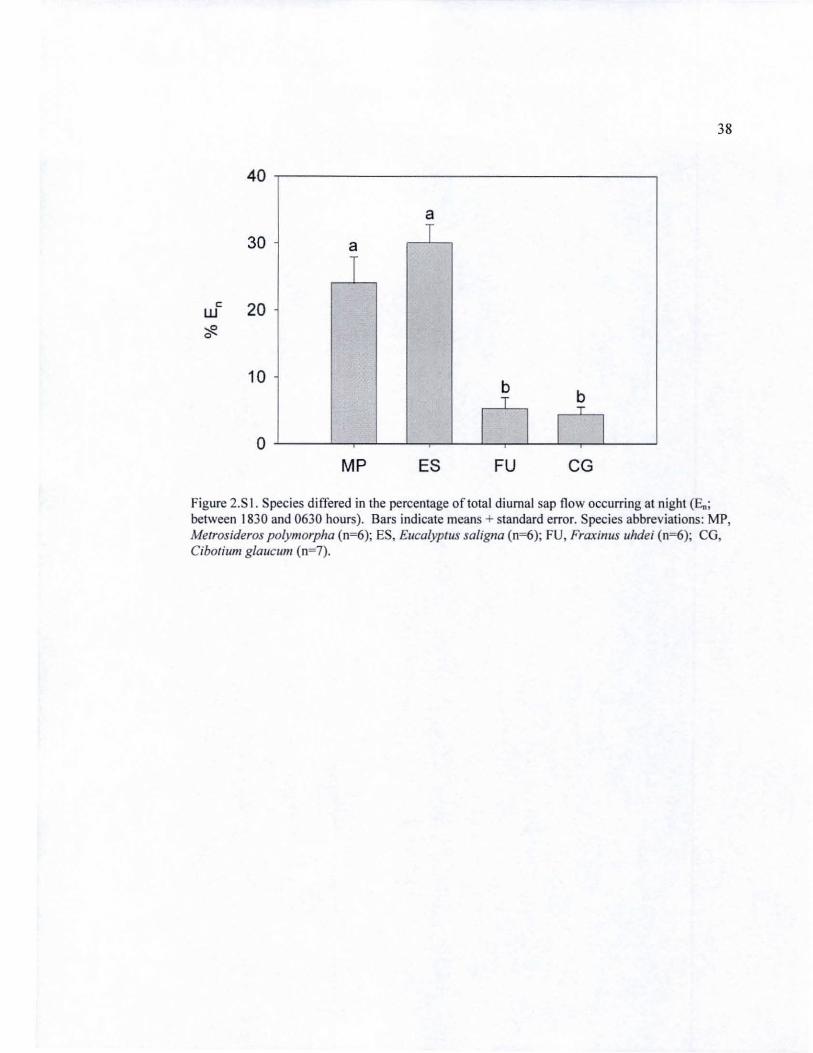
38
40
a T a 30
T
b b T
I I I T
I
10
o MP ES FU CG
Figure 2.S I. Species differed in the percentage of total diurnal sap flow occurring at night (E,,; between 1830 and 0630 hours). Bars indicate means + standard error. Species abbreviations: MP, Metrosideros polymorpha (n~6); ES, Eucalyptus saligna (n~); FU, Fraxinus uhdei (n~6); eG, Cibotium glaucum (n~7).

39
C HAPTE R 3
Sap now responses to microclimate:
Applying multi-model inference to assess va ria tion a mong species
Int rod uction
Bulk sap flow methodologies have contributed significantly to the estimation of forest
transpiration and studies of whole-plant physiology. Some examples from hydrology include the
use of these methods to assess the water use of stands of different species compositions and ages
(Barren et al. 1996, Roberts et al. 2001, Delzon and Loustau 2005, Ewers et al. 2005) and the
partitioning of vegetation water use into different flux components or vegetation components
(Kelliher et al. 1992, Oren et al. 1998, Zeppel et al. 2006). Because sap flow methods allow
continuous measurement of whole plant transpiration in situ, they have resulted in numerous
studies on the response of transpiration and stomatal conductance to environmental variables at
diurnal, daily, seasonal, and even interannual timescales (Jarvis 1976, Meinzer et al. 1993 , Sturm
et al. 1998, Oren et al. 1999a, Oren et al. 1999b, Gran ier et al. 2000, Oren and Pataki 200 I, Oren
et al. 200 I, Phillips and Oren 200 I, Pataki and Oren 2003, Ford et al. 2005).
Such studies have led to the development of empirical models describing relationships
between transpiration or conductance and environmental variables, modeling these as responses
to irradiance, temperature, and vapor pressure defici t on diurnal timescales. For daily, monthly,
and seasonaltimescales, soil moisture and leaf area components have been included in the
models. One problem in the literature is thaI, among various stud ies, different environmental
parameters are measured and different mathematical funct ions are fit to the sap flow or
conductance data. Previous modeling efforts have focused primarily on fitting linear and
nonlinear functions through a least-squares approach; these range from linear models with

40 multiple additive terms (W ullschleger et al. 2001) to nonlinear models of canopy conductance
based on one or two environmental variables (Oren et al. 1999b, Ewers et al. 2005), usually vapor
pressure deficit (VPD, kPa) or photosynthetically active radiation (PAR, ~mol m-' s" )_ Linear and
nonlinear function s of single variables are often combined into multiplicative models as originally
proposed by Jarvis ( 1976). Relatively recent ly, Ford et al (2005) put forth a strong argument for
using time-series approaches to account for changing relationships of sap flow and environment
in time, a more accurate approach to modeling sap flow, however, we will not consider these
here.
In this paper, we assess the suite of empirical and statistical models presented in the
literature, as we ll as some standard multiple regression forms , for characterizing the response of
sap flow to PAR, temperature, and VPD for four different species in Hawai'i. We employ an
information theoretic approach (based on likelihood and AIC) for selecting and comparing the
relative success of different fitted models for each species. We then use the best AlC-selected
models to explain differences among species' responses to environment. This approach provides
additional insight into the control of sap fl ow by PAR, temperature, VPD, and combinations of
these by showing which models of these variables best apply.
Methods
Study species Qlld site
The study was conducted at Honaunau Forest Reserve, a 4250-hectare patchwork of forest and
tree plantations owned by native Hawaiian legacy trust Kamehameha Schools on the leeward
s lope of Mauna Loa, Hawai'i Island. Within this forest, two sites were se lected to represent
native and alien-dominated vegetation in the ahupua 'a (land divisions) ofKahauloa (N 19.482°,
W 155.869°) and Honaunau (N 19.435°, W 155.844°), respectively. The sites are 5 km apart, at
1000 m elevation on 750-1500 year old ' a ' a lava flows (Lockwood 1995) of Puna-Udarent soil
41 type (Soi l Survey Staff, Niemeyer 2006). At Kahauloa and Honaunau, mean annual
precipitation is respectively 1520 and 1450 mm, mean annual temperature 17.5 and 17.3 DC, and
relative humidity annual minimum/maximum 67.9/97.8% and 67.6/98.0% (Giambell uca and Cuo
in prep). These sites were selected for their contrasti ng vegetation in conjunction with strong
similarities in substrate and environment; in addition, the high substrate penneabi lity and low
slope orthe area minimize horizontal fluxes of water thus simpli fyi ng water balance estimates.
We measured sap flow for individuals in four taxa representing both native and non
native plants; these included endemic canopy tree Melrosideros polymorpha Gaud. (Myrtaceae;
common name 'ohi 'a; Wagner et al. 1999) and endem ic tree ferns Cibotillm glallclIm (Sm.)
Hook. & Am. and Cibotill1n menziesii Hook (Cibotiaceae; common name hlipl/'ll pllill and
hlipll'lI 'i'i; Palmer 2002, Smith et al. 2006) in the native old-growth forest of Kahauloa. At a
non-native tree plantation site in Honaunau, we studied Ellcalypllls saligna Sm (Myrtaceae;
Wagner et al. 1999) and Fraxil1l1s IIhdei (Wenzig) Lingelsh (Oleaceae; Wagner et al. 1999) in
monotypic stands of approx imately 2 ha and 25 ha respectively.
Monitoring m eteorological conditions
From August through September 2006 (wet season), we recorded meteorological data in forest
gaps at both sites. Photosynthetically active radiation (PAR, I'mol m" 5') was measured using
L1- 190 quantum sensors (L1-COR, Lincol n, Nebraska) at 30-second intervals, and we recorded
I O-minute averages using a CR I OX datal agger (Campbell Scientific, Logan, Utah). Power to the
datalogger unit was supplied by a 7A h 12V sealed lead-acid battery (Radio Shack, Fort Worth,
TX). At each site, we also measured temperature (DC) and relative humidi ty (%) using the
temperature and humidi ty sensors associated with a WS-2308 system (LaCrosse Technology,
LaCrosse, Wisconsin). Due to memory constraints for these systems, we recorded average
temperature, humidity, and rainfall data for the two sites only on an hourly bas is. From the
measured temperature and humidity information, we calculated vapor pressure deficit (VPO,
kPa) according to the Magnus equations using the coefficient values provided in Buck (198 1).
Measu ring sap flow in Irees lind Ireeferns
42
From August 2006 through September 2006, we recorded sap flow for s ix individuals for each of
the three tree study species. We measured tree sap flux density (J" g m" s") using modified
Granier-style heat dissipation probes with I-cm long sensor tips (James et al. 2002). To calculate
Js from sensor voltage output, we used the recently re-validated calibration of Granier (Granier
1985, McCulloh et al. 2007). Measurements of sap flux density were made every minute and
recorded as 10-minute averages using a CRIOOO datalogger from Campbell Scientific. Probes
were heated continuously at 0.16W per heated sensor; power was supplied with 6V deep-cycle
batteries and distributed using a self-buil t voltage regulating circuit. We install ed two to five
replicate probes in each tree at 1.3 m height at different depths in the sapwood and at different
points around the tree's circumference. To estimate whole-plant sap flow, we scaled up probe
measurements by assuming each probe measured flux through an annulus of sapwood. Sapwood
was defined between the cambium and inner extent of sapwood determined for each species from
increment cores (see Chapter 2), and within the sapwood, annuli were defined by the midpoints
between successively deeper probes. We calculated total plant sap now E (g s" ) by summing the
flux contributions from each annulus, effectively integrating across the cross-section of the tree
trunk (Hatton et al. 1990).
We also recorded sap flow for fronds of nine individual tree ferns (seven Cibolilll1l
giallcllm, two Cibolillllllllenziesii, one frond per ind ividual). We measured tree fern frond bulk
sap flow (g 5') using a commercial stem heat balance collar system placed on frond stipes
(Oynamax Flow32 system, Oynamax, Houston, Texas) powered by 12V deep-cycle batteries. We
calculated bulk sap flow from voltages of four thermocouples per collar using the manufacturer's

calculation procedures (Sakuratani 1981 , Baker and van Bavel 1987), Measurements were
made every minute and recorded as 15-min averages using the Dynamax system,
Ana/ysis of sap flow data: Correlations and modeling on PAR, temperature, and VPD
43
Prior to analysis, all data series were averaged to common hourly intervals, To facilitate titting of
species-speci tic models, we normali zed sap flow data for individual trees and tree fern fronds as a
new response variable, E~, calculated as E,lE_, where E, is sap flow at any point in time and
Em" is the overall maxi mum sap flow rate over the course of the study, These observations
ranged from 0 to I, which eliminated variation in sap flow magnitude among individuals and
allowed us to conveniently pool data for a given species, We used the poo led normalized sap
flow datasets for each species, which enabled us to compare model coefficients for different
species. We compared hourly observations of E"",,. and PAR, temperature, and VPD and focused
our analysis on only daytime values (observations falling between the hours of 0600 and 1800).
We performed a preliminary analysis by testing the strength of correlations of sap flow and
environmental predictors of PAR, temperature, and VPD independently of each other. All
analyses were performed in R version 2,6,2 (R Development Core Team 2008, scripts available
upon request)
We constructed our candidate model set by collecting from the li terature the various
empirical and statistical models used to fit sap fl ow and stomatal conductance to predictors of
PAR, temperature, and VPD (see Supplementary Material, Table 3,S I), The suite of models
included nonlinear functions describing the saturating responses of sap flow and stomatal
conductance to PAR and VPD (when considered independently) as well as mu ltiplicative
co mbinations of these functions (Jarvis 1976), For insight, we included multiple regress ion
models of sap fl ow as I) a linear response to PAR, temperature, and VPD and as 2) a linear

response to the natural log of these variables. These allowed us to explore the effects of
including and excluding the interacting effects of PAR, temperature, and VPD on sap flow.
44
We then proceeded to fit models in R using least-squares methods for both the linear
models and for the nonlinear models, using R's 1m and nls functions ; nls uses the Gauss-Newton
algorithm to optimize parameters. All candidate models were fit independent ly for each species.
When the model optimization procedure failed for some of the nonlinear models, we rejected the
model as it was likely a poor model choice.
From the fitted models, we calculated the likelihood of the model given the data
assuming a nonna l error structure. We used this calculated likelihood and the number of fitted
model parameters (K) to obtain several test statistics: AIC, Akaike's infonnation criterion; AIC"
corrected AIC; t.;, AIC differences; W; , Akaike weights (Burnham and Anderson 2002). To
assess the goodness of fit for each model, we also calculated the slope of model predictions vs.
observed data and the If of the regression forced through the origin. For each spec ies, we used
the Akaike weights to assess the relat ive success of different models tested and ranked these in
order of decreasing W;, where the highest w; indicates the best of the candidate models.
Results
Correlating E"orm alld meteorological variables
Species differed with respect to magnitudes of whole-plant water use rates (shown in Chapter 2),
thus normalizing sap flow allowed us to compare sap flow patterns of multiple species. Species
varied in diurnal patterns of water use (Figure 3.1) with respect to both the timing of maximum
flow and the duration of high flow rates over the course of the day. In part icular, sap flow would
begin earlier in the morning and would reach maximum rates earlier and for longer periods of
time for trees than tree ferns. The detailed curves of Figure 3.1 indicate sap flow varies among
species, for instance, major sap flow increases and maxima occur at different times of day for
45 different species. The sap flow rates of all species increase strongly at sunrise with increased
PAR, temperature, and VPD, and decrease gradually in the afternoon. Smaller fluctuations in sap
flow over the course of the day do not clearly follow anyone single variable.
Normali zed sap flow (E...m) was strongly and positively correlated with all
meteorological variables for all species (Figure 3.2, all P-values<O.OO I). Across all species,
correlations were strongest between E"~ and VPD (Pearson correlation coemcient r ranged from
0.62-0.80) and E"o~ and temperature (r ranged from 0.61-0.79). E"ocm was also correlated with
PAR to a lesser degree, with r ranging from 0.52-0.65 . Between species, E,,~ of Fraxinus and
Cibotium were more strongly correlated with PAR, temperature, and VPD (r from 0.57-0.79 and
0.65-0.80 respectively). Eucalyp/us and Metrosideros exhibited slightly weaker correlations with
meteorological variables (r from 0.55-0.62 and 0.52-0.75).
The three measured meteorological variables were all highly inter-correlated, especially
temperature and VPD, where at Kahauloa, r=0.90 and at Honaunau, r= 0.93. PAR and
temperature are strongly correlated as were PAR and VPD (Kahau loa: r=0.71 and r=O.64;
Honaunau: r=0.68 and r=0.65). Thus simple correlations do not allow conclusions that anyone
variable is more important than others in determining the sap flow rate of different species since
increases in E"~ may be driven by increases in any of these three variables and thei r interacting
effects. •
Mot/el selection ant/filling
The models that best explained variation in sap flow for different species included all three
variables (PAR, temperature, and VPD) as well as all two-way interactions (Tab le 3.1,
Supplementary Table 3.SI). None of the single-variable models were in the top ten models for
any species. The best two-variable model s for Metrosideros and Cibotillm tended to include
temperature and vapor pressure deficit and not PAR. One of the top ten Eucalyptus models

46 included PAR and VPD only and not temperature. For Metrosideros and Cibotium, the best
supported model was a multiple linear regression model with all second-order interactions. For
Eucalyptus and Fraxinus, the top three models with strongest support were identical for both
species; these were multiple linear regression models describing sap now as a linear response of
additive and interacting log-transformed meteorological variables (Table 3.1). None of the
Jarvis-type multiplicative models tested worked as well as these multiple linear-regression
models that included interaction terms.
For Metrosideros, the best AIC-supported models had Akaike weights ofw,=0.63I and
w,=0.322 (see Table 3.1, models I and 2). These were both linear regressions including all main
effects of PAR, temperature, and VPD as well as the two-way interactions of all of these
(PAR:temperature, PAR:VPD, and temperature:VPD) and a third, three-way interaction term.
The second-best model was si milar in all aspects but did not include the three-way interaction.
Because its c.; is less than 2, and it has one less parameter than the "best" model, it is the more
parsimonious of the two and would be the preferred model. The most substantial and positive
coefficients for the top two models (I and 2) were associated with the VPD term and the
PARxTemperature interaction.
For Eucalyptus and Fraxinus, the best AIC-supported model (model 4 in Table 3.1) was a
linear regression of In-transformed variables and all their interactions. For Eucalyptus, w, =
0.977 and for Fraxinus , w, =0.999, indicating this particular model was clearly much bener than
any other candidate model tested for both species (listed in Supplementary Material, Table 3.S I).
For both Eucalyptus and Fraxinus, the interactions ofVPD with both PAR and temperature were
important and weighted positively.
Cibotium did not clearly fit to a single model; rather the top three models were weighted
similarly (w,=O.399, w,=0.399, w,=0.201) suggesting these three models are similarly supported,
and the most parsimonious model (models 2 or 3) should be chosen. Across all three Cibotillln

model s, the most substantial and positive coefficients were for PAR, VPD, and PARxVPD
interactions. The coe fficient for the temperature term in model 3 was also relat ively large.
47
The best-supported models for each species explained 40-65% of the variation in our data
(Figure 3.3). We found that 11' as an indicator of model goodness of fit was highest for Fraxinus
(R'=0.62) and Metrosideros (R'=0.62) and lowest for Eucalyptus and Cibotium (11' values of 0.44
and 0.43 respectively). Slopes for model-predicted En~ versus observed En."n (fixed through the
origin) ranged from 0.86 for Eucalyptus, 0.84 for Fraxinus and Cibotium, to 0.82 for
Melrosideros .
Discussion
Correlating £"0"" and meteorological variables
We found strong correlations of normalized sap flow with all meteorological variables, in
particular, VPD and temperature. This is reasonabl e because transpiration is controlled by plant
conductance and driven by atmospheric demand, characterized by VPD. VPD itself is calculated
from temperature and relative humidity, wh ich contributes to the intercorrelation of these two
variables.
Among the four study species, we observed Fraxinus and Cibotium were more strongly
correlated with all environmental variables, whereas Eucalyptus and Metrosideros were less
responsive to these changes. One possible explanation is that the Eucalyptus and Metrosideros
are larger and have higher capacitance; basal sap flow lags transpiration in these cases (Goldstein
et al. 1998) and could result in weaker correlations. Another possible explanation is that sap flow
of the more shallowly-rooted Fraxinus and Cibotiutn respond quickly to soil moisture deficits
caused by drying of the upper soil layers; the more deeply-rooted Myrtaceous Eucalyptus and
Metrosideros access deeper water supplies and sap flow responses wou ld be more gradual
(Crombie et al. 1988, Pataki et al. 2000, Oren and Pataki 200 I).

48 Model selection andJitting
Model-fitting yielded two major insights: interactions are important in explaining sap
flow as a response to meteorology and species do differ in their sap flow responses. We found
linear models that included interaction terms performed better than the Jarvis-type multiplicative
models established in the literature; this demonstrates the need to develop models accounting for
interactions as was suggested originally by Jarvis ( 1976). The observation that the best-fitting
models are not consistent across species provides support the argument that species differ in
whole-plant sap flow responses to environmental conditions.
The best supported models for our study species explained some, but not all , of the
variation in sap flow. One likely explanation for this is that we did not account for all important
variables influencing sap flow. Lumping normalized data from multiple individuals would have
added extra and unaccounted for variation to our datasets. In addition, we considered only PAR,
temperature and VPD in modeling sap flow, and it is possible that other variables including soil
moisture and wind speed are affecting sap flow rates. Bias in the modeled estimates (slopes of
predicted vs. observed sap flow < I) indicate that our models are underestimating sap flow,
primarily by failing to account for large high sap flow events Other studies using similar
regression approaches varied in model-fitting success. While our models account for
approximately half of the variation in our data, other studies using simi lar models have explained
as little as 22% for a particular species (Oren and Pataki 200 I) and as much as 82% (Ewers et al.
1999). The actual models used are not always consistent across studies, which make comparing
studies, models, and species difficult: is the poor model fit due to model choice, or are the trees
doing something different?
We observed that the best Ale-selected model was the same for Eucalyptus and
Fraxinus, but did not explain the Melrosideros or Cibot;um datasets well. Interestingly, the best
models for Metrosideros and Cibolium were nearly identical. While better replication is needed,

49 we specu late that these differences might be explained by factors including nativelnonnative
status, stand age, unaccounted for site differences. While the best EucalYPlIIslFraxinus model is
a function of the natural logs of the environmental variables, the best MetrosideroslCibotium
models are linear responses of the environmental variables. We speculate that low sap flow rates
for Melrosideros might mean sap flow rates do not saturate while those of the nonnative
Eucalyptus and Fraxinus trees, which have higher rates of sap flux density, do reach a maximum
at high PAR, temperature, and VPD.
Study limitationl' alit/future research neet/s
Settling on a simple but complete model of sap flow response to environment would
create a standard method for analyzing sap flow response to climate. The time series approach
advocated by Ford et al (2005) properly accounts for changing relationships of environmental
variables through time and provides an excellent starting point for this effort. Future work should
be focused on developing a simple and rapid assessment of sap flow data using time series and
potentially other types of models. This would facilitate comparison of sap flow models fit for
different species, sites, and changing conditions. A standard sap flow modeling method would
simplify the analysis and comparison of species' ecophysiological responses and may contribute
to better integration of ecophysiology and ecohydrology. The use of information theoretic
approaches and AIC in model selection is straightforward and promises to be useful in further
standardization of sap flow methods.
Acknowledgements
Mahalo nui to James Hardison, the Ho/Kagawa and FergerstTom 'ohana for logistical support
throughout the project; Travis Idol and Mike Parsons for equipment; Joanne Birch, Dana
Crompton, Michelle Elmore, Randy Moorman, Lara Reynolds, Alex Wegmann for assistance in

50 sensor-building; Sharon Ziegler-Chong, Michele Harman for assistance in the field;
Marguerite Butler, Alex Gottl ieb, and Molly Cavaleri for assistance in data analysis and helpful
discussion; Kamehameha Schools for access and logistical support. Funding was provided by
USGS contract #2004H1 57B to K. Duarte at the University of Hawai ' i Water Resources Research
Center, NSF grant IOS-0753233to L. Sack, Kamehameha Schools' ' Imi Na' auao and 'Aina Ulu
programs, Sigma Xi GIAR, the University of Hawai'i at Manoa Ecology, Evolution, and
Conservation Biology program, and the Kahuewai ala and Native Hawaiian Science and
Engineering Mentorship programs.
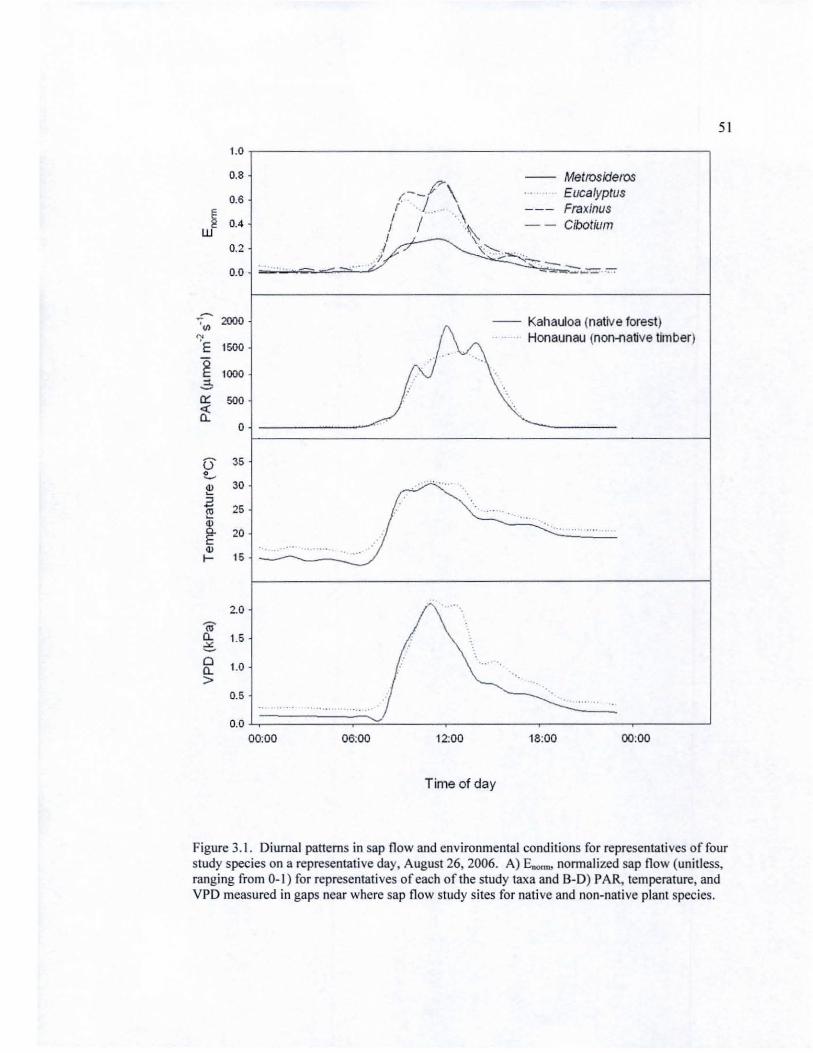
1.0
0.8
0.6
§ 0.4 LlJ
0.2
0.0
~
'Till 2000
<:' E 1500
~ 1000 .:; cr &
500
0
U 35 L-~ 30 ::J - 25 ro Q; Cl. 20 E Q)
I- 15
2.0
~ Q. e- 1.6
O 1.0 Q. >
0.5
0.0
........
....... ",
00:00 06:00
.. , ' .. ,-
Met/OSideros Eucalyptus Fraxinus Cibotium
-- Kahauloa (native forest) .... . Honaunau (non-flative tgober)
~ .. . .
-" -... .... ... .
.. ....
12:00 18:00 00:00
Time of day
51
Figure 3.1. Diurnal panems in sap flow and environmental conditions for representati ves of four study species on a representative day, August 26, 2006. A) E~, normalized sap flow (unitless, ranging from 0-1) for representatives or each of the study taxa and B-D) PAR, temperature, and VPD measured in gaps near where sap flow study sites for native and non-native plant species.

T emperature (~) VPO (kPa)
1.2 ,----------::-=-,----------::-=-,----------::-~ 1.0 r-0.52 r-O.73 r-O.75
~ " o 0.8 «. . • !," .. ,I ,'," ii 0.6 .L~ I -'-I .. ' " .. .'
'8 0.' Ii'> 'J':~' ~::>; .. ~ ~, r-:' ~ " ~~700 "" ...:: 0.2 1": 1/'-: .
0.0 ,.; .. ..
:' : '
,.:
~ , ' .. .:.
1.2 +----------:-:-::-1-- - ------ - -::-:,---+----- --- --:--,-,-1 r-0.55 1=0.62
1.0 . .. . ,)~ .... • :. I. <l ._
i:: " ;:::,;-; i iii - .:-"'~ • • • -_ l ' ::. 0.4 , .. :t~ . ..... ~ .... ' .. ,.
0. 2 _~ " • , ,
0.0
1 .2t-----------1----------~--------,---~ 1.0 r-O.65
0 .• g .~ O.G
~ 0.4 U.
0.2
0.0
1 . 2 t------------1----------~--------,---~
1.0 t .. :.: :;,79 ~.79 0.8 * . :" ~ ••
E '..::. '. il 0 .•
,2 0.' u
0.2
0.0
. '. . " , ' .. ,
o 500 1000 1500 2000 15 20 25 30 35 "0 0.5 1.0 1.5 2.0 2.5 3.0 3.5
Temperature rc) VPO (kPa)
52
Figure 3.2. Nonnali zed whole-plant sap now (E""",,, calculated as E,IE"",) for each of the four study taxa as a response to PAR, Temperature, and VPD. Pearson correlation coefficients I are provided for each relationship between E"""" and environmental variables, and all are significant at P<O.OOI.

53 Table 3. I. The best three models of sap flow vs. environmental variables for each species, selected using Akaike weights (WI) from a set of candidate models listed in Supplementary Material, Table 3.S I. These describe the response of normalized sap flow (E"o~, unitless) to photosynthetically ac tive radiation (PAR, Q, limol m-' 5 ' ), temperature (T, 0c), and vapor pressure deficit (VPD, D, kPa) and log transformations of these. Data were pooled for all individuals and only daytime values were used (observations falling between 0600 and 1800). The same suite of models was tested for each species; the relative quality of the model fit is indicated by the WI where val ues close to zero indicate a poor model and values close to I indicate an excellent fit. For the models selected, fined coefficient values are indicated as means ± standard error.

54
Model K In- R' Siopt
A IC~ d , Filttd modtl [(It fficiuts n liktlihood up/obs
w,
Melrosidero$ POlynw'1,11I1
8 + bQ+cT+ dD + eQT + fQD + gTD+ 1I=O.268:t; 0.099; b- 9.98:1: 2 82 x 10""; ( "'"- 1.58 ± a 65 xlo·l ; d=- I .12 ± 0 20;
( I) 720 9 204 0.520 0.817 -389 0 0.565 raS .OS ± I 46 :<10.5; (=-3.20 ± 3 87 x10 .... ; g=-2 27 ± 0.52 X 10.1; hQTD h=-2.08:1: I 13 xlOoS
(2) a + bQ+cT+ dD + eQT+ fQD + grD 720 8 202 0.518 0.816 -388 0.90 0.359 a=O.316 ± 0.096, IF-9.00 ± 2.80 x 10""'; (:.2.06 ± 0.60 X 10,1, da U8 ± 0 14; t=S.37 ± 1.46 x1O,S, (=-3 70 ± 0.94 x10""'; g=--2.96 ± 0.36 ,,10,1
(3) bQ + cT+dD +eQT+ fQD+ gTD+ 720 8 201 0516 0.81 5 -385 4.26 0.067
IF-S .S3 ± 2 37 :<10"; ("' 1.37 ± I 60 x 10'\ d=O.820 ± 0.168; t=-2 47 ± 1.11 x 100$; hQTD """7.54 ± 3.54 :<10 .... g=- 1.71 % 0.48 :<10,1; h=-2.88 ± 1.10 xlO's
Eucalyptus salilnll
(4) a + b InQ +c ["T + d I"D + e InQ I"T +
654 9 169 0434 0.857 -321 0 0970 8=7.26 ± 3.21 ; b=-1 .89 *- 0.60: c--2 .32 ± 0.99, d=.J.89 ± 1.08; t :.:::() 621 ± 0.184:
fln Q /IID + g/nTlnO +hlnQ lnT lnD 1=0.346' 0.200, , : 1 5S±0.3I, h~0. 176' 0.059
(5) a + b InQ+ c InT + d 1,,0 + e("Q (nT +
654 8 165 0.426 0.855 -314 6.9 0.030 . - 11.5' 2 9; 1><-2.58 '0.55, ,~3 62± 0.90, d~.802± 0 329; ~.829. 0 171 ;
f InQ 1110 + g ("T h,D t=-a.24 I .00.2; g=O.633 • 0.067
(6) a + b InQ + c InT+d /,,0+ f /nQ InD + 654 7 153 0 405 0.849 -292 28.1 -0 a"'-2.31 ± 0.52; 1Al.104 ± 0.01 1, c=().656 ± 0.161, d=-2.16 ± 0. 17~
g InT /,,0 r-0 .0467 • 0.0137; g:O.749. 0.064
FTlIXinur ulu/ei
(4) a + b IIfQ + c InT + d InO + e InQ lifT + 232 9 11 60 0.623 0.844 -2300 0 - I
111=-2.17 :1: 1.34; b~.082 ± 0.243; c=O.659 ± 00413; d=-3.70 ± 0.46; c=O.045 ± flnQ/nD + g/nT lnO + h/,rQJnTlnO 0 0.075, fo() 305 • 0.083; g~J.30' 0 13; h~. 118 ' 0.024
(5) ill + b InQ+c Inr + d 1,,0 + clnQ InT + 232 8 11 50 0619 0.842 -2280 22 .9 -0
a:::: I .4J :i: 1.13, b=-0.676 ± 0.213: c=-O 442 ± 0 35 1; d::.. I .52:i: 0.1 3; c=O.226 %
f InQ 1,,0 + g 'nT 'nO 0 0.066; 1~.099' 0.017; g=O.667± 0.027
(6) a + b InQ+ c InT + d InO + flnQ InO + 232 7 1140 0.617 0.84 1 -2270 32.7 -0
.~2. 39 • 0.22; b:Q.0549' 0 0045; , =0.738 ' 0.068, d~ 1.89 .007, glnTlnD 0 t=-a.0426 ' 0,0055; g:O.692' 0.026
Cibotium spp.
a + bQ +cT+dD + eQT+ fQD+ gTD+ 147 1I:.{). 11 5 ± 0.081 ; b::::1 2.4 :1:: 1.8 x 10"'; (=0.926 ± 0.419 xlO'!; d:zO.443 ± 0 116;
( I) 9 827.181 0.46 1 0.846 -1640 0 0399 r=-6.54:1:: 0.94 xIO·i ; (::1.15 % 2 18 xlO"'; g=-8A2 :i: 2.99 xIO..); hQTD 8 h=- I 1.3 ±6 I xlO'"
(3) bQ + cT+ dD + eQT+ fQD+ gTD + 147
8 826 168 0460 0.846 -1640 -0 0.399 b::::1 08 % 0.14 xIO'}; c-2.61 :.t: 1.04 X 10'3, d=-O.523 ± a 10 I ; ~--5 .64:.t: 0.69 x 10.5;
hQTD 8 f=6.03 :I: 2.04 xIO"'; g::::-9.59 ± 2 88 xlO'); b=-9.58:1: 6.02 x 10""'
(2) a + bQ+ cT+ dO + cQT+ fQD + gTD 147 8 825.483 0460 0.846 -1630 137 0.20 1
a.z..() 085 ± 0 079. b=1 2S ± 0 18 x10·1, (=6.32:t: 4 52 xIO'), d=O 595 :t: 0.08 I. 8 c="'6.2 I :.t: 0 92 xIO-s: f.-3 27:.t: 0.58 x 10 .... 2'"'-1 25 :t: 0.20 X 10.2

Figure 3.3. Plots of predicted values vs. observed for the Ale-best model for each species, fitted using E"",m as a response to PAR, temperature, and VPD. See Table 3.1. for the species ' models and fitted coefficients.
1.0 ,------------.-------::-------;1l Eucalyptus, ~=O.44 Metrosideros. ~=O.53 ..
0.5
• • 0.0f----~-----~~---~-----~
Fraxinus. ~=O.62
0.5
0.0 0.0
• .•.• ... ~ .. r.:~·
0.5 0.0 0.5
Observed
• ••
1.0
55
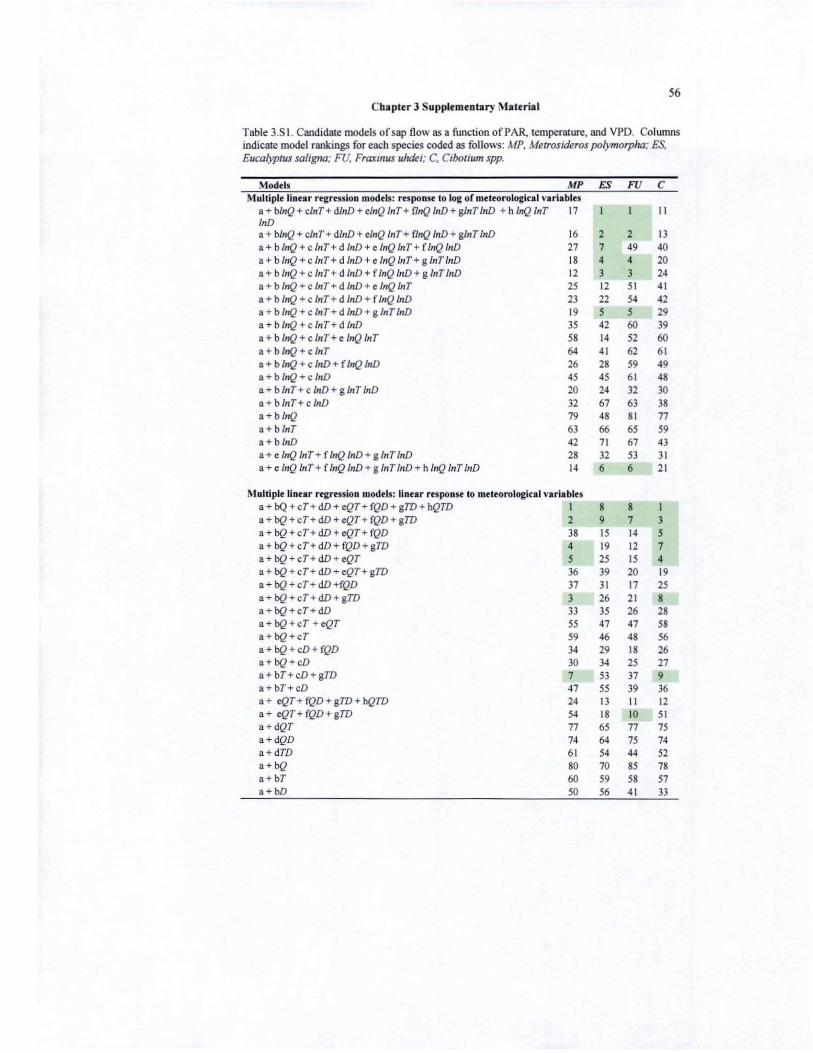
56 Chlptcr 3 Supplementary Material
Table 3.S I. Candidate models of sap flow as a function of PAR, temperature, and VPD. Columns indicate model rankings for each species coded as CoHows: MP. Metrosideros polymorpha; ES. Eucalyptus saligna; FU. Fraxmus uMe;; C. Cibolium spp.
Modtls AlP ES FU C Multiple linear regrrssioD mooels: responJlt to log of meteorological variables
a+ b/nQ+ cJnT+dlnD + t/nQ I"T+ flnQ tnD + glnTlnD + h InQ tnr 11 11 fnD a + b/nQ + tinT + d/nD + tlnQ tnT + flnQ lnD + glnT InD 16 2 2 13 a + b InQ + c I"T+ d hlD+e InQ InT + f/nQ InD 27 7 49 40 a + b InQ + c InT+ d InD + e InQ InT + g tnTlnD 18 4 4 20 a + b /"Q +c InT + d InD + flnQ InD+ g InT InD 12 3 3 24 a + b InQ + c InT + d InD + e InQlnT 25 12 51 41 a + b InQ + c I"T+ d InD + flnQ fnD 23 22 54 42 a + b InQ + c/nT+ d InD+ g InT [riD 19 5 5 29 a + b lnQ + c I"T+ d fnD 35 42 60 39 a + b InQ + clnT+ e InQ InT 58 14 52 60 a+b /nQ+cJnT 64 41 62 61 a + b/nQ + c InD+ flnQ InD 26 28 59 49 a+blnQ + cJnD 45 45 61 48 a + blnT+ c InD + g/nT InD 20 24 32 30 a+b/nT+clnD 32 67 63 38 a+blnQ 79 48 81 77 a + b/nT 63 66 65 59 a+b/nD 42 71 67 43 a + e/nQ InT + f InQ InD + g/nTlnD 28 32 53 31 a + e InQ InT+ f InQ InD+ g /nTlnD+ h hrQ InT InD 14 6 6 21
Multiple linur ngressioD models: linur response to meteorological va ri.Mbles a + bQ +cT+ dD + eQT+ fQD + gTD + hQTD 1 8 8 a + bQ+cT+dD + eQT+ fQD+ gTD 2 9 7 3 a + bQ +cT+ dD + eQT+ fQD 38 15 14 5 a + bQ +cT+ dD + fQD + gTD 4 19 12 7 a+bQ+cT+dD + eQT 5 25 15 4 a + bQ + cT+dD+ eQT+ gTD J6 39 20 19 a + bQ + cT + dD +fQD 37 31 17 25 a+bQ+cT+dD+gTD 3 26 21 8 a+bQ+cT+dD 33 35 26 28 a+bQ+cT + eQT 55 47 47 58 a+bQ+cT 59 46 48 56 a+bQ + cD+fQD 34 29 18 26 a+bQ+cD 30 34 25 27 a+bT+cD + gTD 7 53 37 9 a+bT+cD 47 55 39 36 a + eQT +fQD + gTD + hQTD 24 13 11 12 a + eQT+fQD+ gTD 54 18 10 51 a +dQT 77 65 77 75 a+dQD 74 64 75 74 a+ dTD 61 54 44 52 a+bQ 80 70 85 78 a+bT 60 59 58 57 a+bD 50 56 41 JJ

57
Models (COliI'd) MP ES FU C Multiple lintar rtgrusion modds: linen response to vari.bles, intercept rucd at 0
bQ+cT+dD+eQT+ fQD+ gTD+ hQTD 8 21 9 2 bQ+cT+ dD 31 40 24 32 bQ+cT + eQT 62 43 66 67 bQ+cT 71 44 74 73 bQ+dD +tQD 49 76 19 53 bQ+dD 53 81 30 66 cT+ dDt gTD 6 51 38 10 cT+ dD 46 52 40 37 eQT+ cQD+ gTD 65 80 1J 71 eQT 86 86 87 85 fQD 88 87 89 87 gTD 76 83 64 80 bQ 87 84 88 86 dD 66 82 50 72
Nonlinu.1'" muJliplintive power models a+bIJ'7'ff • 31 • a+bIJ'7' 16 28 • a + bIJ' ff 15 30 34 18 a+b7' ff 10 • • + bIJ' 78 79 76 blJ'7' 57 17 27 55 blJ'ff 13 33 29 16 b7'ff 9 • 35 6 bff 29 62 45 IS bIJ'+ eff 21 10 16 17
Lintlr models with SI p flow as • response to inverse of mtltOrologita l vlriables a+bgL+cTL+dUl 68 23 69 65 a + bQ"] +cT I 67 63 71 63 a+bgl +dD-1 7J 73 76 70 a+crl + dD-1 70 50 70 64 II + b(!1 83 69 86 81 a+cT I 69 74 72 62 8+dD"L 72 79 83 69
No.liour models: Sltursting rupolUU Ind tombiuatioDS ortbest QI(a+QXI-dD} 84 75 78 83 Q/(b+QXd+e InD} 41 38 57 46 QI(a+QXd+e InD} 39 36 55 47 aQ 1(b+QX 1-dD} 44 I I 23 22 aQ 1(b+Q}l1' 22 27 33 14 (aQ+ dQ InDY (b+Q) 40 J7 56 45 a ( l-e~"l'(l -dD) 48 20 22 23 bQ l (d+Q) 81 49 80 79 a( l-e~"l 82 60 82 82 a· ebfT 56 61 36 54 a-bD 52 58 43 35 aDl (b'1 I I 78 46 50 e'" 91 89 92 90 bD-1 90 88 91 89 bD.{l.j 89 85 90 88 (a-bDr' 75 68 73 68 QI(a +Q) 85 77 84 84 a+b/nD 43 72 68 44 a+ bDtcIY 51 57 42 34

58
CHAPTER 4
Conclusion
We found species varied s ignificantly in rates of water use, even under different scaling
scenarios. Species also varied in temporal patterns of water use , suggesting contrasting water use
dynamics among the study species: ranging from high rates of water use over short periods by
Fraxinus and Cibolium versus conservative water use by Melrosideros . When these species rates
were combined with structural variation of stands dominated by the three study tree species, we
found slands varied in estimated daily water use with Fraxinlls, a deciduous species, used the
most water as both a species and as a plantation stand. Native Metrosideros~dominatcd stands
used less water, and we found most of this was contributed by the dominant understory tree ferns
rather than the overstory tree species. These tree ferns play an important hydrological as well as
ecological role deserving furt her investigation. When I analyzed relationships of sap flow with
environmental variables PAR, temperature, and VPD, I found species differences suggesting a
weaker relationship between sap fl ow and atmospheric conditions in the Myrtaceous species and
a possible influence of stem water storage. No one empirical model best explained all species '
relationships between sap flow and environmental variables. Overall, however, the best fitted
models included interaction effects not accounted for in traditionally-used Jarvis multiplicative
models, suggesting the need for further modeling method development. I propose alternative
models be assessed and compared using information criteria, which are relatively easy to
calculate and assess for inference.
These observations can be applied for forestry management purposes: the species
differences shown here indicate certain species such as Fraxinu.s consume much more water
during the summer wet season and annually (by our estimation) when compared to Metrosideros.

59 We can compare rates of Fraxinus uptake from our sites to Fraxinus rates at other sites and
times to see how fixed or variable these rates are. From our stand water use scaling exercise, we
see that if managing tree water use is a primary objective, stands of the species with high water
use must be actively thinned and stand sapwood area controlled. Our observations that native
stands use less water than stands of Fraxinus support conservation of existing native forest for
hydrologic benefit. We did not expect to find the observed strong variation between stand water
use of non-native timber species Fraxinus and Eucalyptus, but from the similarities in water use
between the native and non-native Myrtaccac, we can conclude native/non-native status is not
necessarily an indicator of lowlhigh water use at whole plant and stand-level. Instead, species
water use should be considered on a case-by-case basis as non-native timber species and stands of
these can vary in their hydrological impacts. Forestry operations in Hawaii and beyond should
consider the hydrologic impacts of species selection and long-term management practices as
some non-native timber species will have fewer hydrological impacts than others. We note that
ecological benefits (not studied here) should also be considered since planting native trees clearly
also contribute to habitat preservation, ecosystem processes, and biodiversity.
We note that our study assessed only plant water use , or transpiration, and did not
consider the other effects of vegetation on the terrestrial water balance. This leads to interesting
future research: What water use differences among species and stands mean for groundwater
recharge? Our observations can be interpreted in several ways: assuming precipitation is equal
and canopy interception is eq ual, higher water use in Fraxinus vs. Melrosideros stands should
result in higher groundwater recharge rates under Metrosideros cover
(Precipitation=lnterception+ Transpiration+Recharge, T,+R, =T,+R,). However, if interception in
difTerent stands under the same environmental conditions is nol equal, transpiration as well as
recharge may be affected. Canopy interception is a critical piece of the puzzle that should be
measured and considered in future comparative ecohydrological studies.

60 Modeling efforts and new computational tools will enable more careful analysis of
large sap flow datasets. Inference made by comparing different models of sap flow and
physiological regul ation of water use provides a way to assess transpirat ion in a more
ecologically-relevant way. By building a standard methodology for analyzing these large sap
flow datasets, we can better integrate plant physiology, eco logy, and hydrology. Generating
species-specific coefficients for a single model can enable more explicit mapping of vegetation
water use for watershed models, and along with climate data, can facili tate modeling of plant
water interactions in an ecological context. Integration wi th the powerful tools of remote sensing
and eddy covariance provide a way to scale and validate sap fl ow estimates.
In genera l, the field of ecohydrology is rapidly advancing, and understanding when and
how species differ can help bridge the gap between physiologists studying species traits and
responses, ecologists studying patterns and interactions in space and time, and hydrologists
assessing physical fluxes of water. Characterizing these dynamics is central to bridging the
sciences of ecology and water resource management. Know ledge of the degree to which species
differ in water use can be applied immediately in more informed forest and land management and
the development of spatially explicit models of species and stand water use. Further research is
necessary for understanding the other ways in which plants alter the local water balance through
interception, infiltration, and so il water storage . These factors also affect ecology and dynamics
of the landscape over a range of times cales. Understanding species and stand water use is thus
also critical for anticipating the effects of global climate change as mediated through local
hydrology.

61 REFERENCES
Arcand, N ., A. Kagawa, L. Sack, and T. Giambelluca. in press. Scaling of frond form in Hawai'i tree fern Cibotium glaucum: compliance with global trends, and application for field estimation. Biotropica.
Baird, A. J. and R. L. Wilby, editors. 1999. Eco-Hydro logy: plants and water in terrestrial and aquatic environments. Routledge, London.
Baker, J. M. and C. H. M. van Bavel. 1987. Measurement of mass flow of water in stems of herbaceous plants. Plant, Cell and Environment 10:777-782.
Barbour, M. M., J. E. Hunt, A. S. Walcroft, G. N. D. Rogers, T. M. McSeveny, and D. Whitehead. 2005 . Components of ecosystem evaporation in a temperate coniferous rainforest , with canopy transpiration scaled using sapwood density. New Phytologist 165:549-558.
Barrett, D. J. , T. J. Hatton, J. E. Ash, and M. C. Ball. 1996. Transpiration by trees from contrasting forest types. Australian Journal Of Botany 44 :249-263.
Baruch, Z. and G. Goldstein. 1999. Leaf construction cost, nutrient concentration, and net C02 ass imilation of native and invasive species in Hawai i. Oecologia 121 : I 83- 192.
Baruch, Z., R. R. Pattison, and G. Goldstein. 2000. Responses to light and water availability of fo ur invasive Melastomataceae in the Hawaiian Islands. International Journal of Plant Science 161: 107-118.
Baskerville, G. L. 1972. Use of logarithmic regression in the estimation of plant biomass. Canadian lournal of Forest Research 2:49-53.
Benyon, R. G. 1999. Nighttime water use in an irrigated Eucalyptus grandis plantalion. Tree Physiology 19:853-859.
Black, T . A., F. M. Kelliher, J. S. Wallace, J. B. Stewart, J. L. Monteith, and P. G. larvis. 1989. Processes Controlling Understorey Evapotranspiration [and Discussion]. Philosophical Transact ions of the Royal Society of London. Series B, Biological Sciences 324:207.
Blukacz, E. A., W. G. Sprules, and J. Brunner. 2005. Use of the bootstrap for error propagation in estimating zooplankton production. Ecology 86:2223-2231.

62 Bosch, J. M. and J. D. Hewlen. 1982. A review of catchment experiments to determine the
effect of vegetation changes on water yield and evapotranspiration. Journal of Hydrology 55:3-23.
Brauman, K. A., G. C. Dai ly, T. K. Duarte, and H. A. Mooney. 2007. The nature and value of ecosystem services: An overview high lighting hydrologic services. Annual Review Of Environment And Resources 32:67-98.
Bucci, S. J., F. G. Scholz, G. Goldstein, F. C. Meinzer, J. A. Hinojosa, W. A. Hoffmann, and A. C. Franco. 2004. Processes preventing nocturnal equilibration between leaf and soil water potential in tropical savanna woody species. Tree Physiology 24: 1119-1127.
Buck, A. L. 1981. New equations for computing vapor pressure and enhancement factor. Journal of Applied Meteorology 20: 1527-1 532.
Burnham, K. P. and D. R. Anderson. 2002. Model selection and multimodel inference: A practical information-theoretic approach. 2'· edition. Springer, New York.
Caird, M. A., J. H. Richards, and L. A. Donovan. 2007. Nighn ime stomatal conductance and transpiration in C-3 and C-4 plants. Pl ant Physiology 143:4- 10.
Calder, I. and P. Dye. 200 1. Hydrological impacts of invasive alien plants. Land Use and Water Resources Research 1:8.1-8.12.
Carlson, N. K. and L. W. Bryan. 1959. Hawaiian timber for the coming generations. Trustees of the Bernice P. Bishop Estate
Carlson, N. K. and L. W. Bryan. 1963. The Honaunau Forest: An appraisal after seven years of planting. Journal of Forestry 61:643-647.
Cavender-Bares, J., L. Sack, and J. Savage. 2007. Atmospheric and soil drought reduce nocturnal conductance in live oaks. Tree Physiology 27:611-620 .
Cayrol, P., A. Chehbouni, L. Kergoat, G. Dedieu, P. Mordelet, and Y. Nouvell on. 2000. Grassland modeling and monitoring with SPOT-4 VEGETATION instrument during the 1997-1 999 SALSA experiment. Agricultural and Forest Meteorology 105:9 1- 115.
Cleverly, J. R. , S. D. Smith, A. Sal a, and D. A. Devin. 1997. Invasive capacity of Tamarb: ramosissima in a Mojave Desert noodplain : the role of drought. Oecologia I II : 12-18.

Cordell , S., R. J. Cabin, and L. J. Hadway. 2002. Physiological ecology of native and alien dry forest shrubs in Hawaii. Biological Invasions 4:387-396.
63
Crombie, D. S., J. T. T ippett, and T. C. Hill. 1988. Dawn water potential and root depth of trees and understorey species in southwestern Australia. Australian Journal Of Botany 36:621-63 1.
Daehler, C. C. 2003. Performance comparisons of co-occurring native and alien invasive plants: Implications for conservation and restoration. Annual Review Of Ecology Evolution And Systematics 34: 183-211.
Dawson, T. E., S. S. O. Burgess, K. P. Tu, R. S. Oliveira, L. S. Santiago, J. B. Fisher, K. A. Simonin, and A. R. Ambrose. 2007. Nighttime transpiration in woody plants from contrasting ecosystems. Tree Physiology 27:561-575.
DeFries, R. S., J. A. Foley, and G. P. Asner. 2004. Land-Use Choices: Balancing Human Needs and Ecosystem Function. Frontiers in Ecology and the Environment 2:249.
Delzon, S. and D. Loustau. 2005. Age-related decline in stand water use: sap flow and tTanspiration in a pine forest chronosequence. Agricultural and Forest Meteorology 129:105- 11 9.
Drake, D. R. and D. Mueller-Dombois. 1993. Population development of rain forest trees on a chronosequence of Hawaiian lava flows. Ecology 74:1012-1019.
Durand, L. Z. and G. Goldstein . 200 I. Photosynthesis, photoinhibition, and nitrogen use efficiency in native and invasive tree ferns in Hawaii. Oecologia 126:345-354.
Eagleson, P. S. 2002. Ecohydrology: DaTWinian expression of vegetation form and function. 1st edi tion. Cambridge University Press, Cambridge.
Eamus, D., T. Hatton, P. Cook, and C. Colvin. 2006. Ecohydrology: vegetation function, water and resource management. CSIRO Publishing.
Efron, B. and R. J. Tibshirani. 1993. An introduction to the bootstrap. I" edition. Chapman & Hall, New York.
Ekern, P. C. 1970. Consumptive use of water by sugarcane in Hawaii, Technical Repon No. 37. Water Resources Research Center, University of Hawaii.

64 Ewers, B. E., S. T. Gower, B. Bond-Lamberty, and C. K. Wang. 2005. Effects of stand age and
tree species on canopy transpiration and average stomatal conductance of boreal forests . Plant Cell And Environment 28:660-678.
Ewers, B. E., R. Oren, T. J. Albaugh, and P. M. Dougherty. 1999. Carry-over effects of water and nutrient supply on water use of Pinus taeda. Ecological Applications 9:513-525.
Farley, K. A., E. G. Jobbagy, and R. B. Jackson. 2005. Effects of afforestation on water yield: a global synthesis with implications for policy. Global Change Biology II: 1565-1576.
Feild, T . S. and N. M. Holbrook. 2000. Xylem sap flow and stem hydraulics of the vesselless angiosperm Drimys granadensis (W interaceae) in a Costa Rican elfin forest. Plant Cell And Environment 23:1067-1077.
Foley, J. A., R. DeFries, G. P. Asner, C. Barford, G. Bonan, S. R. Carpenter, F. S. Chapin, M. T. Coe, G. C. Daily, H. K. Gibbs, J. H. Helkowski, T. Holloway, E. A. Howard, C. J. Kucharik, C. Monfreda, J. A. Patz, I. C. Prentice, N. Ramankutty, and P. K. Snyder. 2005. Global consequences ofland use. Science 309:570-574.
Ford, C. R. , C. E. Goranson, R. J. Mitchell, R. E. Will , and R. O. Teskey. 2005. Modeling canopy transpiration using time series analysis: A case study illustrating the effect of soil moisture deficit on Pinus taeda. Agricultural and Forest Meteorology 130: 163-175.
Fry, B., G. R. , K. Thoulke, C. Neill , R. H. Michner, F. J. Mersch, and W. Brand. 1996. Cryoflow: cryofocusing nanomole amounts of CO" N, and SO" fTom an elemental analyzer for stable isotopic analysis. Rapid Communications in Mass Spectrometry 10:953-958.
Funk, J. and P. M. Vitousek. 2007. Resource-use efficiency and plant invasion in low-resource systems. Nature 446: I 079-1 081.
Gansert, D. 2003. Xylem sap flow as a major pathway for oxygen supply to the sapwood of birch (Betula pubescens Ehr.). Plant Cell And Environment 26: 1803- 1814.
Giambelluca, T. W. and L. Cuo. in prep. Hawaii digital climate map system.
Glenn, E. P., R. Tanner, S. Mendez, T. Kehret, D. Moore, J. Garcia, and C. Valdes. 1998. Growth rates, salt tolerance and water use characteristics of native and invasive riparian plants from the delta of the Colorado River, Mexico. Journal of Arid Environments 40:281-294.

Goldstein, G., J. L. Andrade, F. C. Meinzer, N. M. Holbrook, J. Cavelier, P. Jackson, and A. Celis. 1998. Stem water storage and diurnal patterns of water use in tropical forest canopy trees. Plant Cell And Environment 21 :397-406.
Granier, A. 1985. Une nouvelle methode pour la mesure du nux de seve brute dans Ie tronc des arbres. Ann. Sci. for. 42 : 193-200.
6S
Granier, A., D. Loustau, and N. J. J. Breda. 2000. A generic model of forest canopy conductance dependent on climate, soil water availability and leaf area index. Ann. For. Sci. 57:755-765.
Hatton, T ., P. Reece, P. Taylor, and K. McEwan. 1998. Does leafwater efficiency vary among eucalypts in water-limited environments? Tree Physiology 18:529-536.
Hatton, T. J., E. A. Catchpole, and R. A. Vertessy. 1990. Integration of sap now velocity to estimate plant water-use. Tree Physiology 6:201-209.
Hollinger, D. Y. 1987. Photosynthesis and stomatal conductance patterns of2 fern species from different forest understoreys. Journal Of Ecology 75:925-935 .
Huxman, T. E., B. P. Wilcox, D. D. Breshears, R. L. Scott, K. A. Snyder, E. E. Small, K. Hultine, W. T. Pockman, and R. B. Jackson. 2005. Ecohydrological implications of woody plant encroachment. Ecology 86:308-319.
Jackson, R. B., E. G. Jobbagy, R. Avissar, S. B. Roy, D. J. Barrett, C. W. Cook, K. A. Farley, D. C. Ie Maitre, B. A. McCarl, and B. C. Murray. 2005 . Trading water for carbon with biological sequestration. Science 310: 1944- I 947.
James, S. A., M. Clearwater, F. C. Meinzer, and G. Goldstein. 2002. Heat diss ipation sensors of variable length for the measurement of sap now in trees with deep sapwood. Tree Physiology 22:277-283.
Jarvis, P. G. 1976. The interpretation of the variation in leaf water potential and stomatal conductance found in canopies in the field. Philosophical Transactions of the Royal Society of London. Series B, Biological Sciences 273:593-6 10.
Kelliher, F. M., B. M. M. Kostner, D. Y. Hollinger, J. N. Byers, J. E. Hunt, T. M. McSeveny, R. Meserth, P. L. Weir, and E. D. Schulze. 1992. Evaporation, xylem sap now, and tree transpiration in a New-Zealand broad-leaved forest. Agricultural and Forest Meteorology 62:53-73 .

King, D. A. 1997. The funct ional significance of leaf angle in Eucalyptus. Australian Journal Of Botany 45:6 19-639.
66
Kostner, B. 200 I . Evaporation and transpiration from fores ts in Central Europe re levance of patch-level studies for spatial scaling. Meteorology and Atmospheric Physics 76:69-82.
Larcher, W. 2003. Physiological plant ecology: Ecophysiology and stress phys iology of functional groups. 4th edition. Springer, Berlin.
Le Maitre, D. C., B. W. Van Wilgen, R. A. Chapman, and D. H. McKelly. 1996. Invasive plants and water resources in the Western Cape Province, South Africa: modelli ng the consequences of a lack of management. Journal of Applied Ecology 33: 16 1- 172.
Lockwood, J. P. 1995. Mauna Loa eruptive history - the preliminary radiocarbon record. Pages 81-94 in J. M. Rhodes and J. P. Lockwood, editors. Mauna Loa revealed: structure, composition, history and hazards. American Geophysical Union, Washington, DC.
Lu, P., L. Urban, and P. Zhao. 2004. Granier's thermal dissipation probe (TDP) method for measuring sap now in trees: theory and practice. Acta Botanica Sinica 46:63 1-646.
Marks, C. O. and M. J. Lechowicz. 2007. The ecological and functiona l correlates of nocturnal transpiration. Tree Physio logy 27:577-584.
McCulloh, K. A., K. Wi nter, F. C. Meinzer, M. Garcia, J. Aranda, and B. Lachenbruch. 2007. A comparison of da ily water use est imates deri ved from constant-heat sap-now probe values and gravimetric measurements in pot-grown sapli ngs. Tree Physiology 27: 1355-1360.
Me inzer, F. C., G. Go ldstein, A. C. Franco, M. Bustamante, E. Igler, P. Jackson, L. Caldas, and P. W. Runde!. 1999. Atmospheric and hydraulic limitations on transpirat ion in Brazil ian cerrado woody species. Functional Ecology 13:273-282.
Meinzer, F. C., G. Goldstein, N. M. Holbrook, P. Jackson, and J. Cavelier. 1993. Stomatal and environmental control of transpirat ion in a lowland tropical forest. Plant Cell And Environment 16:429-436.
Millennium Ecosystem Assessment. 2005. Ecosystems and human well-being: Current state and trends. Island Press.

67 Miller, R. 0 . 1998. High Temperature Oxidation: Dry Ashing. Pages 53-56 in Y. P. Kalra,
editor. Handbook of Reference Methods for Plant Analysis. CRC Press, Boca Raton, FL.
Moore, G. W., B. J. Bond, J. A. Jones, N. Phillips, and F. C. Meinzer. 2004. Structural and compositional controls on transpiration in 40-and 450-year-old riparian forests in western Oregon, USA. Tree Physiology 24:481-491.
Nagler, P. L., E. P. Glenn, and T. L. Thompson. 2003. Comparison of transpiration rates among saltcedar, cottonwood and willow trees by sap flow and canopy temperature methods. Agricultural and Forest Meteorology 116:73-89.
Niemeyer, P. 2006. Honaunau soil survey, personal communication, 8 June 2006.
Niklas, K. J. 2006. Plant allometry, leaf nitrogen and phosphorus stoichiometry, and interspecific trends in annual growth rates. Annals Of Botany 97: 155-163 .
Oren, R. and D. E. Pataki . 200 I. Transpiration in response to variation in microclimate and soil moisture in southeastern deciduous forests. Oecologia 127:549-559.
Oren, R., N. Phillips, B. E. Ewers, D. E. Pataki, and J. P. Megonigal. 1999a. Sap-flux-scaled transpiration responses to light, vapor pressure deficit, and leaf area reduction in a flooded Taxodium dislichum fores!. Tree Physiology 19:337-347.
Oren, R., N. Phillips, G. Katul , B. E. Ewers, and D. E. Pataki . 1998. Scal ing xylem sap flux and soil water balance and calculating variance: a method for partitioning water flux in forests. Annales Des Sciences Forestieres 55: 191-216.
Oren, R., J. S. Sperry, B. E. Ewers, D. E. Pataki , N. Phillips, and J. P. Megonigal. 2001. Sensitivity of mean canopy stomatal conductance to vapor pressure deficit in a flooded Taxodium dislichum L. forest: hydraulic and non-hydraulic effects. Oecologia 126:21-29.
Oren, R., J. S. Sperry, G. G. Katul , D. E. Pataki, B. E. Ewers, N. Phillips, and K. V. R. Schafer. I 999b. Survey and sythesis of intra- and interspecific variation in stomatal sensitivity to vapour pressure deficit. Plant, Cell and Environment 22: 1515-1526.
Palmer, D. D. 2002. Hawaii's ferns and fern allies. University of Hawaii Press, Honolulu.
Pataki, D. E. and R. Oren. 2003 . Species differences in stomatal control o f water loss at the canopy scale in a mature bottomland deciduous forest. Advances in Water Resources 26: 1267-1278.
Pataki, D. E., R. Oren, and W. K. Smith. 2000. Sap flux of co-occurring species in a western subalpine forest during seasonal soil drought. Ecology 81 :2557-2566.
68
Pattison, R. R., G. Goldste in, and A. Ares. 1998. Growth, biomass allocation and photosynthes is of invasive and native Hawaiian rainforest species. Oecologia 117:449-459.
Phillips, N. and R. Oren. 200 1. Intra- and inter-annual variation in transpi ration ofa pine forest. Ecological Applications II :385-396.
Poorter, L. and F. Bongers. 2006. Leaf traits are good predictors of plant performance across 53 rain forest species Ecology 87: 1733- 1743.
Porder, 5 ., A. Pay tan, and P. M. Vitousek. 2005. Erosion and landscape development affect plant nutrient status in the Hawaiian Islands. Oecologia 142:440-449.
R Development Core Team. 2008 . R: A language and environment for statistical computing. 2.6.2 ed ition, Vienna, Austria.
Restom Gaskill , T. G. 2004. Hydrology of forest ecosystems in the Honouliuli Preserve: implications for groundwater recharge and watershed restoration. PhD di ssertation . University of Hawaii at Manoa, Honolulu.
Richardson, D. M. 1998. Forestry trees as invasive aliens . Conservation Biology 12: 18-26.
Roberts, J. 2000. The influence of physical and physiological characteristics of vegetation on their hydrological response. Hydrological Processes 14:2885-290 I.
Roberts, J., C. F. Pymar, J. S. Wallace, and R. M. Pitman. 1980. Seasonal changes in leaf area, stomatal and canopy conductances and transpirat ion from bracken below a forest canopy. The Journal of Applied Ecology 17:409.
Roberts, S., R. A. Vcrtessy, and R. Grayson. 200 1. Transpiration from Eucalyptus sieberi (L. Johnson) forests of ditTerent age. Forest Ecology and Management 143: 153-16 1.
Rodriguez-Ilurbe, I. and A. Porporato. 2004. Ecohydrology of water-controlled ecosystems: soil moisture and plant dynamics . Cambridge University Press, Cambridge.

Sack, L., P. D. Cowan, N. Jaikumar, and N. M. Holbrook. 2003. The 'hydrology' ofleaves: coordination of structure and funct ion in temperate woody species. Plant Cell And Environment 26: 1343-1356.
69
Sakuratani, T. 1981. A heat balance method for measuring water flux in the stem of intact plants. Journal of Agricultural Meteorology 37:9-17.
Sala, A., S. D. Smith, and D. A. Devitt. 1996. Water use by Tamarix ramosissima and associated phreatophytes in a Mojave Desert floodplain . Ecological Applications 6:888-898.
Santiago, L. S., G. Goldstein, F. C. Meinzer, J. H. Fownes, and D. Mueller-Dombois. 2000. Transpiration and forest structure in relat ion to soil waterlogging in a Hawaiian montane cloud forest. Tree Physiology 20:673-681 .
Scholz, F. G., S. J. Bucci, G. Goldstein, F. C. Meinzer, A. C. Franco, and F. Miralles-Wilhelm. 2007. Removal of nutrient limitations by long-term fertilization decreases nocturnal water loss in savanna trees. Tree Physiology 27:551-559.
Sellers, P. J., R. E. Dickinson, D. A. Randall , A. K. Betts, F. G. Hall , J. A. Berry, G. J. Collatz, A. S. Denning, H. A. Mooney, C. A. Nobre, N. Sato, C. B. Field, and A. Henderson-Sellers. 1997. Modeling the exchanges of energy, water, and carbon between continents and the atmosphere. Science 275:502-509.
Smith, A. R., K. M. Pryer, E. Schuettpelz, P. Korall , H. Schneider, and P. C. Wolf. 2006. A classification for extant ferns . Taxon 55:705-731 .
Soil Survey Staff, N. R. C. S., United States Department of Agriculture. http://soi ldatamart.nrcs.usda.gov.Soil Survey Geographic (SSURGO) Database for Is land of Hawaii, Hawaii. Accessed 27 January 2008.
Spicer, R. and N. M. Holbrook. 2005. Within-stem oxygen concentration and sap flow in four temperate tree species: does long-lived xylem parenchyma experience hypoxia? Plant, Cell and Environment 28: 192-20 I.
Sprugel, D. G. 1983. Correcting for bias in log-transformed allometric equations. Ecology 64:209-210 .
Stratton, E. C. 1998. Ecophysiological adaptations to water resource limitations in Kanepu'u dry forest, Lana'i, Hawai'i. PhD dissertation. University of Hawaii, Manoa.

70 Stratton, L. and G. Goldstein. 200 I. Carbon uptake, growth and resource-use emciency in one
invasive and six native Hawaiian dry forest tree species. Tree Physiology 21 : 1327-1334.
Stratton, L. c., G. Goldstein, and F. C. Meinzer. 2000. Temporal and spatial partitioning of water resources among eight woody species in a Hawaiian dry forest. Oeco logia 124:309-3 17.
Sturm, N., B. Kostner, W. Hartung, and J. D. Tenhunen. 1998. Environmental and endogenous controls on leaf- and stand-level water conductance in a Scots pine plantat ion. Annales Des Sciences Forestieres 55:237-253.
Tyree, M. T. and M. H. Zimmermann. 2002. Xylem structure and the ascent of sap. Springer, Berlin.
Vertessy, R. A., F. G. R. Watson, and S. K. O'Sullivan. 200 1. Factors determining relat ions between stand age and catchment water balance in mountain ash forests. Forest Ecology and Management 143: 13-26.
Wagner, W. L., D. R. Herbst, and S. H. Sohmer. 1999. Manual of the Flowering Plants of Hawaii. Bishop Museum, Honolulu.
Wullschleger, S. D., P. J. Hanson, and D. E. Todd. 200 I. Transpiration from a multi-species deciduous forest as estimated by xylem sap now techniques. Forest Ecology and Management 143:205-2 13.
Zeppel, M. J. B., I. A. M. Yunusa, and D. Eamus. 2006. Daily, seasonal and annual patterns of transpiration from a stand of remnant vegetation dominated by a coniferous Callitris species and a broad-leaved Eucalyptus species. Physiologia Plantarum 127:413-422 .
Zimmerman, N., R. Flint Hughes, S. Cordell, P. Hart, H. K. Chang, D. Perez, R. K. Like, and R. Ostertag. in press. Patterns of primary success ion of native and introduced plants in lowland wet fo rests in eastern Hawai'i. Biotropica.


![Biodiversity and conservation Genetic diversity: within species variation (e.g corn [Zea mays] in North vs. Central America) Species diversity: species](https://img.pdfslide.net/doc/110x75/56649db45503460f94aa4ef5/biodiversity-and-conservation-genetic-diversity-within-species-variation.jpg)