Embed Size (px)
Citation preview

Article
Variation in the Human Immune SystemIs Largely Driven by Non-Heritable InfluencesPetter Brodin,1,2,3,11 Vladimir Jojic,4,11 TianxiangGao,4 Sanchita Bhattacharya,3 Cesar J. Lopez Angel,2,3 David Furman,2,3
Shai Shen-Orr,5 Cornelia L. Dekker,6 Gary E. Swan,7 Atul J. Butte,6,8 Holden T. Maecker,3,9 and Mark M. Davis2,3,10,*1Science for Life Laboratory, Department of Medicine, Solna, Karolinska Institutet, 17121 Solna, Sweden2Department of Microbiology and Immunology, Stanford University School of Medicine, Stanford, CA 94304, USA3Institute of Immunity, Transplantation and Infection, Stanford University School of Medicine, Stanford, CA 94304, USA4Department of Computer Science, University of North Carolina at Chapel Hill, Chapel Hill, NC 27599, USA5Department of Immunology, Faculty of Medicine, Technion, Haifa 31096, Israel6Department of Pediatrics, Stanford University School of Medicine, Stanford, CA 94304, USA7Stanford Prevention Research Center, Department of Medicine, Stanford University School of Medicine, Stanford, CA 94304, USA8Center for Pediatric Bioinformatics, Lucille Packard Children’s Hospital, Stanford University, Stanford, CA 94304, USA9Human Immune Monitoring Center, Stanford University School of Medicine, Stanford, CA 94304, USA10Howard Hughes Medical Institute, Stanford University School of Medicine, Stanford, CA 94304, USA11Co-first author
*Correspondence: [email protected]
http://dx.doi.org/10.1016/j.cell.2014.12.020
SUMMARY
There is considerable heterogeneity in immunolog-ical parameters between individuals, but its sourcesare largely unknown. To assess the relative contribu-tion of heritable versus non-heritable factors, wehave performed a systems-level analysis of 210healthy twins between 8 and 82 years of age. Wemeasured 204 different parameters, including cellpopulation frequencies, cytokine responses, andserum proteins, and found that 77% of these aredominated (>50% of variance) and 58% almostcompletely determined (>80% of variance) by non-heritable influences. In addition, some of these pa-rameters becomemore variable with age, suggestingthe cumulative influence of environmental exposure.Similarly, the serological responses to seasonal influ-enza vaccination are also determined largely by non-heritable factors, likely due to repeated exposure todifferent strains. Lastly, in MZ twins discordant forcytomegalovirus infection, more than half of all pa-rameters are affected. These results highlight thelargely reactive and adaptive nature of the immunesystem in healthy individuals.
INTRODUCTION
The study of monozygotic (MZ) and dizygotic (DZ) twin pairs has
provided a powerful means for separating heritable from non-
heritable influences on measured traits for almost 100 years
(Jablonski, 1922). Such studies have been used to study autoim-
mune diseases, vaccine responses (Jacobson et al., 2007),
serumcytokines (de Craen et al., 2005), or the frequencies ofma-
jor immune cell populations (Clementi et al., 1999; Evans et al.,
2004). Most of these studies have found that both heritable
and non-heritable factors contribute to the resulting phenotype.
Recent advances in technology now allow much more compre-
hensive surveys to be conducted across themany different com-
ponents of the immune system, and thus we performed a very
broad ‘‘systems-level’’ study in which we measured 51 serum
cytokines, chemokines, and growth factors; the frequencies of
95 different immune cell subsets; and cellular responses to cyto-
kine stimulation (Figure 1A). Our results show that these func-
tional units of immunity vary across individuals primarily as a
consequence of non-heritable factors, with a generally limited in-
fluence of heritable ones. This indicates that the immune system
of healthy individuals is very much shaped by the environment
and most likely by the many different microbes that an individual
encounters in their lifetime.
RESULTS
A Systems-Level Analysis of the Immune System inHealthy TwinsOur study cohort was recruited from the Twin Research Registry
at SRI International (Krasnowet al., 2013) in the years 2009–2011,
with demographic data detailed in TableS1 (available online). The
subjects were all apparently healthy, without any symptoms of
disease (Experimental Procedures, ‘‘Twin Cohort’’). To minimize
biological variability, the time between blood sampling of each
twin in a pair was kept to a minimum (Experimental Procedures,
‘‘Blood Sampling, PBMC Preparation, and Zygosity Testing’’).
Immunological assays were performed by the Human Immune
Monitoring Center, where assays are continually benchmarked
to minimize technical variability (http://iti.stanford.edu/himc/)
(Maecker et al., 2005).However, some technical variability is inev-
itable, and thus we corrected for this in all of our models. We did
this by analyzing aliquots of the same control sample many (>17)
times to estimate the technical variance and subtracted this from
our estimates of heritability (Experimental Procedures, ‘‘Correc-
tion of Model Estimates for Technical Variability’’). We also
analyzed longitudinal samples in an unrelated cohort over 2–5
Cell 160, 37–47, January 15, 2015 ª2015 Elsevier Inc. 37

A B
C
Cell populations (Mass and Flow Cytometry)
Figure 1. Systems-Level Analysis of Healthy Human Twins
(A) Overview of data collected covering the functional units of the immune system, the cells, and proteins in circulation.
(B) Summary of all heritability estimates for 72 immune cell population frequencies as determined by flow (2009) and mass cytometry (2010–2011) (Experimental
Procedures, section 3). See also Table S3.
(C) Heritability estimates of 43 serum proteins as determined by a fluorescent bead assay. See also Table S4. Error bars represent 95% confidence intervals for
the heritability estimate. Gray area is heritability <0.2, our detection limit.
consecutive, yearly samplings and found that the variation was
largely due to technical variability (Table S2). A total of 204
different immune measurements were included in our analyses.
Estimating Heritable and Non-Heritable InfluencesHeritability for each parameter was estimated by comparing
observed MZ and DZ covariance matrices to the expected
38 Cell 160, 37–47, January 15, 2015 ª2015 Elsevier Inc.
values based on a structural equation model that partitioned
the observed variance into three components: heritable (A),
shared (C), and unique (E) non-heritable factors. This model is
based on the assumptions that: (1) heritable factors correlate
perfectly between MZ twins (rMZ = 1) but only to 50% between
DZ twins (rDZ = 0.5) and (2) that shared non-heritable influences
are equally similar (rMZ = rDZ) between MZ and DZ twin pairs

(Experimental Procedures, ‘‘Structural Equation Modeling to
Estimate Heritable and Non-Heritable Influences’’). For each
measurement, we subtracted the technical variance estimate
from the e-component prior to normalization to correct for noise
(Experimental Procedures, ‘‘Correction of Model Estimates for
Technical Variability’’). We also corrected all measurements for
the effects of age (Dorshkind et al., 2009) and gender (Furman
et al., 2014) by regressing out such effects and using only resid-
ual variance for estimating heritability. Finally, we performed
jackknife bootstrapping tests to obtain 95% confidence intervals
(Experimental Procedures, ‘‘Structural Equation Modeling to
Estimate Heritable and Non-Heritable Influences’’). Importantly,
as our model estimates heritability by comparing MZ and DZ
twins, heritable influences include genomic and shared epige-
netic traits (Bell and Spector, 2011), and non-heritable influences
include environmental factors and stochastic epigenetic
changes (Fraga et al., 2005).
We first ran a simulation experiment to verify that our cohort
size of 210 twins (78 MZ and 27 DZ pairs) would be enough to
test our hypothesis that most immunological traits are explained
more by non-heritable than by heritable influences. We found
this to be the case, and we estimate 20% heritability to be our
detection limit, under which we cannot distinguish small herita-
ble influences from zero (Figure S1).
Most Cell Population Frequencies and Serum ProteinsAre Dominated by Non-Heritable InfluencesAlthough it is well known that the frequencies of different types of
immune cells in blood often vary widely between individuals, in
most cases it is not known how much of this can be attributed
to heritable or non-heritable factors, respectively. To address
this question, we used antibodies against cell surface markers
to quantify 95 different cell subset frequencies but used the 72
most non-redundant ones and estimated the influence of herita-
ble and non-heritable factors on their variation (Experimental
Procedures, ‘‘Immune Cell Phenotyping by Mass Cytometry
and Flow Cytometry’’). Among these, a few had very strong influ-
ences from heritable factors, especially naive, CD27+, and cen-
tral memory CD4+ T cells (Figure 1B and Table S3), but for
most, non-heritable influences were clearly dominant. In fact,
for 61% of all cell populations, the influence of heritable factors
was undetectable (<20% of the total variation) (Figure 1B and
Table S3). This was true of both adaptive (T and B cells) and
innate cell types (granulocytes, monocytes, and NK-cells).
Serum cytokines and chemokines also have important func-
tions as immune mediators and biomarkers of disease (Villeda
and Wyss-Coray, 2013), and thus we measured 51 serum pro-
teins but eliminated eight that were often at or below the limits
of detection (Experimental Procedures, ‘‘Serum Protein Quanti-
fication’’). This left 24 cytokines, 10 chemokines, 6 growth fac-
tors, and 3 other serum proteins for which we estimated the
influences of heritable and non-heritable factors (Figure 1C and
Table S4). Some cytokines were particularly heritable, such as
IL-12p40 (Figure 1C and Table S4). Interestingly, variants in the
IL12B gene that contribute to the IL-12p40 protein have been
associated with immune-mediated diseases such as psoriasis
(Nair et al., 2009) and asthma (Morahan et al., 2002). In the latter
condition, the susceptibility locus was also associated with a
reduced serum concentration of IL-12p40 (Morahan et al.,
2002). For many other measurements, such as IL-10 and a group
of chemokines, the heritable influence was low (Figure 1C and
Table S4).
Homeostatic Cytokine Responses Are Largely Heritable,whereas Most Other Cell Responses Are HighlyNon-HeritableBecause these serum proteins often regulate immune cells, we
assessed the responses of eight different cell populations stim-
ulated in vitro with seven different cytokines for the phosphory-
lation of three important transcription factors, STAT1, 3, and 5,
using phospho-specific antibodies in flow cytometry (Krutzik
andNolan, 2006).We performed a total of 192 different measure-
ments but focused on the 24 baseline measurements and the
65 strongest induced responses (Experimental Procedures,
‘‘Immune Cell Signaling Experiments’’). Baseline measurements
were generally driven by non-heritable factors, with possible
minor contributions fromheritable factors (Figure 2A). The impor-
tant homeostatic cytokines IL-2 and IL-7, known to stimulate the
proliferation and differentiation of T cells, were found to induce
STAT5 phosphorylation in both CD4+ and CD8+ T cell popula-
tions, and these responses were highly heritable (Figure 2A
and Table S5). In contrast, most signaling responses such as
interferon-induced STAT1 phosphorylation and, in particular,
the IL-6-, IL-21-, and regulatory IL-10-induced phosphorylation
of STAT3,were dominated by non-heritable influences (Figure 2A
and Table S5). In total, 69% of all signaling responses had no
detectable heritable influence (e.g., <20%) (Figure 2A and Table
S5). This lack of heritability was not related to the strength of
responses or explained by a bias toward weak and variable
responses (Figure S2).
Non-Heritable Influences Are Major FactorsDetermining Immune VariationTaken together, these results show that variation in blood cell
frequencies and functions and soluble factors is largely driven
by non-heritable factors, with 58% of all measurements having
<20% of their total variance explained by heritable influences
(Figure 2B). There was no relationship between the absolute
degree of measurement variability in the cohort and estimated
heritability (Figure S3), and we could also rule out any underesti-
mation of heritability due to the skewed ratio of MZ/DZ twin pairs
in our cohort by a resampling test. In brief, by creating 1,000 syn-
thetic data sets with uniform heritability and the same MZ/DZ
ratio as in our cohort, we estimated heritability and found that
none of the 1,000 data sets ever had >40% of measurements
with an estimated heritability < 0.2 (p < 0.001) (Figure 2C), thus
suggesting that the low heritability estimates obtained are not
a result of study design or overall measurement variation in the
cohort.
Heritable and Non-Heritable Measurements AreInterrelated in the Immune NetworkOur analysis also allowed us to analyze the interrelationships
between the different components of the immune system. To
construct such a network model, we calculated a precision ma-
trix derived from a Spearman correlation matrix (Liu et al., 2012).
Cell 160, 37–47, January 15, 2015 ª2015 Elsevier Inc. 39

Normalized heritable influence
0.000.250.500.751.00
0.000.250.500.751.00
0.000.250.500.751.000.000.250.500.751.000.000.250.500.751.000.000.250.500.751.000.000.250.500.751.00
0.000.250.500.751.00
B
CD4pos T
Memory CD4pos T
Naive CD4pos T
CD8pos T
Memory CD8pos T
Naive CD8pos T
Monocytes
IFN-α IFN-γ IL-6 IL-21 IL-10 IL-7 IL-2 BaselineA
pSTAT1pSTAT3pSTAT5
BDistribution of all heritability estimates
0.0
0.5
1.0
1.5
2.0
2.5
0.00 0.25 0.50 0.75 1.00
Normalized heritability influence
dens
ity
freq. Twin measurementswith h2 < 0.2
.20 .25 .30 .35 .40 .45 .50 .55 .60 .650
10
20
30
40
50
C
Figure 2. Heritable Factors Explain Only a Fraction of the Variation for Most Immune Measurements
(A) Heritability estimates for immune cell signaling states upon stimulation with the indicated cytokines. Only unstimulated controls and induced responses >1.5-
fold are shown. See also Table S5.
(B) The overall distribution of heritability for all 204 measurements.
(C) The maximum number of measurements with heritability <0.2 across 1,000 synthetic data sets with the same MZ/DZ ratio as in our twin cohort is <40%,
significantly less than our results of 58% of measurements with heritability <20% (gray bar). p < 0.001.
A matrix of this type captures partial correlations between vari-
ables and avoids spurious, indirect interactions that might occur
in standard correlation analyses. By penalizing non-zero entries
in this matrix (Friedman et al., 2008), we could pursue what is
referred to as a sparse (rather than dense) network model, mak-
ing it more interpretable. After removing unconnected nodes and
validating the edges by a permutation test (Experimental Proce-
dures, ‘‘Identification of Pairwise Dependencies between Mea-
surements and the Creation of an Immune Network Model’’),
this model consists of 126 nodes and 142 edges (Figure 3A
and Table S6). An interactive version is available online (http://
www.brodinlab.com/twins.html). We found that heritable nodes
(yellow) were generally connected to non-heritable nodes (pur-
ple) throughout the network (Figure 3A). One example shows
how the weakly heritable cytokine IL-10 and CD161�CD45RA+
regulatory T cells are connected to the strongly heritable fre-
quency of naive CD4+ T cells (Figure 3B). We found that all
hubs in the networkwere dominated by non-heritable influences,
40 Cell 160, 37–47, January 15, 2015 ª2015 Elsevier Inc.
like the network as a whole, showing that heritable factors are
not isolated by themselves but are buffered by connected non-
heritable ones (Figure 3A and 3B). This may explain why the
many gene polymorphisms found (for example, CTLA4 [Gre-
gersen et al., 2009]) outside of the HLA locus that are associated
with immune-mediated disease only explain a small fraction of
the total disease risk (Todd, 2010).
With Age, Genetically Identical Twins Diverge as aConsequence of Non-Heritable InfluencesAs a major source of non-heritable influence is likely to be envi-
ronmental, particularly microbial exposure, we reasoned that
such influences would increase with time. To this end, we
compared twin-twin correlations for all immune measurements
between the oldest (>60 years; median, 72 years) and the youn-
gest (<20 years; median, 13 years) MZ pairs in our cohort. Here,
we also note that twins in the younger (<20 years) cohort are in
most cases living together, whereas the older (>60 years) twins
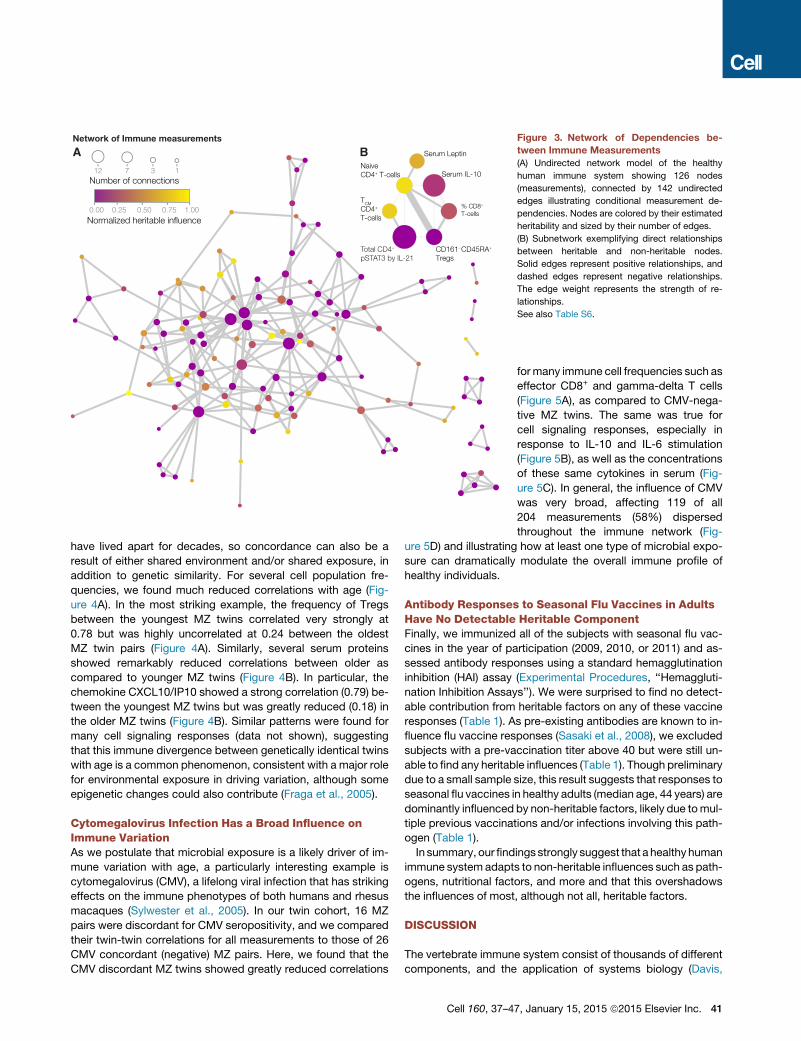
Network of Immune measurements
TCM
CD4+
T-cells
NaiveCD4+ T-cells
Serum Leptin
Serum IL-10
% CD8+
T-cells
CD161- CD45RA+
TregsTotal CD4+
pSTAT3 by IL-21
A B
Number of connections12 17 3
Normalized heritable influence0.00 0.50 1.000.25 0.75
Figure 3. Network of Dependencies be-
tween Immune Measurements
(A) Undirected network model of the healthy
human immune system showing 126 nodes
(measurements), connected by 142 undirected
edges illustrating conditional measurement de-
pendencies. Nodes are colored by their estimated
heritability and sized by their number of edges.
(B) Subnetwork exemplifying direct relationships
between heritable and non-heritable nodes.
Solid edges represent positive relationships, and
dashed edges represent negative relationships.
The edge weight represents the strength of re-
lationships.
See also Table S6.
have lived apart for decades, so concordance can also be a
result of either shared environment and/or shared exposure, in
addition to genetic similarity. For several cell population fre-
quencies, we found much reduced correlations with age (Fig-
ure 4A). In the most striking example, the frequency of Tregs
between the youngest MZ twins correlated very strongly at
0.78 but was highly uncorrelated at 0.24 between the oldest
MZ twin pairs (Figure 4A). Similarly, several serum proteins
showed remarkably reduced correlations between older as
compared to younger MZ twins (Figure 4B). In particular, the
chemokine CXCL10/IP10 showed a strong correlation (0.79) be-
tween the youngest MZ twins but was greatly reduced (0.18) in
the older MZ twins (Figure 4B). Similar patterns were found for
many cell signaling responses (data not shown), suggesting
that this immune divergence between genetically identical twins
with age is a common phenomenon, consistent with a major role
for environmental exposure in driving variation, although some
epigenetic changes could also contribute (Fraga et al., 2005).
Cytomegalovirus Infection Has a Broad Influence onImmune VariationAs we postulate that microbial exposure is a likely driver of im-
mune variation with age, a particularly interesting example is
cytomegalovirus (CMV), a lifelong viral infection that has striking
effects on the immune phenotypes of both humans and rhesus
macaques (Sylwester et al., 2005). In our twin cohort, 16 MZ
pairs were discordant for CMV seropositivity, and we compared
their twin-twin correlations for all measurements to those of 26
CMV concordant (negative) MZ pairs. Here, we found that the
CMV discordant MZ twins showed greatly reduced correlations
Cell 160, 37–4
formany immune cell frequencies such as
effector CD8+ and gamma-delta T cells
(Figure 5A), as compared to CMV-nega-
tive MZ twins. The same was true for
cell signaling responses, especially in
response to IL-10 and IL-6 stimulation
(Figure 5B), as well as the concentrations
of these same cytokines in serum (Fig-
ure 5C). In general, the influence of CMV
was very broad, affecting 119 of all
204 measurements (58%) dispersed
throughout the immune network (Fig-
ure 5D) and illustrating how at least one type of microbial expo-
sure can dramatically modulate the overall immune profile of
healthy individuals.
Antibody Responses to Seasonal Flu Vaccines in AdultsHave No Detectable Heritable ComponentFinally, we immunized all of the subjects with seasonal flu vac-
cines in the year of participation (2009, 2010, or 2011) and as-
sessed antibody responses using a standard hemagglutination
inhibition (HAI) assay (Experimental Procedures, ‘‘Hemaggluti-
nation Inhibition Assays’’). We were surprised to find no detect-
able contribution from heritable factors on any of these vaccine
responses (Table 1). As pre-existing antibodies are known to in-
fluence flu vaccine responses (Sasaki et al., 2008), we excluded
subjects with a pre-vaccination titer above 40 but were still un-
able to find any heritable influences (Table 1). Though preliminary
due to a small sample size, this result suggests that responses to
seasonal flu vaccines in healthy adults (median age, 44 years) are
dominantly influenced by non-heritable factors, likely due tomul-
tiple previous vaccinations and/or infections involving this path-
ogen (Table 1).
In summary, our findings strongly suggest that a healthy human
immune system adapts to non-heritable influences such as path-
ogens, nutritional factors, and more and that this overshadows
the influences of most, although not all, heritable factors.
DISCUSSION
The vertebrate immune system consist of thousands of different
components, and the application of systems biology (Davis,
7, January 15, 2015 ª2015 Elsevier Inc. 41
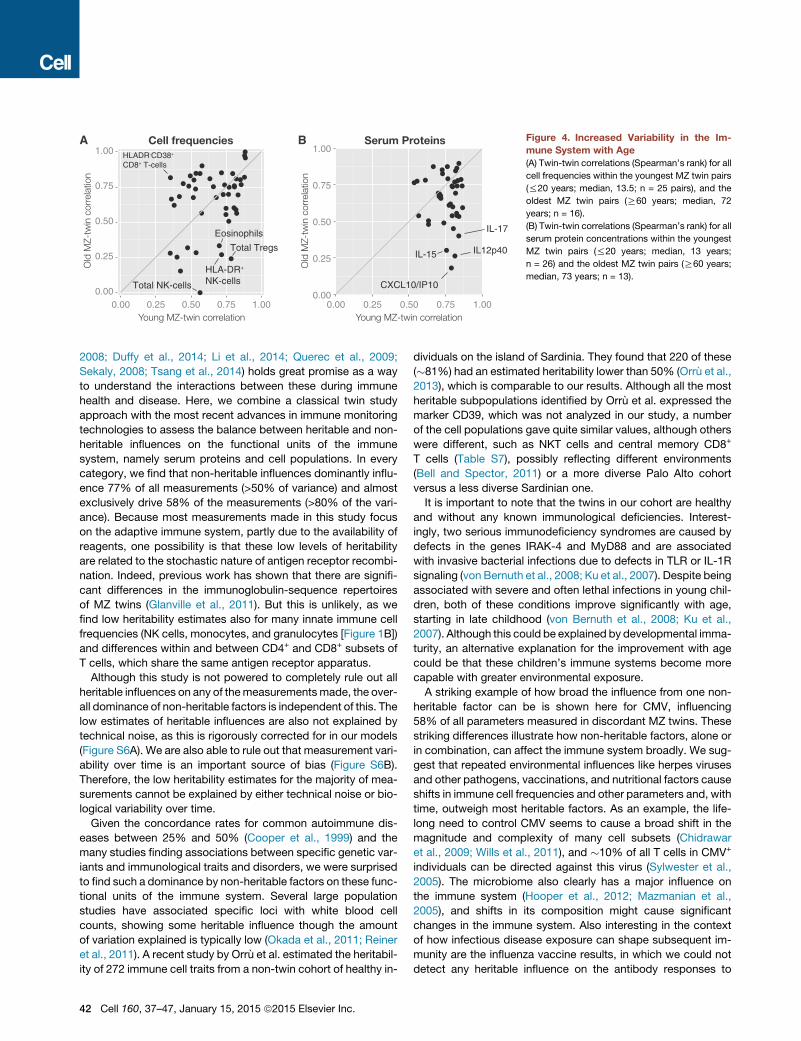
Serum Proteins
Young MZ-twin correlation
Old
MZ-
twin
cor
rela
tion
IL12p40IL-15
IL-17
CXCL10/IP100.00
0.25
0.50
0.75
1.00
0.00 0.25 0.50 0.75 1.00
BCell frequenciesA
0.00 0.25 0.50 0.75 1.000.00
0.25
0.50
0.75
1.00
Young MZ-twin correlation
Old
MZ-
twin
cor
rela
tion
Total NK-cells
Total Tregs
HLA-DR+
NK-cells
Eosinophils
HLADR-CD38+
CD8+ T-cells
Figure 4. Increased Variability in the Im-
mune System with Age
(A) Twin-twin correlations (Spearman’s rank) for all
cell frequencies within the youngest MZ twin pairs
(%20 years; median, 13.5; n = 25 pairs), and the
oldest MZ twin pairs (R60 years; median, 72
years; n = 16).
(B) Twin-twin correlations (Spearman’s rank) for all
serum protein concentrations within the youngest
MZ twin pairs (%20 years; median, 13 years;
n = 26) and the oldest MZ twin pairs (R60 years;
median, 73 years; n = 13).
2008; Duffy et al., 2014; Li et al., 2014; Querec et al., 2009;
Sekaly, 2008; Tsang et al., 2014) holds great promise as a way
to understand the interactions between these during immune
health and disease. Here, we combine a classical twin study
approach with the most recent advances in immune monitoring
technologies to assess the balance between heritable and non-
heritable influences on the functional units of the immune
system, namely serum proteins and cell populations. In every
category, we find that non-heritable influences dominantly influ-
ence 77% of all measurements (>50% of variance) and almost
exclusively drive 58% of the measurements (>80% of the vari-
ance). Because most measurements made in this study focus
on the adaptive immune system, partly due to the availability of
reagents, one possibility is that these low levels of heritability
are related to the stochastic nature of antigen receptor recombi-
nation. Indeed, previous work has shown that there are signifi-
cant differences in the immunoglobulin-sequence repertoires
of MZ twins (Glanville et al., 2011). But this is unlikely, as we
find low heritability estimates also for many innate immune cell
frequencies (NK cells, monocytes, and granulocytes [Figure 1B])
and differences within and between CD4+ and CD8+ subsets of
T cells, which share the same antigen receptor apparatus.
Although this study is not powered to completely rule out all
heritable influences on any of themeasurementsmade, the over-
all dominance of non-heritable factors is independent of this. The
low estimates of heritable influences are also not explained by
technical noise, as this is rigorously corrected for in our models
(Figure S6A). We are also able to rule out that measurement vari-
ability over time is an important source of bias (Figure S6B).
Therefore, the low heritability estimates for the majority of mea-
surements cannot be explained by either technical noise or bio-
logical variability over time.
Given the concordance rates for common autoimmune dis-
eases between 25% and 50% (Cooper et al., 1999) and the
many studies finding associations between specific genetic var-
iants and immunological traits and disorders, we were surprised
to find such a dominance by non-heritable factors on these func-
tional units of the immune system. Several large population
studies have associated specific loci with white blood cell
counts, showing some heritable influence though the amount
of variation explained is typically low (Okada et al., 2011; Reiner
et al., 2011). A recent study by Orru et al. estimated the heritabil-
ity of 272 immune cell traits from a non-twin cohort of healthy in-
42 Cell 160, 37–47, January 15, 2015 ª2015 Elsevier Inc.
dividuals on the island of Sardinia. They found that 220 of these
(�81%) had an estimated heritability lower than 50% (Orru et al.,
2013), which is comparable to our results. Although all the most
heritable subpopulations identified by Orru et al. expressed the
marker CD39, which was not analyzed in our study, a number
of the cell populations gave quite similar values, although others
were different, such as NKT cells and central memory CD8+
T cells (Table S7), possibly reflecting different environments
(Bell and Spector, 2011) or a more diverse Palo Alto cohort
versus a less diverse Sardinian one.
It is important to note that the twins in our cohort are healthy
and without any known immunological deficiencies. Interest-
ingly, two serious immunodeficiency syndromes are caused by
defects in the genes IRAK-4 and MyD88 and are associated
with invasive bacterial infections due to defects in TLR or IL-1R
signaling (von Bernuth et al., 2008; Ku et al., 2007). Despite being
associated with severe and often lethal infections in young chil-
dren, both of these conditions improve significantly with age,
starting in late childhood (von Bernuth et al., 2008; Ku et al.,
2007). Although this could be explained by developmental imma-
turity, an alternative explanation for the improvement with age
could be that these children’s immune systems become more
capable with greater environmental exposure.
A striking example of how broad the influence from one non-
heritable factor can be is shown here for CMV, influencing
58% of all parameters measured in discordant MZ twins. These
striking differences illustrate how non-heritable factors, alone or
in combination, can affect the immune system broadly. We sug-
gest that repeated environmental influences like herpes viruses
and other pathogens, vaccinations, and nutritional factors cause
shifts in immune cell frequencies and other parameters and, with
time, outweigh most heritable factors. As an example, the life-
long need to control CMV seems to cause a broad shift in the
magnitude and complexity of many cell subsets (Chidrawar
et al., 2009; Wills et al., 2011), and �10% of all T cells in CMV+
individuals can be directed against this virus (Sylwester et al.,
2005). The microbiome also clearly has a major influence on
the immune system (Hooper et al., 2012; Mazmanian et al.,
2005), and shifts in its composition might cause significant
changes in the immune system. Also interesting in the context
of how infectious disease exposure can shape subsequent im-
munity are the influenza vaccine results, in which we could not
detect any heritable influence on the antibody responses to

0
0.25
0.50
0.75
1.00
0 0.25 0.50 0.75 1.00
Cell signaling responses
CMV neg/neg MZ pairs
CD8+ pStat3 by IL-6
B-cell pStat3by IL-10
CD4+ pStat1 by IL-6 CD8+ pStat1
by IL-6
Memory CD8+
A
0
0.25
0.50
0.75
1.00
CMV neg/neg MZ pairs
Cell frequencies
effector CD8+ T
Granulo-cytes
0 0.25 0.50 0.75 1.00
0
0.25
0.50
0.75
1.00
0 0.25 0.50 0.75 1.00CMV neg/neg MZ pairs
CM
V p
os/n
eg M
Z
Serum Proteins
IL-10
IL-6
IL-7
CM
V p
os/n
eg M
Z
CM
V p
os/n
eg M
Z
C D
B
CMV influenced nodes
Figure 5. Broad Non-Heritable Influences in
the Healthy Immune System
(A) Twin-twin correlations (Spearman’s rank) for
all cell frequency measurements made in CMV
concordant negative (neg/neg) MZ twin pairs
(n = 26 pairs) and CMV discordant (pos/neg) MZ
twin pairs (n = 16 pairs).
(B and C) (B) Twin-twin correlations (Spearman’s
rank) for cell signaling responses to cytokine
stimulation and (C) serum protein measurements
between CMV neg/neg and CMV pos/neg MZ twin
pairs.
(D) 58% of all 126 nodes in the immune network
model with reduced correlations in CMV pos/neg
as compared to CMV neg/neg MZ twin pairs.
influenza vaccination (Table 1). This recalls the ‘‘original anti-
genic sin’’ hypothesis (Francis, 1960), wherein it was postulated
that previous encounters with influenza strains strongly impact
the response to a novel strain. But our finding contrasts with
other vaccine studies in twins, most often performed in very
young children and involving vaccines against pathogens less
frequently encountered in the population (Table 1) (Jacobson
et al., 2007). Specifically, vaccines against mumps, measles,
rubella (Tan et al., 2001), oral polio, tetanus, and diphtheria vac-
cines (Newport et al., 2004) have all been shown to be strongly
heritable (Table 1) in studies with young children. The one study
that we know of from adult twins is a study of hepatitis A/B vac-
cine responses and was conducted across a similar age range
(18–65 years) as ours and reported a heritable influence of
36% for hepatitis A and 61% for hepatitis B antibody responses
(Table 1). However, two other studies of hepatitis B vaccine re-
sponses performed in young children showed much higher esti-
mates of heritability of 91% (Yan et al., 2013) and 77% (Newport
et al., 2004), respectively. In addition, responses to vaccines
given at birth (oral polio vaccine [OPV] and Bacillus Calmette–
Guerin [BCG]) are more heritable than even those administered
only 2 months later (diphtheria and tetanus) (Newport et al.,
2004; O’Connor and Pollard, 2013). In addition, Evans et al.
analyzed 12-year-old twins in Australia (Evans et al., 1999).
Although there are only six broad categories of immune cell sub-
sets that can be comparedwith our study and those of Orru et al.,
it is interesting that, in all cases, the estimates of heritability in the
12-year-old twins were higher than either ours or Orru et al., in
Cell 160, 37–4
which the mean age is about 38 and 40
years, respectively (Table S7). These ob-
servations are consistent with our data
(Figure 4), showing an increasing non-
heritable influence on many variables
with age, and suggest quite strongly that
many if not most of the less heritable traits
that we measure here in our mostly adult
population may be much more heritable
if measured in young children.
Before the advent of childhood vac-
cines, antibiotics, and improvements in
human hygiene, almost half of all children
younger than 5 years of age died of infec-
tious diseases. Casanova and colleagues have proposed a
genetic theory of infectious disease to account for the interindi-
vidual differences in susceptibility (Alcaıs et al., 2009). Our data
and the vaccine studies cited here suggest that such genetic
predisposition would be most pronounced in young children
but that, later on, the adaptive nature of the immune system is
able to overcome many defects. This is similar to the hypothesis
proposed by Alcais and colleagues to explain the discrepancies
in genetic lesions underlying the susceptibility to primary and
secondary infections, respectively (Alcaıs et al., 2010). Adapta-
tions of the immune system with time could be the result of
well-known immune mechanisms, such as specific antibodies
and T cells or cross-reactive immunity (Su et al., 2013), or
some as yet to be defined maturational process. We would
also speculate that the immune system may have feedback
mechanisms that allow it to skew its mix of cell types and
functional properties in order to compensate for a given individ-
ual’s particular mix of gene polymorphisms and microbial
exposures.
In summary, we find that, in an examination of many of the
component parts of the immune system, as well as some
response metrics, much of the considerable variation in human
beings is driven by non-heritable influences. This variation in-
creases with age and is likely due in large part to exposure to
pathogens and other microbes, as we see for CMV discordant
MZ twins and in the responses to influenza vaccination. Lastly,
we expect that other complex systems in higher organisms,
such as the nervous system, will also show this pronounced
7, January 15, 2015 ª2015 Elsevier Inc. 43
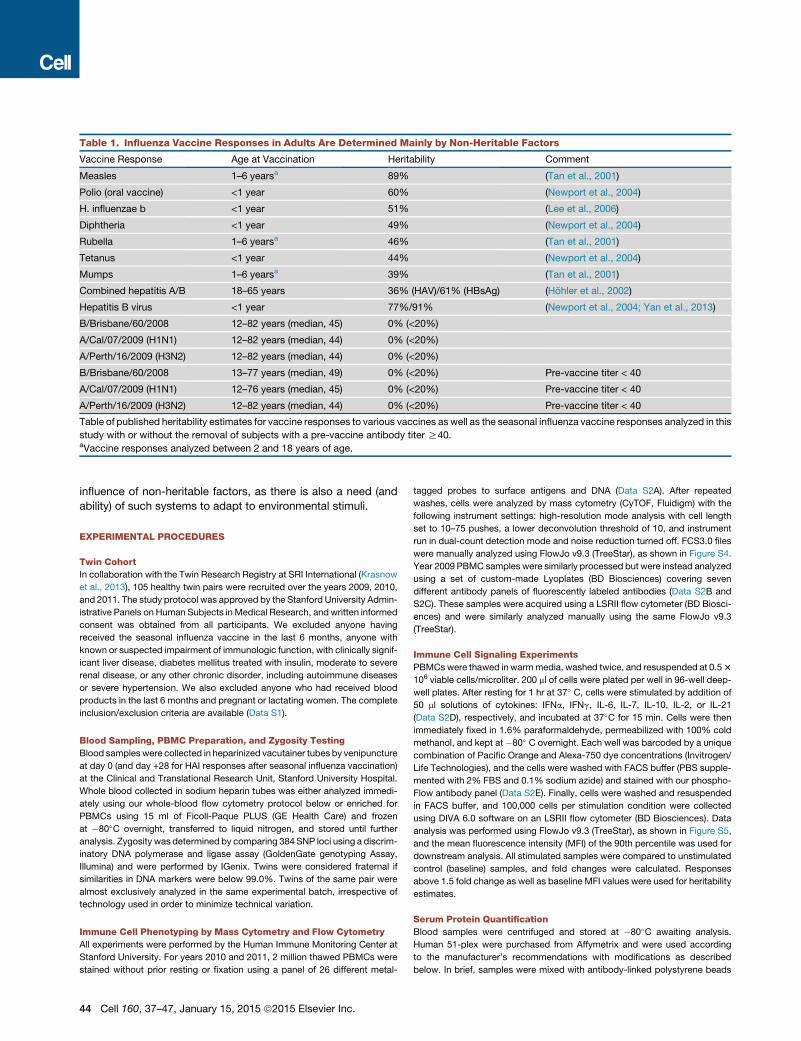
Table 1. Influenza Vaccine Responses in Adults Are Determined Mainly by Non-Heritable Factors
Vaccine Response Age at Vaccination Heritability Comment
Measles 1–6 yearsa 89% (Tan et al., 2001)
Polio (oral vaccine) <1 year 60% (Newport et al., 2004)
H. influenzae b <1 year 51% (Lee et al., 2006)
Diphtheria <1 year 49% (Newport et al., 2004)
Rubella 1–6 yearsa 46% (Tan et al., 2001)
Tetanus <1 year 44% (Newport et al., 2004)
Mumps 1–6 yearsa 39% (Tan et al., 2001)
Combined hepatitis A/B 18–65 years 36% (HAV)/61% (HBsAg) (Hohler et al., 2002)
Hepatitis B virus <1 year 77%/91% (Newport et al., 2004; Yan et al., 2013)
B/Brisbane/60/2008 12–82 years (median, 45) 0% (<20%)
A/Cal/07/2009 (H1N1) 12–82 years (median, 44) 0% (<20%)
A/Perth/16/2009 (H3N2) 12–82 years (median, 44) 0% (<20%)
B/Brisbane/60/2008 13–77 years (median, 49) 0% (<20%) Pre-vaccine titer < 40
A/Cal/07/2009 (H1N1) 12–76 years (median, 45) 0% (<20%) Pre-vaccine titer < 40
A/Perth/16/2009 (H3N2) 12–82 years (median, 44) 0% (<20%) Pre-vaccine titer < 40
Table of published heritability estimates for vaccine responses to various vaccines as well as the seasonal influenza vaccine responses analyzed in this
study with or without the removal of subjects with a pre-vaccine antibody titer R40.aVaccine responses analyzed between 2 and 18 years of age.
influence of non-heritable factors, as there is also a need (and
ability) of such systems to adapt to environmental stimuli.
EXPERIMENTAL PROCEDURES
Twin Cohort
In collaboration with the Twin Research Registry at SRI International (Krasnow
et al., 2013), 105 healthy twin pairs were recruited over the years 2009, 2010,
and 2011. The study protocol was approved by the Stanford University Admin-
istrative Panels on Human Subjects in Medical Research, and written informed
consent was obtained from all participants. We excluded anyone having
received the seasonal influenza vaccine in the last 6 months, anyone with
known or suspected impairment of immunologic function, with clinically signif-
icant liver disease, diabetes mellitus treated with insulin, moderate to severe
renal disease, or any other chronic disorder, including autoimmune diseases
or severe hypertension. We also excluded anyone who had received blood
products in the last 6 months and pregnant or lactating women. The complete
inclusion/exclusion criteria are available (Data S1).
Blood Sampling, PBMC Preparation, and Zygosity Testing
Blood sampleswere collected in heparinized vacutainer tubes by venipuncture
at day 0 (and day +28 for HAI responses after seasonal influenza vaccination)
at the Clinical and Translational Research Unit, Stanford University Hospital.
Whole blood collected in sodium heparin tubes was either analyzed immedi-
ately using our whole-blood flow cytometry protocol below or enriched for
PBMCs using 15 ml of Ficoll-Paque PLUS (GE Health Care) and frozen
at �80�C overnight, transferred to liquid nitrogen, and stored until further
analysis. Zygosity was determined by comparing 384 SNP loci using a discrim-
inatory DNA polymerase and ligase assay (GoldenGate genotyping Assay,
Illumina) and were performed by IGenix. Twins were considered fraternal if
similarities in DNA markers were below 99.0%. Twins of the same pair were
almost exclusively analyzed in the same experimental batch, irrespective of
technology used in order to minimize technical variation.
Immune Cell Phenotyping by Mass Cytometry and Flow Cytometry
All experiments were performed by the Human Immune Monitoring Center at
Stanford University. For years 2010 and 2011, 2 million thawed PBMCs were
stained without prior resting or fixation using a panel of 26 different metal-
44 Cell 160, 37–47, January 15, 2015 ª2015 Elsevier Inc.
tagged probes to surface antigens and DNA (Data S2A). After repeated
washes, cells were analyzed by mass cytometry (CyTOF, Fluidigm) with the
following instrument settings: high-resolution mode analysis with cell length
set to 10–75 pushes, a lower deconvolution threshold of 10, and instrument
run in dual-count detection mode and noise reduction turned off. FCS3.0 files
were manually analyzed using FlowJo v9.3 (TreeStar), as shown in Figure S4.
Year 2009 PBMC samples were similarly processed but were instead analyzed
using a set of custom-made Lyoplates (BD Biosciences) covering seven
different antibody panels of fluorescently labeled antibodies (Data S2B and
S2C). These samples were acquired using a LSRII flow cytometer (BD Biosci-
ences) and were similarly analyzed manually using the same FlowJo v9.3
(TreeStar).
Immune Cell Signaling Experiments
PBMCswere thawed in warmmedia, washed twice, and resuspended at 0.53
106 viable cells/microliter. 200 ml of cells were plated per well in 96-well deep-
well plates. After resting for 1 hr at 37� C, cells were stimulated by addition of
50 ml solutions of cytokines: IFNa, IFNg, IL-6, IL-7, IL-10, IL-2, or IL-21
(Data S2D), respectively, and incubated at 37�C for 15 min. Cells were then
immediately fixed in 1.6% paraformaldehyde, permeabilized with 100% cold
methanol, and kept at �80� C overnight. Each well was barcoded by a unique
combination of Pacific Orange and Alexa-750 dye concentrations (Invitrogen/
Life Technologies), and the cells were washed with FACS buffer (PBS supple-
mented with 2% FBS and 0.1% sodium azide) and stained with our phospho-
Flow antibody panel (Data S2E). Finally, cells were washed and resuspended
in FACS buffer, and 100,000 cells per stimulation condition were collected
using DIVA 6.0 software on an LSRII flow cytometer (BD Biosciences). Data
analysis was performed using FlowJo v9.3 (TreeStar), as shown in Figure S5,
and the mean fluorescence intensity (MFI) of the 90th percentile was used for
downstream analysis. All stimulated samples were compared to unstimulated
control (baseline) samples, and fold changes were calculated. Responses
above 1.5 fold change as well as baseline MFI values were used for heritability
estimates.
Serum Protein Quantification
Blood samples were centrifuged and stored at �80�C awaiting analysis.
Human 51-plex were purchased from Affymetrix and were used according
to the manufacturer’s recommendations with modifications as described
below. In brief, samples were mixed with antibody-linked polystyrene beads

on 96-well filter-bottom plates and incubated at room temperature for 2 hr fol-
lowed by overnight incubation at 4�C. Room temperature incubation steps
were performed on an orbital shaker at 500–600 rpm. Plates were vacuum
filtered and washed twice with wash buffer and were then incubated with bio-
tinylated detection antibody for 2 hr at room temperature. Samples were then
filtered and washed twice as above and were resuspended in streptavidin-PE.
After incubation for 40 min at room temperature, two additional vacuum
washes were performed and the samples resuspended in reading buffer.
Each sample was measured in duplicate. Plates were read using a Luminex
200 instrument with a lower bound of 100 beads per sample per protein.
Each sample was measured in duplicate. Plates were read using a Luminex
LabMap200 instrument with a lower bound of 100 beads per sample per pro-
tein per well. The Luminex LabMap200 outputs the fluorescence intensity of a
given protein in a sample. For each well, we considered the median fluores-
cence intensity (MFI) for a serum protein as its abundance and averaged the
MFI of these replicates. To ignore low-abundance proteins, only measure-
ments with mean concentrations higher than a negative control serum were
included in our analysis.
Hemagglutination Inhibition Assays
The HAI assay was performed on sera from day 0 and day 28 post influenza
vaccination. Fold changes day 28/day 0 were used for analyses. In one anal-
ysis, subjects with a pre-vaccination titer of 40 or more were excluded
(Table 1). Serially diluted 25 ml aliquots of serum samples in PBS were mixed
with 25 ml aliquots of virus, corresponding to four HA units, in V-bottom 96-
well plates (Nunc). These were then incubated for 15min at room temperature.
At the end of the incubation, 50 ml of 0.5% chicken red blood cells (cRBC) were
added and the plate incubated for 1 hr at room temperature, and HAI activity
was read as follows: (1) postive result: hemagglutination is present, the well is
hazy with no cRBC button or (2) negative result: hemagglutination is absent,
the well is relatively clear with cRBC button. The HAI titer is defined as the
reciprocal of dilution of the last well that inhibits hemagglutination.
Structural Equation Modeling to Estimate Heritable and
Non-Heritable Influences
For all of the measurements made, a structural equation modeling approach
was used to estimate heritability (Rijsdijk and Sham, 2002). This classical
twin modeling approach is based on the assumption that MZ twins are genet-
ically identical, whereas DZ twins share�50% of their polymorphic genes and
that MZ and DZ twin pairs are equally similar with respect to their shared envi-
ronmental influence. The covariancematrix for eachmeasurementmade inMZ
and DZ twin pairs can then be decomposed into three parameters: (1) additive
genetic parameter, (2) common environmental parameter, and (3) environ-
mental parameter unique to one twin. A linear ACE model then estimates the
contribution of each of these parameters by maximum likelihood. After cor-
recting the E-parameter for technical measurement errors, as described in
detail below, all parameters were scaled as a proportion of the total variance
(A+C+E). All data was corrected for age and gender prior to ACE modeling.
We performed resampling tests on all heritability estimates, using a jackknife
resampling approach leaving one twin pair out of the calculation in each itera-
tion and using the mean values of all such iterations as our final estimate with
95% confidence intervals. All calculations were performed using both our own
implementation of ACE fitting in MATLAB, version 8.3 and the openMX library
version 1.4 running in R version 3.0.3. Both platformswere used in order to pre-
vent any bias due to the software used.
Correction of Model Estimates for Technical Variability
For all measurements, standard samples were analyzed repeatedly (>17
times). These were either PBMC aliquots frozen at the same time and thawed
for every experiment or pooled serum used as standards for Luminex and HAI
assays. By calculating pooled variance estimates for these technical replicates
and subtracting this from the E-component in our ACEmodels prior to normal-
ization, we prevented the underestimation of heritability due to such stochastic
measurement errors. This procedure overestimates the technical noise level of
the actual twin samples by being collected across multiple batches, whereas
twin samples compared were always analyzed within the same batch, and
after correction, no relationship between technical variability and heritability
estimates is seen (Figure S6A). We also assessed the biological variability
over time in an unrelated cohort by calculating coefficients of variance (CVs)
from longitudinal samples drawn once yearly for 2–5 years. No relationship be-
tween longitudinal CVs and estimated heritability was found (Figure S6B).
Identification of Pairwise Dependencies between Measurements
and the Creation of an Immune Network Model
To identify meaningful relationships between measurements, we used the
recently developed non-paranormal SKEPTIC approach (Liu et al., 2012),
with a transformed Spearman/rank correlation matrix as input. To make the
network model interpretable, we pursued sparse precision matrices with a
graphical lasso approach penalizing non-zero entries in the matrix (Friedman
et al., 2008). A zero entry in the precision matrix encodes conditional indepen-
dencies of pairs of measurements given the state of all other measurements
and is less sensitive to spurious indirect connections as compared to simple
correlation analyses. To validate the inferred structural relationships, two tests
were performed. (1) A permutation of samples on per phenotype basis was
done to obtain null distributions for entries of the precision matrix. By repeat-
edly producing permuted samples and running our procedure on those sam-
ples, we obtain a distribution of precision matrices that is mostly dominated
by very sparse, diagonal matrices but that also has occurrences of precision
matrices that have non-zero entries. The non-zero entries thus obtained
were false positive, and hence we can estimate which entries obtained on
the actual data exceed the size of these false positives. (2) Given relative infre-
quent occurrences of non-zero entries when fitting sparse precision matrices,
we opted to estimate confidence intervals for each entry in the precision
matrix. We deemed entries whose confidence interval contained 0 insignifi-
cant. To obtain these confidence intervals, we performed bootstrap analysis
by resampling the real samples.
CMV Serology
CMV serology was determined using a commercially available ELISA kit (CMV
IgG, Gold Standard Diagnostics) as per manufacturer’s instructions. In brief,
sera stored at�80�Cwere thawed to room temperature (20–25�C) and diluted
1:51 in kit diluent. Diluted samples were added to wells coated with CMV
antigen from strain AD169 and were incubated at room temperature for
30 min. Wells were washed and drained, followed by the addition of goat
anti-human IgG antibodies labeled with calf alkaline phosphatase, and incu-
bated at room temperature for 30 min. Wells were again washed and drained,
followed by addition of p-nitrophenyl phosphate substrate, and incubated at
room temperature for 30 min. After the addition of 0.5 M trisodium phosphate
stop solution, the absorbance of each well at 405 nm was read and results
analyzed using the manufacturer’s instructions.
MZ Twin-Twin Correlations
All measurements performed in the youngest set of MZ twin pairs (<20 years)
and oldest MZ twin pairs (>60 years) was extracted, and Spearman’s rank
correlation coefficients were calculated and compared between these inde-
pendent groups for every measurement made. Similarly, CMV serologically
negative/negative MZ-twin pairs were compared to CMV positive/negative
(discordant twins).
SUPPLEMENTAL INFORMATION
Supplemental Information includes six figures, seven tables, and two data files
and can be found with this article online at http://dx.doi.org/10.1016/j.cell.
2014.12.020.
AUTHOR CONTRIBUTIONS
P.B. and V.J. performed all analyses. T.G. helped with the network analysis.
S.B. and S.S.-O. provided input on heritability estimates. All data was gener-
ated by the Human Immune Monitoring Center under the direction of H.T.M.
except for the 2009 HAI data generated by D.F. and CMV serology by
C.J.L.A. G.E.S. directs the twin registry and provided input on the twin ana-
lyses, and C.L.D. was responsible for regulatory approvals, protocol design,
Cell 160, 37–47, January 15, 2015 ª2015 Elsevier Inc. 45

study conduct, and clinical data management. P.B. and M.M.D. wrote the pa-
per with input from co-authors.
ACKNOWLEDGMENTS
The authors thank all members of the Davis and Y. Chien labs for inspiring dis-
cussions and the staff at the Human Immune Monitoring Center and the Stan-
ford-LPCH Vaccine Program for sample collection and data generation.
Thanks also to Rob Tibshirani and Chiara Sabatti for input on statistical ana-
lyses. Twins were recruited from Twin Research Registry at SRI International,
Menlo Park, CA and the authors wish to thank the following individuals: Mary
McElroy, Lisa Jack, Ruth Krasnow, Jill Rubin, Dina Basin, Lucia Panini, and
Marty Ritchey. The Stanford-LPCH program thanks Project Manager Sally
Mackey; Research Nurses Susan Swope, Tony Trela, and Cynthia Walsh;
phlebotomist Michele Ugur; and CRAs Ashima Goel, Thu Quan, Kyrsten
Spann, Sushil Batra, Isaac Chang, and Raquel Fleischmann. The authors
also wish to thank the contributions and commitment to science provided by
the twins through their ongoing participation in the Registry and various
research studies. This work was supported by NIH grants U19 AI090019,
U19 AI057229 and the Howard Hughes Medical Institute to M.M.D. Additional
support was provided by the Wenner-Gren Foundation and Sweden-America
Foundation to P.B, funds to the Twin Registry were provided through SRI’s
Center for Health Sciences and through grants from the NIH including
DA011170, DA023063, AI090019 and ES022153. The Clinical and Transla-
tional Research Unit at Stanford University Hospital was supported by an
NIH/NCRR CTSA award number UL1 RR025744.
Received: June 26, 2014
Revised: October 20, 2014
Accepted: November 14, 2014
Published: January 15, 2015
REFERENCES
Alcaıs, A., Abel, L., and Casanova, J.-L. (2009). Human genetics of infectious
diseases: between proof of principle and paradigm. J. Clin. Invest. 119, 2506–
2514.
Alcaıs, A., Quintana-Murci, L., Thaler, D.S., Schurr, E., Abel, L., and Casanova,
J.-L. (2010). Life-threatening infectious diseases of childhood: single-gene
inborn errors of immunity? Ann. N Y Acad. Sci. 1214, 18–33.
Bell, J.T., and Spector, T.D. (2011). A twin approach to unraveling epigenetics.
Trends Genet. 27, 116–125.
Chidrawar, S., Khan, N., Wei, W., McLarnon, A., Smith, N., Nayak, L., and
Moss, P. (2009). Cytomegalovirus-seropositivity has a profound influence on
the magnitude of major lymphoid subsets within healthy individuals. Clin.
Exp. Immunol. 155, 423–432.
Clementi, M., Forabosco, P., Amadori, A., Zamarchi, R., De Silvestro, G., Di
Gianantonio, E., Chieco-Bianchi, L., and Tenconi, R. (1999). CD4 and CD8 T
lymphocyte inheritance. Evidence for major autosomal recessive genes.
Hum. Genet. 105, 337–342.
Cooper, G.S., Miller, F.W., and Pandey, J.P. (1999). The role of genetic factors
in autoimmune disease: implications for environmental research. Environ.
Health Perspect. 107 (Suppl 5), 693–700.
Davis, M.M. (2008). A prescription for human immunology. Immunity 29,
835–838.
de Craen, A.J.M., Posthuma, D., Remarque, E.J., van den Biggelaar, A.H.J.,
Westendorp, R.G.J., and Boomsma, D.I. (2005). Heritability estimates of innate
immunity: an extended twin study. Genes Immun. 6, 167–170.
Dorshkind, K., Montecino-Rodriguez, E., and Signer, R.A.J. (2009). The ageing
immune system: is it ever too old to become young again? Nat. Rev. Immunol.
9, 57–62.
Duffy, D., Rouilly, V., Libri, V., Hasan, M., Beitz, B., David, M., Urrutia, A., Bi-
siaux, A., Labrie, S.T., Dubois, A., et al.; Milieu Interieur Consortium (2014).
Functional analysis via standardized whole-blood stimulation systems defines
46 Cell 160, 37–47, January 15, 2015 ª2015 Elsevier Inc.
the boundaries of a healthy immune response to complex stimuli. Immunity 40,
436–450.
Evans, D.M., Frazer, I.H., and Martin, N.G. (1999). Genetic and environmental
causes of variation in basal levels of blood cells. Twin Res. 2, 250–257.
Evans, D.M., Zhu, G., Duffy, D.L., Frazer, I.H., Montgomery, G.W., and Martin,
N.G. (2004). A major quantitative trait locus for CD4-CD8 ratio is located on
chromosome 11. Genes Immun. 5, 548–552.
Fraga, M.F., Ballestar, E., Paz, M.F., Ropero, S., Setien, F., Ballestar, M.L.,
Heine-Suner, D., Cigudosa, J.C., Urioste, M., Benitez, J., et al. (2005). Epige-
netic differences arise during the lifetime of monozygotic twins. Proc. Natl.
Acad. Sci. USA 102, 10604–10609.
Francis, T.J. (1960). On the doctrine of original antigenic sin. Proc. Am. Philos.
Soc. 104, 572–578.
Friedman, J., Hastie, T., and Tibshirani, R. (2008). Sparse inverse covariance
estimation with the graphical lasso. Biostatistics 9, 432–441.
Furman, D., Hejblum, B.P., Simon, N., Jojic, V., Dekker, C.L., Thiebaut, R., Tib-
shirani, R.J., and Davis, M.M. (2014). Systems analysis of sex differences re-
veals an immunosuppressive role for testosterone in the response to influenza
vaccination. Proc. Natl. Acad. Sci. USA 111, 869–874.
Glanville, J., Kuo, T.C., von Budingen, H.C., Guey, L., Berka, J., Sundar, P.D.,
Huerta, G., Mehta, G.R., Oksenberg, J.R., Hauser, S.L., et al. (2011). Naive
antibody gene-segment frequencies are heritable and unaltered by chronic
lymphocyte ablation. Proc. Natl. Acad. Sci. USA 108, 20066–20071.
Gregersen, P.K., Amos, C.I., Lee, A.T., Lu, Y., Remmers, E.F., Kastner, D.L.,
Seldin, M.F., Criswell, L.A., Plenge, R.M., Holers, V.M., et al. (2009). REL, en-
coding a member of the NF-kappaB family of transcription factors, is a newly
defined risk locus for rheumatoid arthritis. Nat. Genet. 41, 820–823.
Hohler, T., Reuss, E., Evers, N., Dietrich, E., Rittner, C., Freitag, C.M., Vollmar,
J., Schneider, P.M., and Fimmers, R. (2002). Differential genetic determination
of immune responsiveness to hepatitis B surface antigen and to hepatitis A
virus: a vaccination study in twins. Lancet 360, 991–995.
Hooper, L.V., Littman, D.R., and Macpherson, A.J. (2012). Interactions be-
tween the microbiota and the immune system. Science 336, 1268–1273.
Jablonski, W. (1922). A contribution to theheredity of refraction in human eyes.
Arch. Augenheilk 91, 308–328.
Jacobson, R.M., Ovsyannikova, I.G., Targonski, P.V., and Poland, G.A. (2007).
Studies of twins in vaccinology. Vaccine 25, 3160–3164.
Krasnow, R.E., Jack, L.M., Lessov-Schlaggar, C.N., Bergen, A.W., and Swan,
G.E. (2013). The Twin Research Registry at SRI International. Twin Res. Hum.
Genet. 16, 463–470.
Krutzik, P.O., andNolan, G.P. (2006). Fluorescent cell barcoding in flow cytom-
etry allows high-throughput drug screening and signaling profiling. Nat.
Methods 3, 361–368.
Ku, C.-L., von Bernuth, H., Picard, C., Zhang, S.Y., Chang, H.H., Yang, K.,
Chrabieh, M., Issekutz, A.C., Cunningham, C.K., Gallin, J., et al. (2007). Selec-
tive predisposition to bacterial infections in IRAK-4-deficient children: IRAK-4-
dependent TLRs are otherwise redundant in protective immunity. J. Exp. Med.
204, 2407–2422.
Lee, Y.C., Newport, M.J., Goetghebuer, T., Siegrist, C.-A., Weiss, H.A.,
Pollard, A.J., and Marchant, A.; MRC Twin Study Group (2006). Influence of
genetic and environmental factors on the immunogenicity of Hib vaccine in
Gambian twins. Vaccine 24, 5335–5340.
Li, S., Rouphael, N., Duraisingham, S., Romero-Steiner, S., Presnell, S., Davis,
C., Schmidt, D.S., Johnson, S.E., Milton, A., Rajam, G., et al. (2014). Molecular
signatures of antibody responses derived from a systems biology study of five
human vaccines. Nat. Immunol. 15, 195–204.
Liu, H., Han, F., Yuan, M., Lafferty, J., and Wasserman, L. (2012). High-dimen-
sional semiparametricGaussian copula graphicalmodels. Ann. Stat. 40, 2293–
2326.
Maecker, H.T., Rinfret, A., D’Souza, P., Darden, J., Roig, E., Landry, C., Hayes,
P., Birungi, J., Anzala, O., Garcia, M., et al. (2005). Standardization of cytokine
flow cytometry assays. BMC Immunol. 6, 13.

Mazmanian, S.K., Liu, C.H., Tzianabos, A.O., and Kasper, D.L. (2005). An
immunomodulatory molecule of symbiotic bacteria directs maturation of the
host immune system. Cell 122, 107–118.
Morahan, G., Huang, D., Wu, M., Holt, B.J., White, G.P., Kendall, G.E., Sly,
P.D., and Holt, P.G. (2002). Association of IL12B promoter polymorphism
with severity of atopic and non-atopic asthma in children. Lancet 360,
455–459.
Nair, R.P., Duffin, K.C., Helms, C., Ding, J., Stuart, P.E., Goldgar, D., Gudjons-
son, J.E., Li, Y., Tejasvi, T., Feng, B.-J., et al.; Collaborative Association Study
of Psoriasis (2009). Genome-wide scan reveals association of psoriasis with
IL-23 and NF-kappaB pathways. Nat. Genet. 41, 199–204.
Newport, M.J., Goetghebuer, T., Weiss, H.A., Whittle, H., Siegrist, C.-A., and
Marchant, A.; MRC Gambia Twin Study Group (2004). Genetic regulation of
immune responses to vaccines in early life. Genes Immun. 5, 122–129.
O’Connor, D., and Pollard, A.J. (2013). Characterizing vaccine responses us-
ing host genomic and transcriptomic analysis. Clin. Infect. Dis. 57, 860–869.
Okada, Y., Hirota, T., Kamatani, Y., Takahashi, A., Ohmiya, H., Kumasaka, N.,
Higasa, K., Yamaguchi-Kabata, Y., Hosono, N., Nalls, M.A., et al. (2011). Iden-
tification of nine novel loci associated with white blood cell subtypes in a
Japanese population. PLoS Genet. 7, e1002067.
Orru, V., Steri, M., Sole, G., Sidore, C., Virdis, F., Dei, M., Lai, S., Zoledziewska,
M., Busonero, F., Mulas, A., et al. (2013). Genetic variants regulating immune
cell levels in health and disease. Cell 155, 242–256.
Querec, T.D., Akondy, R.S., Lee, E.K., Cao, W., Nakaya, H.I., Teuwen, D.,
Pirani, A., Gernert, K., Deng, J., Marzolf, B., et al. (2009). Systems biology
approach predicts immunogenicity of the yellow fever vaccine in humans.
Nat. Immunol. 10, 116–125.
Reiner, A.P., Lettre, G., Nalls, M.A., Ganesh, S.K., Mathias, R., Austin, M.A.,
Dean, E., Arepalli, S., Britton, A., Chen, Z., et al. (2011). Genome-wide associ-
ation study of white blood cell count in 16,388 African Americans: the conti-
nental origins and genetic epidemiology network (COGENT). PLoS Genet. 7,
e1002108.
Rijsdijk, F.V., and Sham, P.C. (2002). Analytic approaches to twin data using
structural equation models. Brief. Bioinform. 3, 119–133.
Sasaki, S., He, X.-S., Holmes, T.H., Dekker, C.L., Kemble, G.W., Arvin, A.M.,
and Greenberg, H.B. (2008). Influence of prior influenza vaccination on anti-
body and B-cell responses. PLoS ONE 3, e2975.
Sekaly, R.-P. (2008). The failed HIV Merck vaccine study: a step back or a
launching point for future vaccine development? J. Exp. Med. 205, 7–12.
Su, L.F., Kidd, B.A., Han, A., Kotzin, J.J., and Davis, M.M. (2013). Virus-specific
CD4(+) memory-phenotype T cells are abundant in unexposed adults. Immu-
nity 38, 373–383.
Sylwester, A.W., Mitchell, B.L., Edgar, J.B., Taormina, C., Pelte, C., Ruchti,
F., Sleath, P.R., Grabstein, K.H., Hosken, N.A., Kern, F., et al. (2005).
Broadly targeted human cytomegalovirus-specific CD4+ and CD8+ T cells
dominate the memory compartments of exposed subjects. J. Exp. Med.
202, 673–685.
Tan, P.-L., Jacobson, R.M., Poland, G.A., Jacobsen, S.J., and Pankratz, V.S.
(2001). Twin studies of immunogenicity—determining the genetic contribution
to vaccine failure. Vaccine 19, 2434–2439.
Todd, J.A. (2010). Etiology of type 1 diabetes. Immunity 32, 457–467.
Tsang, J.S., Schwartzberg, P.L., Kotliarov, Y., Biancotto, A., Xie, Z., Germain,
R.N., Wang, E., Olnes, M.J., Narayanan, M., Golding, H., et al.; Baylor
HIPC Center; CHI Consortium (2014). Global analyses of human immune vari-
ation reveal baseline predictors of postvaccination responses. Cell 157,
499–513.
Villeda, S.A., andWyss-Coray, T. (2013). The circulatory systemic environment
as a modulator of neurogenesis and brain aging. Autoimmun. Rev. 12,
674–677.
von Bernuth, H., Picard, C., Jin, Z., Pankla, R., Xiao, H., Ku, C.L., Chrabieh, M.,
Mustapha, I.B., Ghandil, P., Camcioglu, Y., et al. (2008). Pyogenic bacterial
infections in humans with MyD88 deficiency. Science 321, 691–696.
Wills, M., Akbar, A., Beswick, M., Bosch, J.A., Caruso, C., Colonna-Romano,
G., Dutta, A., Franceschi, C., Fulop, T., Gkrania-Klotsas, E., et al. (2011).
Report from the second cytomegalovirus and immunosenescence workshop.
Immun. Ageing 8, 10.
Yan, K., Cai, W., Cao, F., Sun, H., Chen, S., Xu, R., Wei, X., Shi, X., and Yan, W.
(2013). Genetic effects have a dominant role on poor responses to infant vacci-
nation to hepatitis B virus. J. Hum. Genet. 58, 293–297.
Cell 160, 37–47, January 15, 2015 ª2015 Elsevier Inc. 47


![Strain Dependent Variation of Immune Responses to A ......molecular patterns to immune cells [1,2]. So far, studies on immune responses to fungi have for the vast majority used purified](https://img.pdfslide.net/doc/110x75/60f8a8a59403dc559f7eb56c/strain-dependent-variation-of-immune-responses-to-a-molecular-patterns-to.jpg)

![University of Groningen Integrative omics to understand ......Aguirre Gamboa, R. (2019). Integrative omics to understand human immune variation. [Groningen]: Integrative omics to understand](https://img.pdfslide.net/doc/110x75/60c909a6cf591238ec3da4b4/university-of-groningen-integrative-omics-to-understand-aguirre-gamboa.jpg)
![arXiv:1711.08238v6 [cs.CV] 3 Jan 2018 vision, since it is a ected by rapid move-ment, illumination variation, occlusion and viewpoint variation largely. In the early study, researchers](https://img.pdfslide.net/doc/110x75/5b3591827f8b9a5f288bb066/arxiv171108238v6-cscv-3-jan-2018-vision-since-it-is-a-ected-by-rapid-move-ment.jpg)


![Role of CXCR3/CXCL10 Axis in Immune Cell Recruitment into ... fileIFNc [2]. This abundance of LP Th1 cells is largely responsible for the maintenance of an appropriate environment](https://img.pdfslide.net/doc/110x75/5ce8f8fd88c993e8488de8e4/role-of-cxcr3cxcl10-axis-in-immune-cell-recruitment-into-2-this-abundance.jpg)