Embed Size (px)
Citation preview
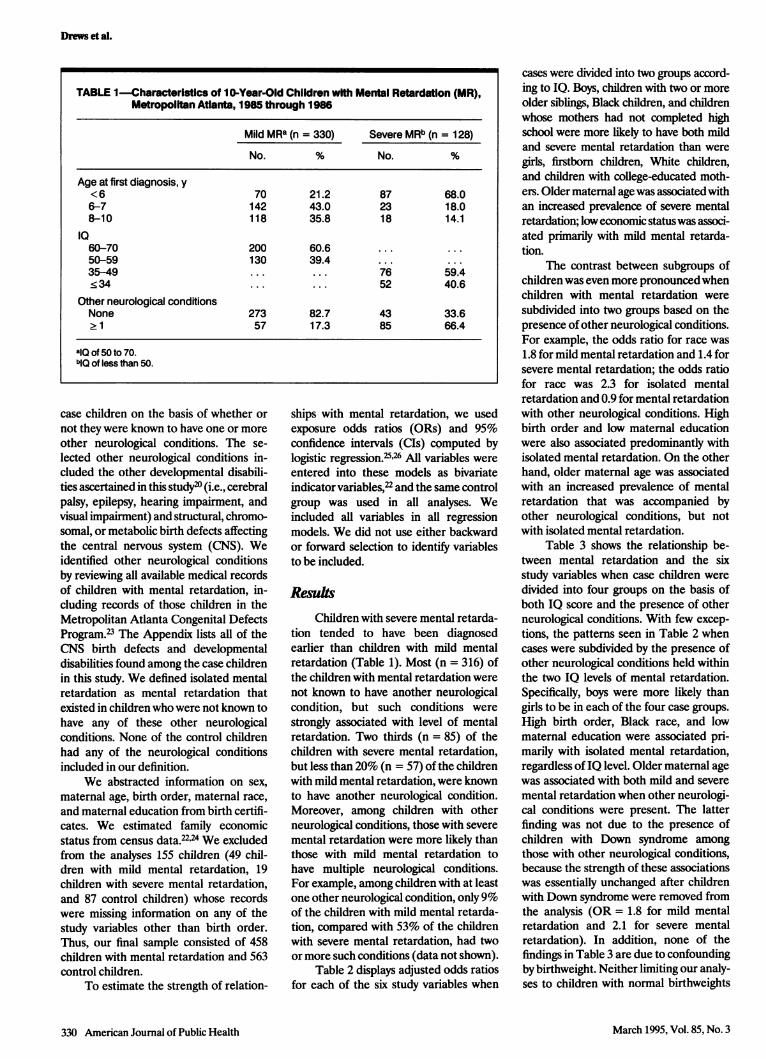
Variation in the Influence of SelectedSociodemographic Risk Factors forMental Retardation
Carolyn D. Drews, PhD, Marshalyn Yeargin-Allsopp, MD, Pierre Decoufle, ScD,and Catherine C. Murphy, MPH
IntroductionPrevious studies have consistently
shown that individuals of low socioeco-nomic status are overrepresented amongthose with mild mental retardation (i.e.,those having an intelligence quotient [IQ]of 50 to 70).1-' Some investigators haveeven suggested that mild mental retarda-tion rarely occurs among individuals fromthe upper socioeconomic groups unlessother underlying neurological conditionsare present.2'7-9 In contrast, a relationshipbetween severe mental retardation (i.e.,an IQ of less than 50) and socioeconomicstatus has not been consistently found.'1'5One plausible explanation for the ob-served differences in the effect of socioeco-nomic factors on the occurrence of mildand severe mental retardation is that theyare different entities.'-9'15
Defining subtypes of mental retarda-tion on the basis of IQ level alone may notbe the best method of distinguishingbetween those types of mental retardationthat are related to socioeconomic statusand those that are not. Distinguishingsubgroups of mental retardation on thebasis of an IQ level of 50 is somewhatarbitrary.'6'17 Further, a single cause ofmental retardation, such as Down syn-drome, may result in both mild and severemental retardation.18 Thus, in etiologicalstudies, categorizing mental retardationaccording to criteria other than, or inaddition to, IQ may be preferable. Forexample, risk factors for mental retarda-tion may be different for children whoalso have other developmental disabilitiesor other neurological conditions and forchildren who have only mental retarda-tion.23l'"2
The goal of this study was to investi-gate the relationship between selectedsocioeconomic and demographic factors
and subgroups of mental retardation.Further, we hoped to identify types ofmental retardation with similar epidemio-logical patterns.
MethodsThe data for these analyses are from
the Metropolitan Atlanta DevelopmentalDisabilities Study, which included a case-control study of mental retardation among10-year-old children born in metropolitanAtlanta and living there in 1985 or1986.2'22 For this analysis, case children(n = 526) were children with an IQ of 70or less and were identified by reviewingrecords at public schools and varioushealth and social service agencies."2 Con-trol children (n = 650) were randomlyselected from a listing of 10-year-oldchildren attending public school in theAtlanta area in 1985 or 1986.22
Initially, we used IQ level to dividechildren with mental retardation into twogroups: those with mild mental retarda-tion (defined as an IQ from 50 to 70;n = 379) and those with severe mentalretardation (defined as an IQ of less than50; n = 147). Subsequently, we divided
Carolyn D. Drews is with the Division ofEpidemiology, Emory University School ofPublic Health, Atlanta, Ga. Marshalyn Yeargin-Allsopp, Pierre Decoufle, and Catherine C.Murphy are with the Division of Birth Defectsand Developmental Disabilities, Centers forDisease Control and Prevention, Atlanta, Ga.At the time of the study. Catherine C. Murphywas with the Office of Epidemiology, GeorgiaDepartment of Human Resources, Atlanta.
Requests for reprints should be sent to
Carolyn D. Drews, PhD, Division of Epidemiol-ogy, Emory University School of Public Health,1599 Clifton Rd. NE, Atlanta, GA 30329.
This paper was accepted July 26, 1994.Editor's Note. See related editorial by
Zigler (p 302) and annotation by Satcher (p304) in this issue.
American Journal of Public Health 329
Drews et al.
case children on the basis of whether or
not they were known to have one or more
other neurological conditions. The se-
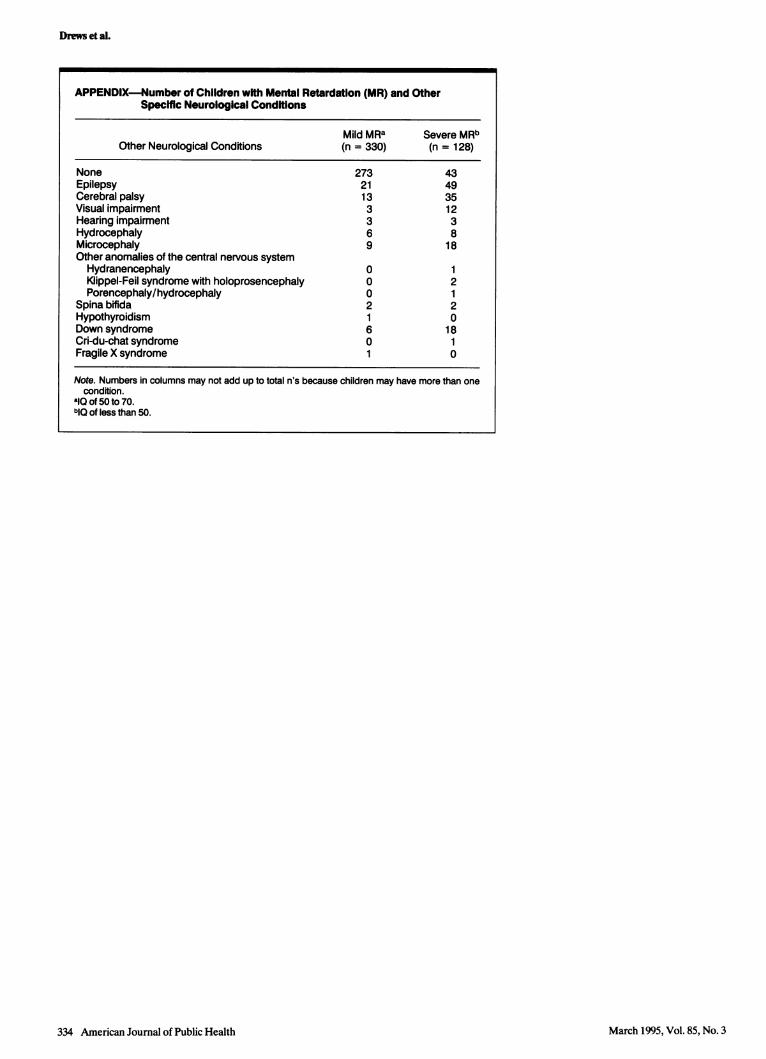
lected other neurological conditions in-cluded the other developmental disabili-ties ascertained in this study2O (i.e., cerebralpalsy, epilepsy, hearing impairment, andvisual impairment) and structural, chromo-somal, or metabolic birth defects affectingthe central nervous system (CNS). Weidentified other neurological conditionsby reviewing all available medical recordsof children with mental retardation, in-cluding records of those children in theMetropolitan Atlanta Congenital DefectsProgram.23 The Appendix lists all of theCNS birth defects and developmentaldisabilities found among the case childrenin this study. We defined isolated mentalretardation as mental retardation thatexisted in children who were not known tohave any of these other neurologicalconditions. None of the control childrenhad any of the neurological conditionsincluded in our definition.
We abstracted information on sex,maternal age, birth order, maternal race,and maternal education from birth certifi-cates. We estimated family economicstatus from census data.2224 We excludedfrom the analyses 155 children (49 chil-dren with mild mental retardation, 19children with severe mental retardation,and 87 control children) whose recordswere missing information on any of thestudy variables other than birth order.Thus, our final sample consisted of 458children with mental retardation and 563control children.
To estimate the strength of relation-
ships with mental retardation, we usedexposure odds ratios (ORs) and 95%confidence intervals (CIs) computed bylogistic regression.253 All variables were
entered into these models as bivariateindicator variables,22 and the same controlgroup was used in all analyses. Weincluded all variables in all regressionmodels. We did not use either backwardor forward selection to identify variablesto be included.
ResultsChildren with severe mental retarda-
tion tended to have been diagnosedearlier than children with mild mentalretardation (Table 1). Most (n = 316) ofthe children with mental retardation werenot known to have another neurologicalcondition, but such conditions were
strongly associated with level of mentalretardation. Two thirds (n = 85) of thechildren with severe mental retardation,but less than 20% (n = 57) of the childrenwith mild mental retardation, were knownto have another neurological condition.Moreover, among children with otherneurological conditions, those with severe
mental retardation were more likely thanthose with mild mental retardation tohave multiple neurological conditions.For example, among children with at leastone other neurological condition, only 9%of the children with mild mental retarda-tion, compared with 53% of the childrenwith severe mental retardation, had twoor more such conditions (data not shown).
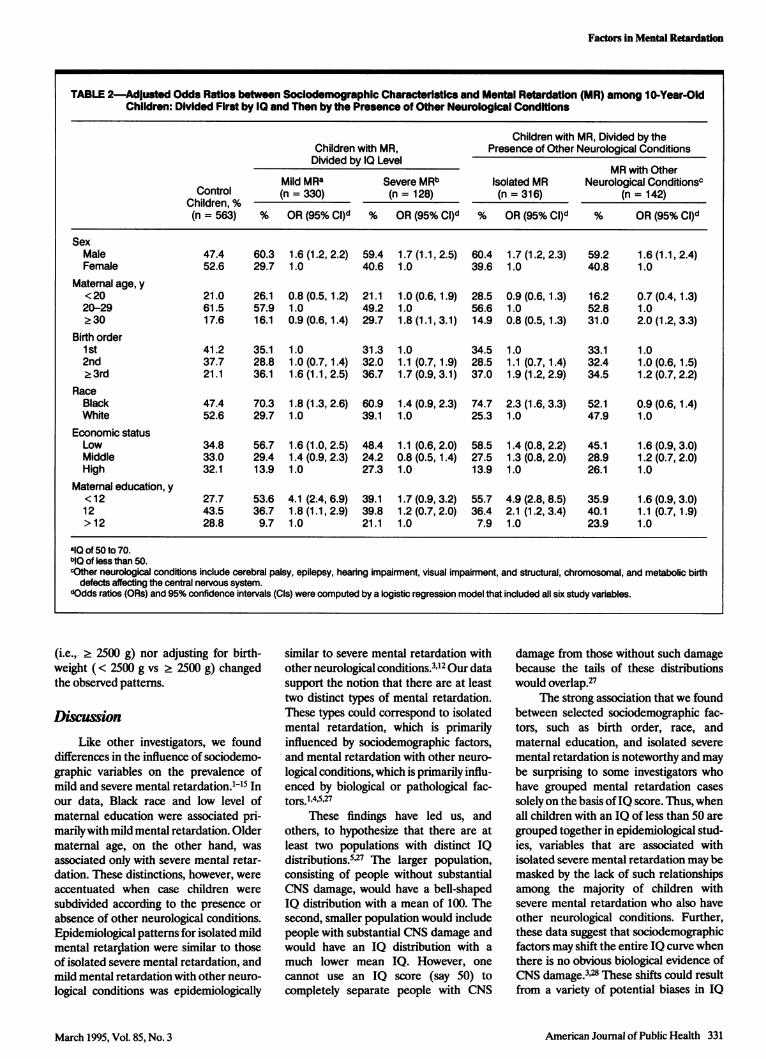
Table 2 displays adjusted odds ratiosfor each of the six study variables when
cases were divided into two groups accord-ing to IQ. Boys, children with two or more
older siblings, Black children, and childrenwhose mothers had not completed highschool were more likely to have both mildand severe mental retardation than were
girls, firstborn children, White children,and children with college-educated moth-ers. Older maternal age was associated withan increased prevalence of severe mentalretardation; low economic statuswas associ-ated primarily with mild mental retarda-tion.
The contrast between subgroups ofchildren was even more pronounced whenchildren with mental retardation were
subdivided into two groups based on thepresence of other neurological conditions.For example, the odds ratio for race was
1.8 for mild mental retardation and 1.4 forsevere mental retardation; the odds ratiofor race was 2.3 for isolated mentalretardation and 0.9 for mental retardationwith other neurological conditions. Highbirth order and low maternal educationwere also associated predominantly withisolated mental retardation. On the otherhand, older maternal age was associatedwith an increased prevalence of mentalretardation that was accompanied byother neurological conditions, but notwith isolated mental retardation.
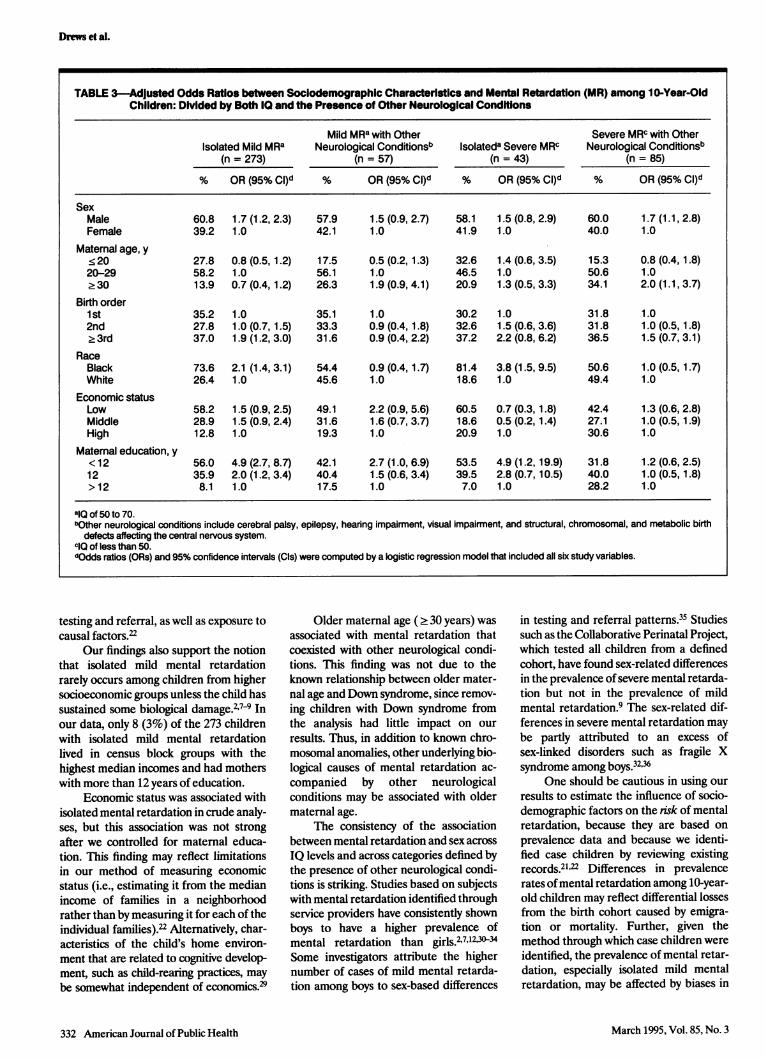
Table 3 shows the relationship be-tween mental retardation and the sixstudy variables when case children were
divided into four groups on the basis ofboth IQ score and the presence of otherneurological conditions. With few excep-
tions, the patterns seen in Table 2 whencases were subdivided by the presence ofother neurological conditions held withinthe two IQ levels of mental retardation.Specifically, boys were more likely thangirls to be in each of the four case groups.
High birth order, Black race, and lowmaternal education were associated pri-marily with isolated mental retardation,regardless of IQ level. Older maternal agewas associated with both mild and severe
mental retardation when other neurologi-cal conditions were present. The latterfinding was not due to the presence ofchildren with Down syndrome amongthose with other neurological conditions,because the strength of these associationswas essentially unchanged after childrenwith Down syndrome were removed fromthe analysis (OR = 1.8 for mild mentalretardation and 2.1 for severe mentalretardation). In addition, none of thefindings in Table 3 are due to confounding
by birthweight. Neither limiting our analy-ses to children with normal birthweights
330 American Journal of Public Health
TABLE 1-Characteristics of 10-Year-Old Children with Mental Retardation (MR),Metropoiftan Atlanta, 1985 through 1986
Mild MRa (n = 330) Severe MRb (n = 128)
No. % No. %
Age at first diagnosis, y< 6 70 21.2 87 68.06-7 142 43.0 23 18.08-10 118 35.8 18 14.1
IQ60-70 200 60.6 ... ...
50-59 130 39.4 ... ...
35-49 ... ... 76 59.4< 34 ... ... 52 40.6
Other neurological conditionsNone 273 82.7 43 33.6. 1 57 17.3 85 66.4
alQ of 50 to 70.biQ of less than 50.
March 1995, Vol. 85, No. 3
Factors in Mental Retardation
(i.e.,- 2 2500 g) nor adjusting for birth-weight (< 2500 g vs 2 2500 g) changedthe observed patterns.
DiscussionLike other investigators, we found
differences in the influence of sociodemo-graphic variables on the prevalence ofmild and severe mental retardation.1-15 Inour data, Black race and low level ofmaternal education were associated pri-marilywith mild mental retardation. Oldermaternal age, on the other hand, was
associated only with severe mental retar-dation. These distinctions, however, were
accentuated when case children were
subdivided according to the presence or
absence of other neurological conditions.Epidemiological patterns for isolated mildmental retardation were similar to thoseof isolated severe mental retardation, andmild mental retardation with other neuro-logical conditions was epidemiologically
similar to severe mental retardation withother neurological conditions.3'12 Our datasupport the notion that there are at leasttwo distinct types of mental retardation.These types could correspond to isolatedmental retardation, which is primarilyinfluenced by sociodemographic factors,and mental retardation with other neuro-
logical conditions, which is primarily influ-enced by biological or pathological fac-tors.l,4A,27
These findings have led us, andothers, to hypothesize that there are atleast two populations with distinct IQdistributions.527 The larger population,consisting of people without substantialCNS damage, would have a bell-shapedIQ distribution with a mean of 100. Thesecond, smaller population would includepeople with substantial CNS damage andwould have an IQ distribution with a
much lower mean IQ. However, one
cannot use an IQ score (say 50) tocompletely separate people with CNS
damage from those without such damagebecause the tails of these distributionswould overlap.27
The strong association that we foundbetween selected sociodemographic fac-tors, such as birth order, race, andmaternal education, and isolated severe
mental retardation is noteworthy and maybe surprising to some investigators whohave grouped mental retardation cases
solely on the basis ofIQ score. Thus, whenall children with an IQ of less than 50 are
grouped together in epidemiological stud-ies, variables that are associated withisolated severe mental retardation may bemasked by the lack of such relationshipsamong the majority of children withsevere mental retardation who also haveother neurological conditions. Further,these data suggest that sociodemographicfactors may shift the entire IQ curve whenthere is no obvious biological evidence ofCNS damage.3 28 These shifts could resultfrom a variety of potential biases in IQ
American Journal of Public Health 331
TABLE 2-Adjusted Odds Ratios between Soclodemographic Characteristics and Mental Retardation (MR) among 10-Year-OldChildren: Divided First by 10 and Then by the Presence of Other Neurological Conditions
Children with MR, Divided by theChildren with MR, Presence of Other Neurological ConditionsDivided by IQ Level
MR with OtherMild MRa Severe MRb Isolated MR Neurological Conditionsc
Control (n = 330) (n = 128) (n = 316) (n = 142)Children, %(n = 563) % OR (95% CI)d % OR (95% CI)d % OR (95% CI)d % OR (95% CI)d
SexMale 47.4 60.3 1.6 (1.2, 2.2) 59.4 1.7 (1.1,2.5) 60.4 1.7 (1.2, 2.3) 59.2 1.6 (1.1, 2.4)Female 52.6 29.7 1.0 40.6 1.0 39.6 1.0 40.8 1.0
Maternal age, y<20 21.0 26.1 0.8 (0.5,1.2) 21.1 1.0 (0.6,1.9) 28.5 0.9 (0.6,1.3) 16.2 0.7 (0.4, 1.3)20-29 61.5 57.9 1.0 49.2 1.0 56.6 1.0 52.8 1.0.30 17.6 16.1 0.9 (0.6,1.4) 29.7 1.8 (1.1,3.1) 14.9 0.8 (0.5,1.3) 31.0 2.0 (1.2,3.3)
Birth order1st 41.2 35.1 1.0 31.3 1.0 34.5 1.0 33.1 1.02nd 37.7 28.8 1.0 (0.7,1.4) 32.0 1.1 (0.7,1.9) 28.5 1.1 (0.7,1.4) 32.4 1.0(0.6,1.5)>3rd 21.1 36.1 1.6 (1.1, 2.5) 36.7 1.7 (0.9,3.1) 37.0 1.9 (1.2,2.9) 34.5 1.2 (0.7,2.2)
RaceBlack 47.4 70.3 1.8 (1.3, 2.6) 60.9 1.4 (0.9, 2.3) 74.7 2.3 (1.6, 3.3) 52.1 0.9 (0.6,1.4)White 52.6 29.7 1.0 39.1 1.0 25.3 1.0 47.9 1.0
Economic statusLow 34.8 56.7 1.6 (1.0, 2.5) 48.4 1.1 (0.6, 2.0) 58.5 1.4 (0.8, 2.2) 45.1 1.6 (0.9, 3.0)Middle 33.0 29.4 1.4 (0.9, 2.3) 24.2 0.8 (0.5,1.4) 27.5 1.3 (0.8, 2.0) 28.9 1.2 (0.7, 2.0)High 32.1 13.9 1.0 27.3 1.0 13.9 1.0 26.1 1.0
Maternal education, y<12 27.7 53.6 4.1 (2.4, 6.9) 39.1 1.7 (0.9, 3.2) 55.7 4.9 (2.8, 8.5) 35.9 1.6 (0.9, 3.0)12 43.5 36.7 1.8 (1.1, 2.9) 39.8 1.2 (0.7, 2.0) 36.4 2.1 (1.2, 3.4) 40.1 1.1 (0.7, 1.9)> 12 28.8 9.7 1.0 21.1 1.0 7.9 1.0 23.9 1.0
alQ of 50 to 70.bIQ of less than 50.cOther neurological conditions include cerebral palsy, epilepsy, hearing impairment, visual impairment, and structural, chromosomal, and metabolic birth
defects affecting the central nervous system.dOdds ratios (ORs) and 95% confidence intervals (Cls) were computed by a logistic regression model that included all six study variables.
March 1995, Vol. 85, No. 3
Drews et al.
testing and referral, as well as exposure tocausal factors.22
Our findings also support the notionthat isolated mild mental retardationrarely occurs among children from highersocioeconomic groups unless the child hassustained some biological damage.2'7-9 Inour data, only 8 (3%) of the 273 childrenwith isolated mild mental retardationlived in census block groups with thehighest median incomes and had motherswith more than 12 years of education.
Economic status was associated withisolated mental retardation in crude analy-ses, but this association was not strongafter we controlled for maternal educa-tion. This finding may reflect limitationsin our method of measuring economicstatus (i.e., estimating it from the medianincome of families in a neighborhoodrather than by measuring it for each of theindividual families).22 Altematively, char-acteristics of the child's home environ-ment that are related to cognitive develop-ment, such as child-rearing practices, maybe somewhat independent of economics329
Older maternal age ( 30 years) wasassociated with mental retardation thatcoexisted with other neurological condi-tions. This finding was not due to theknown relationship between older mater-nal age and Down syndrome, since remov-ing children with Down syndrome fromthe analysis had little impact on our
results. Thus, in addition to known chro-mosomal anomalies, other underlying bio-logical causes of mental retardation ac-
companied by other neurologicalconditions may be associated with oldermaternal age.
The consistency of the associationbetween mental retardation and sex across
IQ levels and across categories defined bythe presence of other neurological condi-tions is striking. Studies based on subjectswith mental retardation identified throughservice providers have consistently shownboys to have a higher prevalence ofmental retardation than girls.27123034Some investigators attribute the highernumber of cases of mild mental retarda-tion among boys to sex-based differences
in testing and referral patterns.35 Studiessuch as the Collaborative Perinatal Project,which tested all children from a definedcohort, have found sex-related differencesin the prevalence of severe mental retarda-tion but not in the prevalence of mildmental retardation.9 The sex-related dif-ferences in severe mental retardation maybe partly attributed to an excess ofsex-linked disorders such as fragile Xsyndrome among boys.32,36
One should be cautious in using our
results to estimate the influence of socio-demographic factors on the risk of mentalretardation, because they are based on
prevalence data and because we identi-fied case children by reviewing existingrecords.21'22 Differences in prevalencerates ofmental retardation among 10-year-old children may reflect differential lossesfrom the birth cohort caused by emigra-tion or mortality. Further, given themethod through which case children wereidentified, the prevalence of mental retar-dation, especially isolated mild mentalretardation, may be affected by biases in
332 American Journal of Public Health
TABLE 3-Adjusted Odds Ratios between Sociodemographic Characteristics and Mental Retardation (MR) among 10-Year-OldChildren: Divided by Both IQ and the Presence of Other Neurological Conditions
Mild MRa with Other Severe MRC with OtherIsolated Mild MRa Neurological Conditionsb Isolateda Severe MRC Neurological Conditionsb
(n = 273) (n = 57) (n = 43) (n = 85)
% OR (95% CI)d % OR (95% CI)d % OR (95% CI)d % OR (95% CI)d
SexMale 60.8 1.7 (1.2, 2.3) 57.9 1.5 (0.9, 2.7) 58.1 1.5 (0.8, 2.9) 60.0 1.7 (1.1, 2.8)Female 39.2 1.0 42.1 1.0 41.9 1.0 40.0 1.0
Maternal age, y<20 27.8 0.8 (0.5,1.2) 17.5 0.5 (0.2,1.3) 32.6 1.4 (0.6, 3.5) 15.3 0.8 (0.4,1.8)20-29 58.2 1.0 56.1 1.0 46.5 1.0 50.6 1.0.30 13.9 0.7 (0.4,1.2) 26.3 1.9 (0.9,4.1) 20.9 1.3 (0.5,3.3) 34.1 2.0 (1.1, 3.7)
Birth order1st 35.2 1.0 35.1 1.0 30.2 1.0 31.8 1.02nd 27.8 1.0 (0.7,1.5) 33.3 0.9 (0.4,1.8) 32.6 1.5 (0.6, 3.6) 31.8 1.0 (0.5,1.8)23rd 37.0 1.9 (1.2, 3.0) 31.6 0.9 (0.4, 2.2) 37.2 2.2 (0.8, 6.2) 36.5 1.5 (0.7,3.1)
RaceBlack 73.6 2.1 (1.4, 3.1) 54.4 0.9 (0.4,1.7) 81.4 3.8 (1.5, 9.5) 50.6 1.0 (0.5,1.7)White 26.4 1.0 45.6 1.0 18.6 1.0 49.4 1.0
Economic statusLow 58.2 1.5 (0.9, 2.5) 49.1 2.2 (0.9, 5.6) 60.5 0.7 (0.3,1.8) 42.4 1.3 (0.6, 2.8)Middle 28.9 1.5 (0.9, 2.4) 31.6 1.6 (0.7, 3.7) 18.6 0.5 (0.2,1.4) 27.1 1.0 (0.5,1.9)High 12.8 1.0 19.3 1.0 20.9 1.0 30.6 1.0
Maternal education, y<12 56.0 4.9 (2.7, 8.7) 42.1 2.7 (1.0, 6.9) 53.5 4.9 (1.2,19.9) 31.8 1.2 (0.6, 2.5)12 35.9 2.0 (1.2, 3.4) 40.4 1.5 (0.6, 3.4) 39.5 2.8 (0.7,10.5) 40.0 1.0 (0.5,1.8)> 12 8.1 1.0 17.5 1.0 7.0 1.0 28.2 1.0
alQ of 50 to 70.bOther neurological conditions include cerebral palsy, epilepsy, hearing impairment, visual impairment, and structural, chromosomal, and metabolic birth
defects affecting the central nervous system.clO of less than 50.dOdds ratios (ORs) and 95% confidence intervals (Cls) were computed by a logistic regression model that included all six study variables.
March 1995, Vol. 85, No. 3
Factors in Mental Retardation
referral and placement practices.21'22'35However, the educational and racial differ-ences that we observed for isolated severemental retardation are unlikely to berelated to differential diagnostic andreferral patterns, because severe mentalretardation is unlikely to remain undiag-nosed even when no other neurologicalconditions are present.5
Finally, our results should not beinterpreted as suggesting that this classifi-cation scheme is optimal for epidemiologi-cal studies of mental retardation. It wouldbe preferable to study the epidemiology ofmental retardation that results from aspecific etiology. Adequate numbers ofsuch cases, however, may rarely be avail-able, and the etiology of mental retarda-tion remains unknown for the majority ofcases in many series.32037 In addition, inthe present study, children with diagnosessuch as fragile X syndrome may bemisclassified as having isolated mentalretardation because this condition wasnot well known or diagnosed amongchildren born in the mid-1970s. Even so,we found striking differences in riskfactors for isolated mental retardationand mental retardation accompanied byother neurological conditions. Thus, webelieve that more epidemiologically homo-geneous subgroups of persons with men-tal retardation can be identified by meansof biological criteria, such as the presenceor absence of other neurological condi-tions, than by IQ score alone. C]
AcknowledgmentsThis work was supported in part by funds fromthe Comprehensive Environmental Response,Compensation, and Liability Act Trust Fundthrough an interagency agreement with theAgency for Toxic Substances and DiseaseRegistry, Public Health Service, US Depart-ment of Health and Human Services.
The authors especially thank Drs JohnKiely, Zena Stein, and Jane Mercer for theircritical review of this report and earlier workpertaining to this project. We also thank MsNancy Doemberg for classifying birth certifi-cate addresses into census block groups.
References1. Penrose LS. Biology of Mental Defect.
London, England: Sidgwick & JacksonLtd; 1963.
2. Birch HG, Richardson SA, Baird D,Horobin G, Illsley R. Mental Subnormalityin the Community:A Clinical and Epidemio-logic Study. Baltimore, Md: Williams &Wilkins; 1970.
3. Broman S, Nichols PL, Shaughnessy P,Kennedy W. Retardation in Young Children:
A Developmental Study of Cognitive Deficit.Hillsdale, NJ: Lawrence Erlbaum Associ-ates; 1987.
4. Lewis EO. Report on an investigation intothe incidence of mental deficiency in sixareas, 1925-1927. Part 4. Report of theMental Deficiency Committee. London, En-gland: His Majesty's Stationery Office;1929.
5. Kushlick A, Blunden R. The epidemiologyof mental subnormality. In: Clarke AM,Clarke ADB, eds. Mental Deficiency: TheChangingOutlook New York, NY: Macmil-lan; 1974:31-81.
6. Kiely M. The prevalence ofmental retarda-tion. Epidemiol Rev. 1987;9:194-218.
7. Stein Z, Susser M. The families of dullchildren and classification for predictingcareers. BrJPrev Soc Med. 1960;14:83-88.
8. Stein Z, Susser M. Families of dull chil-dren. II. Identifying family types andsubcultures. III. Social selection by familytype. IV. Increments in intelligence. JMentSci. 1960;106:1296-1319.
9. Stein Z, Susser M. The social distributionof mental retardation. Am J Ment Def1963;67:811-821.
10. Cooper B, Lackus B. The social classbackground of mentally retarded children:a study in Mannheim. Soc Psychiatry.1984;19:3-12.
11. Bayley M. Mental Handicap and Commu-nity Care:A Study ofMentally HandicappedPeople in Sheffield. London, England: Rout-ledge & Kegan Paul; 1973.
12. Drillien CM, Jameson S, Wilkinson EM.Studies in mental handicaps, part 1: preva-lence and distribution by clinical type andseverity of defect. Arch Dis Child. 1966;41:528-538.
13. Martindale A. The distribution of thementally handicapped between districts ofa large city. Br J Ment Subnormality.1980;26:9-20.
14. Rantakallio P. Social class differences inmental retardation and subnormality. ScandJSoc Med. 1987;15:63-66.
15. Fryers T. The Epidemiology of SevereIntellectual Impairment. London, England:Academic Press; 1984.
16. Cooper B, Liepmann MC, Marker KR,Schieber PM. Definition of severe mentalretardation in school-age children: findingsof an epidemiologic study. Soc Psychiatry.1979;14:197-205.
17. Lipkin PH. Epidemiology of the develop-mental disabilities. In: Capute A, AccardoPJ, eds. Developmental Disabilities in In-fancy and Childhood. Baltimore, Md: PaulH. Brookes Publishing Co; 1991.
18. Carr J. Young Children with Down's Syn-drome. London, England: Butterworths;1975.
19. Robinson RO. Associated handicap andmild mental retardation. Ups J Med SciSuppl. 1987;44:99-102.
20. Yeargin-Allsopp M, Murphy CC, OakleyGP, Sikes RK, The Metropolitan AtlantaDevelopmental Disabilities Study Staff. Amultiple-source method for studying theprevalence of developmental disabilities inchildren: the Metropolitan Atlanta Devel-opmental Disabilities Study. Pediatrics.
1992;89:624-630. [Published erratum ap-pears in Pediatrics. 1992;90:1001.]
21. Murphy CC, Yeargin-Allsopp M, DecoufleP, Drews CD. The administrative preva-lence of mental retardation in 10-year-oldchildren in metropolitan Atlanta, 1985through 1987.Am JPublic Health. 1995;85:319-323.
22. Yeargin-Allsopp M, Drews CD, DecoufieP, Murphy CC. Mild mental retardation inBlack and White children in metropolitanAtlanta: a case-control study. Am J PublicHealth. 1995;85:324-328.
23. Edmonds LD, Layde PM, James LM, FlyntJW, Erickson JD, Oakley GP Jr. Congeni-tal malformations surveillance: two Ameri-can systems. IntJ Epidemiol. 1981;10:247-252.
24. Census Use Study: Health Information Sys-tem-II. Washington, DC: US Dept ofCommerce, Bureau of the Census; 1971.Report no. 12.
25. Harrell FE Jr. The LOGIST procedure. In:SUGI Supplemental Library User's Guide.Version 5 ed. Cary, NC: SAS Institute Inc;1986:269-293.
26. Kleinbaum DG, Kupper LL, MorgensternH. Epidemiologic Research: Principles andQuantitative Methods. Belmont, Calif: Life-time Learning Publications; 1982.
27. Zigler E. Familial mental retardation: acontinuing dilemma. Science. 1967;155:292-298.
28. Broman SH, Nichols PL, Kennedy WA.Preschool IQ: Prenatal and Early Develop-mental Correlates. Hillsdale, NJ: LawrenceErlbaum Associates; 1975.
29. Scarr S. IQ, Race, Social Class and Indi-vidual Differences. Hillsdale, NJ: LawrenceErlbaum Associates; 1981.
30. McLaren J, Bryson SE. Review of recentepidemiologic studies of mental retarda-tion: prevalence, associated disorders andetiology. Am J Ment Retard. 1987;92:243-254.
31. Munro JD. Epidemiology and the extent ofmental retardation. Psychiatric perspec-tives on mental retardation. Psychiatr ClinNorthAm. 1986;9:591-624.
32. Baird PA, Sadovnik AD. Mental retarda-tion in over half-a-million consecutive livebirths: an epidemiological study.AmJMentDefic. 1985;89:323-330.
33. Richardson SA, Katz M, Koller H. Sexdifferences in number of children adminis-tratively classified as mildly mentally re-tarded: an epidemiological review. Am JMentDefic. 1986;91:250-256.
34. Innes G, Kidd C, Ross HS. Mental subnor-mality in North East Scotland. BrJPsychia-try. 1968;114:35-41.
35. Mercer JR. Labeling the Mentally Retarded.Berkeley, Calif: University of CaliforniaPress; 1973.
36. Herbst DS, Miller JR. Nonspecific X-linked mental retardation, II: the fre-quency in British Columbia. Am J MedGenet. 1980;7:461-469.
37. Abramowicz HK, Richardson ST. Epidemi-ology of severe mental retardation inchildren: community studies. Am J MentDefic. 1975;80:18-39.
Continued
March 1995, Vol. 85, No. 3 American Journal of Public Health 333
Drews et al.
334 American Journal of Public Health
APPENDIX-Number of Children with Mental Retardation (MR) and OtherSpecific Neurological Conditions
Mild MRa Severe MRbOther Neurological Conditions (n = 330) (n = 128)
None 273 43Epilepsy 21 49Cerebral palsy 13 35Visual impairment 3 12Hearing impairment 3 3Hydrocephaly 6 8Microcephaly 9 18Other anomalies of the central nervous systemHydranencephaly 0 1lQippel-Feil syndrome with holoprosencephaly 0 2Porencephaly/hydrocephaly 0 1
Spina bifida 2 2Hypothyroidism 1 0Down syndrome 6 18Cri-du-chat syndrome 0 1Fragile X syndrome 1 0
Note. Numbers in columns may not add up to total n's because children may have more than onecondition.
alQ of 50 to 70.blQ of less than 50.
March 1995, Vol. 85, No. 3