Embed Size (px)
Citation preview
Fax +41 61 306 12 34E-Mail [email protected]
Original Paper
Ann Nutr Metab 2006;50:260–269 DOI: 10.1159/000091684
Variations in Postprandial Ghrelin Status following Ingestion of High-Carbohydrate, High-Fat, and High-Protein Meals in Males
Dalia Tannous dit El Khoury a Omar Obeid a Sami T. Azar b Nahla Hwalla a a
Department of Nutrition and Food Science, Faculty of Agricultural and Food Sciences, American University of Beirut, Beirut , and b
Department of Endocrinology, American University of Beirut Medical Center, Beirut , Lebanon
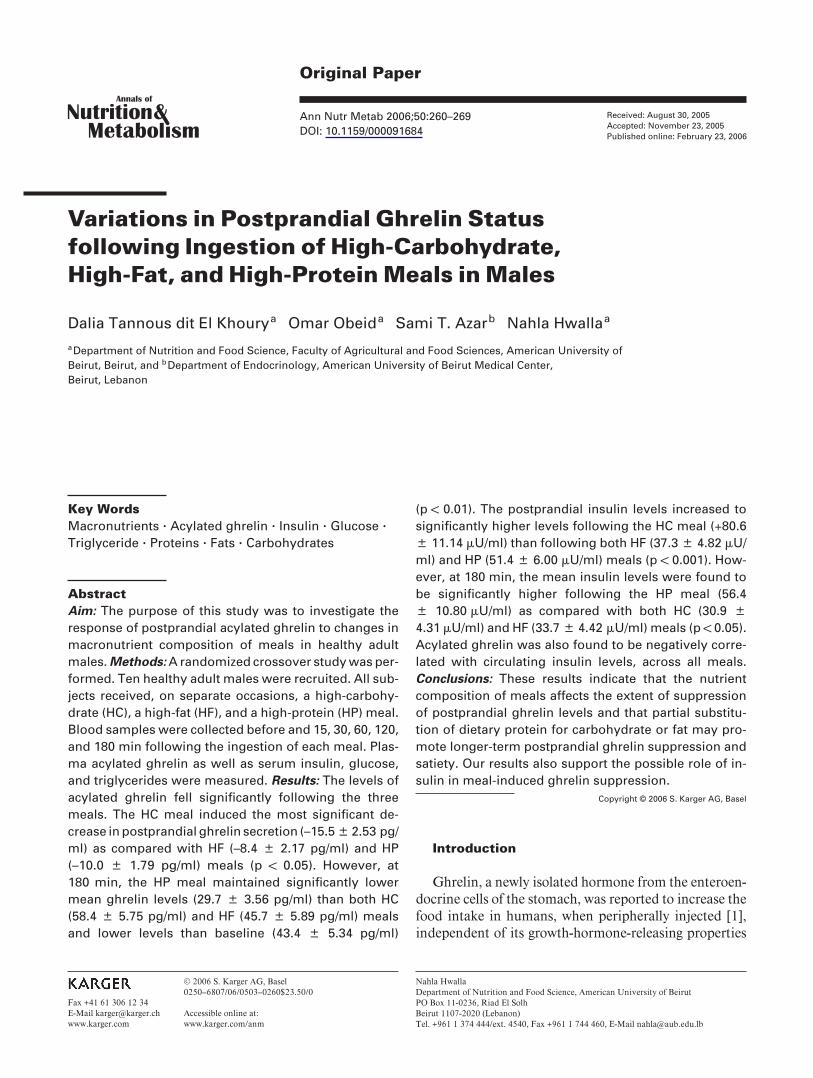
(p ! 0.01). The postprandial insulin levels increased to signifi cantly higher levels following the HC meal (+80.6 8 11.14 � U/ml) than following both HF (37.3 8 4.82 � U/ml) and HP (51.4 8 6.00 � U/ml) meals (p ! 0.001). How-ever, at 180 min, the mean insulin levels were found to be signifi cantly higher following the HP meal (56.4 8 10.80 � U/ml) as compared with both HC (30.9 8 4.31 � U/ml) and HF (33.7 8 4.42 � U/ml) meals (p ! 0.05). Acylated ghrelin was also found to be negatively corre-lated with circulating insulin levels, across all meals. Conclusions: These results indicate that the nutrient composition of meals affects the extent of suppression of postprandial ghrelin levels and that partial substitu-tion of dietary protein for carbohydrate or fat may pro-mote longer-term postprandial ghrelin suppression and satiety. Our results also support the possible role of in-sulin in meal-induced ghrelin suppression.
Copyright © 2006 S. Karger AG, Basel
Introduction
Ghrelin, a newly isolated hormone from the enteroen-docrine cells of the stomach, was reported to increase the food intake in humans, when peripherally injected [1] , independent of its growth-hormone-releasing properties
Key Words Macronutrients � Acylated ghrelin � Insulin � Glucose � Triglyceride � Proteins � Fats � Carbohydrates
Abstract Aim: The purpose of this study was to investigate the response of postprandial acylated ghrelin to changes in macronutrient composition of meals in healthy adult males. Methods: A randomized crossover study was per-formed. Ten healthy adult males were recruited. All sub-jects received, on separate occasions, a high-carbohy-drate (HC), a high-fat (HF), and a high-protein (HP) meal. Blood samples were collected before and 15, 30, 60, 120, and 180 min following the ingestion of each meal. Plas-ma acylated ghrelin as well as serum insulin, glucose, and triglycerides were measured. Results: The levels of acylated ghrelin fell signifi cantly following the three meals. The HC meal induced the most signifi cant de-crease in postprandial ghrelin secretion (–15.5 8 2.53 pg/ml) as compared with HF (–8.4 8 2.17 pg/ml) and HP (–10.0 8 1.79 pg/ml) meals (p ! 0.05). However, at 180 min, the HP meal maintained signifi cantly lower mean ghrelin levels (29.7 8 3.56 pg/ml) than both HC (58.4 8 5.75 pg/ml) and HF (45.7 8 5.89 pg/ml) meals and lower levels than baseline (43.4 8 5.34 pg/ml)
Received: August 30, 2005 Accepted: November 23, 2005 Published online: February 23, 2006
Nahla Hwalla Department of Nutrition and Food Science, American University of Beirut PO Box 11-0236, Riad El Solh Beirut 1107-2020 (Lebanon) Tel. +961 1 374 444/ext. 4540, Fax +961 1 744 460, E-Mail [email protected]
© 2006 S. Karger AG, Basel 0250–6807/06/0503–0260$23.50/0
Accessible online at: www.karger.com/anm

Meal Composition and Acylated Ghrelin Ann Nutr Metab 2006;50:260–269 261
[2] . Ghrelin’s primary site of action was reported to be the arcuate nucleus [3] , where it was found to stimulate feeding through the orexin and the neuropeptide Y/agou-ti-related peptide systems, independently of each other [4] .
Plasma ghrelin levels were found to be infl uenced by the nutritional status and were shown to increase 1–2 h before the onset of a meal and to fall within 1 h following food intake, suggesting a physiological role for ghrelin in meal initiation in humans [5, 6] .
Controversy remains as to whether the macronutrient content of meals infl uences the postprandial ghrelin sta-tus. Isocaloric substitution of dietary carbohydrates (CHO) for fat was reported to induce a greater and lon-ger-lasting suppression of ghrelin levels [7, 8] . Discrepan-cies in results were reported regarding high-fat (HF) (85–100% energy) meals, where ghrelin levels were found ei-ther to be signifi cantly decreased or unchanged [8–11] . A recent study performed by Al Awar et al. [12] on healthy female volunteers showed that the magnitude of post-prandial acylated ghrelin suppression did not differ be-tween meals of varied nutrient composition.
As for proteins, the ingestion of a physiological dose of essential amino acids has been shown to stimulate ghre-lin secretions [13] . However, there is still confl icting evi-dence as to whether a protein-rich meal increases [9, 14] or has no effect on postprandial plasma ghrelin levels [10] . Repeatedly, high-protein (HP) meals have been re-ported to increase satiety, and the HP content of popular diets was suspected to be the reason for their success in inducing weight loss [15] . However, the mechanism by which protein induces satiety and weight loss has not yet been elucidated.
The present study examined the effects of three isoca-loric meals of different macronutrient composition, high-carbohydrate (HC), HF, and HP meals, on postprandial acylated ghrelin levels, under normal physiological condi-tions, in healthy male volunteers. The serum concentra-tions of glucose, triglyceride, and insulin were also mea-sured. The results shed some light on whether changing the macronutrient composition of isocaloric meals may result in a modifi cation of the ghrelin levels and hence a better control of appetite and body weight.
Subjects and Methods
Subjects Ten healthy adult males were recruited for the study. All sub-
jects were nonsmokers and had normal exercise and alcohol-drink-ing habits ( ! 1 drink/day) as well as a stable body weight within the
last 3 months, as ascertained by a clinical interview prior to the study. None of the subjects had a previous history of substance abuse, a medical or psychological illness, or had undergone gastro-intestinal surgery.
Experimental Protocol The experimental protocol was approved by the Institutional
Review Board, American University of Beirut. All subjects were fully informed of the nature and procedures of the experiments and gave their written informed consent.
Prior to the beginning of the experiments, the subjects’ heights and weights were measured, fasting and after voiding. The resting energy expenditure (REE) was measured after an overnight fast, using an indirect calorimeter (Vmax Spectra 29 series; SensorMed-ics, Yorba Linda, Calif., USA). Lean body mass and percent body fat were determined using dual-energy X-ray absorptiometry (Del-phi QDR series; Hologic, Bedford, Mass., USA).
Before each test occasion, the subjects received a 3-day preex-periment weight-maintaining diet, consisting of 20% protein, 50% CHO, and 30% fat, based on the calculated daily energy need of each subject.
The experiments used a within-subject repeated-measure de-sign, in which each subject served as his own control. Each of the 10 subjects was exposed, in a random manner, to the three ex-perimental meals, on three separate occasions, 2 weeks apart. At 08.00 h, the subjects arrived at the Department of Nutrition and Food Science, after fasting for 12 h. An intravenous catheter was then inserted into an antecubital vein. At 08.30 h, either an HC (60% CHO, 20% protein, and 20% fat), an HF (30% CHO, 20% protein, and 50% fat), or an HP (30% CHO, 50% protein, and 20% fat) liquid meal, providing 30% of subjects’ REE, was consumed within 15 min. The caloric content of meals ranged from 400 to 700 kcal, with a mean of 615 kcal/meal. None of the three meals contained fi ber. The meals consumed at the 615-kcal level are shown in table 1 .
Collection and Preparation of Blood Samples Blood samples were collected immediately before meals (time
0) and postprandially after 15, 30, 60, 120, and 180 min. Around 12 ml of blood was collected at each withdrawal into three tubes, two with ethylenediaminetetraacetic acid as the anticoagulant sub-stance for plasma separation and one serum separator tube with clot activator. The tubes were kept on ice and then centrifuged at 2,500 g for 10–15 min at 3 ° C for separation of plasma and serum. Plasma samples were immediately acidifi ed with 50 � l of 1 N HCl and 10 � l of phenylmethylsulfonyl fl uoride (10 mg/ml methanol) per milliliter plasma, in order to protect ghrelin’s octanoyl group from being cleaved off. All serum and plasma samples were then stored at –80 ° C until analyzed.
Biochemical Analyses Acylated plasma ghrelin was measured using a commercially
available radioimmunoassay kit (Linco Research, St. Charles, Mo., USA). The limit of sensitivity was 7.8 pg/ml (100 � l sample size); intra- and interassay coeffi cients of variation were less than 6.0 and 9.0, respectively. Serum insulin was also measured using a com-mercially available radioimmunoassay kit (MP Biomedicals, Ir-vine, Calif., USA). The lower detection limit was 2 � U/ml; intra- and interassay coeffi cients of variation were less than 6.0 and 7.9, respectively. Serum glucose and triglyceride levels were determined

Tannous dit El Khoury /Obeid /Azar /Hwalla
Ann Nutr Metab 2006;50:260–269 262
by means of commercial enzymatic colorimetric tests on a Vitros analyzer (Ektachem DT60 II System; Johnson & Johnson Clinical Diagnostics, Rochester, N.Y., USA).
Statistics The data were analyzed using SPSS for Windows, version 11.5.
Data are expressed as mean values 8 SE, and p ! 0.05 was consid-ered statistically signifi cant. A paired t test was used to determine the changes in variables over time after meal consumption and to identify differences in the variables’ responses to the three meals at every time point. Differences in the variables’ overall changes following the three meals were analyzed by two-way Anova with repeated measures, followed by Duncan’s test. The Pearson prod-uct-moment correlation test was used to detect possible associa-tions among variables.
Results
All subjects were healthy and nonobese, with compa-rable body composition in terms of fat and lean body mass. The study subjects had a mean age of 22.2 8 1.28 years, a mean body weight of 76.6 8 4.17 kg, a mean body mass index of 24.7 8 0.88 kg/m 2 , a mean lean body mass of 59.7 8 3.00 kg, a mean proportion of body fat of 18.8 8 1.33%, and a mean REE of 1881.7 8 88.78 kcal/day. All three meals were well tolerated by the subjects, with no complaints regarding palatability or size of meals. None of the 10 subjects experienced any particular dis-comfort during blood withdrawal.
Acylated Plasma Ghrelin Within meals, the mean ghrelin levels dropped sig-
nifi cantly following the HC, HF, and HP meals, starting at 30 min to reach a signifi cantly lower than baseline na-dir at 60 min and returning to preprandial values at 180 min, except for the HP meal. Following the HP meal, the mean ghrelin levels remained signifi cantly lower than baseline values at 180 min ( fi g. 1 a). Comparing HC, HF, and HP meals, the mean fasting and postprandial ghrelin levels, at different time points, were found to be similar, except at 180 min, when the mean ghrelin levels follow-ing the HP meal were found to be signifi cantly lower than following HC and HF meals ( fi g. 1 a).
Similarly, when changes in plasma ghrelin levels from baseline were examined, following HC, HF, and HP meals, the decrease in plasma ghrelin levels was found to be signifi cantly higher at 180 min following the HP meal in comparison to HC and HF meals ( fi g. 1 b). However, at 30 and 60 min, the decrease in the mean postprandial ghrelin levels was found to be signifi cantly higher follow-ing the HC meal as compared with the HP meal.
Pooling the data from all three meals, meal ! time repeated-measures Anova yielded a signifi cant effect for time and meal (the HC meal was found to induce a sig-nifi cantly higher postprandial ghrelin suppression from baseline as compared with HF and HP meals), but not a signifi cant meal ! time interaction ( table 2 ).
Serum Insulin Within meals, the mean postprandial serum insulin
levels promptly increased following the three types of meals, reaching a signifi cantly higher than baseline peak at 30 min. Afterwards, the mean insulin levels remained
Table 1. Amount, percent calories, and type of food consumed dur-ing the 615-kcal HC, HF, and HP meals
Food products Weight of food, g
HC HF HP
Ensure Complete Balanced Nutrition® 80 45 40Soy/whey proteina 24.6 31.98 95.2Sugar 40.36 14.59 9.49Sunfl ower oil 0 25.18 1.37Water 470.04 498.25 468.94
Total 615 615 615
Calories from CHO, % 59.79 30.00 30.00Calories from simple sugar, % 58.77 28.65 26.01Calories from complex CHO, % 1.03 1.34 3.99Calories from protein, % 19.92 19.99 49.99Calories from fat, % 20.29 50.00 20.00Calories from saturated fatty acids, % 2.65 5.67 5.42Calories from unsaturated fatty acids, % 17.63 42.60 14.48
a Pro-performance hyperproteic hypercaloric formula.
Table 2. Effects of time, meals (HC, HF, and HP), and meal ! time interaction on the postprandial mean ghrelin, glucose, triglyc-eride, and insulin changes in adult males
Within-subject contrasts p
time meals meal ! time
Ghrelin 0.00 0.02 0.09Glucose 0.00 0.02 0.00Triglyceride 0.00 0.03 0.00Insulin 0.00 0.00 0.00
Two-way repeated-measures Anova.

Meal Composition and Acylated Ghrelin Ann Nutr Metab 2006;50:260–269 263
signifi cantly higher than baseline values and returned to preprandial values at 180 min ( fi g. 2 a). At different time points, the mean insulin levels were found to be signifi -cantly higher following the HC meal in comparison with HF and HP meals at 15 and 30 min and to be signifi cant-ly higher following the HP meal as compared with HC and HF meals at 180 min ( fi g. 2 a). Similar results were
obtained when the serum insulin changes from baseline following HC, HF, and HP meals were calculated and compared ( fi g. 2 b).
Pooling the data from all three meals, the meal ! time repeated-measures Anova revealed a signifi cant effect for time and meal (the HC meal was found to induce a sig-nifi cantly higher postprandial insulin increase from base-
HCHPHF
HCHPHF
51.3
58.4x58.7
30.2✽
25.7✽
34.6✽
43.441.8
32.6✽
25.6✽ 27.1✽
29.7y, ✽
39.2
21.6✽
29.9✽
42.9
27.7✽
45.7x
20
30
40
50
60
70
0 15 30 60 120 180
Time (min)
Gh
relin
(p
g/m
l)
–28.4
–32.9y
–24.0y
–0.2x
–7.4
–16.3
–10.8x
–13.7y–17.7x
–1.5
–21.4
–13.0
–3.7
2.8x
–15.3
–40
–30
–20
–10
0
10
150 30 60 120 180Time (min)
Ch
ang
e o
f g
hre
lin (
pg
/ml)
a
b
Fig. 1. a Plasma acylated ghrelin responses following high-carbohydrate (HC), high-fat (HF), and high-protein (HP) meals in adult males. b Plasma acylated ghrelin changes from baseline following HC, HF, and HP meals in adult males. x, y Values, at the same time point, with different superscripts are signifi cantly different at p ! 0.05. * Signifi cantly different from baseline, within the same diet.
Tannous dit El Khoury /Obeid /Azar /Hwalla
Ann Nutr Metab 2006;50:260–269 264
line as compared with HF and HP meals) as well as a signifi cant meal ! time interaction ( table 2 ).
Serum Glucose Within meals, the mean postprandial serum glucose
levels increased following HC, HF, and HP meals, reach-ing signifi cantly higher than baseline peaks at 15 and 30 min, and then returned to preprandial values at 60 min ( fi g. 3 a). At different time points, the fasting and post-
prandial mean glucose levels were found to be similar, except at 30 min, when the HC meal resulted in a sig-nifi cantly higher glucose peak as compared with HF and HP meals ( fi g. 3 a).
Looking at changes in glucose levels from baseline, fol-lowing HC, HF, and HP meals, the mean glucose change was found to be signifi cantly higher following the HC meal as compared with the HF and HP meals, at both 15 and 30 min ( fi g. 3 b).
23.9 30.9x
84.8✽
103.9✽
213.1y, ✽
170.0y, ✽
82.4✽
112.9x✽105.7x, ✽
24.8
75.3✽
56.4y78.5✽
28.7
80.7x, ✽105.7x, ✽
33.7x
68.9✽
0
40
80
120
160
200
240
0 15 30 60 120 180
Time (min)
Insu
lin (
µU/m
l)
7.0x
61.0
80.1
189.2y
146.1y
50.4
57.6
88.1x80.9x
36.1y
40.252.0x
5.0x
49.777.0x
0
40
80
120
160
200
0 15 30 60 120 180
Time (min)
Ch
ang
e o
f in
sulin
(µU
/ml)
HCHPHF
HCHPHF
a
b
Fig. 2. a Serum insulin responses following high-carbohydrate (HC), high-fat (HF), and high-protein (HP) meals in adult males. b Serum insulin changes from baseline following HC, HF, and HP meals in adult males. x, y Values, at the same time point, with different superscripts are signifi cantly different at p ! 0.05. * Signifi cantly different from baseline, within the same diet.

Meal Composition and Acylated Ghrelin Ann Nutr Metab 2006;50:260–269 265
Pooling the data from all three meals, the meal ! time repeated-measures Anova revealed a signifi cant effect for time and for meal (the HC meal was found to induce a signifi cantly higher postprandial glucose increase from baseline as compared with HF and HC meals) as well as a signifi cant meal ! time interaction ( table 2 ).
Serum Triglyceride Within meals, the mean postprandial serum triglycer-
ide levels started to increase gradually above baseline fol-lowing the ingestion of the three meals, reaching signifi -cantly higher than baseline levels at 15 min following the HP meal, at 30 min following the HC meal, and at 60 min following the HF meal. All three meals induced a signifi -
125.1✽
120.0y, ✽
88.9
95.0
89.4
91.8
108.3✽
96.992.892.8
95.9
97.6x
102.6x, ✽
90.2
107.7✽
95.7
90.989.8
80
85
90
95
100
105
110
115
120
125
130
0 15 30 60 120 180
Time (min)
Glu
cose
(m
g/d
l)
–2.4
28.2y
33.3y
–2.93.2
12.4x
1.0
–3.1
1.7x
–3.1
6.9x
12.0x
–4.8–5.9–5.5
–20
–10
0
10
20
30
40
150 30 60 120 180Time (min)
Ch
ang
e o
f g
luco
se (
mg
/dl)
HCHPHF
HCHPHF
a
b
Fig. 3. a Serum glucose responses following high-carbohydrate (HC), high-fat (HF), and high-protein (HP) meals in adult males. b Serum glucose changes from baseline following HC, HF, and HP meals in adult males. x, y Values, at the same time point, with different superscripts are signifi cantly different at p ! 0.05. * Signifi cantly different from baseline, within the same diet.

Tannous dit El Khoury /Obeid /Azar /Hwalla
Ann Nutr Metab 2006;50:260–269 266
cantly higher than baseline triglyceride peak at the end of the study (180 min) ( fi g. 4 a). At different time points, the mean triglyceride fasting and postprandial levels were found to be similar, except at 60 and 120 min, when the HF meal resulted in signifi cantly higher mean triglyceride values than the HP meal ( fi g. 4 a).
Looking at changes in serum triglyceride levels from baseline, following HC, HF, and HP meals, the mean tri-glyceride change was found to be signifi cantly higher fol-lowing the HF meal as compared with the HP meal at 60, 120, and 180 min and as compared with the HC meal at 120 min only ( fi g. 4 b).
84.993.9 101.8✽
117.8✽
135.4✽
141.7✽
85.5
90.2✽
90.1
107.8y, ✽
121.3y, ✽
136.9✽
82.7
90.3
111.5
156.x, ✽
162.9✽
133.2x, ✽
60
80
100
120
140
160
180
0 15 30 60 120 180
Time (min)
TG
mg
/dl)
9.0 16.9
32.9x, y
50.5x56.8x, y
4.6
4.7
22.3x
35.8x
51.4x
50.6y
77.0y
84.3y
21.5
2.7
–30
–15
0
15
30
45
60
75
90
150 30 60 120 180
Time (min)
Ch
ang
e o
f T
G (
mg
/dl)
HCHPHF
HCHPHF
a
b
Fig. 4. a Serum triglyceride (TG) responses following high-carbohydrate (HC), high-fat (HF), and high-protein (HP) meals in adult males. b Serum TG changes from baseline following HC, HF, and HP meals in adult males. x, y Values, at the same time point, with different superscripts are signifi cantly different at p ! 0.05. * Signifi cant-ly different from baseline, within the same diet.

Meal Composition and Acylated Ghrelin Ann Nutr Metab 2006;50:260–269 267
Pooling the data from all three meals, the meal ! time repeated-measures Anova yielded a signifi cant effect for time and meal (the HF meal was found to induce a sig-nifi cantly higher postprandial triglyceride increase from baseline as compared with HC and HP meals) as well as a signifi cant meal ! time interaction ( table 2 ).
Correlations among Variables Fasting and postprandial acylated ghrelin levels did
not correlate with any of the subjects’ characteristics, in-cluding age (r = –0.001, p 1 0.05), weight (r = 0.565, p 1 0.05), body mass index (r = 0.474, p 1 0.05), lean body mass (r = 0.470, p 1 0.05), percentage of fat (r = 0.493, p 1 0.05), and REE (r = 0.568, p 1 0.05). Pearson’s cor-relation analysis revealed a signifi cant negative correla-tion between insulin and acylated ghrelin for the pooled data (r = –0.146, p = 0.050). The postprandial glucose and triglyceride concentrations did not show any signifi cant correlations with acylated ghrelin across all meals.
Discussion
This study was designed to investigate whether meals of different macronutrient composition, but with similar food types, energy density, and volume, will differential-ly affect the postprandial acylated ghrelin status in healthy young adult males. Our results showed that the ghrelin levels fl uctuated not only in response to fasting and feed-ing, but also with sensitivity to diet composition. Inges-tion of the HC, HF, and HP meals resulted in a signifi cant suppression of the ghrelin levels; however, the magnitude of suppression differed among the different meals. This suppression of the postprandial ghrelin levels following the three meals is in line with results reported in the lit-erature showing a decline in the ghrelin concentrations following food ingestion [5, 7, 9, 16, 17] . The mechanism of this decline was reported to be due to the ingested nu-trients themselves rather than to stomach expansion in-duced by these nutrients [18] . Glucose [10, 19] and insu-lin were found to exert a suppressive action on the plasma ghrelin levels [20–24] .
In this study, within the HC meal, the circulating ghre-lin levels fell signifi cantly from baseline following HC meal ingestion and remained signifi cantly lower than the preprandial values at 120 min, while returning to baseline at 180 min. The mechanism of this decline may be attrib-uted to CHO-induced insulin secretion, as the HC meal induced a signifi cantly higher glucose and insulin increase from baseline as compared with HF and HP meals. This
fi nding is in line with previous studies that showed a sig-nifi cant decrease in postprandial ghrelin values following HC meals, with discrepancies in magnitude and duration of ghrelin suppression [7, 9, 17] . The discrepancy may be attributed either to the exaggerated percent CHO and en-ergy contents of meals in some studies [7, 17] or to the relatively lower caloric content of the CHO-rich meals in others [9] . The caloric content of the meals has been re-ported to have a signifi cant effect on the extent of post-prandial ghrelin suppression in lean subjects [25] . Dis-crepancies could be also related to the type of ghrelin measured: the above studies measured total rather than acylated ghrelin, and the contribution of postprandial ac-ylated ghrelin to postprandial total ghrelin is still un-known [12] .
In this study, following the HC meal ingestion, the ghrelin levels decreased to a nadir, signifi cantly lower than baseline, at 60 min. This is in line with results re-ported by Erdmann et al. [14] , showing that the plasma total ghrelin levels reached a signifi cant nadir at 60 min and returned to baseline at 180 min. However, in the study performed by Monteleone et al. [7] , the total ghrelin levels reached a relatively late nadir at 120 min following the ingestion of a high-calorie HC breakfast and lunch. This late nadir may be attributed to the exaggerated CHO and energy contents of served meals which might have delayed overall digestion and absorption [26] and de-layed, consequently, the time at which the ghrelin nadir is reached.
In this study, following ingestion of the HF meal, the mean ghrelin levels decreased signifi cantly, below base-line value, until 120 min and returned to baseline at 180 min. Also, a signifi cantly greater postprandial in-crease in triglyceride values, above baseline, was noted following the HF meal as compared with HC and HP meals. This is in line with results of the study of Monte-leone et al. [7] , showing, to a comparable extent, a sig-nifi cant decline in postprandial ghrelin values following HF meals. The mechanism behind this decline has been previously reported to be related to increased postpran-dial plasma triglyceride levels [11] .
In this study, following the HF meal ingestion, the ghrelin levels decreased to a nadir signifi cantly lower than baseline at 60 min. A later nadir was achieved in the stud-ies performed by Monteleone et al. [7] and Erdmann et al. [9] , where the total ghrelin levels, following the inges-tion of fat-rich meals (75 and 85% fat as energy, respec-tively), reached a signifi cant late nadir at 180 min. This is probably due to the higher fat content of the meals which might have induced slower absorption and diges-

Tannous dit El Khoury /Obeid /Azar /Hwalla
Ann Nutr Metab 2006;50:260–269 268
tion rates [27] , leading to slower ghrelin suppression in the circulation.
As for the HP meal, this study shows, for the fi rst time, a distinct effect of the HP meal on postprandial acylated ghrelin levels in adult males. The pattern of decrease was similar to that following HC and HF meals, except that the ghrelin levels remained signifi cantly lower than the preprandial values 180 min following the HP meal. This longer-lasting ghrelin suppression by the HP meal could be attributed to protein-associated slower gastric empty-ing which allows a prolonged action of nutrients on ghre-lin endocrine cells [28] .
Comparing the meals, two-way Anova showed that the HC meal induced a signifi cantly higher postprandial acylated ghrelin decrease in comparison with HF and HP meals. The reason behind this greater suppression could be attributed to the signifi cantly greater extent of insulin secretion following the HC meal as compared with HF and HP meals. Insulin has been previously shown to ex-ert a suppressive effect on plasma ghrelin levels under various glucose concentrations [20, 21, 23, 24] . Similar-ly, Monteleone et al. [7] and Weigle et al. [29] found that the mean postprandial total ghrelin suppression was greater following the HC meal than the HF meal. How-ever, in the present study, the HP meal maintained the acylated ghrelin levels signifi cantly lower than both the HC meal and the HF meal at 180 min. This is a signifi -cant fi nding, as it provides an explanation for previous observations, showing that high-protein diets were sati-ating for a longer duration than HC and HF meals [30, 31] . The mechanism by which the HP diet elicited lower ghrelin levels over a longer period of time could be re-lated to the higher insulin levels observed 180 min fol-lowing the HP meal as compared with HC and HF meals. The protein-induced higher insulin secretion, as com-pared with other meals, could be explained by previous fi ndings that protein intake augments the sensitivity of pancreatic cells to glucose, thus enhancing the insulin secretion [32] .
The strength of this study is in providing additional evidence for the mechanism by which high-protein diets result in greater satiety and more weight loss than other meals with different macronutrient composition. This study also emphasizes that although the HC meal in-duces the highest postprandial ghrelin suppression, the effect of the HP meal appears to be of longer duration.
The limitation of this study was the measurement of acylated ghrelin. Nonacylated ghrelin was also found to exert anorectic functions when injected centrally and peripherally into male mice [33] . Also, a visual analog
scale was not used, in order to assess, subjectively, feel-ings of hunger and desire to eat following meal ingestion and to clarify whether ghrelin level changes following meal intake are associated with changes in hunger sensa-tion.
In conclusion, this study demonstrates that, in hu-mans, circulating acylated ghrelin is affected by the nutri-ent composition of the diet. Substitution of dietary pro-tein for CHO or fat may promote longer-term postpran-dial acylated ghrelin suppression. It is still not clear whether the actual presence of nutrients in the stomach, the metabolic or mechanical response to food ingestion, the food-induced taste stimulation, or the release of en-teric hormones is the main determinant of ghrelin decline following food intake. In this study, similar to others, in-sulin was suggested as a key determinant of meal-induced ghrelin suppression. The mechanism of the underlying effect remains to be determined.
Acknowledgments
This study was supported by the University Research Board (URB) at the American University of Beirut. Special thanks to Ms. Nada Adra, Ms. Tharwat Haddad, and Dr. Moatasim Sidahmed for their assistance with the statistical analysis, to Ms. Carmen Hajj Shahin, American University of Beirut Medical Center Endocri-nology Laboratory, for her assistance in the technical work, and to Miss Nancy El Helou, our phlebotomist.

Meal Composition and Acylated Ghrelin Ann Nutr Metab 2006;50:260–269 269
References
1 Wren AM, Seal LJ, Cohen MA, Brynes AE, Frost GS, Murphy KG, Dhillo WS, Ghatei MA, Bloom SR: Ghrelin enhances appetite and increases food intake in humans. J Clin Endo-crinol Metab 2001; 86: 5992–5995.
2 Shintani M, Ogawa Y, Ebihara K, Aizawa-Abe M, Miyanaga F, Takaya K, Hayashi T, Inoue G, Hosoda K, Kojima M, Kangawa K, Nakao K: Ghrelin, an endogenous growth hormone secretagogue, is a novel orexigenic peptide that antagonizes leptin action through the activa-tion of hypothalamic neuropeptide Y/YI re-ceptor pathway. Diabetes 2001; 50: 227–232.
3 Wren AM, Small CJ, Abbott CR, Dhillo WS, Seal LJ, Cohen MA, Batterham RL, Taheri S, Stanley SA, Ghatei MA, Bloom SR: Ghrelin causes hyperphagia and obesity in rats. Diabe-tes 2001; 50: 2540–2547.
4 Toshinai K, Date Y, Murakami N, Shimada M, Mondal MS, Shimbara T, Guan J, Wang Q, Funahashi H, Sakurai T, Shioda S, Matsukura S, Kangawa K, Nakazato M: Ghrelin-induced food intake is mediated via the orexin path-way. Endocrinology 2003; 144: 1506–1512.
5 Cummings DE, Purnell JQ, Frayo RS, Schmi-dova K, Wisse BE, Weigle DS: A preprandial rise in plasma ghrelin levels suggests a role in meal initiation in humans. Diabetes 2001; 50: 1714–1719.
6 Ariyasu H, Takaya K, Tagami T, Ogawa Y, Hosoda K, Akamizu T, Suda M, Koh T, Natsui K, Toyooka S, Shirakami G, Usui T, Shimatsu A, Doi K, Hosoda H, Kojima M, Kangawa K, Nakao K: Stomach is a major source of circu-lating ghrelin, and feeding state determines plasma ghrelin-like immunoreactivity levels in humans. J Clin Endocrinol Metab 2001; 86: 4753–4758.
7 Monteleone P, Bencivenga R, Longobardi N, Serritella C, Maj M: Differential responses of circulating ghrelin to high-fat or high-carbohy-drate meal in healthy women. J Clin Endocri-nol Metab 2003; 88: 5510–5514.
8 Tentolouris N, Kokkinos A, Tsigos C, Kyriaki D, Doupis J, Raptis SA, Katsilambros N: Dif-ferential effects of high-fat and high-carbohy-drate content isoenergetic meals on plasma ac-tive ghrelin concentrations in lean and obese women. Horm Metab Res 2004; 36: 559–563.
9 Erdmann J, Lippl F, Schusdziarra V: Differen-tial effect of protein and fat on plasma ghrelin levels in man. Regul Pept 2003; 116: 101–107.
10 Greenman Y, Golani N, Gilad S, Yaron M, Limor R, Stern N: Ghrelin secretion is modu-lated in a nutrient- and gender-specifi c man-ner. Clin Endocrinol (Oxf) 2004; 60: 382–388.
11 Heath RB, Jones R, Frayn KN, Robertson MD: Vagal stimulation exaggerates the inhibi-tory ghrelin response to oral fat in humans. J Endocrinol 2004; 180: 273–281.
12 Al Awar R, Obeid O, Hwalla N, Azar S: Post-prandial acylated ghrelin status following fat and protein manipulation of meals in healthy young women. Clin Sci (Lond) 2005; 109: 405–411.
13 Knerr I, Groschl M, Rascher W, Rauh M: En-docrine effects of food intake: insulin, ghrelin and leptin reponses to a single bolus of essential amino acids in humans. Ann Nutr Metab 2003; 47: 312–318.
14 Erdmann J, Topsch R, Lippl F, Gussmann P, Schusdziarra V: Postprandial response of plas-ma ghrelin levels to various test meals in rela-tion to food intake, plasma insulin and glucose. J Clin Endocrinol Metab 2004; 89: 3048–3054.
15 Astrup A: The satiating power of protein – a key to obesity prevention. Am J Clin Nutr 2005; 82: 1–2.
16 Nedvidkova J, Krykorkova I, Bartak V, Pape-zova H, Gold PW, Alesci S, Pacak K: Loss of meal-induced decrease in plasma ghrelin levels in patients with anorexia nervosa. J Clin En-docrinol Metab 2003; 88: 1678–1682.
17 Caixas A, Bashore C, Nash W, Pi-Sunyer FX, Laferrere B: Insulin, unlike food intake, does not suppress ghrelin in human subjects. J Clin Endocrinol Metab 2002; 87: 1902–1906.
18 Shiiya T, Nakazato M, Mizuta M, Date Y, Mondal MS, Tanaka M, Nozoe S, Hosoda H, Kangawa K, Matsukura S: Plasma ghrelin lev-els in lean and obese humans and the effect of glucose on ghrelin secretion. J Clin Endocrinol Metab 2002; 87: 240–244.
19 Nakagawa E, Nagaya N, Okumura H, Enomo-to M, Oya H, Ono F, Hosoda H, Kojima M, Kangawa K: Hyperglycaemia suppresses the secretion of ghrelin, a novel growth-hormone-releasing peptide: responses to the intravenous and oral administration of glucose. Clin Sci (Lond) 2002; 103: 325–328.
20 Saad MF, Bernaba B, Hwu C, Jinagouda S, Fahmi S, Kogosov E, Boyadjian R: Insulin reg-ulates plasma ghrelin concentration. J Clin En-docrinol Metab 2002; 87: 3997–4000.
21 Mohlig M, Spranger J, Otto B, Ristow M, Tschop M, Pfeiffer AF: Euglycemic hyperinsu-linemia, but not lipid infusion, decreases cir-culating ghrelin levels in humans. J Endocrinol Invest 2002; 25:RC36–RC38.
22 Purnell JQ, Weigle DS, Breen P, Cummings DE: Ghrelin levels correlate with insulin levels, insulin resistance, and high-density lipopro-tein cholesterol, but not with gender, meno-pausal status, or cortisol levels in humans. J Clin Endocrinol Metab 2003; 88: 5747–5752.
23 Flanagan DE, Evans ML, Monsod TP, Rife F, Heptulla RA, Tamborlane WV, Sherwin RS: The infl uence of insulin on circulating ghrelin. Am J Physiol Endocrinol Metab 2003; 284:E313–E316.
24 Leonetti F, Iacobellis G, Ribaudo MC, Zap-paterreno A, Tiberti C, Iannucci CV, Vecci E, Di Mario U: Acute insulin infusion decreases plasma ghrelin levels in uncomplicated obesi-ty. Regul Pept 2004; 122: 179–183.
25 Le Roux CW, Patterson M, Vincent RP, Hunt C, Ghatei MA, Bloom SR: Postprandial plas-ma ghrelin is suppressed proportional to meal caloric content in normal weight but not obese subjects. J Clin Endocrinol Metab 2005; 90: 1068–1071.
26 Spallone V: Glycaemic control and gastric emptying. Diabetes Nutr Metab 2004; 17: 47–55.
27 Whited KL, Hornof WJ, Garcia T, Bohan DC, Larson RF, Raybould HE: A non-invasive method for measurement of gastric emptying in mice: effects of altering fat content and CCK A receptor blockade. Neurogastroenterol Motil 2004; 16: 421–427.
28 Maughan RJ, Leiper JB, Vist GE: Gastric emp-tying and fl uid availability after ingestion of glucose and soy protein hydrolysate solutions in man. Exp Physiol 2004; 89: 101–108.
29 Weigle DS, Cummings DE, Newby PD, Breen PA, Frayo RS, Matthys CC, Callahan HS, Pur-nell JQ: Roles of leptin and ghrelin in the loss of body weight caused by a low fat, high carbo-hydrate diet. J Clin Endocrinol Metab 2003; 88: 1577–1586.
30 Stubbs RJ: Nutrition Society Medal Lecture. Appetite, feeding behaviour and energy bal-ance in human subjects. Proc Nutr Soc 1998; 57: 341–356.
31 Tome D: Protein, amino acids and the control of food intake. Br J Nutr 2004; 92(suppl 1):S27–S30.
32 Linn T, Santosa B, Grönemeyer D, Aygen S, Scholz N, Busch M, Bretzel RG: Effect of long-term dietary protein intake on glucose metabo-lism in humans. Diabetologia 2000; 43: 1257–1265.
33 Asakawa A, Inui A, Kaga T, Katsuura G, Fu-jimiya M, Fujino MA, Kasuga M: Antagonism of ghrelin receptor reduces food intake and body weight gain in mice. Gut 2003; 52: 947–952.