Embed Size (px)
Citation preview
ARTICLE OPEN
Various effects of magnetite on international simple glass(ISG) dissolution: implications for the long-term durability ofnuclear glassesLindsey Neill1, Stéphane Gin2, Thomas Ducasse2, Trilce De Echave2, Maxime Fournier 2, Patrick Jollivet2, Alkiviadis Gourgiotis3 andNathalie A. Wall1
Understanding the effect of near-field materials, such as iron corrosion products, on the alteration of vitreous nuclear waste isessential for modeling long-term stability of these waste forms in a geological repository. This work presents experimental resultsfor which monoliths of International Simple Glass—a six oxide borosilicate glass–, with polished and unpolished cut sides, wereaged for 70 days under oxic conditions at 90 °C in a solution initially saturated in 29SiO2 at pH 7; then magnetite was added to theleaching environment. Solution and solid analyses were performed to correlate the changes in the surface features and dissolutionkinetics. It was found that magnetite primarily influences the mechanically constrained surface of the non-polished sides of themonoliths, with little to no effect on the polished surfaces. This work highlights the importance of the unique chemistry withinsurface cracks that invokes a drastic change in alteration of glass in environments containing iron corrosion products.
npj Materials Degradation (2017) 1:1 ; doi:10.1038/s41529-017-0001-6
INTRODUCTIONConfinement within a borosilicate glass matrix is currentlyproposed for the disposal of radionuclides remaining from usednuclear fuel from power reactors.1 In France, glass containing~18% (w/w) waste is poured into a stainless steel canister. Beforedisposal in a deep geological repository, the canister will beplaced into a several centimeter thick carbon steel over pack.2 Abetter understanding of the interactions between glass and ironand the associated iron corrosion products is necessary to assessthe performance of these waste forms.3
Work has been performed to understand the fundamentalmechanisms controlling glass dissolution under a variety ofconditions and link these mechanisms to the overall kinetics ofglass behavior.4 The processes that control glass dissolution in ageological repository involve a complex set of reactions, whichdepend on the nature of the host rock, the near field materials, thetemperature, the ground water composition along with itsrenewal rate, and the glass composition.5–13 The ultimate goalfor laboratory scale parametric studies of glass alteration is tobuild an accurate predictive model that can account for thekinetics of long-term glass alteration under a variety of relevantconditions.14–16 Experimental validation of these predictivemodels under accelerated conditions at a laboratory time scaleis not possible as glass dissolution is controlled by coupled non-linear processes, therefore validation instead relies on the study ofarcheological and basaltic glasses altered in well understoodgeochemical conditions.17–20 A more thorough understanding ofall mechanisms and the associated kinetics of not only the glassitself but with the surrounding environment must be achieved tobuild a robust model.
Literature pertaining to borosilicate glass dissolution demon-strates that silica species play a major role in the mechanisms andassociated kinetics. In dilute conditions, water begins to diffuseinto the glass matrix (hydration) and alkali ions exchange with thepositively charged hydrogen species (interdiffusion) (Eq. 1).21–25
Hydrolysis of the silicon network also begins with silica beingreleased into solution (Eqs 2 and 3).26, 27 The correspondingkinetic regime is designated as the initial or forward rate, r0.
�Si� O�Mþ þ Hþ ! Si� O� þMþ þ OH� (1)
�Si� O� þ H2O ! Si� OHþ OH� (2)
Si� O� S OHð Þ3 þ OH� ! H4SiO4 þ Si� O� (3)
As the dissolved silica concentration increases, the ratedecreases to a residual rate, rr. The rate decrease is attributed toa decrease of the affinity of the hydrolysis of the silicate networkand the formation of an amorphous layer (i.e., gel) that becomestransport-limiting in silica saturated conditions.28 Two differentmechanisms are proposed for the formation of this gel layer. Onemechanism is based on the precipitation of a silica rich layer onthe glass surface; the second mechanism is based on in-situ re-condensation of the silicon oxygen bonds, forming a porous gellayer on the glass surface. Previous studies have made use ofisotopic tracers to differentiate between these two mechanisms,allowing a greater understanding of the exchange of siliconbetween the bulk solution and glass surface.29–32 These studiesdemonstrated that a combination of both mechanisms may occur,which is dependent on the solution pH and the reaction progress.There is also a possibility of an alteration resumption,
commonly attributed to the rapid precipitation of secondary
Received: 24 October 2016 Revised: 9 December 2016 Accepted: 27 December 2016
1Chemistry Department, Washington State University, Pullman, WA 99163, USA; 2CEA Marcoule, DE2D SEVT, F-30207 Bagnols-sur-Cèze, France and 3Institut de Radioprotection etde Sûreté Nucléaire, PRP-DGE/SRTG/LT2S, Fontenay-aux-Roses, FranceCorrespondence: Stéphane Gin ([email protected]) or Nathalie A. Wall ([email protected])
www.nature.com/npjmatdeg
Published in partnership with CSCP and USTB

phases.33 Under this regime, zeolites, and calcium silicate hydratesform at the expense of the passivating film. Additionally,environmental components, such as organic molecules or ironcorrosion products, can have detrimental effects on the passivat-ing layer.34, 35 Glass compositions, such as those high inaluminum, and solution pH are two key factors controlling thisregime.36
Iron and its associated corrosion products (primarily siderite andmagnetite) have been seen to enhance glass alteration via thesorption of silica onto the surface of the iron-rich phases and theprecipitation of iron silicate minerals.37–43 Each of these processesshifts the equilibrium established between the glass surface layersand surrounding solution; glass alteration rates are directlydependent on the availability of iron.In addition to sorption of silica on the iron surface and
precipitation of iron silicates, magnetite influences SON68 glassbehavior, the French high level waste reference glass. A studydescribing the effect of magnetite on SON68 proposes two otherprocesses: 1) precipitation of SiO2 on the magnetite surface and 2)iron incorporation into the glass alteration layers with potentialmodifications of the transport properties of the gel itself.35 Thepresent study provides evidences that these processes occur,although iron incorporation into the alteration layer is not seenuntil months after the addition of magnetite. Thus, this processwould be highly dependent on iron availability in solution that isresulting from magnetite dissolution. This demonstrates that theiron—glass relationship is complex and that additional informa-tion is still needed to explain mechanisms and kinetics of glassbehavior.The formation of cracks at the glass surface also contributes to
the overall durability of the glass matrix, primarily because surfacecracks increase the reactive surface area. While molten glass coolswithin the carbon steel over pack, the temperature gradientbetween the perimeter and core of the glass leads to thermicshock-induced cracks. These cracks (also called defaults) providepreferential sites for alteration on a small scale, such as diffusion ofalkali ions into the surrounding environment.44
Experimentally, defaults within the glass matrix arealso observed during cooling and sample preparation(e.g., cutting). 45, 46 These processes are mechanically violentand generate a high number of micro cracks, or Griffith cracks, dueto the metastable nature of the glass structure.47 Griffithsummarized that the strength of the material was dependent ondefects such as these surface cracks. These Griffith cracks canspontaneously propagate due to external factors such asmechanical stress or chemical gradients. The evolution of thesemicro cracks into larger cracks can be compared to dislocations incrystals due to grain boundaries. Though the defaults are causedby different methods (formation vs. processing), the investigationof the alteration of non-polished glass surfaces can give insightinto the alteration of the cracks seen in large-scale wastematerials.The goal of this study is to further understand the alteration of
the glass waste form in the presence of iron corrosion products,specifically magnetite (iron (II,III) oxide). This study is an extensionof a similar experiment recently performed, in which experimentalconditions are similar to that of the present work, except that thepresent work includes the addition of an iron source.30
Comparison of results of this work with a reference experimentwithout an iron source allows for a better understanding of thealteration layer properties. The experiment was carried out inconditions initially saturated in 29Si to follow the isotopicexchange of silicon between the solution and glass to monitorchanges of the alteration layer. Additionally, five of the six sides ofthe glass monoliths were unpolished which provides insights intothe effect of surface cracks on the alteration progress of the glass.
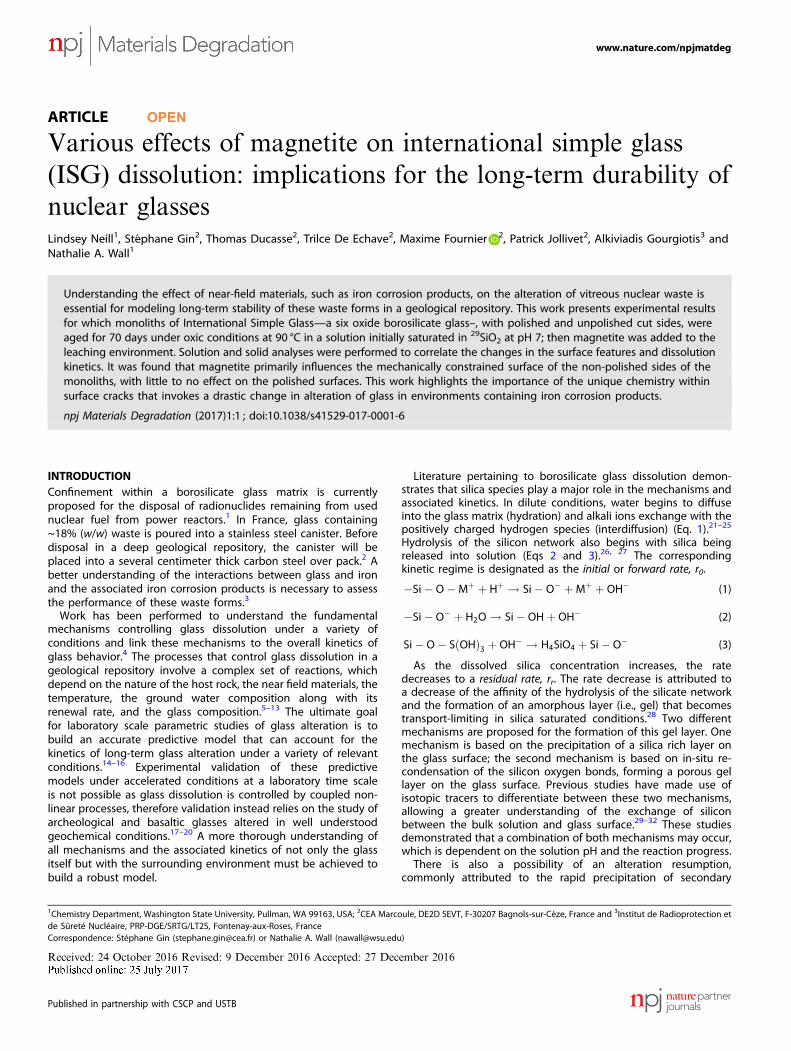
RESULTSSolution analysisResults from inductively coupled plasma—optical emissionspectroscopy (ICP-OES) for individual glass constitutes and multi-channel inductively coupled plasma—mass spectrometry (MC-ICP-MS) for silicon isotope concentrations are shown in Table 1.Figure 1 presents the silicon concentration, normalized loss (NL)
based on boron solution conditions, and pH over the experimenttime period. The pH was maintained during the 150 first days bymonitoring the solution and correcting to pH 7 using 0.5 M HNO3
or 0.5 M KOH. The pH was measured but not adjusted after thefirst 150 days; the pH then slowly increased to eight. This allowedthe pH to drift to a pH at which orthosilicic acid starts dissociatinginto anions (H3SiO4
−, H2SiO42−…), this seems to have an
insignificant effect on the glass dissolution rate (Fig. 2), whichremains essentially constant between day 126 and day 395. Overthe first 2 months, the glass was allowed to react in a solutionsaturated with amorphous silica under the same experimentalconditions as seen in Gin et al.30 In the present work, magnetitewas added 70 days after the experiment was initiated and asignificant decrease in the concentration of silicon was observedalmost immediately, with a decrease of ~60 p.p.m. of silicon withinthe first day after magnetite addition. This decrease extends for2 months after the addition of magnetite, at which point thesolution only contains 22 p.p.m. of silicon. The last data points (upto nine months after the addition of magnetite) show theresumption of alteration.Figure 2 presents the alteration rate changes over the duration
of the experiment based on the boron concentrations in solution.The rate continues to decrease after the addition of magnetite atday 70, although the rate never reaches the long term rates of 0.1nm per∙day observed by Gin et al.30 After ~100 days, the alterationrate increases. The rate reaches a maximum of ~100 nm per∙dayfor the rest of the experiment duration. While this is a largeincrease, the long-term rate never reaches the value observed atday one of this experiment (500 nm∙per day).Figure 3 demonstrates three different regimes involving the
isotopic silicon concentrations. The system is in equilibrium beforethe addition of magnetite, where surface layers form with little orno exchange of Si species in solution, as previously demon-strated.30 The second regime lasts between days 70–126, during
Fig. 1 Upper graph shows the pH (green triangles) during theexperiment. For each time point, the pH was measured and thenadjusted back to 7, except for the last three time points. Lowergraph shows the change in Si concentration (blue circles, bottom leftaxis) and the NL (red squares, bottom right axis) calculated from theboron concentration in solution. Resumption of alteration is seen atday 246 based on the increased concentration of boron and siliconin solution
Long-term durability of nuclear glassesL Neill et al.
2
npj Materials Degradation (2017) 1 Published in partnership with CSCP and USTB
which the available Si in solution is consumed, either by sorptionor precipitation on the magnetite surface or iron silicateprecipitation. The third regime continues beyond 126 days; Siconcentration increases, though only 28Si and 30Si increase while29Si continues to decrease. This demonstrates that later timepoints are a resumption of alteration of the glass itself. If theincreased concentrations of Si were due to dissolution of thesilicon sorbed on the magnetite surface, 29Si concentrations wouldhave risen as well.
Time-of-Flight Secondary Ion Mass Spectrometry (TOF-SIMS)analysis of the glass monolithsIn addition to monitoring changes by solution analysis, changes ofmobile elements within the alteration layer were analyzed usingTOF-SIMS. Monoliths were withdrawn from the solution at day 70(immediately before the addition of magnetite), day 84 (2 weeksafter addition), day 126 (2 months after addition) and day 246(almost 6 months after addition). Figure 4 shows the analysis ofthe polished face of the monolith at day 70, with the three mobilespecies (B, Na, and Ca) showing inverse correlation with thehydrous species (H). Sodium and calcium are known to exhibit thissigmoidal profile due to preferential dissolution of these elements,
Table 1. ICP-OES and MC-ICP-MS analysis of solution sampled at various time points
BD indicates that the value for that element was below the 0.1 mg L−1 detection limit. Dotted line represents the addition of magnetite ‘AGF’ stands for alteredglass fraction and ‘-’ within the MC-ICP-MS data denotes that the sample was not analyzed at that time point. There is a 10% uncertainty on each elementmeasured by ICP-OES except Na which has a 50% error due to contamination within the K salts used to synthesize the potassium silicates during alkalinefusion. These potassium silicates were used to prepare the initial solution of 150 p.p.m. Si. Elements measured by MC-ICP-MS have a 5% error due to matrixeffects. The dotted horizontal line represents the addition of magnetite.
Fig. 2 Rates of alteration calculated based on a linear regression ofthe equivalent thickness determined at each time point. The graydotted line represents the rates observed for the referenceexperiment with a 30% confidence interval (gray shading).30 Theblack dotted line represents the addition of magnetite at day 70
Fig. 3 28Si, 29Si, 30Si concentrations, as determined by MC-ICP-MSsolution analyses. The lower graph shows only 30Si as it makes upless than 1% of the total Si concentration. The dotted black linerepresents the addition of magnetite at day 70
Long-term durability of nuclear glassesL Neill et al.
3
Published in partnership with CSCP and USTB npj Materials Degradation (2017) 1
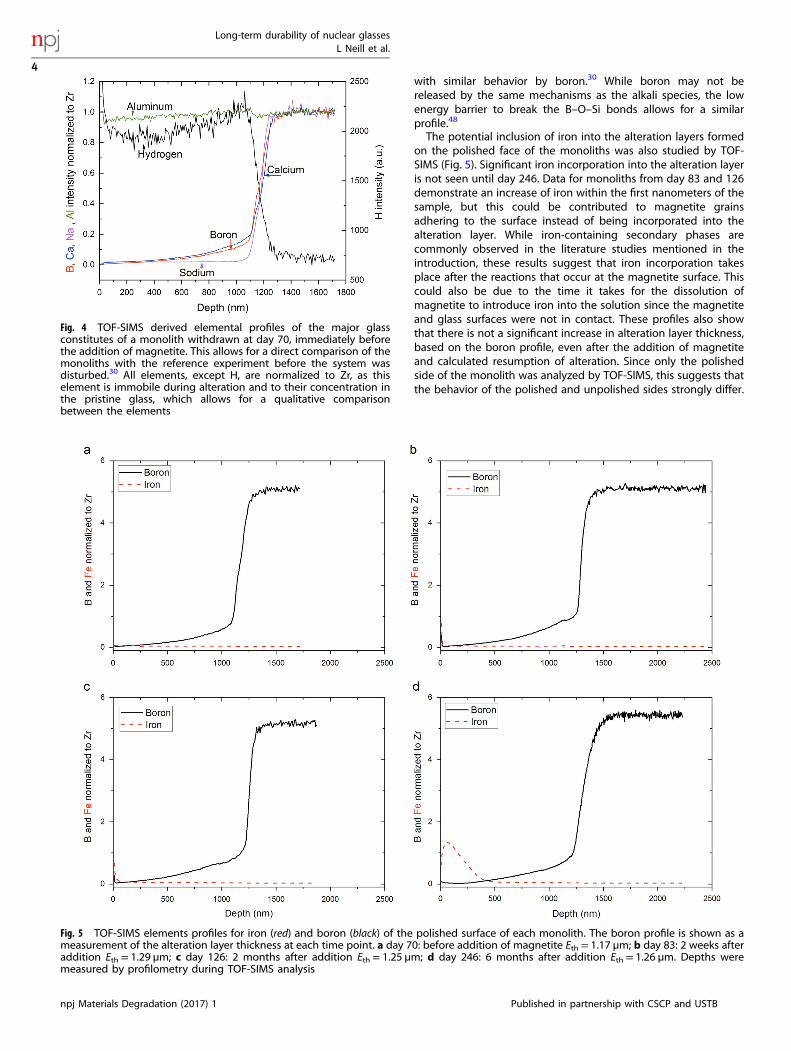
with similar behavior by boron.30 While boron may not bereleased by the same mechanisms as the alkali species, the lowenergy barrier to break the B–O–Si bonds allows for a similarprofile.48
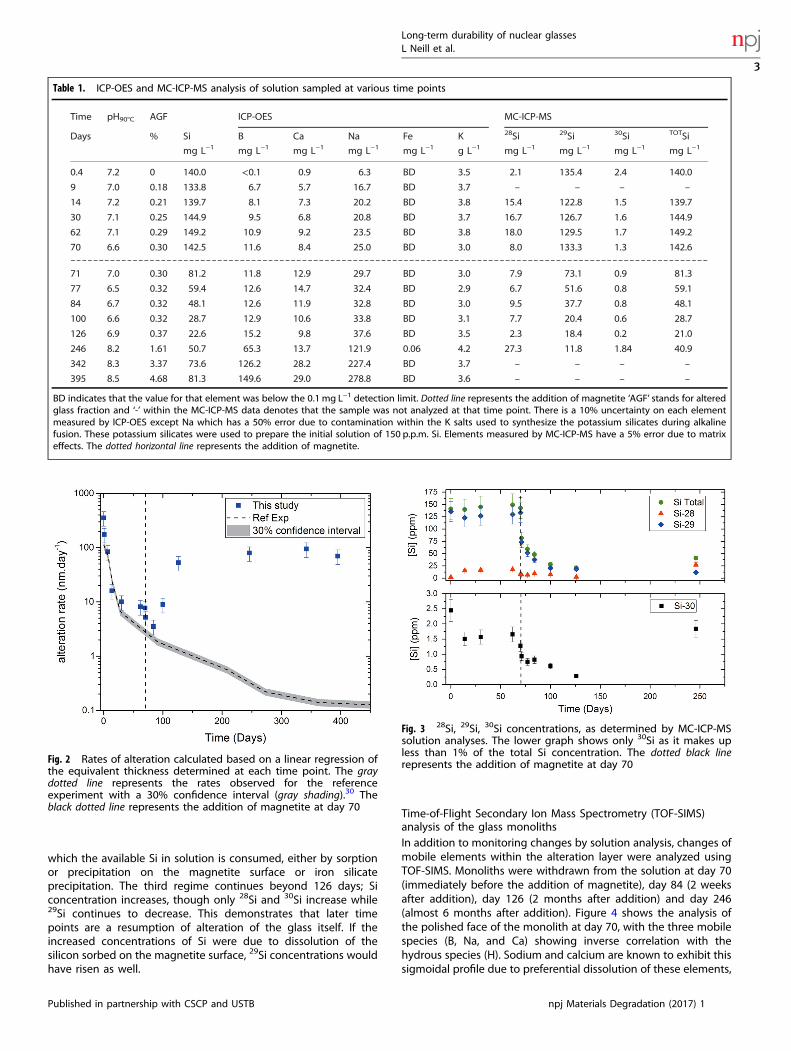
The potential inclusion of iron into the alteration layers formedon the polished face of the monoliths was also studied by TOF-SIMS (Fig. 5). Significant iron incorporation into the alteration layeris not seen until day 246. Data for monoliths from day 83 and 126demonstrate an increase of iron within the first nanometers of thesample, but this could be contributed to magnetite grainsadhering to the surface instead of being incorporated into thealteration layer. While iron-containing secondary phases arecommonly observed in the literature studies mentioned in theintroduction, these results suggest that iron incorporation takesplace after the reactions that occur at the magnetite surface. Thiscould also be due to the time it takes for the dissolution ofmagnetite to introduce iron into the solution since the magnetiteand glass surfaces were not in contact. These profiles also showthat there is not a significant increase in alteration layer thickness,based on the boron profile, even after the addition of magnetiteand calculated resumption of alteration. Since only the polishedside of the monolith was analyzed by TOF-SIMS, this suggests thatthe behavior of the polished and unpolished sides strongly differ.
Fig. 5 TOF-SIMS elements profiles for iron (red) and boron (black) of the polished surface of each monolith. The boron profile is shown as ameasurement of the alteration layer thickness at each time point. a day 70: before addition of magnetite Eth = 1.17 µm; b day 83: 2 weeks afteraddition Eth= 1.29 µm; c day 126: 2 months after addition Eth= 1.25 µm; d day 246: 6 months after addition Eth= 1.26 µm. Depths weremeasured by profilometry during TOF-SIMS analysis
Fig. 4 TOF-SIMS derived elemental profiles of the major glassconstitutes of a monolith withdrawn at day 70, immediately beforethe addition of magnetite. This allows for a direct comparison of themonoliths with the reference experiment before the system wasdisturbed.30 All elements, except H, are normalized to Zr, as thiselement is immobile during alteration and to their concentration inthe pristine glass, which allows for a qualitative comparisonbetween the elements
Long-term durability of nuclear glassesL Neill et al.
4
npj Materials Degradation (2017) 1 Published in partnership with CSCP and USTB
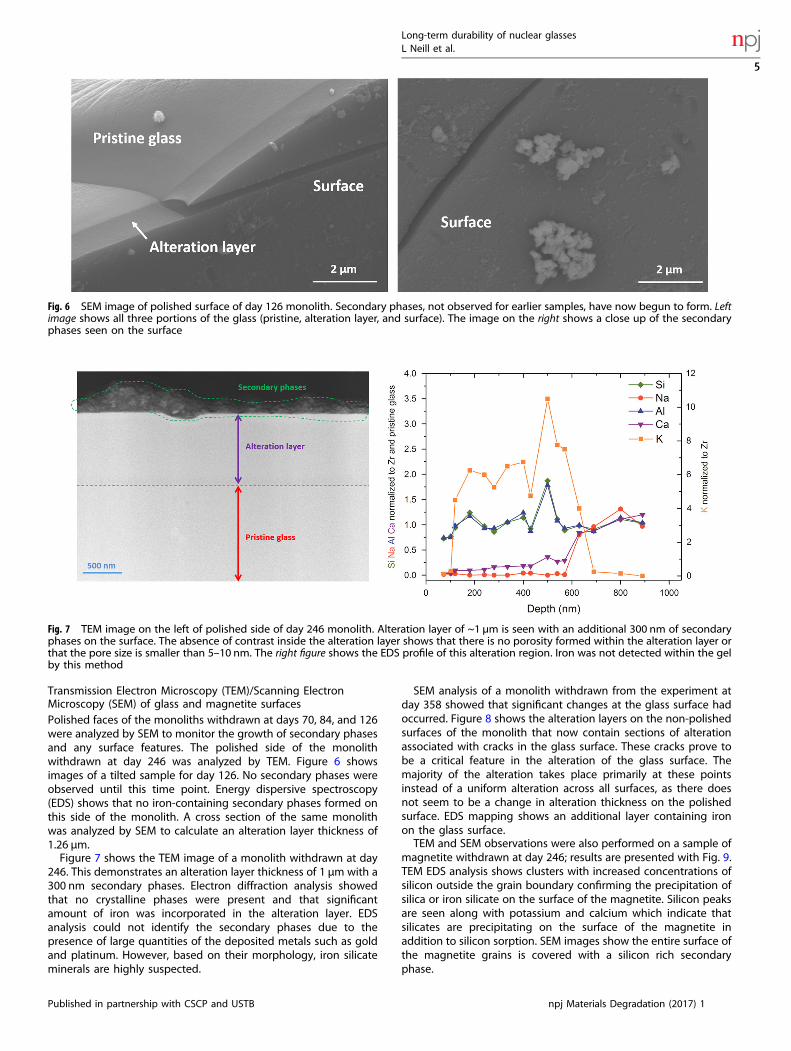
Transmission Electron Microscopy (TEM)/Scanning ElectronMicroscopy (SEM) of glass and magnetite surfacesPolished faces of the monoliths withdrawn at days 70, 84, and 126were analyzed by SEM to monitor the growth of secondary phasesand any surface features. The polished side of the monolithwithdrawn at day 246 was analyzed by TEM. Figure 6 showsimages of a tilted sample for day 126. No secondary phases wereobserved until this time point. Energy dispersive spectroscopy(EDS) shows that no iron-containing secondary phases formed onthis side of the monolith. A cross section of the same monolithwas analyzed by SEM to calculate an alteration layer thickness of1.26 µm.Figure 7 shows the TEM image of a monolith withdrawn at day
246. This demonstrates an alteration layer thickness of 1 µm with a300 nm secondary phases. Electron diffraction analysis showedthat no crystalline phases were present and that significantamount of iron was incorporated in the alteration layer. EDSanalysis could not identify the secondary phases due to thepresence of large quantities of the deposited metals such as goldand platinum. However, based on their morphology, iron silicateminerals are highly suspected.
SEM analysis of a monolith withdrawn from the experiment atday 358 showed that significant changes at the glass surface hadoccurred. Figure 8 shows the alteration layers on the non-polishedsurfaces of the monolith that now contain sections of alterationassociated with cracks in the glass surface. These cracks prove tobe a critical feature in the alteration of the glass surface. Themajority of the alteration takes place primarily at these pointsinstead of a uniform alteration across all surfaces, as there doesnot seem to be a change in alteration thickness on the polishedsurface. EDS mapping shows an additional layer containing ironon the glass surface.TEM and SEM observations were also performed on a sample of
magnetite withdrawn at day 246; results are presented with Fig. 9.TEM EDS analysis shows clusters with increased concentrations ofsilicon outside the grain boundary confirming the precipitation ofsilica or iron silicate on the surface of the magnetite. Silicon peaksare seen along with potassium and calcium which indicate thatsilicates are precipitating on the surface of the magnetite inaddition to silicon sorption. SEM images show the entire surface ofthe magnetite grains is covered with a silicon rich secondaryphase.
Fig. 7 TEM image on the left of polished side of day 246 monolith. Alteration layer of ~1 µm is seen with an additional 300 nm of secondaryphases on the surface. The absence of contrast inside the alteration layer shows that there is no porosity formed within the alteration layer orthat the pore size is smaller than 5–10 nm. The right figure shows the EDS profile of this alteration region. Iron was not detected within the gelby this method
Fig. 6 SEM image of polished surface of day 126 monolith. Secondary phases, not observed for earlier samples, have now begun to form. Leftimage shows all three portions of the glass (pristine, alteration layer, and surface). The image on the right shows a close up of the secondaryphases seen on the surface
Long-term durability of nuclear glassesL Neill et al.
5
Published in partnership with CSCP and USTB npj Materials Degradation (2017) 1
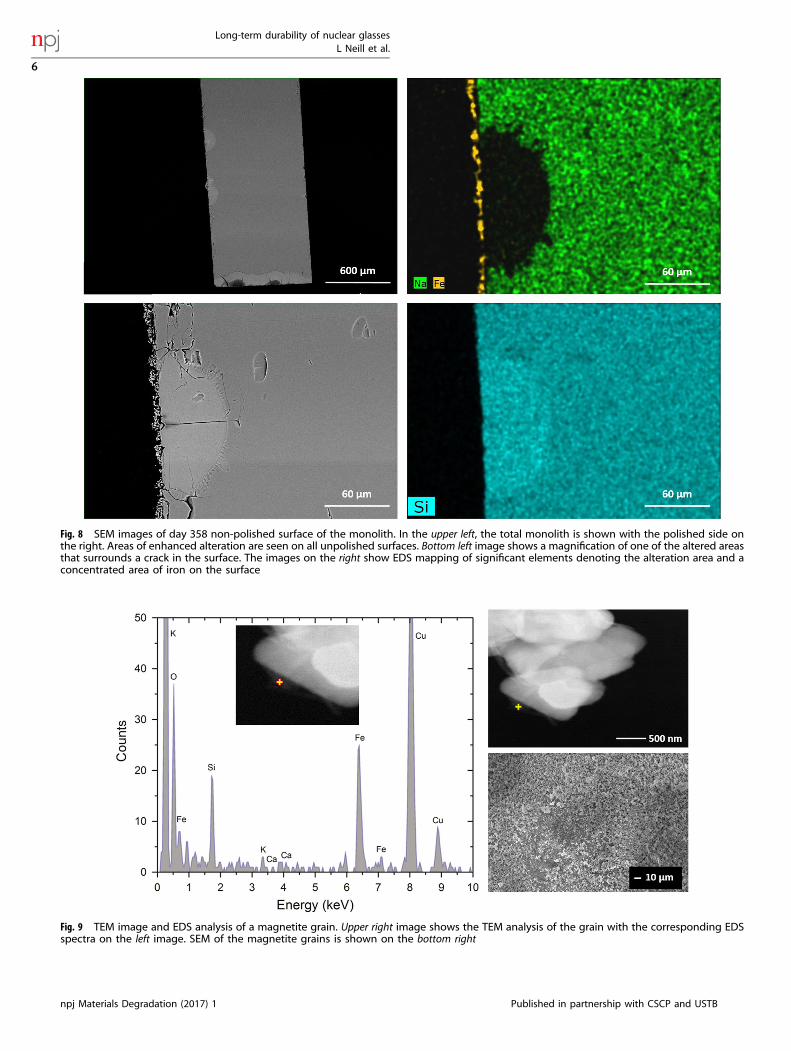
Fig. 9 TEM image and EDS analysis of a magnetite grain. Upper right image shows the TEM analysis of the grain with the corresponding EDSspectra on the left image. SEM of the magnetite grains is shown on the bottom right
Fig. 8 SEM images of day 358 non-polished surface of the monolith. In the upper left, the total monolith is shown with the polished side onthe right. Areas of enhanced alteration are seen on all unpolished surfaces. Bottom left image shows a magnification of one of the altered areasthat surrounds a crack in the surface. The images on the right show EDS mapping of significant elements denoting the alteration area and aconcentrated area of iron on the surface
Long-term durability of nuclear glassesL Neill et al.
6
npj Materials Degradation (2017) 1 Published in partnership with CSCP and USTB
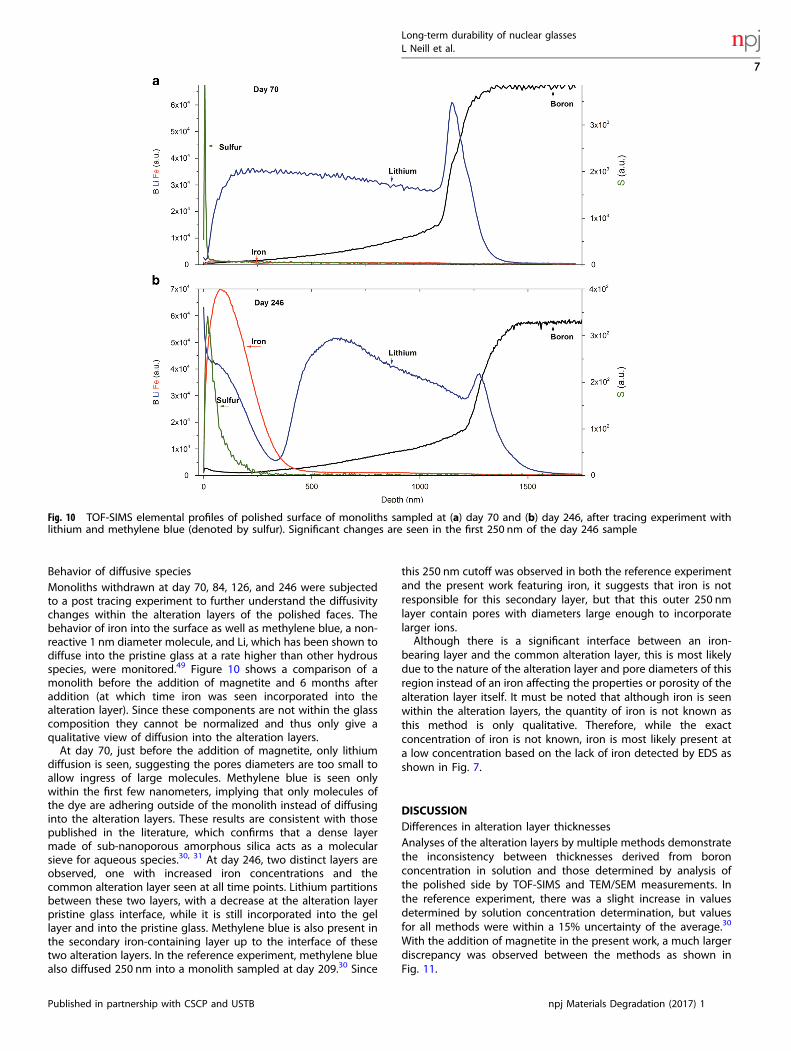
Behavior of diffusive speciesMonoliths withdrawn at day 70, 84, 126, and 246 were subjectedto a post tracing experiment to further understand the diffusivitychanges within the alteration layers of the polished faces. Thebehavior of iron into the surface as well as methylene blue, a non-reactive 1 nm diameter molecule, and Li, which has been shown todiffuse into the pristine glass at a rate higher than other hydrousspecies, were monitored.49 Figure 10 shows a comparison of amonolith before the addition of magnetite and 6 months afteraddition (at which time iron was seen incorporated into thealteration layer). Since these components are not within the glasscomposition they cannot be normalized and thus only give aqualitative view of diffusion into the alteration layers.At day 70, just before the addition of magnetite, only lithium
diffusion is seen, suggesting the pores diameters are too small toallow ingress of large molecules. Methylene blue is seen onlywithin the first few nanometers, implying that only molecules ofthe dye are adhering outside of the monolith instead of diffusinginto the alteration layers. These results are consistent with thosepublished in the literature, which confirms that a dense layermade of sub-nanoporous amorphous silica acts as a molecularsieve for aqueous species.30, 31 At day 246, two distinct layers areobserved, one with increased iron concentrations and thecommon alteration layer seen at all time points. Lithium partitionsbetween these two layers, with a decrease at the alteration layerpristine glass interface, while it is still incorporated into the gellayer and into the pristine glass. Methylene blue is also present inthe secondary iron-containing layer up to the interface of thesetwo alteration layers. In the reference experiment, methylene bluealso diffused 250 nm into a monolith sampled at day 209.30 Since
this 250 nm cutoff was observed in both the reference experimentand the present work featuring iron, it suggests that iron is notresponsible for this secondary layer, but that this outer 250 nmlayer contain pores with diameters large enough to incorporatelarger ions.Although there is a significant interface between an iron-
bearing layer and the common alteration layer, this is most likelydue to the nature of the alteration layer and pore diameters of thisregion instead of an iron affecting the properties or porosity of thealteration layer itself. It must be noted that although iron is seenwithin the alteration layers, the quantity of iron is not known asthis method is only qualitative. Therefore, while the exactconcentration of iron is not known, iron is most likely present ata low concentration based on the lack of iron detected by EDS asshown in Fig. 7.
DISCUSSIONDifferences in alteration layer thicknessesAnalyses of the alteration layers by multiple methods demonstratethe inconsistency between thicknesses derived from boronconcentration in solution and those determined by analysis ofthe polished side by TOF-SIMS and TEM/SEM measurements. Inthe reference experiment, there was a slight increase in valuesdetermined by solution concentration determination, but valuesfor all methods were within a 15% uncertainty of the average.30
With the addition of magnetite in the present work, a much largerdiscrepancy was observed between the methods as shown inFig. 11.
Fig. 10 TOF-SIMS elemental profiles of polished surface of monoliths sampled at (a) day 70 and (b) day 246, after tracing experiment withlithium and methylene blue (denoted by sulfur). Significant changes are seen in the first 250 nm of the day 246 sample
Long-term durability of nuclear glassesL Neill et al.
7
Published in partnership with CSCP and USTB npj Materials Degradation (2017) 1
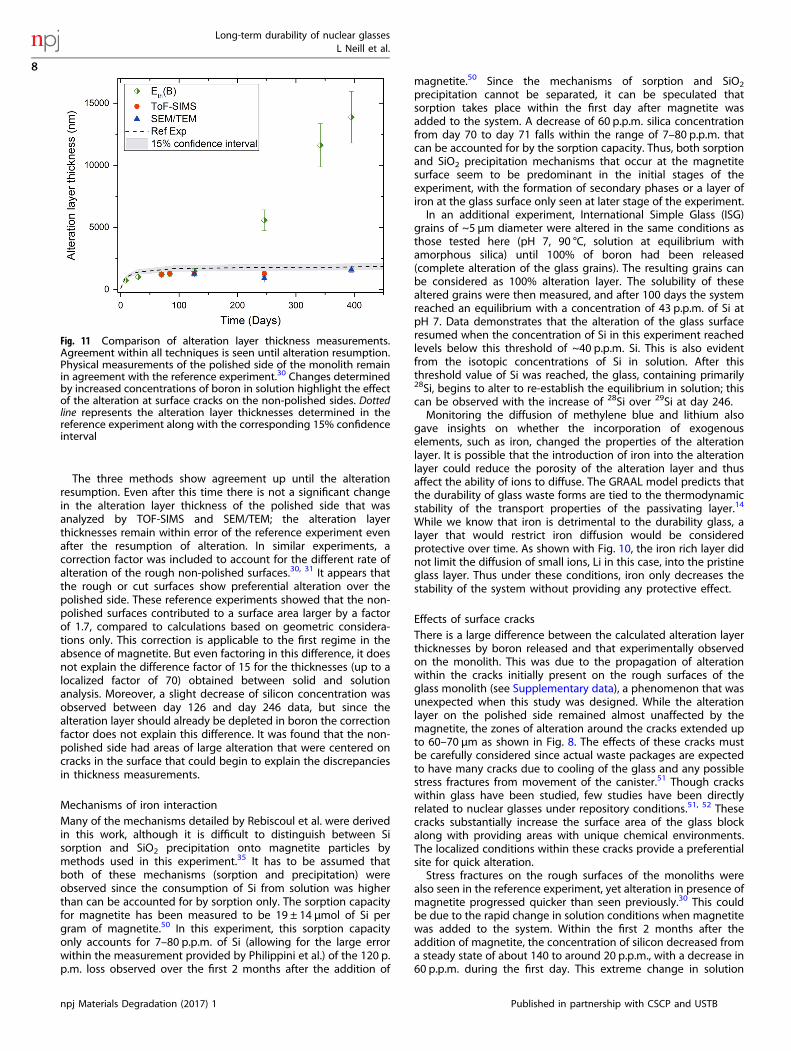
The three methods show agreement up until the alterationresumption. Even after this time there is not a significant changein the alteration layer thickness of the polished side that wasanalyzed by TOF-SIMS and SEM/TEM; the alteration layerthicknesses remain within error of the reference experiment evenafter the resumption of alteration. In similar experiments, acorrection factor was included to account for the different rate ofalteration of the rough non-polished surfaces.30, 31 It appears thatthe rough or cut surfaces show preferential alteration over thepolished side. These reference experiments showed that the non-polished surfaces contributed to a surface area larger by a factorof 1.7, compared to calculations based on geometric considera-tions only. This correction is applicable to the first regime in theabsence of magnetite. But even factoring in this difference, it doesnot explain the difference factor of 15 for the thicknesses (up to alocalized factor of 70) obtained between solid and solutionanalysis. Moreover, a slight decrease of silicon concentration wasobserved between day 126 and day 246 data, but since thealteration layer should already be depleted in boron the correctionfactor does not explain this difference. It was found that the non-polished side had areas of large alteration that were centered oncracks in the surface that could begin to explain the discrepanciesin thickness measurements.
Mechanisms of iron interactionMany of the mechanisms detailed by Rebiscoul et al. were derivedin this work, although it is difficult to distinguish between Sisorption and SiO2 precipitation onto magnetite particles bymethods used in this experiment.35 It has to be assumed thatboth of these mechanisms (sorption and precipitation) wereobserved since the consumption of Si from solution was higherthan can be accounted for by sorption only. The sorption capacityfor magnetite has been measured to be 19 ± 14 µmol of Si pergram of magnetite.50 In this experiment, this sorption capacityonly accounts for 7–80 p.p.m. of Si (allowing for the large errorwithin the measurement provided by Philippini et al.) of the 120 p.p.m. loss observed over the first 2 months after the addition of
magnetite.50 Since the mechanisms of sorption and SiO2
precipitation cannot be separated, it can be speculated thatsorption takes place within the first day after magnetite wasadded to the system. A decrease of 60 p.p.m. silica concentrationfrom day 70 to day 71 falls within the range of 7–80 p.p.m. thatcan be accounted for by the sorption capacity. Thus, both sorptionand SiO2 precipitation mechanisms that occur at the magnetitesurface seem to be predominant in the initial stages of theexperiment, with the formation of secondary phases or a layer ofiron at the glass surface only seen at later stage of the experiment.In an additional experiment, International Simple Glass (ISG)
grains of ~5 µm diameter were altered in the same conditions asthose tested here (pH 7, 90 °C, solution at equilibrium withamorphous silica) until 100% of boron had been released(complete alteration of the glass grains). The resulting grains canbe considered as 100% alteration layer. The solubility of thesealtered grains were then measured, and after 100 days the systemreached an equilibrium with a concentration of 43 p.p.m. of Si atpH 7. Data demonstrates that the alteration of the glass surfaceresumed when the concentration of Si in this experiment reachedlevels below this threshold of ~40 p.p.m. Si. This is also evidentfrom the isotopic concentrations of Si in solution. After thisthreshold value of Si was reached, the glass, containing primarily28Si, begins to alter to re-establish the equilibrium in solution; thiscan be observed with the increase of 28Si over 29Si at day 246.Monitoring the diffusion of methylene blue and lithium also
gave insights on whether the incorporation of exogenouselements, such as iron, changed the properties of the alterationlayer. It is possible that the introduction of iron into the alterationlayer could reduce the porosity of the alteration layer and thusaffect the ability of ions to diffuse. The GRAAL model predicts thatthe durability of glass waste forms are tied to the thermodynamicstability of the transport properties of the passivating layer.14
While we know that iron is detrimental to the durability glass, alayer that would restrict iron diffusion would be consideredprotective over time. As shown with Fig. 10, the iron rich layer didnot limit the diffusion of small ions, Li in this case, into the pristineglass layer. Thus under these conditions, iron only decreases thestability of the system without providing any protective effect.
Effects of surface cracksThere is a large difference between the calculated alteration layerthicknesses by boron released and that experimentally observedon the monolith. This was due to the propagation of alterationwithin the cracks initially present on the rough surfaces of theglass monolith (see Supplementary data), a phenomenon that wasunexpected when this study was designed. While the alterationlayer on the polished side remained almost unaffected by themagnetite, the zones of alteration around the cracks extended upto 60–70 µm as shown in Fig. 8. The effects of these cracks mustbe carefully considered since actual waste packages are expectedto have many cracks due to cooling of the glass and any possiblestress fractures from movement of the canister.51 Though crackswithin glass have been studied, few studies have been directlyrelated to nuclear glasses under repository conditions.51, 52 Thesecracks substantially increase the surface area of the glass blockalong with providing areas with unique chemical environments.The localized conditions within these cracks provide a preferentialsite for quick alteration.Stress fractures on the rough surfaces of the monoliths were
also seen in the reference experiment, yet alteration in presence ofmagnetite progressed quicker than seen previously.30 This couldbe due to the rapid change in solution conditions when magnetitewas added to the system. Within the first 2 months after theaddition of magnetite, the concentration of silicon decreased froma steady state of about 140 to around 20 p.p.m., with a decrease in60 p.p.m. during the first day. This extreme change in solution
Fig. 11 Comparison of alteration layer thickness measurements.Agreement within all techniques is seen until alteration resumption.Physical measurements of the polished side of the monolith remainin agreement with the reference experiment.30 Changes determinedby increased concentrations of boron in solution highlight the effectof the alteration at surface cracks on the non-polished sides. Dottedline represents the alteration layer thicknesses determined in thereference experiment along with the corresponding 15% confidenceinterval
Long-term durability of nuclear glassesL Neill et al.
8
npj Materials Degradation (2017) 1 Published in partnership with CSCP and USTB
conditions caused the resumption of alteration and it was thesurface cracks that provided sites for this alteration to reestablishthe equilibrium between solution and the glass matrix.Several studies have demonstrated that unique chemical
environments exist within these cracks. The literature showed anincrease in diffusion constants of ions, specifically Na, within thecracks when compared to the bulk glass.53, 54 The diffusion ofthese ions also creates a condensate region at the surface of theglass around the cracks. The pH in these regions increasescompared to that of the bulk solution, which can lead to regionsof increased silicate ion formation due to hydrolysis.55 Therefore,crack formation is not specific to glasses in contact with iron, butiron can take advantage of these particular areas with uniquechemistry in comparison with the bulk surface. This facilitateslarge regions of alteration that were not seen on the time scale ofthe reference experiment. Since the rate of propagation increaseswith an increasing crack length, the formation of these areas couldbe detrimental to the overall durability of the bulk glass.56 Futurestudies will determined how the growing gel modifies themechanical properties of the underlying glass, allowing newcracks to form.
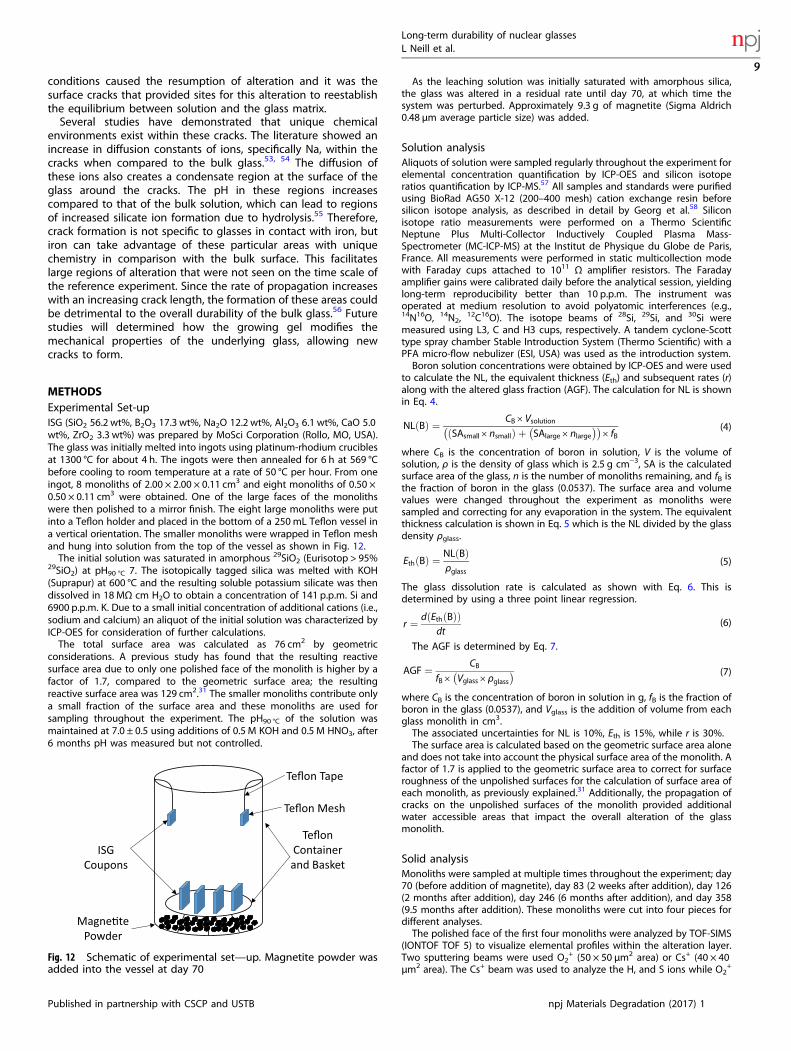
METHODSExperimental Set-upISG (SiO2 56.2 wt%, B2O3 17.3 wt%, Na2O 12.2 wt%, Al2O3 6.1 wt%, CaO 5.0wt%, ZrO2 3.3 wt%) was prepared by MoSci Corporation (Rollo, MO, USA).The glass was initially melted into ingots using platinum-rhodium cruciblesat 1300 °C for about 4 h. The ingots were then annealed for 6 h at 569 °Cbefore cooling to room temperature at a rate of 50 °C per hour. From oneingot, 8 monoliths of 2.00 × 2.00 × 0.11 cm3 and eight monoliths of 0.50 ×0.50 × 0.11 cm3 were obtained. One of the large faces of the monolithswere then polished to a mirror finish. The eight large monoliths were putinto a Teflon holder and placed in the bottom of a 250mL Teflon vessel ina vertical orientation. The smaller monoliths were wrapped in Teflon meshand hung into solution from the top of the vessel as shown in Fig. 12.The initial solution was saturated in amorphous 29SiO2 (Eurisotop > 95%
29SiO2) at pH90 °C 7. The isotopically tagged silica was melted with KOH(Suprapur) at 600 °C and the resulting soluble potassium silicate was thendissolved in 18 MΩ cm H2O to obtain a concentration of 141 p.p.m. Si and6900 p.p.m. K. Due to a small initial concentration of additional cations (i.e.,sodium and calcium) an aliquot of the initial solution was characterized byICP-OES for consideration of further calculations.The total surface area was calculated as 76 cm2 by geometric
considerations. A previous study has found that the resulting reactivesurface area due to only one polished face of the monolith is higher by afactor of 1.7, compared to the geometric surface area; the resultingreactive surface area was 129 cm2.31 The smaller monoliths contribute onlya small fraction of the surface area and these monoliths are used forsampling throughout the experiment. The pH90 °C of the solution wasmaintained at 7.0 ± 0.5 using additions of 0.5 M KOH and 0.5 M HNO3, after6 months pH was measured but not controlled.
As the leaching solution was initially saturated with amorphous silica,the glass was altered in a residual rate until day 70, at which time thesystem was perturbed. Approximately 9.3 g of magnetite (Sigma Aldrich0.48 µm average particle size) was added.
Solution analysisAliquots of solution were sampled regularly throughout the experiment forelemental concentration quantification by ICP-OES and silicon isotoperatios quantification by ICP-MS.57 All samples and standards were purifiedusing BioRad AG50 X-12 (200–400 mesh) cation exchange resin beforesilicon isotope analysis, as described in detail by Georg et al.58 Siliconisotope ratio measurements were performed on a Thermo ScientificNeptune Plus Multi-Collector Inductively Coupled Plasma Mass-Spectrometer (MC-ICP-MS) at the Institut de Physique du Globe de Paris,France. All measurements were performed in static multicollection modewith Faraday cups attached to 1011 Ω amplifier resistors. The Faradayamplifier gains were calibrated daily before the analytical session, yieldinglong-term reproducibility better than 10 p.p.m. The instrument wasoperated at medium resolution to avoid polyatomic interferences (e.g.,14N16O, 14N2,
12C16O). The isotope beams of 28Si, 29Si, and 30Si weremeasured using L3, C and H3 cups, respectively. A tandem cyclone-Scotttype spray chamber Stable Introduction System (Thermo Scientific) with aPFA micro-flow nebulizer (ESI, USA) was used as the introduction system.Boron solution concentrations were obtained by ICP-OES and were used
to calculate the NL, the equivalent thickness (Eth) and subsequent rates (r)along with the altered glass fraction (AGF). The calculation for NL is shownin Eq. 4.
NLðBÞ ¼ CB ´ VsolutionSAsmall ´ nsmallð Þ þ SAlarge ´ nlarge
� �� �´ fB
(4)
where CB is the concentration of boron in solution, V is the volume ofsolution, ρ is the density of glass which is 2.5 g cm−3, SA is the calculatedsurface area of the glass, n is the number of monoliths remaining, and fB isthe fraction of boron in the glass (0.0537). The surface area and volumevalues were changed throughout the experiment as monoliths weresampled and correcting for any evaporation in the system. The equivalentthickness calculation is shown in Eq. 5 which is the NL divided by the glassdensity ρglass.
EthðBÞ ¼ NLðBÞρglass
(5)
The glass dissolution rate is calculated as shown with Eq. 6. This isdetermined by using a three point linear regression.
r ¼ d Eth Bð Þð Þdt
(6)
The AGF is determined by Eq. 7.
AGF ¼ CBfB ´ Vglass ´ ρglass
� � (7)
where CB is the concentration of boron in solution in g, fB is the fraction ofboron in the glass (0.0537), and Vglass is the addition of volume from eachglass monolith in cm3.The associated uncertainties for NL is 10%, Eth is 15%, while r is 30%.The surface area is calculated based on the geometric surface area alone
and does not take into account the physical surface area of the monolith. Afactor of 1.7 is applied to the geometric surface area to correct for surfaceroughness of the unpolished surfaces for the calculation of surface area ofeach monolith, as previously explained.31 Additionally, the propagation ofcracks on the unpolished surfaces of the monolith provided additionalwater accessible areas that impact the overall alteration of the glassmonolith.
Solid analysisMonoliths were sampled at multiple times throughout the experiment; day70 (before addition of magnetite), day 83 (2 weeks after addition), day 126(2 months after addition), day 246 (6 months after addition), and day 358(9.5 months after addition). These monoliths were cut into four pieces fordifferent analyses.The polished face of the first four monoliths were analyzed by TOF-SIMS
(IONTOF TOF 5) to visualize elemental profiles within the alteration layer.Two sputtering beams were used O2
+ (50 × 50 μm2 area) or Cs+ (40 × 40μm2 area). The Cs+ beam was used to analyze the H, and S ions while O2
+
ISG Coupons
Magne�te Powder
Teflon Container and Basket
Teflon Tape
Teflon Mesh
Fig. 12 Schematic of experimental set—up. Magnetite powder wasadded into the vessel at day 70
Long-term durability of nuclear glassesL Neill et al.
9
Published in partnership with CSCP and USTB npj Materials Degradation (2017) 1
was used for all other ions. All ions are normalized to Zr, to minimize thematrix effects, as this element is immobile during alteration.59
For monolith analysis by TEM, a thin section was extracted from thepolished face of the sample and milled up to a thickness of ~100 nm. Thesample was sputtered with an Au/Pd mixture and coated with Pt forprotection. Observations and analyses were carried out with a Technai G2(FEI) TEM microscope equipped with a LaB6 source operating at 200 kV. AGATAN CCD camera, a BF-DF detector, and an EDX detector EDAX Genesiswere used. The spatial resolution was 0.27 nm and the EDS spot size of 5and 10 nm. For EDX analysis, the sample was tilted of 20° to minimize theoverlaying of different phases. The counting time was 20 s to limitevaporation of mobile elements. SEM-EDS (JEOL JXA-8500 F) was also usedto observe the alteration layers and surface features of the day-126(polished face) and the day 358 (rough cut face) monoliths.A post-experiment tracing was performed on the monoliths withdrawn
at days 70, 83,126, and 246. The monoliths were placed in a saturatedamorphous 28SiO2 at pH 7 at room temperature for 100 h. The solution alsocontained 4.4 × 10⁻⁴ mol L−1 methylene blue and 0.1 mol L−1 LiCl. TOF-SIMS was performed on the polished face of the samples to study thediffusivity of these aqueous species into the developing alteration layers.This allowed for comparison to the reference sample to further understandthe influence of iron on the properties of the alteration layer.
ACKNOWLEDGEMENTSThis research was performed using funding received from the U.S. DOE Office ofNuclear Energy’s Nuclear Energy University Program under Project 23–3361 inaddition to funding provided by the CEA, Areva, and the Chateaubriand Fellowshipfrom the Embassy of France in the U.S. Authors warmly thank Laurent Dupuy atBiophy Research, France for the TOF-SIMS analysis, Martiane Cabié at Aix-MarseilleUniversity, France, for assistance with TEM, and CEA technical staffs for SEM analysesand Thibaut Martin for technical assistance.
AUTHOR CONTRIBUTIONSL.N. initiated and was directly responsible for the experiment; she completed dataanalysis with the help of S.G. The article was also co-written by these two authors.A.G., T.D., and, T.E. performed MC-ICP-MS and TEM analysis. M.F. performed analysisof the unaltered monoliths. P.J. and N.W. acted as mentors for the experimental setup and editors throughout the writing process.
ADDITIONAL INFORMATIONSupplementary Information accompanies the paper on the npj MaterialsDegradation website (doi:10.1038/s41529-017-0001-6).
Competing interests: The authors declare that they have no competing financialinterests.
Publisher's note: Springer nature remains neutral with regard to jurisdictionalclaims in published maps and institutional affiliations.
REFERENCES1. Donald, I. Waste Immobilization in Glass and Ceramic Based Hosts: Radioactive,
Toxic And Hazardous Wastes. (Wiley, 2010).2. ANDRA (Agence Nationale pour la gestion des Déchets RAdioactifs). Dossier
2005: Andra research of the geological disposal of high-level long-lived radio-active waste. Results and Perspectives (2005).
3. Gin, S. et al. An international initiative on long-term behavior of high-levelnuclear waste glass. Mater. Today 16, 243–248 (2013).
4. Vienna, J. D., Ryan, J. V., Gin, S. & Inagaki, Y. Current understanding and remainingchallenges in modeling long-term degradation of borosilicate nuclear wasteglasses. Int. J. Appl. Glass Sci 4, 283–294 (2013).
5. Fleury, B. et al. Development of an experimental design to investigate the effectsof r7t7 glass composition on the residual rate of alteration. Procedia Mater. Sci 7,193–201 (2014).
6. Frugier, P., Martin, C., Ribet, I., Advocat, T. & Gin, S. The effect of composition onthe leaching of three nuclear waste glasses: R7T7, AVM and VRZ. J. Nucl. Mater.346, 194–207 (2005).
7. Gin, S., Beaudoux, X., Angéli, F., Jégou, C. & Godon, N. Effect of composition onthe short-term and long-term dissolution rates of ten borosilicate glasses of
increasing complexity from 3 to 30 oxides. J. Non-Cryst. Solids 358, 2559–2570(2012).
8. Jantzen, C. M., Brown, K. G. & Pickett, J. B. Durable glass for thousands of years.Int. J. Appl. Glass Sci 1, 38–62 (2010).
9. Pierce, E. M. et al. Experimental determination of the effect of the ratio of B/Al onglass dissolution along the nepheline (NaAlSiO4)–malinkoite (NaBSiO4) join.Geochim. Cosmochim. Acta 74, 2634–2654 (2010).
10. Pierce, E. M., Rodriguez, E. A., Calligan, L. J., Shaw, W. J. & Pete McGrail, B. Anexperimental study of the dissolution rates of simulated aluminoborosilicatewaste glasses as a function of pH and temperature under dilute conditions. Appl.Geochem. 23, 2559–2573 (2008).
11. Werme, L. O., Hench, L. L., Nogues, J.-L., Odelius, H. & Lodding, A. On the pHdependence of leaching of nuclear waste glasses. J. Nucl. Mater. 116, 69–77(1983).
12. Andriambololona, Z., Godon, N. & Vernaz, E. R7T7 nuclear glass alteration in asaline medium: in situ experiments in the WIPP project. Appl. Geochem. 7, 23–32(1992).
13. Jollivet, P. et al. Effect of clayey groundwater on the dissolution rate of thesimulated nuclear waste glass SON68. J. Nucl. Mater. 420, 508–518 (2012).
14. Frugier, P. et al. SON68 nuclear glass dissolution kinetics: current state ofknowledge and basis of the new GRAAL model. J. Nucl. Mater. 380, 8–21 (2008).
15. Grambow, B. & Muller, R. First-order dissolution rate law and the role of surfacelayers in glass performance assessment. J. Nucl. Mater. 298, 112–124 (2001).
16. McGrail, B. P., Ebert, W. L., Bakel, A. J. & Peeler, D. K. Measurement of kinetic ratelaw parameters on a Na-Ca-Al borosilicate glass for low-activity waste. J. Nucl.Mater. 249, 175–189 (1997).
17. Libourel, G. et al. The use of natural and archeological analogues for under-standing the long-term behavior of nuclear glasses. Comptes Rendus Geosci. 343,237–245 (2011).
18. Parruzot, B., Jollivet, P., Rébiscoul, D. & Gin, S. Long-term alteration of basalticglass: mechanisms and rates. Geochim. Cosmochim. Acta 154, 28–48 (2015).
19. Verney-Carron, A., Gin, S., Frugier, P. & Libourel, G. Long-term modeling ofalteration-transport coupling: application to a fractured Roman glass. Geochim.Cosmochim. Acta 74, 2291–2315 (2010).
20. Poinssot, C. & Gin, S. Long-term behavior science: the cornerstone approach forreliably assessing the long-term performance of nuclear waste. J. Nucl. Mater.420, 182–192 (2012).
21. Doremus, R. H. Diffusion-controlled reaction of water with glass. J. Non-Cryst.Solids 55, 143–147 (1983).
22. Boksay, Z., Bouquet, G. & Dobos, S. Diffusion processes in surface layers of glass.Phys. Chem. Glasses 8, 140–144 (1967).
23. Ojovan, M. I., Pankov, A. & Lee, W. E. The ion exchange phase in corrosion ofnuclear waste glasses. J. Nucl. Mater. 358, 57–68 (2006).
24. Gin, S. et al. The controversial role of inter-diffusion in glass alteration. Chem.Geol. 440, 115–123 (2016).
25. Doremus, R. H. Interdiffusion of hydrogen and alkali ions in a glass surface. J. Non-Cryst. Solids 19, 137–144 (1975).
26. Hench, L. Physical chemistry of glass surfaces. J. Non Cryst. Solids 25, 343–369(1977).
27. Techer, I., Advocat, T., Lancelot, J. & Liotard, J. M. Dissolution kinetics of basalticglasses: control by solution chemistry and protective effect of the alteration film.Chem. Geol. 176, 235–263 (2001).
28. Van Iseghem, P. et al. in Environmental Issues and Waste Management Technol-ogies in the Materials and Nuclear Industries XII (eds Cozzi, A. & Ohji, T.) 115–126(Wiley, 2009).
29. Geisler, T. et al. Aqueous corrosion of borosilicate glass under acidic conditions: anew corrosion mechanism. J. Non-Cryst. Solids 356, 1458–1465 (2010).
30. Gin, S. et al. Origin and consequences of silicate glass passivation by surfacelayers. Nat. Commun. 6, 6360 (2015).
31. Gin, S. et al. The fate of silicon during glass corrosion under alkaline conditions: amechanistic and kinetic study with the international simple glass. Geochim.Cosmochim. Acta 151, 68–85 (2015).
32. Valle, N. et al. Elemental and isotopic (Si-29 and O-18) tracing of glass alterationmechanisms. Geochim. Cosmochim. Acta 74, 3412–3431 (2010).
33. Fournier, M., Gin, S. & Frugier, P. Resumption of nuclear glass alteration: state ofthe art. J. Nucl. Mater. 448, 348–363 (2014).
34. Gin, S., Godon, N., Mestre, J. P., Vernaz, E. Y. & Beaufort, D. Experimental inves-tigation of aqueous corrosion of R7T7 nuclear glass at 90°C in the presence oforganic species. Appl. Geochem. 9, 255–269 (1994).
35. Rebiscoul, D. et al. Reactive transport processes occurring during nuclear glassalteration in presence of magnetite. Appl. Geochem. 58, 26–37 (2015).
36. Ribet, S. & Gin, S. Role of neoformed phases on the mechanisms controlling theresumption of SON68 glass alteration in alkaline media. J. Nucl. Mater. 324,152–164 (2004).
Long-term durability of nuclear glassesL Neill et al.
10
npj Materials Degradation (2017) 1 Published in partnership with CSCP and USTB
37. Bildstein, O., Trotignon, L., Perronnet, M. & Jullien, M. Modelling iron–clay inter-actions in deep geological disposal conditions. Phys. Chem. Earth Parts ABC 31,618–625 (2006).
38. Burger, E. et al. Impact of iron on nuclear glass alteration in geological repositoryconditions: a multiscale approach. Appl. Geochem. 31, 159–170 (2013).
39. Dillmann, P., Gin, S., Neff, D., Gentaz, L. & Rebiscoul, D. Effect of natural andsynthetic iron corrosion products on silicate glass alteration processes. Geochim.Cosmochim. Acta 172, 287–305 (2016).
40. Godon, N., Gin, S. & Frugier, P. SON68 glass alteration enhanced by magnetite.Procedia Earth Planet. Sci 7, 300–303 (2013).
41. McVAY, G. L. & Buckwalter, C. Q. Effect of iron on waste-glass leaching. J. Am.Ceram. Soc. 66, 170–174 (1983).
42. Michelin, A. et al. Archeological slag from Glinet: an example ofsilicate glass altered in an anoxic iron-rich environment. Chem. Geol. 413, 28–43(2015).
43. Michelin, A. et al. Silicate glass alteration enhanced by iron: origin and long-termimplications. Environ. Sci. Technol. 47, 750–756 (2013).
44. Kittel, C. Introduction to Solid State Physics. (Wiley, 2005).45. Hed, P. & Edwards, D. Optical glass fabrication technology. 2: relationship
between surface roughness and subsurface damage. Appl. Opt. 26, 4677–4680(1987).
46. Preston, F. W. The structure of abraded glass surfaces. Trans. Opt. Soc. 23,141–164 (1922).
47. Griffith, A. A. The phenomena of rupture and flow in solids. Philos. Trans. R. Soc.Lond. Ser. Contain. Pap. Math. Phys. Character 221, 163–198 (1921).
48. Zapol, P., He, H., Kwon, K. D. & Criscenti, L. J. First-principles study of hydrolysisreaction barriers in a sodium borosilicate glass. Int. J. Appl. Glass Sci 4, 395–407(2013).
49. Neeway, J. J. et al. Low-temperature lithium diffusion in simulated high-level boroaluminosilicate nuclear waste glasses. J. Non-Cryst. Solids 405, 83–90(2014).
50. Philippini, V., Naveau, A., Catalette, H. & Leclercq, S. Sorption of siliconon magnetite and other corrosion products of iron. J. Nucl. Mater. 348, 60–69(2006).
51. Mallet, C., Fortin, J., Guéguen, Y. & Bouyer, F. Evolution of the crack network inglass samples submitted to brittle creep conditions. Int. J. Fract 190, 111–124(2014).
52. Ougier-Simonin, A., Guéguen, Y., Fortin, J., Schubnel, A. & Bouyer, F. Permeabilityand elastic properties of cracked glass under pressure. J. Geophys. Res. Solid Earth116, B07203 (2011).
53. Celarie, F., Ciccotti, M. & Marlière, C. Stress-enhanced ion diffusion at the vicinityof a crack tip as evidenced by atomic force microscopy in silicate glasses. J. Non-Cryst. Solids 353, 51–68 (2007).
54. Wiederhorn, S. M., Guin, J.-P. & Fett, T. The use of atomic force microscopy tostudy crack tips in glass. Metall. Mater. Trans. A 42, 267–278 (2010).
55. Wiederhorn, S. M., Fett, T., Guin, J.-P. & Ciccotti, M. Griffith cracks at the nanoscale.Int. J. Appl. Glass Sci 4, 76–86 (2013).
56. Freiman, S. W., Wiederhorn, S. M., Mecholsky, J. & John, J. Environmentallyenhanced fracture of glass: a historical perspective. J. Am. Ceram. Soc 92,1371–1382 (2009).
57. Alkiviadis, G. et al. Silicon isotope ratio measurements by inductively coupledplasma tandem mass spectrometry for alteration studies of nuclear waste glasses.Anal. Chim. Acta. doi:10.1016/j.aca.2016.11.063.
58. Georg, R. B., Reynolds, B. C., Frank, M. & Halliday, A. N. New sample preparationtechniques for the determination of Si isotopic compositions using MC-ICPMS.Chem. Geol. 235, 95–104 (2006).
59. Cailleteau, C. et al. Insight into silicate-glass corrosion mechanisms. Nat. Mater. 7,978–983 (2008).
Open Access This article is licensed under a Creative CommonsAttribution 4.0 International License, which permits use, sharing,
adaptation, distribution and reproduction in anymedium or format, as long as you giveappropriate credit to the original author(s) and the source, provide a link to the CreativeCommons license, and indicate if changes were made. The images or other third partymaterial in this article are included in the article’s Creative Commons license, unlessindicated otherwise in a credit line to the material. If material is not included in thearticle’s Creative Commons license and your intended use is not permitted by statutoryregulation or exceeds the permitted use, you will need to obtain permission directlyfrom the copyright holder. To view a copy of this license, visit http://creativecommons.org/licenses/by/4.0/.
© The Author(s) 2017
Long-term durability of nuclear glassesL Neill et al.
11
Published in partnership with CSCP and USTB npj Materials Degradation (2017) 1