Embed Size (px)
Citation preview

VDOT and MAP 21 PerformanceVDOT and MAP-21 Performance ManagementVA SITE Annual MeetingJune 27, 2013Jay StylesP f d St t i Pl iPerformance and Strategic Planning Manager, Business Transformation Office
Overview
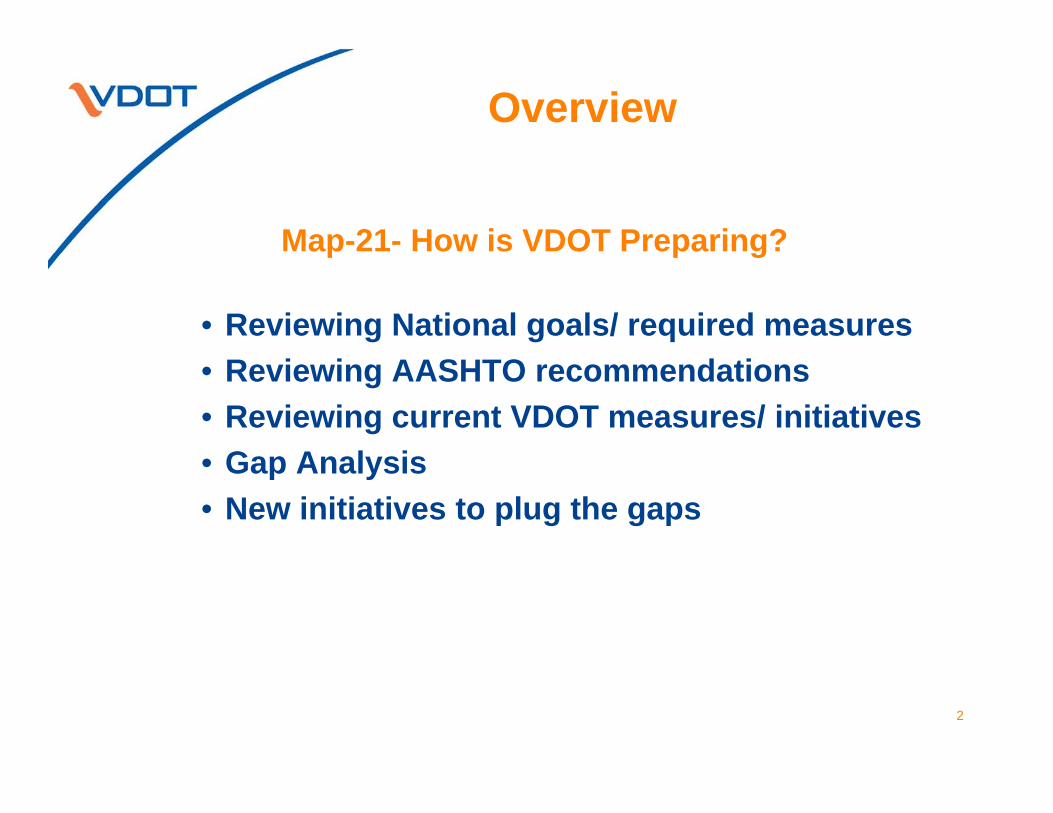
Map-21- How is VDOT Preparing? p p g
• Reviewing National goals/ required measures• Reviewing AASHTO recommendations• Reviewing current VDOT measures/ initiatives
Gap Analysis• Gap Analysis • New initiatives to plug the gaps
2
VDOT Performance Management
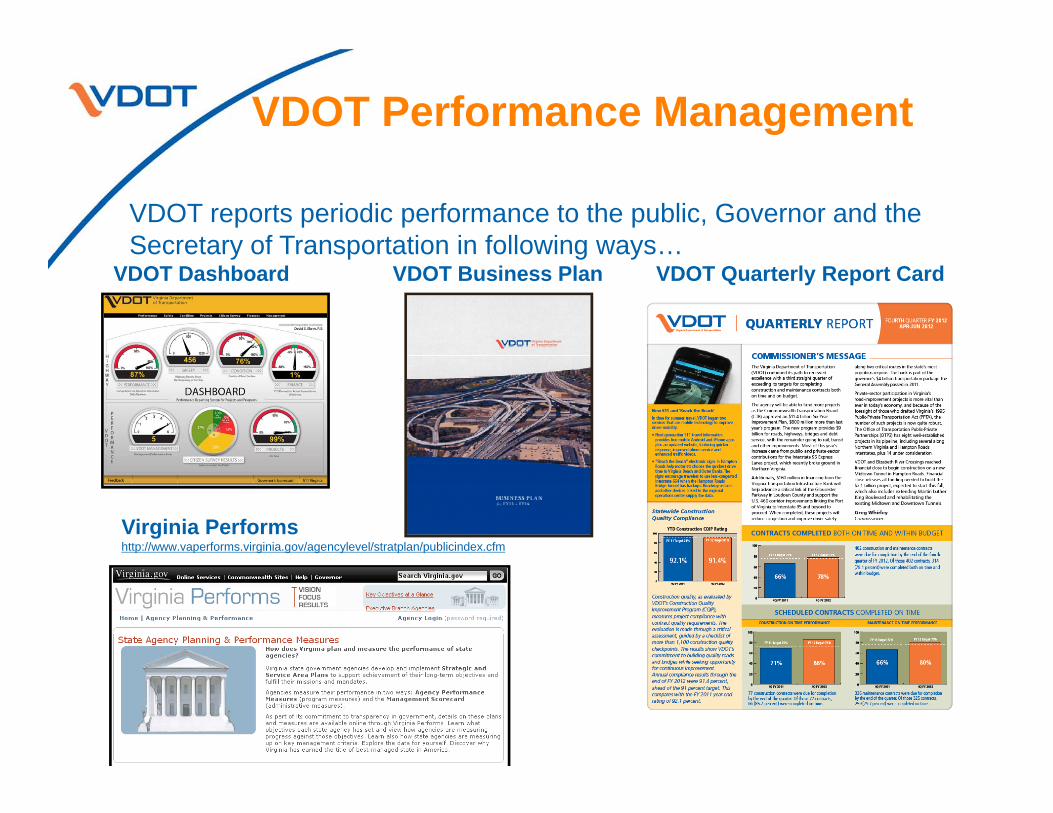
VDOT reports periodic performance to the public, Governor and the Secretary of Transportation in following ways…Secretary of Transportation in following ways…
VDOT Dashboard VDOT Quarterly Report CardVDOT Business Plan
Virginia Performshttp://www.vaperforms.virginia.gov/agencylevel/stratplan/publicindex.cfm
3
MAP- 21 National Goals and P f MPerformance Measures
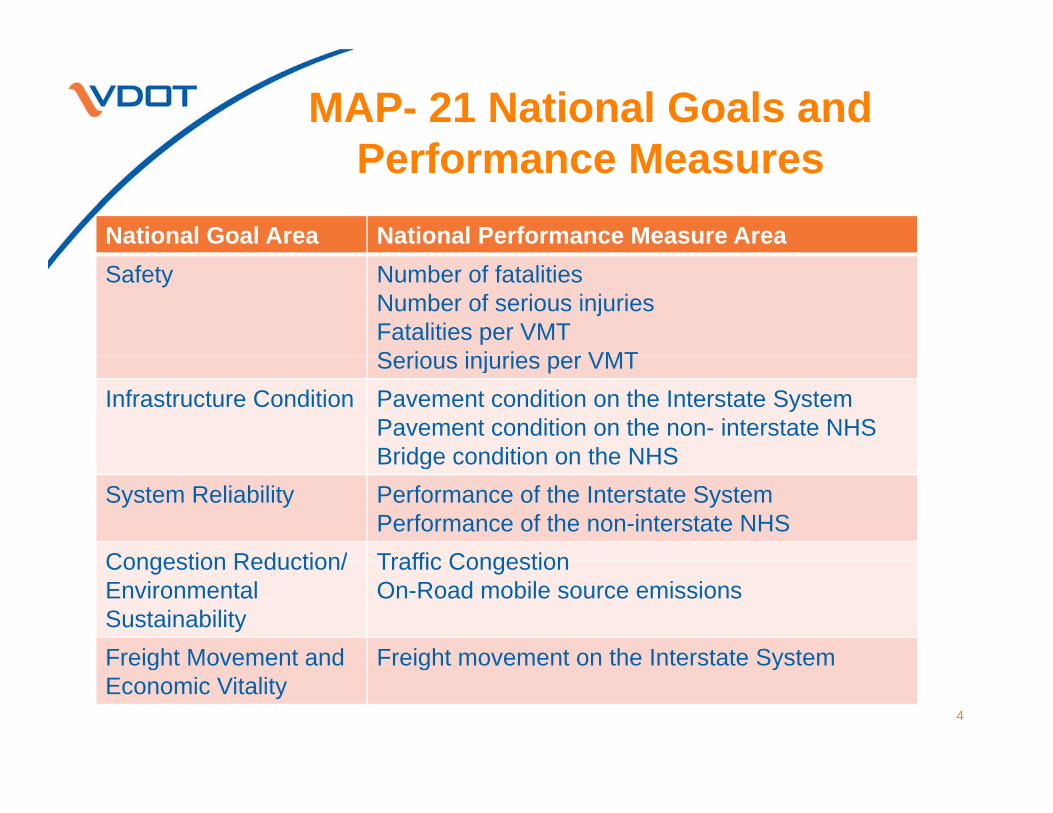
National Goal Area National Performance Measure AreaSafety Number of fatalities
Number of serious injuriesFatalities per VMTS i i j i VMTSerious injuries per VMT
Infrastructure Condition Pavement condition on the Interstate SystemPavement condition on the non- interstate NHS Bridge condition on the NHSBridge condition on the NHS
System Reliability Performance of the Interstate SystemPerformance of the non-interstate NHS
Congestion Reduction/ Traffic CongestionCongestion Reduction/Environmental Sustainability
Traffic CongestionOn-Road mobile source emissions
Freight Movement and Freight movement on the Interstate SystemFreight Movement and Economic Vitality
Freight movement on the Interstate System
4

MAP- 21 National Goal Area- Safetyy
Federal Requirement AASHTO VDOT Recommendations
Number of Fatalities On Dashboard – targetsfor reduction set in Strategic H Safet
5 year moving average
All public roads
Strategic Hwy Safety Plan (SHSP)
Fatality Rate (Fatalities/ VMT)
Data available to calculatep
Calendar year
(Fatalities/ VMT) calculateNumber of Serious Injuries
On Dashboard
Serious Injury Rate Data available toSerious Injury Rate (Serious Injuries/ VMT)
Data available to calculate
5
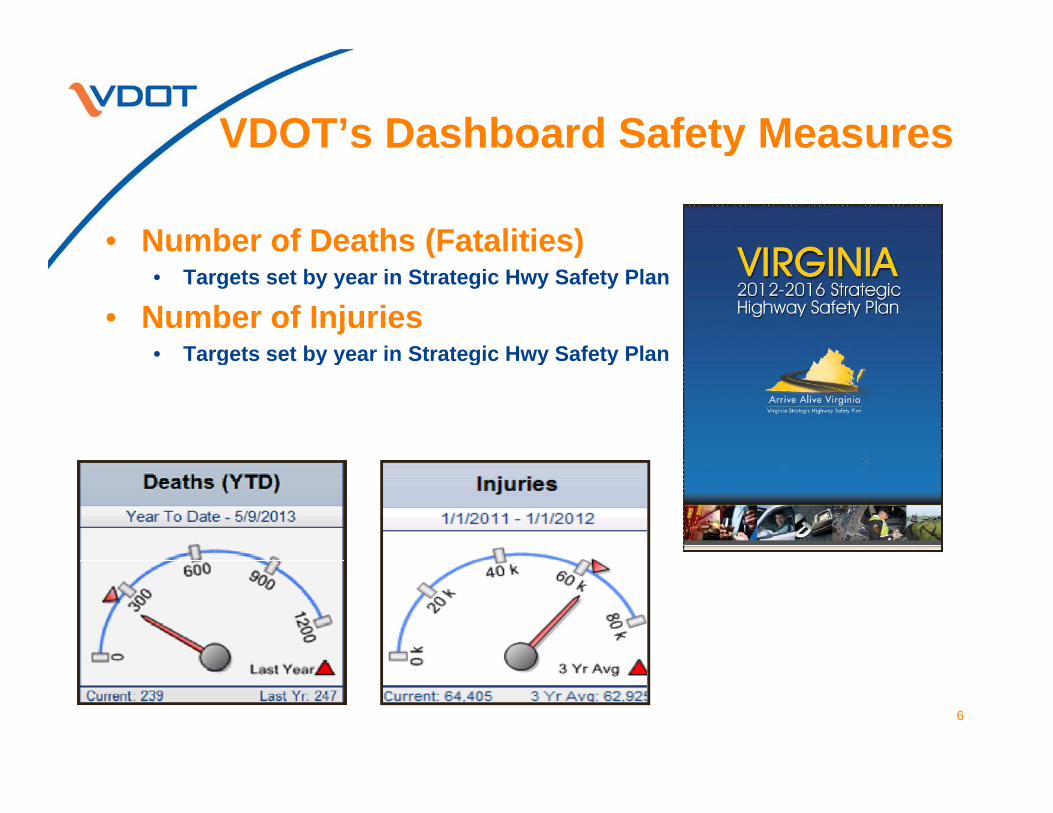
VDOT’s Dashboard Safety Measures y
• Number of Deaths (Fatalities)( )• Targets set by year in Strategic Hwy Safety Plan
• Number of Injuries• Targets set by year in Strategic Hwy Safety Plan• Targets set by year in Strategic Hwy Safety Plan
6
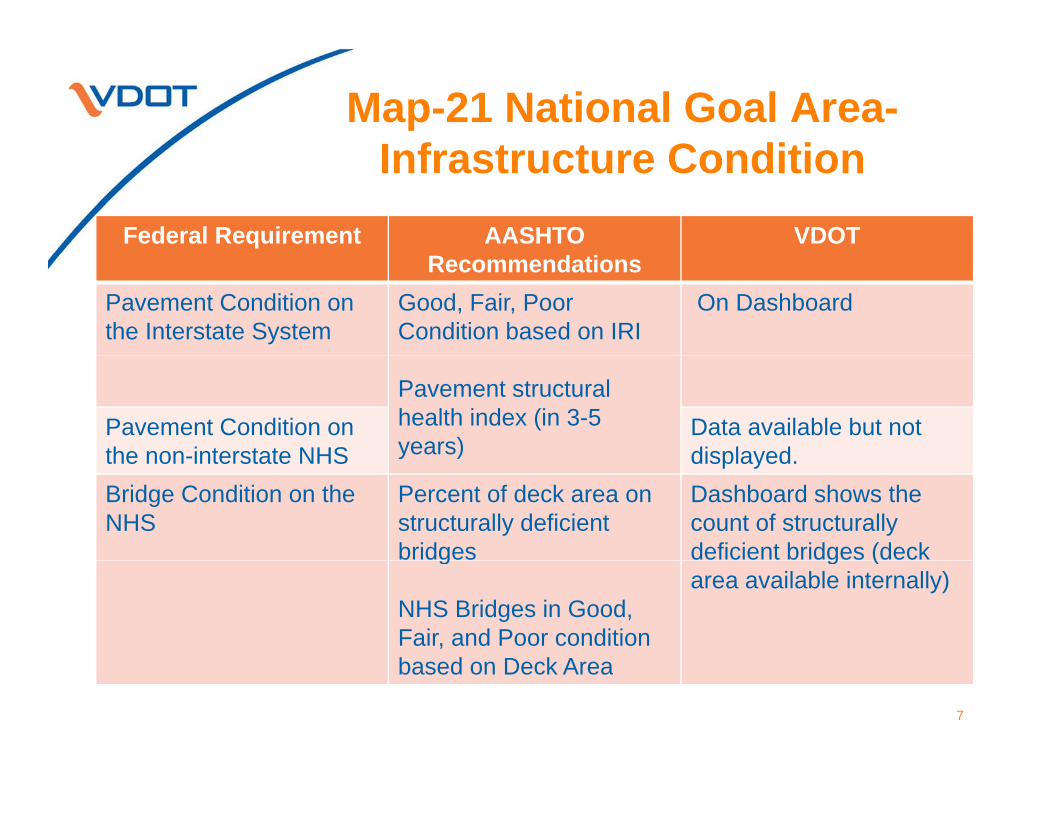
Map-21 National Goal Area-I f t t C ditiInfrastructure Condition
Federal Requirement AASHTO VDOT Recommendations
Pavement Condition on the Interstate System
Good, Fair, Poor Condition based on IRI
On Dashboard
Pavement structural health index (in 3-5 years)
Pavement Condition onthe non-interstate NHS
Data available but not displayedy )the non-interstate NHS displayed.
Bridge Condition on the NHS
Percent of deck area on structurally deficient bridges
Dashboard shows the count of structurally deficient bridges (deck g
NHS Bridges in Good, Fair, and Poor condition based on Deck Area
g (area available internally)
based on Deck Area
7
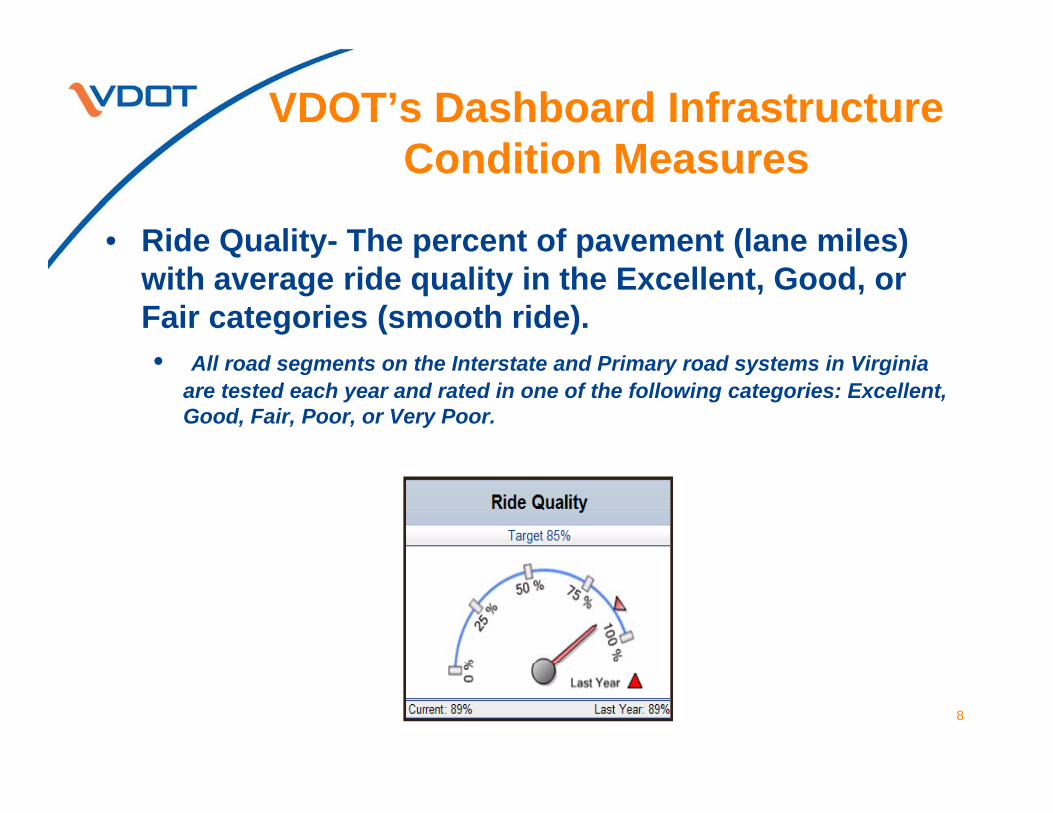
VDOT’s Dashboard Infrastructure C diti MCondition Measures
• Ride Quality- The percent of pavement (lane miles) Q y p p ( )with average ride quality in the Excellent, Good, or Fair categories (smooth ride).
All d h I d P i d i Vi i i• All road segments on the Interstate and Primary road systems in Virginia are tested each year and rated in one of the following categories: Excellent, Good, Fair, Poor, or Very Poor.
8
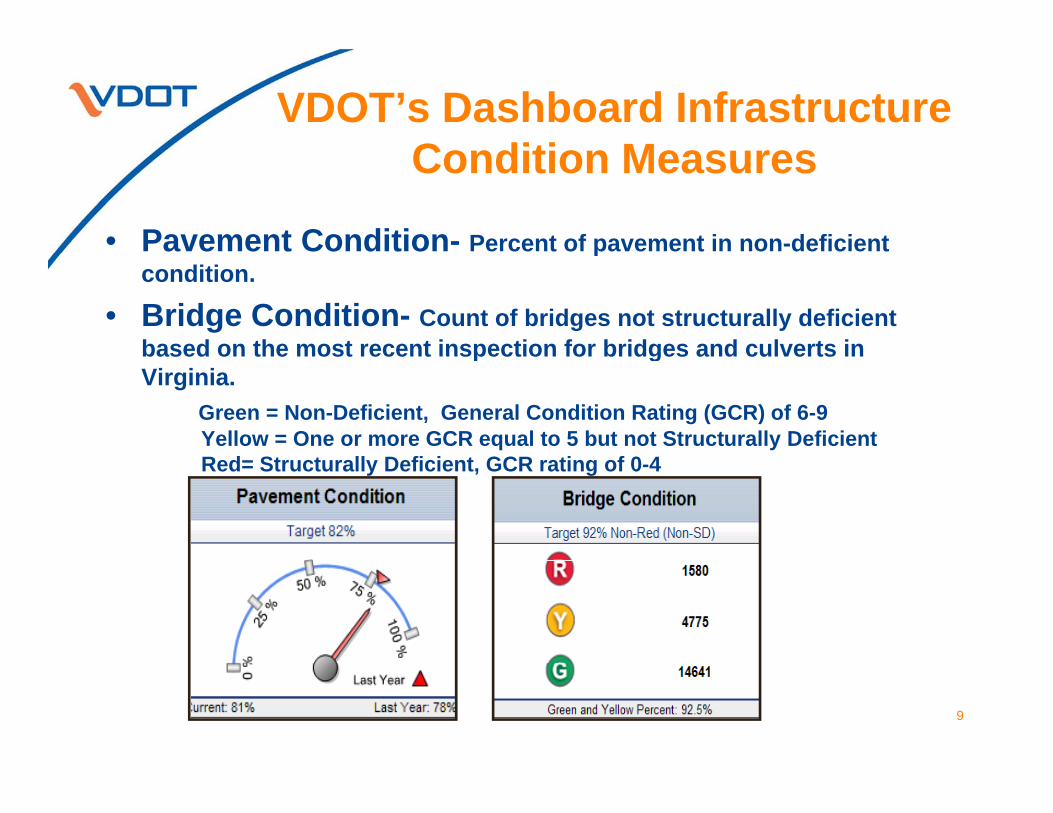
VDOT’s Dashboard Infrastructure C diti MCondition Measures
• Pavement Condition- Percent of pavement in non-deficient pcondition.
• Bridge Condition- Count of bridges not structurally deficient based on the most recent inspection for bridges and culverts inbased on the most recent inspection for bridges and culverts in Virginia.
Green = Non-Deficient, General Condition Rating (GCR) of 6-9 Yellow = One or more GCR equal to 5 but not Structurally Deficient R d St t ll D fi i t GCR ti f 0 4Red= Structurally Deficient, GCR rating of 0-4
9
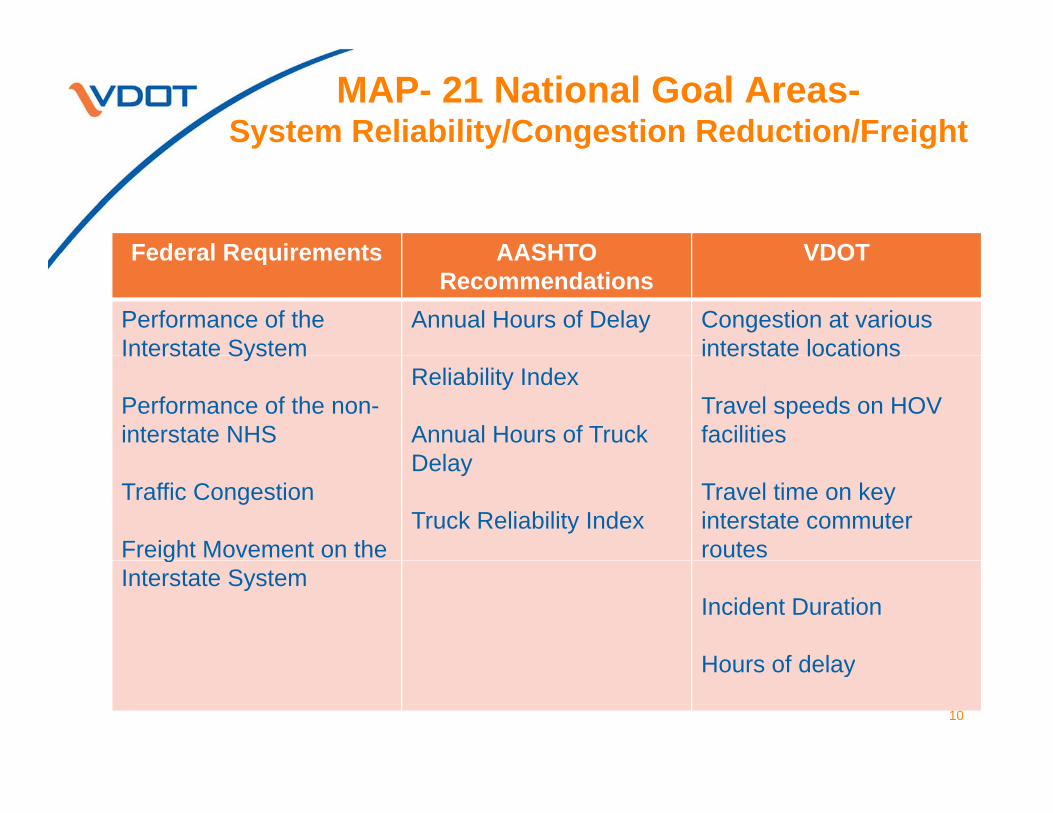
MAP- 21 National Goal Areas-System Reliability/Congestion Reduction/Freight
Federal Requirements AASHTO VDOTFederal Requirements AASHTORecommendations
VDOT
Performance of the Interstate System
Annual Hours of Delay Congestion at various interstate locationsInterstate System
Performance of the non-interstate NHS
Reliability Index
Annual Hours of Truck D l
interstate locations
Travel speeds on HOV facilities
Traffic Congestion
Freight Movement on the
Delay
Truck Reliability IndexTravel time on key interstate commuter routesg
Interstate SystemIncident Duration
Hours of delayHours of delay
10
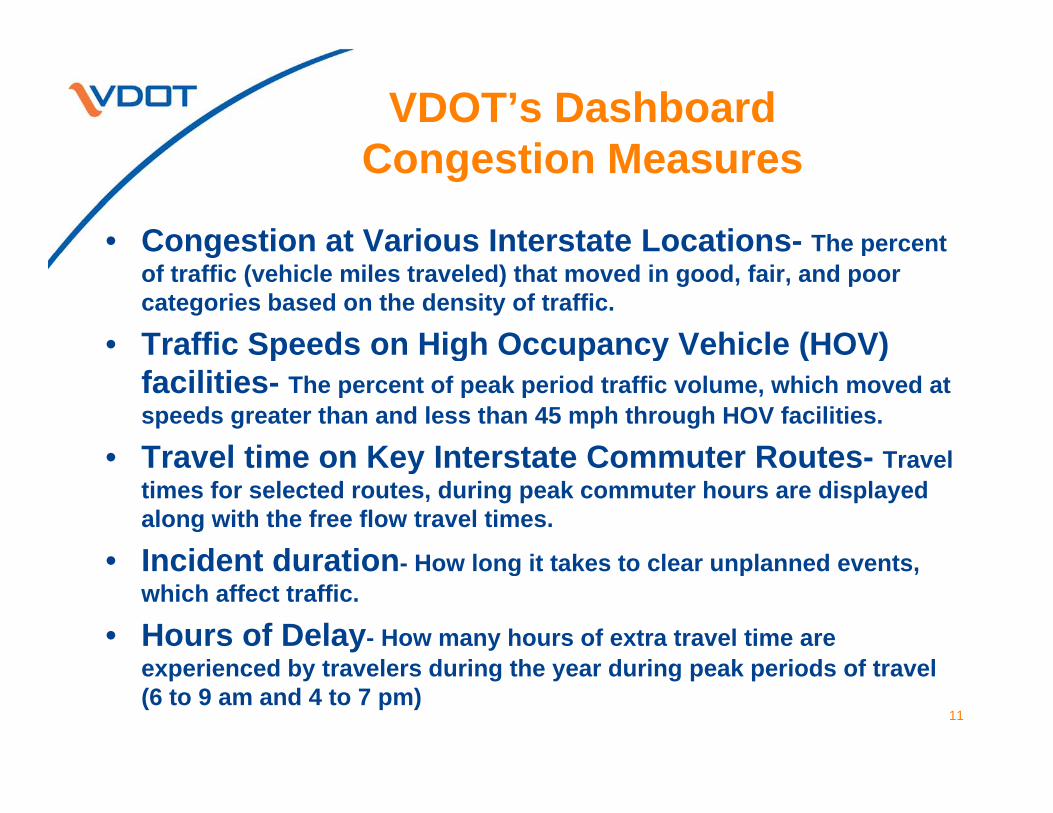
VDOT’s Dashboard C ti MCongestion Measures
• Congestion at Various Interstate Locations- The percent g pof traffic (vehicle miles traveled) that moved in good, fair, and poor categories based on the density of traffic.
• Traffic Speeds on High Occupancy Vehicle (HOV) p g p y ( )facilities- The percent of peak period traffic volume, which moved at speeds greater than and less than 45 mph through HOV facilities.
• Travel time on Key Interstate Commuter Routes- Travel• Travel time on Key Interstate Commuter Routes- Travel times for selected routes, during peak commuter hours are displayed along with the free flow travel times.
• Incident duration How long it takes to clear unplanned events• Incident duration- How long it takes to clear unplanned events, which affect traffic.
• Hours of Delay- How many hours of extra travel time are i d b t l d i th d i k i d f t lexperienced by travelers during the year during peak periods of travel
(6 to 9 am and 4 to 7 pm)11
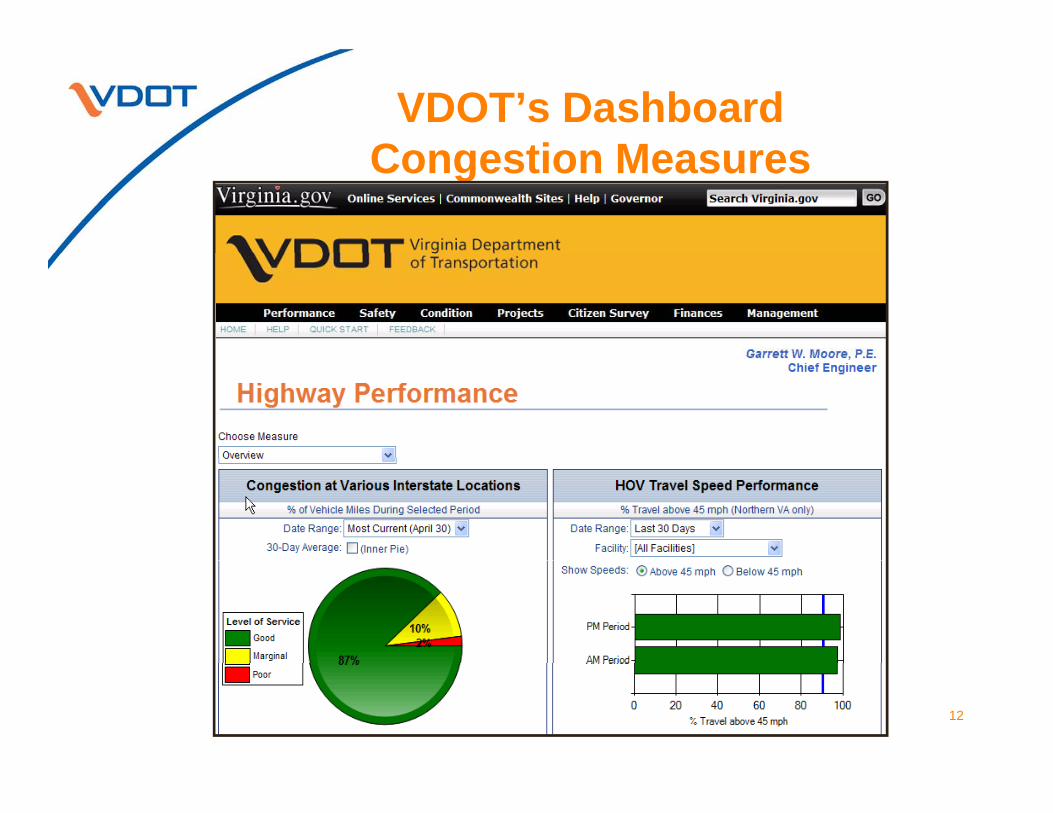
VDOT’s Dashboard C ti MCongestion Measures
12
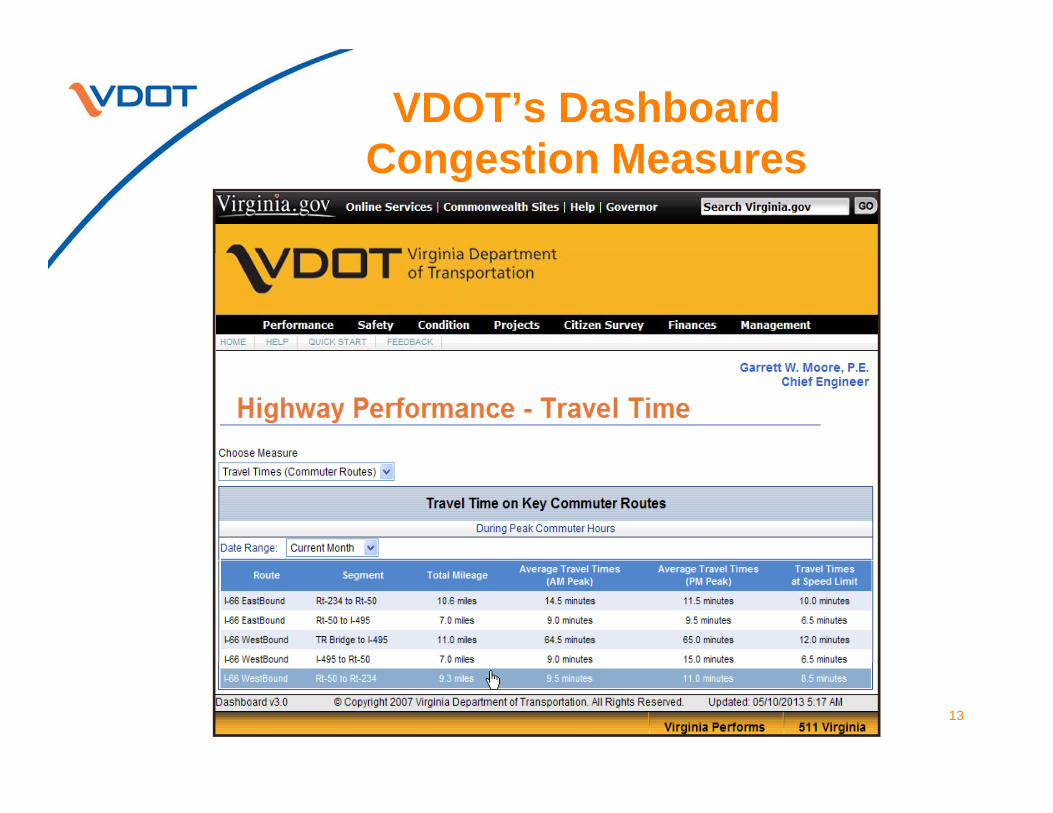
VDOT’s Dashboard C ti MCongestion Measures
13
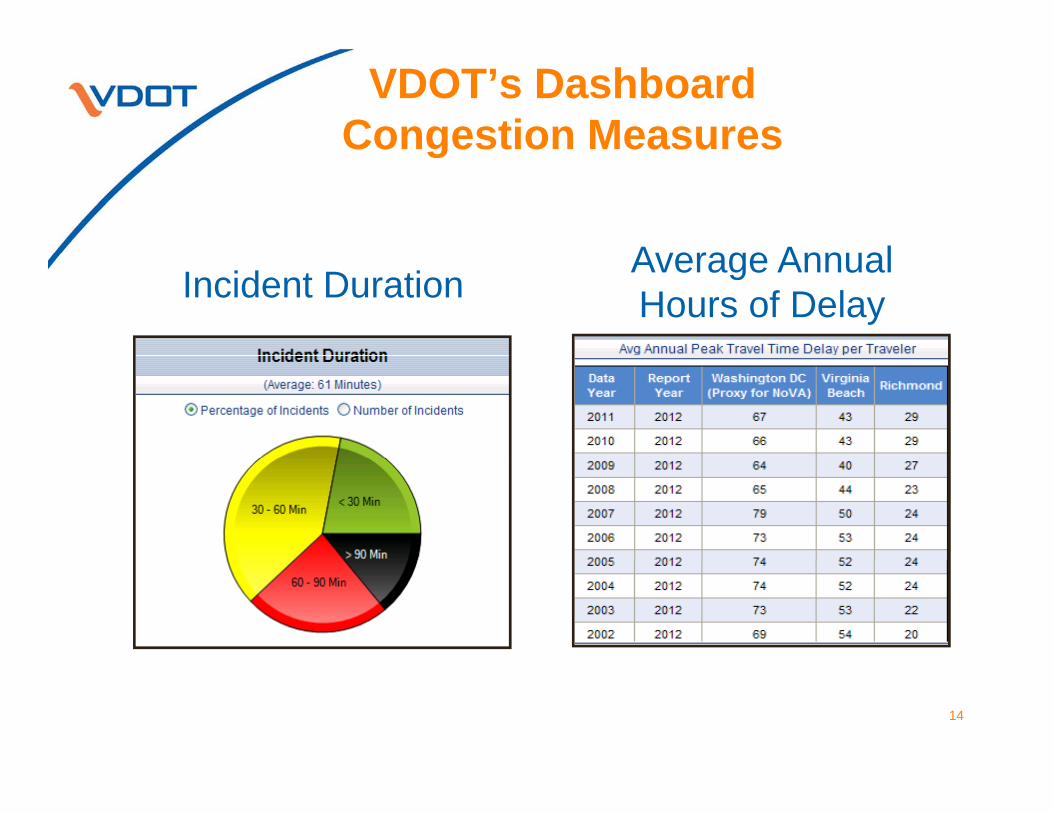
VDOT’s Dashboard Congestion Measuresg
A erage Ann alIncident Duration
Average Annual Hours of Delay
14
Map- 21 National Goal Areas with Potential Data NeedsPotential Data Needs
• System Reliabilityy y• Performance of the Interstate System• Performance of the NHS excluding the Interstate System
• Congestion Reduction/Environmental Sustainability
C ti R d ti• Congestion Reduction
• Freight Movement and Economic VitalityF i ht t th I t t t S t• Freight movement on the Interstate System
15
Current Status of Traffic Data at VDOT
• VDOT has a wealth of traffic performance related data:• Volumes• Volumes• Vehicle speeds and classifications• Travel time• Incident and crash data• Inventory• Corridor and intersection operationsp
• Data are distributed among a number of systems• Some elements are difficult to access• Staff spends significant time integrating data from different• Staff spends significant time integrating data from different
sources• Still, most questions go unanswered or unanalyzed
16
Traffic Data & Performance Management System (TDPMS) will help:System (TDPMS) will help:
• Goals• Support analysis of VDOT’s traffic performance-related data • Serve as the archive for the statewide ATMS• Support MAP-21 complianceSupport MAP 21 compliance
• Vision• Provide one access point to traffic detector, vehicle probe, incident,
roadway network and other data needed to support analysis ofroadway network and other data needed to support analysis of traffic performance
• Create new analysis capabilities by integrating data sets spatially and over time
• Facilitate performance management through visualization aids, graphics and reports
• Establish an data archive than can be used with other applications and help meet future needs
17
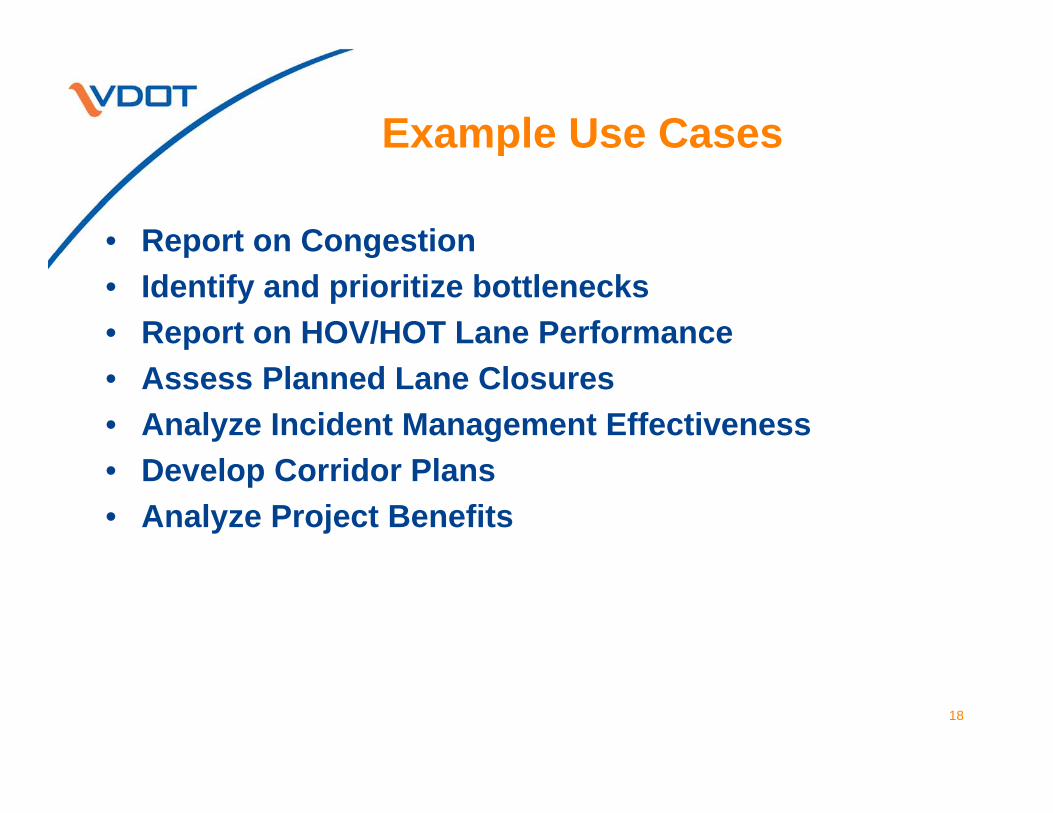
Example Use Casesp
• Report on Congestionp g• Identify and prioritize bottlenecks• Report on HOV/HOT Lane Performance• Assess Planned Lane Closures• Analyze Incident Management Effectiveness
C• Develop Corridor Plans• Analyze Project Benefits
18
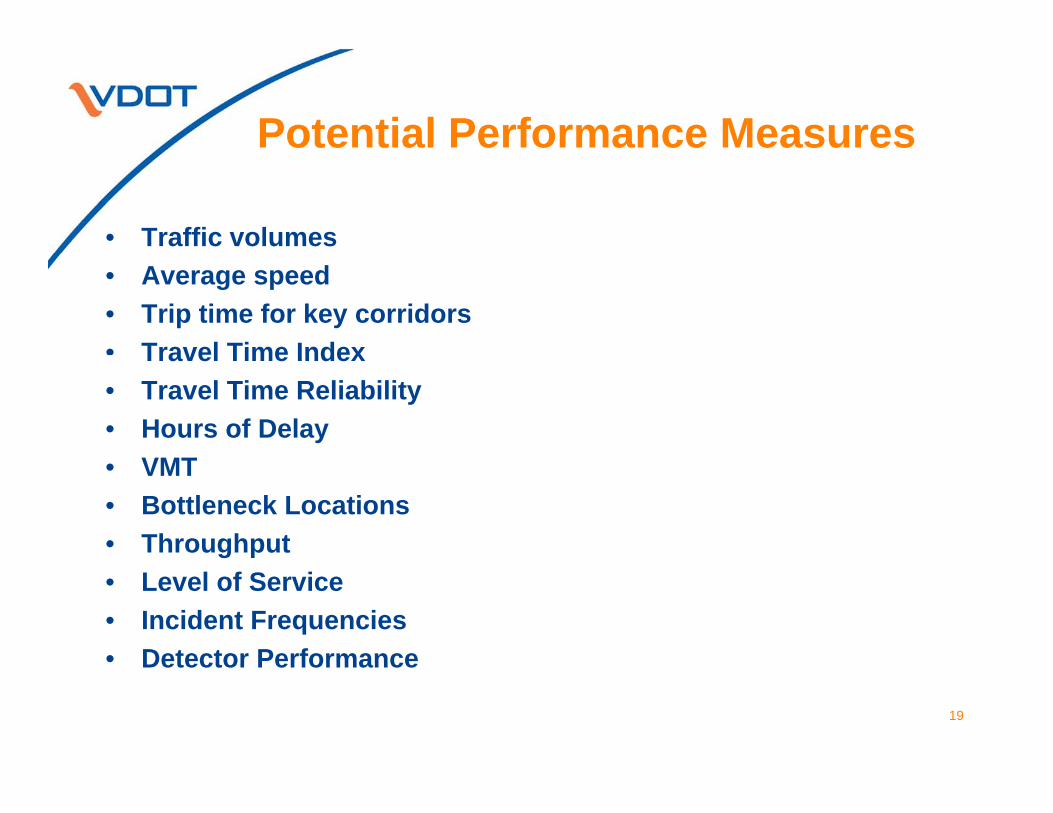
Potential Performance Measures
• Traffic volumes• Average speed• Trip time for key corridors• Travel Time IndexTravel Time Index• Travel Time Reliability• Hours of Delay
VMT• VMT• Bottleneck Locations• Throughput• Level of Service• Incident Frequencies• Detector PerformanceDetector Performance
19

Additional Capabilitiesp
20
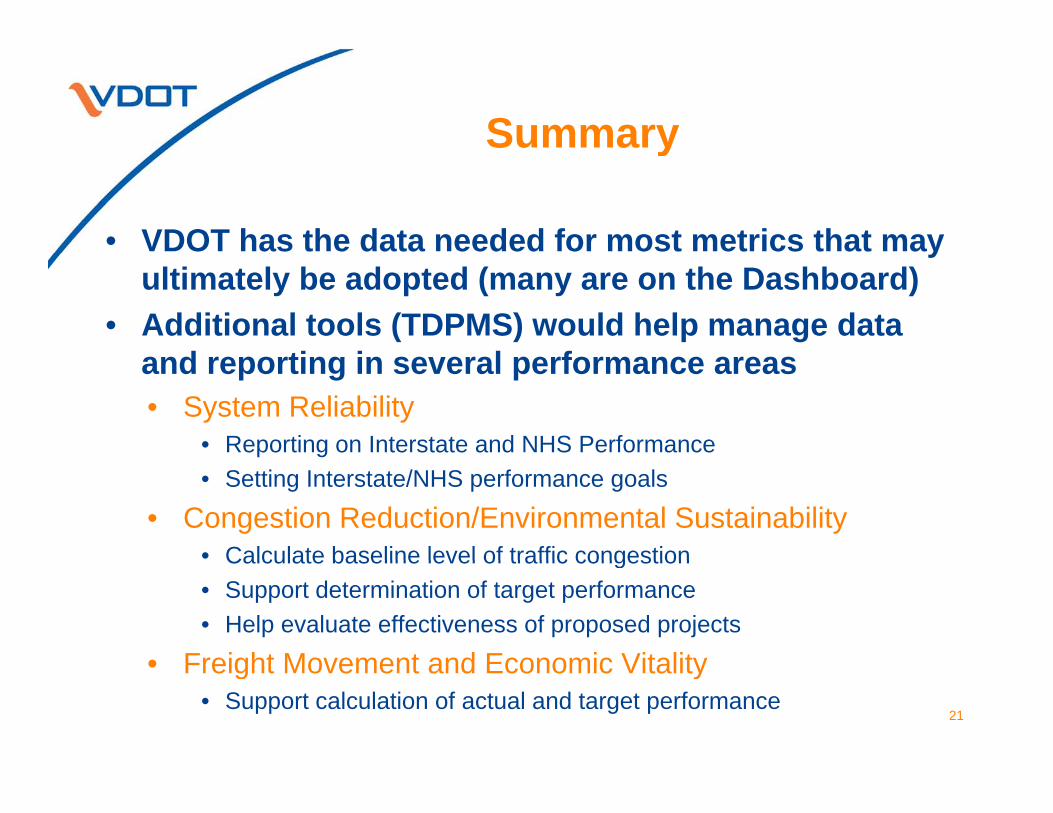
Summaryy
• VDOT has the data needed for most metrics that may yultimately be adopted (many are on the Dashboard)
• Additional tools (TDPMS) would help manage data d ti i l fand reporting in several performance areas
• System Reliability• Reporting on Interstate and NHS Performance• Setting Interstate/NHS performance goals
• Congestion Reduction/Environmental Sustainability• Calculate baseline level of traffic congestionCalculate baseline level of traffic congestion• Support determination of target performance• Help evaluate effectiveness of proposed projects
• Freight Movement and Economic Vitality• Freight Movement and Economic Vitality• Support calculation of actual and target performance
21
VDOT and MAP 21 PerformanceVDOT and MAP-21 Performance ManagementVA SITE Annual MeetingJune 27, 2013Jay StylesP f d St t i Pl iPerformance and Strategic Planning Manager, Business Transformation Office