Embed Size (px)
Citation preview

Ve c t o rThe Official Journal of the BC Association of Mathematics Teachers
Spring 2011 • Volume 52 • Issue 1
Vector is published by the BC Association of Mathematics Teachers
Articles and Letters to the Editors should be sent to:
Peter Liljedahl, Vector [email protected]
Sean Chorney, Vector [email protected]
Membership Rates for 2010 - 2011$40 + GST BCTF Member$20 + GST Student (full time university only)$58.50 + GST Subscription fee (non-BCTF )
Notice to ContributorsWe invite contributions to Vector from all members of the mathematics education community in British Columbia. We will give priority to suitable materials written by BC authors on BC curriculum items. In some instances, we may publish articles written by persons outside the province if the materials are of particular interest in BC.
Articles can be submitted by email to the editors listed above. Authors should also include a short biographical statement of 40 words or less.
Articles should be in a common word processing format such as Apple Works, Microsoft Works, Microsoft Word (Mac or Windows), etc.All diagrams should be in TIFF, GIF, JPEG, BMP, or PICT formats. Photographs should be of high quality to facilitate scanning.
The editors reserve the right to edit for clarity, brevity, and grammar.
Spring 2011 • Volume 52 • Issue 1
The views expressed in each Vector article are those of its author(s), and not necessarily those of the editors or of the British Columbia Association of Mathematics Teachers.Articles appearing in Vector should not be reprinted without the permission of the editors. Once written permission is obtained, credit should be given to the author(s) and to Vector, citing the year, volume number, issue number, and page numbers.
Membership EnquiriesIf you have any questions about your membership status or have a change of address, please contact the BCAMT Membership Chair:Dave Ellis ([email protected])
Notice to AdvertisersVector is published three times a year: spring, summer, and fall. Circulation is approximately 1400 members in BC, across Canada, and in other countries around the world.
Advertising printed in Vector may be of various sizes, and all materials must be camera ready.
Usable page size is 6.75 x 10 inches.
Advertising Rates Per IssueFull Page $ 300Half Page $ 160Quarter Page $ 90
Technical InformationThe layouts and editing of this issue of Vector were done on an IMac using the software package: Adobe Acrobat Professional, Adobe InDesign, and Microsoft Word.

Spring 2011 2
3 2010-2011 BCAMT Executive6 Letter from the Editors8 Letter to the Editors
11 Secondary Teacher Award Winner: Michelle Relova
Patrick Wadge 13 TEDx and the Future of Education
Duncan McDougall 16Distinguishing between an Inconsistent and Dependent System using Determinants
Lorne Scott 20“I had a vision of what Hell is Like.” A Study of Mathematical Anxiety
Lenora Milliken 25 A Time for SMILESRyan Evans 29 Treasure Hunt Math Race
Ian Jones 34
Project-Based Math Learning with Direct Connections to Curricula: A Practical Approach for Teachers
Walter Szetela 45 Analogy and Problem Solving
Lisa Turnbull 46 Book Review: Mathematical Recreations and Essays
48 Memorium 59 Spring 2011 • Problem Set61 Spring 2011 • Math Websites
ON THE COVER: The background was designed by Hong Yi Li from Killarney Secondary in Vancouver and the foreground was designed by Joshua Ip from Magee Secondary.Please submit student art for our future covers.
Ve c t o rThe Official Journal of the BC Association of Mathematics Teachers
Spring 2011 • Volume 52 • Issue 1

3 Vector
The 2010–2011 BCAMT Executive
President and Newsletter EditorDave van BergeykSalmon Arm Secondary SchoolWork: [email protected]
Past PresidentMichèle RoblinHowe Sound Secondary School (Squamish)Work: 604-892-5261 Fax: [email protected]
Vice PresidentChris Becker Princess Margaret Secondary (Penticton)Work: [email protected]
SecretaryBrad EppSouth Kamloops SecondaryWork: [email protected]
TreasurerKathleen Wagner Robert A. McMath Secondary School (Richmond)[email protected]
Membership ChairDave Ellis Home: [email protected]
Elementary Representatives Jessica AnjosEllison Elementary School (Kelowna)Work: [email protected]
Jennifer GriffinSouth Slope Elementary (Burnaby)Work: [email protected]
Carollee NorrisNumeracy Support Teacher School District 60 (Peace River North)Work: 250-262-6028 [email protected] or [email protected]
Lorill ViningNumeracy Support Teacher School District 72 (Campbell River)[email protected]
Donna WrightEcole Sandy Hill Elementary (Abbotsford)school phone: 604 850 7131 Vice [email protected]
Middle School RepresentativeDawn DriverH.D. Stafford Middle School (Langley)Work: [email protected]

Spring 2011 4
The 2010–2011 BCAMT Executive
Middle School RepresentativeDawn DriverH.D. Stafford Middle School (Langley)Work: [email protected]
Secondary RepresentativesMichael FinniganYale Secondary School (Abbotsford)Work: [email protected]
Marc GarneauMathematics Helping Teacher (Surrey)Work: [email protected]
Sam MuracaDistrict Coordinator - Numeracy School District 35 (Langley)Work: 604-534 7891 [email protected]
Independent School RepresentativeChris Stroud West Point Grey Academy (Vancouver)Work: [email protected]
Post-Secondary RepresentativePeter LiljedahlSimon Fraser UniversityWork: [email protected]
NCTM RepresentativeMarc GarneauMathematics Helping Teacher School District 36 (Surrey)Work: [email protected]
Vector EditorsPeter LiljedahlSimon Fraser UniversityWork: [email protected]
Sean ChorneyMagee Secondary School (Vancouver)Work: [email protected]

5 Vector
WA LT E RS Z E T E L A
This issue of Vector is dedicated to

Spring 2011 6
As early as 1973 (maybe earlier), Walter Szetela contributed to Vector and, throughout
the years, he continued to support and share with Vector readers. As I was looking for
an article to reprint in this issue, I counted twenty articles that Walter wrote between
the years 1973 and 1989, inclusive. The range of topics included number theory,
mathematics in Poland, problem solving in its many forms and the use of calculators in
the classroom, looking at their pros and cons. Walter was my external examiner for my
Master’s defense in 1998. I remember his excitement about my topic. I had introduced
open-ended problems to a grade 10 mathematics class and he was very interested in my
results. One of the artefacts that emerged from this study was an aggregate of these
students’ own open-ended mathematics questions. I published these student-created
problems in the appendix of my thesis and I remember vividly Walter’s interest in these
problems. I, along with the other examiners, found them interesting but Walter found
them intriguing, profound and, unfortunately, for me, underdeveloped. Walter read
all twenty-eight of these problems and made a comment about each. Fifteen years on,
in my doctoral studies, I have stumbled across the rich literature of problem posing
in mathematics education. I’ve since come to appreciate this practice of eliciting and
using students’ problems as the primary resource in my own mathematics classes. I
feel, for myself, that Walter was ahead of his time, keenly aware, vibrantly interested,
always moving forward. It was a pleasure to know him.
I hope you enjoy his article on page 45, “Analogy and Problem Solving: A tool for
helping children to develop a better concept of capacity”, from March 1978. This
article seems extremely relevant in light of the new curriculum’s focus on shape, space
and measurement. SC
LETTER FROMTHE EDITORS

7 Vector
Over the next few issues we would like to visit the seven processes that are currently being implemented in our BC high school curriculum in mathematics. To review, the Common Curriculum Framework(CCF), within the domain of the Western Northern Canadian Protocol (WNCP), outlines the following processes to be developed in mathematics teaching: “Connections”, “Communication”, “Mental Mathematics and Estimation”, “Problem Solving”, “Reasoning”, “Technology”, and “Visualization”.
Vector editors will be visiting each process, one issue at a time, inviting letters, short commentaries, etc, any contribution, be it short or expository, to discuss and publish various perspectives on these processes. Contributors can “interpret” what these processes mean, how they can be implemented, or how they can best be integrated into current curriculum content. We believe the discussion presented here will enrich the literature and support the implementation of these processes into our classrooms. These contributions will be published in each successive issue. Beginning in alphabetical order, the first process we’ll address is Communication. We invite readers to submit, over the next couple of months, examples and interpretations and helpful considerations dealing with the process “Communication”. Please submit contributions to the editors. We look forward to hearing from you.
We are looking for quality submissions of the following:
Articles can be submitted by email to the editors listed on page one. Authors should also include a short biographical statement of 40 words or less. Articles should be in a common word processing format such as doc files, rtf files wps files, etc. All diagrams should be in TIFF, GIF, JPEG, BMP, or PICT formats. Photographs should be of high quality to facilitate scanning. The editors reserve the right to edit for clarity, brevity, and grammar.
• research reports• literature reviews• stories of teaching• teacher resources• relevant website links
• interesting problems• students’ solutions to problems• book reviews• letter to the editor
In DiscussionThe Seven Processes
CALL FOR SUBMISSIONS

Spring 2011 8
Dear Editors,
I would like to request that in future our grade 10 and 12 mathematics students NOT be scheduled to write electronic versions of the provincial exams. A large segment of these exams includes
graphing, trigonometry, and reading charts. Each of these topics is best approached by marking up diagrams and graphs, which can’t be done on a screen (the program that allows you to plot points on the screen is limited at best, since you can’t put a ruler on the screen in order to draw a straight line). While the students can copy out the diagrams, this is time consuming and can lead to copying errors. For example, here are two trig questions from past released exams:
The amount of time to copy, and the likelihood of making a copying error concern me (especially for our Essentials of Math students, many of whom have LD challenges).
In addition, key strategies in graphing are unavailable. For example:
LETTER TOTHE EDITORS

9 Vector
The strategy that almost every student would use here is the slope definition: rise/run. Many teachers instruct their students to draw a right angled triangle for reference, and then carefully count the squares. This is impossible to do on the screen, and puts students at a disadvantage compared to students who have a hard copy in front of them that they can mark up.
Or, consider the following:
In order to fill in this chart, it is essential to keep data lined up and in the correct column. A student would have to copy out the entire chart; students that didn’t would have a much higher likelihood of error. Again, this puts the electronic student on unfair footing compared to the student who is writing a pencil and paper copy.
Or another example from Essentials of Math 10:

Spring 2011 10
7. Using the statement above, what is James’ net pay?
A. $188.00 B. $302.00 C. $307.00 D. $351.00
A student is required to fill in each blank that I’ve placed an “X” in. For a student to be doing this on a scrap piece of paper is far more challenging than for a student who has a hard copy in front of them and can fill in the blanks.
I have a number of other concerns: the strategy of crossing out answers that are incorrect, being able to cancel out like terms, having a formula sheet in front of you (as opposed to on a split screen or separate screen), being able to try more than one graph and see which one works (since you have more than one piece of graph paper), etc.
My final concern is the layout of most computer labs. Most labs were not designed to allow students to work individually on a secure exam; in fact, most labs were designed to make computer screens as visible as possible to other users. The possibility of cheating on an exam seems very high to me, especially as students become more familiar with the electronic exam procedures.
In summary, I would request that in the future all mathematics provincial exams be administered as hard copies, not online electronic copies.
Sincerely,
Kelvin Dueck
About the AuthorKelvin Duelk is the Math Department Head at Pitt Meadows Secondary.

11 Vector
In recognition of her exemplary teaching, her innovation, and her school and district leadership, the BCAMT is pleased to honour Michelle Relova with its Outstanding Secondary Teacher award. Though Michelle was unable to attend the Fall Conference in person to receive the award, BCAMT President, Dave Van Bergeyk, announced her achievement there, and later had the opportunity to deliver the plaque to Michelle at her school in West Kelowna. While there, Dave met both Michelle and her principal, Jamie Robinson, who echoed the sincere praise he had given of Michelle in his nomination letter. “She’s a superstar,” Robinson noted. “You [at the BCAMT] need to share what she’s doing here in our school.”
It is certainly our pleasure to report some of the excellent work that Michelle is doing at Glenrosa Middle School and throughout School District 23. By all reports, Michelle’s classroom is a pretty exciting place to be learning mathematics. She has embraced the challenges of the pedagogical shift embedded in the new curriculum, and refashioned her practice around inquiry-based learning. In order to support her students in reaching high expectations, Michelle has also adopted
innovative assessment practices, which help define for students what success looks like, helping them know where they are on the learning path and how to progress. In addition, Michelle has significantly included parents in the feedback loop by setting up an exemplary parent communication system. All of this is built on the important foundation of strong relationships with students. Small wonder that some of Michelle’s students say she is the best teacher they have ever had.
Michelle RelovaOutstanding Secondary Teacher Award
AW
AR
DW
INN
ER

Spring 2011 12
But Michelle’s impact on student learning is not limited only to those who are in her classes, because Michelle has also consistently shared her growing expertise with colleagues at Glenrosa and throughout her district. Robinson reports that mathematics achievement is improving across the school, and even other departments are consulting Michelle in their efforts to improve assessment. District leaders, including Numeracy Coordinator, Lorraine Baron (a former BCAMT award winner herself), send teachers to watch Michelle in action, and have called on Michelle to contribute to district initiatives. According to Robinson, she has done an incredible amount “to move pedagogy towards best practice over the past two years.” We are pleased to honour Michelle for these outstanding achievements, and to spread the word about her success in hopes of promoting such excellence throughout the province.

13 Vector
TEDx and the Future of EducationBy Patrick WadgePatrick Wadge is a Math teacher at King George Secondary School in Vancouver. He recently completed his Masters degree in Secondary Math Education at S.F.U. Patrick is committed to improving his students’ attitudes towards mathematics through the use of problem-solving, technology, and humour.
It’s nice when things seem to “happen for a reason”; when you stumble into a great situation through no effort of your own. A few weeks
back I invited a long-time friend of mine over for dinner. I hadn’t seen Dave in years and I was eager to hear what he was up to. Dave is a fascinating guy – world champion rower, ambitious entrepreneur and technology whiz. Over the course of the evening, he mentioned that he was planning to attend an upcoming TED conference in Vancouver.
Many people are now familiar with TED. Most Math teachers have likely been exposed to talks by Sir Ken Robinson, Arthur Benjamin, and Dan Meyer (see links at end). Basically, TED (Technology, Education and Design) is a set of conferences started by a non-profit organization in the United States. Their stated mission is the dissemination of “ideas worth spreading”. The talks are available for free viewing online and have become extremely popular in the past few years.
I knew all this prior to Dave’s visit. What I didn’t know is that TED had expanded beyond its usual California locale. There are now hundreds of TEDx conferences around the world every year. Each is planned and coordinated independently, on a community-by-community basis. From the TEDx website: “The program is designed to give communities, organizations and individuals the opportunity to stimulate dialogue through TED-like experiences at the local level”.
TEDxUBC was planned for October 23 at Robson Square. Dave was one of a couple hundred people with tickets to the sold out event. And, as it turns out, he had one extra ticket for me. I’d gone from never hearing of the event to being one of its lucky attendees over the course of dinner!
I arrived at the conference and was welcomed by several student volunteers from my own school (King George Secondary in the West End of Vancouver) – a good omen! Dave and I met up and found some seats. The event’s organizer – Bret Conkin – welcomed the attending TEDxers (apparently that’s what we are known as) and informed us that he had organized TEDxUBC as a project out of his (now completed)
It’s nice when
things seem to
“happen for a
reason”; when
you stumble into
a great situation
through no effort
of your own
SHO
RTC
OM
MU
NIC
AT
ION
Spring 2011 14
Teacher Training program at UBC. Another encouraging sign! Bret “reminded” the audience that the theme of the day’s conference was “Fast Forward Ed” – basically an examination of the interplay between and future of technology and education. What?! I had no idea this was the topic of the day. But I was happier than ever to be there!
The first speaker of the day was Chris Kennedy, the incoming Superintendent of Schools with the West Vancouver School Board. He spoke of the “Students LIVE!” project that he was involved with during the recent Olympic Games in Vancouver. This program allowed 25 high school students to attend sport and cultural events during the Vancouver Games, and then share their experiences with students around the world through social media tools. Basically, the students acted as student reporters for the duration of the Olympic Games. Not a bad gig!
Mr. Kennedy saw this as an exemplar of what 21st century learning, or personalized learning, could look like. Some of his conclusions from the project include the following:
- good writing and strong communication skills still matter
- students are comfortable with technology but don’t know how to leverage technology to build an audience / community
- community must be built face-to-face before it can be grown virtually
- making one’s work public allows students to learn from and assist each other (and ultimately improves the quality of student work)
- mobile technology can change learning… but it won’t make it easier.
A video was shown in which students spoke of the great value the project had for them personally; how it was exciting and fun and meaningful. Returning to the regular classroom was frustrating for these students.
This was a lot to assimilate in a very short time (TED speakers are limited to a maximum of 18 minutes). Twenty-first century learning is another “hot topic” in the education world these days. Much has been said about 21st century skills (critical thinking, problem solving, analyzing information, collaboration, etc.) and how to best nurture them in today’s students. Many experts have proposed a new type of education system with teacher as facilitator and a curriculum that is connected to students’ interests, experiences, talents, and the real world.
The remaining twelve speakers returned – in their own ways – to the issue of education in the 21st century. What follows is a brief snapshot of a number of the other speakers – and their respective messages – during TEDxUBC:
Good writing
and strong
communication
skills still matter

15 Vector
Basil Peters (hedge fund manager, venture capitalist, and angel investor) – the same qualities that make someone a good student (intelligence, desire to learn, ability to assimilate large amounts of information, ambition and perseverance) makes someone a good entrepreneur. We should be encouraging students to be entrepreneurs, to start new companies. The world would be a better place with more entrepreneurs and fewer giant corporations.
Elysa Hogg (undergraduate student at UBC in the Political Science Department) – we need to move outside the classroom to have more meaningful lessons. What is required is a learning environment that reflects the real world.
Matt Giammarino (educational researcher and teacher) – students must be able to “re-mix”. The rules of re-mixing: 1) sample from everything. 2) don’t wait for the next opportunity. 3) stretch beyond your comfort zone.
Sunddip Nahal (Educational Consultant) – education is not matching up to the acceleration of technology. We don’t need to change what we teach but rather how we teach it.
Paul Cubbon (Marketing Instructor at the Sauder School of Business at UBC) – we need to make space for exploration, conversation, and reflection in education. Student engagement – what Dr. Cubban calls “a new approach to learning” – needs to be the focus. Fast and good is better than slow and perfect.
Jeff Piontek (former Director of Instructional and Informational Technology for the New York City Department of Education) – mobile learning devices are the wave of the future in education. We need to engage in social media within schools (flickr, YouTube, Blogger, myspace, Twitter, Facebook, etc.).
Skeptical? Inspired? Overwhelmed? So was I. Perhaps the most rewarding part of the day was the “Idea Sharing Breaks” where participants could discuss with each other what they were hearing, could argue over what was nonsense and what was enlightening, could question and defend and ponder. I invite you to do the same.
And how does all this relate to mathematics in British Columbia? How does it relate to you in particular? I’m not exactly sure, to tell the truth, but I will leave you with the winning “Tweet” at the TedxUBC conference, submitted by Terry Ainge, a principal in Delta: “Can we afford to wait for the next generation of educators to “be the change”? Tomorrow’s teachers are in our classrooms today!”
Education is not
matching up to
the acceleration
of technology.
We don’t need
to change what
we teach but
rather how we
teach it.

Spring 2011 16
Distinguishing between an Inconsistent and Dependent System using DeterminantsBy Duncan McDougallIn his 33rd year as a career teacher, Duncan spent the last fulfilling 19 years as a professional tutor. He became a teacher so as to be in a position to help others. In his current position as a tutor/mentor, coach and counselor, he assists students who have learning difficulties at all levels of mathematics from elementary to 2nd year Calculus. He also helps his teachers at TutorFind Learning Centre meet the challenges they face with their students. Duncan very much enjoys the challenges of teaching in this manner because more and more students need this type of help. Writing articles for the benefit of students and teachers alike is simply an extension of this work.
In the process of teaching systems of linear equations, whether it be for Math11 Principles or Math12 Applications, we come across the
classification of 2 x 2 or 3 x3 systems of equations. Invariably, we want to know the type of system we are dealing with so that we can determine in advance the number of solutions. Too often the student is under the impression that all 3 x 3 systems must have a solution and consequently waste a tremendous amount of time looking for a solution which doesn’t exist or dealing with how to express infinite solutions. Wouldn’t it be nice for the student to know exactly what to look for before attempting to find a solution? The idea behind classification of systems then is knowing how to realize either no solution, one solution, or many solutions before solving the system and its corresponding augmented matrix. This can now be done by calculating the determinant D of the coefficient matrix which we already know how to do and a determinant which includes the constant vector.
There are several good reasons for calculating the determinant of a square matrix and two of these come to mind: (1) Inverting a matrix and (2) Solving a system of equations represented by a matrix. In the case of inverting a matrix, we want to make sure that the Determinant is not zero so that we aren’t dividing by zero. And, in the case of solving a system of equation represented by a square coefficient matrix, we check the value of the determinant for zero. Indeed, if the determinant is not
MA
TH
EMA
TIC
AL
17 Vector
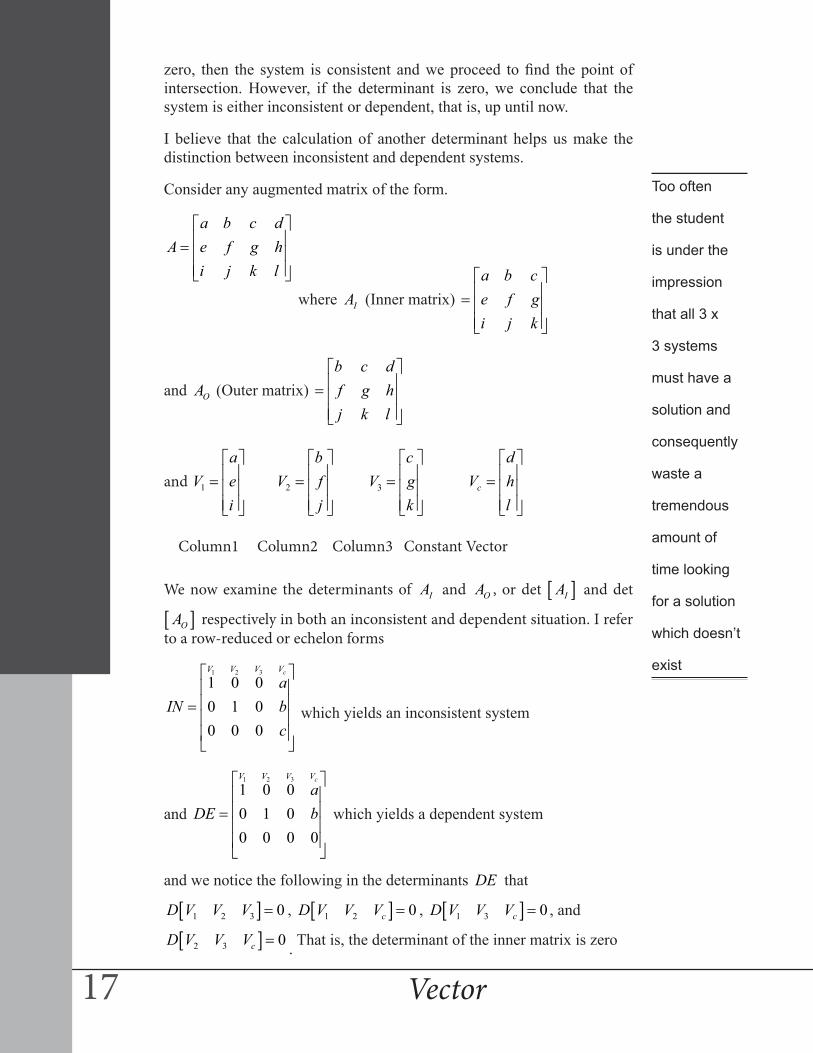
zero, then the system is consistent and we proceed to find the point of intersection. However, if the determinant is zero, we conclude that the system is either inconsistent or dependent, that is, up until now.
I believe that the calculation of another determinant helps us make the distinction between inconsistent and dependent systems.
Consider any augmented matrix of the form.
a b c dA e f g h
i j k l
=
where IA (Inner matrix) a b ce f gi j k
=
and OA (Outer matrix) b c df g hj k l
=
and 1
aV e
i
=
2
bV f
j
=
3
cV g
k
=
c
dV h
l
=
Column1 Column2 Column3 Constant Vector
We now examine the determinants of IA and OA , or det [ ]IA and det
[ ]OA respectively in both an inconsistent and dependent situation. I refer to a row-reduced or echelon forms
31 2
1 0 00 1 00 0 0
cV VV V
aIN b
c
=
which yields an inconsistent system
and
31 2
1 0 00 1 00 0 0 0
cV VV V
aDE b
=
which yields a dependent system
and we notice the following in the determinants DE that
[ ]1 2 3 0D V V V = , [ ]1 2 0cD V V V = , [ ]1 3 0cD V V V = , and
[ ]2 3 0cD V V V = . That is, the determinant of the inner matrix is zero
Too often
the student
is under the
impression
that all 3 x
3 systems
must have a
solution and
consequently
waste a
tremendous
amount of
time looking
for a solution
which doesn’t
exist

Spring 2011 18
and the determinant of any other matrix containing the constant vector is also zero. The interpretation of these observations is that if the determinant of the inner matrix is zero and the determinant of the other matrix is zero, then the system is dependent, However, if we look
at the determinate of the inconsistent system IN [ ]1 2 3 0D V V V = ,
[ ]1 2 cD V V V c= , [ ]1 3 0cD V V V = and [ ]2 3 0cD V V V = that is, the determinant of the inner matrix is zero but the determinant of the outer matrix containing the constant vector does not equal zero. The interpretation of these observations is that if the determinant of the inner matrix is zero but the determinant of the outer matrix is not zero, then the system is inconsistent.
Although one example does not prove anything, the following serve to illustrate my conjecture :
Let 1 2 3 13 1 1 35 3 5 4
B− −
= − −
where 1 2 33 1 15 3 5
IB−
= − −
and 2 3 11 1 3
3 5 4OB
− − = − −
then det [ ] 1(5 3) 3( 10 9) 5(2 3)IB = − − − + + −
1(2) 3( 1) 5( 1)= − − + − 2 3 5= + −
0=
and det [ ] 2(4 15) 1( 12 5) 3( 9 1)OB = + + − − + − + 2(19) 1( 17) 3( 8)= + − + −
38 17 24= − − 3 0= − ≠
Since det [ ] 0IB = but [ ] 0OB ≠ , B is inconsistent.
Now let 1 2 2 63 4 1 15 8 3 11
C− −
= − − − −
where 1 2 23 4 15 8 3
IC− −
= − − −
and 2 2 64 1 18 3 11
OC− − = − − − −
MA
TH
EMA
TIC
AL

19 Vector
Then det [ ] 1(12 8) 3(6 16) 5( 2 8)IC = + − − + − −
1(20) 3( 10) 5( 10)= − − + −
20 30 50= + −
0=
and det [ ] 2(11 3) 4( 22 18) 8(2 6)OC = − − + − + − −
2(8) 4( 4) 8( 4)= − + − − −
16 16 32= − − +
0=
Since det [ ] 0IC = and det [ ] 0OC = , C is dependent.
In essence, if we are given any 3 4× augmented matrix, we can summarize the results in the following manner :
Calculation Calculation Conclusion
[ ]ID A [ ]OD A
Case 1) [ ] 0ID A ≠ System is Consistent
Case 2) [ ] 0ID A = [ ] 0OD A ≠ System is Inconsistent
Case 3) [ ] 0ID A = [ ] 0OD A = System is Dependent
The above strategy is similar to that y the “Criss-Cross Calculation” with 2 equations in 2 unknowns. I am suggesting that this classification would work for larger augmented matrices and thus save time and money not looking for a solution that doesn’t exist. Further, the calculation of one determinant takes less time and effort than solving a n m× augmented matrix with no solution. By knowing the specific classification of a given matrix, we don’t bother pursuing a solution in an inconsistent system or determine rank and the number of parameters to be used for a dependent system.
Wouldn’t it be
nice for the
student to know
exactly what to
look for before
attempting to
find a solution?

Spring 2011 20
“I had a vision of what Hell is like”A Study of Mathematical AnxietyBy Lorne ScottLorne teaches Senior English on the Girl’s campus at Dalian Maple Leaf International School, located in Dalian, China. It is a British Columbia off-shore school that teachers B.C. curriculum and is one of the largest growing international schools in all of China.
As a secondary school English teacher, as well as a student of literature, I have continued to notice extreme hesitation in regards to mathematics on behalf of my students as well as myself. While attending Teacher College at Simon Fraser University, I became interested to see if this was a phenomenon or a common trend amongst those “textually-inclined.” Lucky for me, I was able to use this survey as a class assignment as well, for a course aptly titled “Struggles with Mathematics,” which dealt with, you guessed it, mathematical anxiety. Instead of looking up previous facts, journals and articles, I thought it would be interesting to conduct my own study with my current peers and keep the information topical, timely and current. I did not want results regarding mathematical anxiety from previous years, simple statistics in a book, but from current educational and academic climate.
The survey itself was simplistic in design. It consisted of one, one-sided page and it contained five multiple choice, two short answer and one longer written response question. The five multiple choice questions were “Do you enjoy mathematics?”, “Did you do well in mathematics in secondary school?”, “Do you find mathematics confusing?”, “Does the thought of a ‘math final’ make you visibly upset?” and finally “Do you believe that some students suffer from ‘math anxiety’ in secondary schools?” The options for these five questions were mostly the same, in that the students could select either “yes, somewhat, no” or a somewhat facetious and humorous final answer. The two short answer questions were “How many mathematics courses have you taken in your post-secondary career?” and “If you have taken any post-secondary mathematics courses, what was the reason for taking the course (s)?” Lastly, the longer written response was “Can you think of a time when you suffered from math anxiety? If not, can you think of
MA
TH
ED
UC
AT
ION
I have
continued to
notice extreme
hesitation in
regards to
mathematics
on behalf of my
students as well
as myself

21 Vector
the absolute worst experience that you have encountered during your educational career in reference to mathematics?”
I designed the survey in such a way that I could have a sample of written, somewhat anecdotal accounts, of math anxiety as well as a percentage created by the multiple choice responses. I would receive an overall numerical value, as well as some individualized accounts. Of course, I theorized that some people might not take the time to respond authentically; of the thirty or so surveys I surmised only an approximate number would be authentic. I am happy to report however, that it seems like every student did fill out the survey in a genuine way, although I realize there is always room for disagreement.
The class I wanted to give my survey to was my Designs for Learning: Secondary Language Arts. The teacher of the course, Vandy Britton, was more than willing to give me twenty minutes of class time to distribute and have my fellow peers complete my survey. I decided to pick this particular class because it was full of humanities students who I thought would have, more than likely, had some struggles with mathematics or issues of mathematical anxiety previously in their academic history. Conversely, I realize that creates a definite bias, but it needs to be stated: the majority of the students who participated in this survey are humanities students, and this does not reflect the state of all undergrads in any shape or form.
All information attained on this survey is from Wednesday, July 7th, 2010, and is based on the information received from 29 students that are at various stages of the Professional Development Program. Of those 29 students, 9 are male, while 20 are female. I do not feel that differentiation between genders has any direct correlations upon the results, but it should be out right stated for credibility. From these 29 students, the results were all, as I predicted, very similar.
For the multiple-choice questions, I conquered my own “math anxiety” and placed all the answers into a percentage. Such a simplistic task actually took quite a while to convert into a numerical answer but in the end, it presented a “cleaner” statistic. I will facetiously and sheepishly admit that calculating these statistics, took nearly the same amount of time to formulate the questions. I like to think I am arguably as good with words to contrast with how bad I am with numbers. We could refer to this as the “Matt Murdock/Daredevil rule,” in which, when one sense is dampened, the others are heightened. I feel this is the only possible explanation for my love of literature and dislike of mathematics. With that being said, the first question was, “Do you enjoy mathematics” to which I received 34% of the students saying “somewhat,” and 60% of students saying “no.” This was an interesting
The
phenomenon of
“math anxiety” is
definitely real

Spring 2011 22
statistic because it reveals that out of a class of humanities students, only 6% (or 2 students) would state that they enjoyed math.
Secondly, I asked, “Did you do well in mathematics in secondary school?” More than half of the students in the class, 52%, said no, they did not. 31% said “somewhat” but again, I am assuming that “somewhat” to be slightly subjective. 17% said “yes”.
Thirdly, I asked “do you find mathematics confusing?” 90% of students answered this question with either yes, or somewhat, or the funny humorous answer, which in this case was “What’s a mathematics?” That leaves approximately 10% of the class who stated that they do not find mathematics confusing in any sort of way. I will admit that I am slightly envious of these people because had I participated in the survey myself, I would have most definitely answered that I found the subject confusing.
The fourth question I asked was, “does the thought of a “math final” make you visibly upset?” I was being slightly facetious with this question as I was interested in the responses. In truth though, I have never been more worried about tests of the math variety. Interestingly enough, the results for this question were the exact same as the previous question. 90% of the students stated yes, somewhat or the humorous answer, which was “I feel like throwing up!”.
Lastly, 100% of students surveyed stated that they believe students suffer from math anxiety in secondary school. Obviously, the phenomenon of “math anxiety” is definitely real since a room of future teachers will obviously attest to. Dealing with math anxiety amongst the student population should be a concern moved to the forefront of educational issues. Even though this was a survey distributed in a class full of future English teachers, the ramifications of math anxiety could easily flood over into an English classroom. From my own learning experiences in secondary school, I can remember being very excited if I had a math test in the first block, because if not, my mind would not be able to concentrate on anything other than the upcoming test. I would essentially be a zombie through the other classes, only thinking and being consumed by the thought of the test.
The first and second short answer questions were relatively straight forward consisting of the amount of math courses they had taken post-secondary and the reasons for taking those courses. A majority of the students said the reasoning behind was for “Q credit” or for “upgrading.” “Q credit” means that the student has to take a numerical course into order to fulfill academic requirements of their university, and “upgrading” means that more than likely, they did not achieve a
MA
TH
ED
UC
AT
ION
Stories of
“bursting
into tears”
and “crying”
whenever math
was mentioned

23 Vector
high enough percentage in secondary school in order to complete their program in post-secondary. Interestingly enough, not a single person said they took a math course because they “wanted to” or because they “enjoyed it.” Judging personally, I have taken English courses because I both “wanted to” and “enjoyed them.” Again, it should be restated that a bias occurs, due in large part to the class being a designs for English course.
The longer written response gave a plethora of different anecdotal stories containing all sorts of different mathematical nightmares. One student wrote that it gave him/her actual “nightmares” and mentioned that they would “wake up several times throughout the night before a big test.” Multiple responses told stories of “bursting into tears” and “crying” whenever math was mentioned in elementary grades. Another large selection of papers stated that they had done well in math until midway through secondary school, and then “everything just fell apart.”
One of the funnier stories was: “The most recent [mathematical anxiety I faced] was during my practicum. 30 grade 6’ers were doing 50 math questions, speed style, and I had to read out the answers at the end of 10 minutes. I could not find the answer sheet and there was no way I could have had the answers just by doing it myself in the 10 minutes, so I had to have the students read out the answers.”
I found that story to be interesting because it describes an experience of a well-educated teacher who is more than willing to admit that although he/she expects their students to be able to answer 50 math questions in an allotted time period, the teacher could not have completed the task if they wanted to. Another survey tells the story of a person who failed upper level secondary mathematics courses multiple times, and was becoming an English teacher to get as far away from math as they could. Interestingly enough, not many of the papers place blame upon the teacher of the mathematics course. In my experience, it is almost always the teacher and never the student. With that being said, a few of the papers make mention of say a “psychotic grade 10 math teacher” or a “jerk of a grade 11 math teacher” but the majority do not mention a teacher at all. One, however, compared secondary mathematics to the “darkest, most painful sphere of Hell” and another stated that during a particular intense test, they had a “vision of what Hell is like.” Another stated, they felt “that some students should be allowed to write tests in the bathroom, in case particular questions induce vomiting.”
Mathematical anxiety is a problem that afflicts every student in my own opinion. The pressure that is placed upon mathematical students is incomparable to any other subject. If a room full of future teachers can all lay claim to some form of math anxiety, what chance or hope does a struggling 14 or 15 year old secondary student have? I feel that as teachers, we have to help these students even if it is not our particular subject area. How we help them achieve success and not be so fearful
One student
compared
secondary
mathematics
to the “darkest,
most painful
sphere of Hell”

Spring 2011 24
or anxious about mathematics is problematic and something that needs to be fully understood to be truly realized. Will the answer ever materialize, or is this an ongoing problem that only serves to become worse with time? I selfishly hope for a shift from this to an “English anxiety” because at least I know how to start to combat that. Perhaps this is why I now teach in a British Columbia off-shore school in China. To my fellow colleagues, good luck.
MA
TH
ED
UC
AT
ION
Mathematical
anxiety is a
problem that
afflicts every
student

25 Vector
A Time for SMILES (Super Mathematical Investigations and Learning Experiences)By Lenora MillikenSMILES was a program designed by Lenora Milliken, when she was the District Numeracy Resource Teacher. This year she is back in the classroom teaching grade 4/5. The school this event took place was Eighth Avenue Elementary in Port Alberni, part of SD 70.
The premise for “A Time for SMILES” is to make connections between home and school, enhance the learning partnerships
and make math fun, for we are all part of the learning community. At a SMILES event, parents/guardians spend time together, with their children, at the hosting school and engage in mathematical
investigations and learning experiences. It’s about having fun with math. The aim is for children and their caregivers to take some time to “SMILE”.
SMILES was developed to get families involved in mathematics. It was important to plan for families who also have younger or older children. It was not expected that the other children stay home while SMILES takes place in the elementary school. The goal is that families would be able to attend with all their children, not just the child in the hosting school. For this reason, activities were divided into preschool, primary and intermediate challenge levels. The activities were colour coded with the lightest colour being the easiest and the darkest being the most challenging. Participants were encouraged to try whichever
SMILES was
developed to get
families involved
in mathematicsM
AT
H
EDU
CA
TIO
N

Spring 2011 26
challenge level they wanted.
Research shows that when the home is involved in the learning process children are more successful. The hope for this program was to help
enhance the partnership between school and home and show different ways that caregivers can enhance their children’s math learning at home.
Last year, with the help of the District Numeracy Resource Teacher, the school held two SMILES events with one of their goals being to try to get more parents involved in their child’s education. We were hoping that this event would help. We found that more parents/guardians came to the second event after hearing all about the first one. Students were also eager for the second event to happen. At the end of the 2008/09 school year another SMILES event was planned for 2009/10.
The event began with everyone together for a brief welcome and introduction to the afternoon. The school was divided into three areas: card games and activities, dice games and activities, and problem solving activities. Each area had a room where the games and activities were set up. Teacher volunteers were available in each of the rooms to assist with the activities and provide help. Everyone was given about
Research shows
that when the
home is involved
in the learning
process children
are more
successful

27 Vector
Hosting the
SMILES event
seemed to be an
overwhelming
success
twenty minutes in each area to try at least one activity. After twenty minutes, participants were encouraged to move to another area to try other activities. Once everyone had been to each of the three areas, we all gathered together for a debriefing, thank you and evaluation. Each family who attended was given a package with a take home activity which gives the families the opportunity to continue the math learning activities at home. Each child also got to choose a picture book with a math related theme as a thank you for attending the event. Both parents and students liked the opportunity to be able have all the instructions and supplies in the take home package.
Hosting the SMILES event seemed to be an overwhelming success. We had about one third of our students attend the after school event with an adult, and some of the participants were also from our BumblebeeLand StrongStart preschool program. The only ‘negative’ comments received were “It wasn’t long enough” and “We needed more time to play the games”. Both the parents and the students have indicated they can’t wait until the next one.
MA
TH
ED
UC
AT
ION

Spring 2011 28
Sample card activity:
9 FRAME
Materials: deck of cards, each person has cards from 1 – 9
Directions:
1. Use cards Ace through 9 in one suit. Try to place one card in each spot of the frame so that you make a true equation.
2. Reinforces addition, subtraction and problem solving
One sample answer:

29 Vector
Treasure Hunt Math RaceBy Ryan Evans
When he’s not singing “Baby Beluga” to his 1 year old, Ryan teaches Math and Socials at Sands Secondary in North Delta. He has only ever met one other teacher trained in both Math and Socials in North America, but likes to think this gives him a unique perspective when planning activities. His goal with this review activity was to come up with something that got the students out of the classroom, racing around, and having fun while doing math - which sounded impossible but was a great success.
This activity was originally presented at the 2010 BCAMT Conference in Delta and more recently I have presented at the district pro-D in
Vancouver on February 18th. The idea for this activity was initiated by a desire to make math more fun and to get out of the classroom. The activity is modeled after a treasure hunt. Initially, pairs of students get a map of the school and a question. When they find the answer to that question labeled on the map of the school, they must go to that spot in the school to find their next question posted on the wall. The answer to that question will lead them to another location in the school and so on. A variation of this set up involved overlaying the map with a coordinate grid, presenting systems of equations as the answers and having their next location represented by coordinates.
I gave bonus marks for the first 3 pairs to get to the finish – nothing like a little competition to get them excited. The students absolutely loved it.
Steps to making your own Treasure Hunt – style Review Activity
1. Get a map of your school or hand draw one
a. OPTIONAL: GRAPHING: Lay a grid over the map where the intersections line up nicely in the hallways.
2. Pick locations on the map where you will put clues. Ex. Hallways, front entrances, outside landmarks like trees. Have one location a common finish line ex. Your classroom
MA
TH
ED
UC
AT
ION
The idea for
this activity was
initiated by a
desire to make
math more fun
and to get out of
the classroom

Spring 2011 30
3. Label each location with a letter.
a. Simple version: Write the letter (or simply the answer) on the map you give the kids
b. Graphing: The coordinates ex. (-1, 5) must be the answer to the question
i. Alternative: Instead of picking locations first, Look at the answers to existing textbook/review questions and use them to pick your locations (saves you from having to come up with all the questions)
4. For each location come up with a question that will have that location as an answer. (Needed for Step 7)

31 Vector
5. To keep them from following each other, plan out different routes of equal length.
a. Ex. Group “Red” will go from station A -> station O -> J -> X -> U -> H.
b. How many routes? Enough for pairs of kids.
c. Have each route end at the same place ex. Your classroom (so it’s easy for you to tell who’s 1st)
6. Prepare a template for each location. (see examples below)
7. Go through the stations one group at a time.
a. Ex. “Group Red” has to go from A -> O -> J …
i. Write down their initial question they will get from you that will take them to location “A”.
ii. Write on Station A under Group Red the question that will take them to “O”
iii. Write on Station O under Group Red the question that will take them to “J”
iv. Write on Station J under Group Red the question that will take them to …
You can do this in Excel, or by hand. (I’m working on an Excel spreadsheet that does this automatically)
8. Print off the starting clues for each group that will take them to their first location, and maps.
9. Just before class (or while they’re doing a warmup) post the station sheets.
10. Tell them:
a. If they’re caught running inside (unsafe) or being too loud (disturbing other classes) they’ll be disqualified, and we may not be able to do this again :(
b. To make sure they write down the order they went to the stations
i. Proves at the end they got each answer right. (Some groups gave up and just ran around the hallway looking for their group name on the sheets and writing the letters down.)
MA
TH
ED
UC
AT
ION
Group Red AOJXUHYellow J@ZMAHOrange KXYRIHGreen CLWVPHBlue WMQ#SHBlack VYBKEHPurple RISOWHBrown EQXFMHWhite MDCU@HSilver SKAJ#HGold IRVXLHGray EGXSVHMauve XKNJYHCopper YSFLCHTeal OVYXGH

Spring 2011 32
ii. Some got an answer wrong, which led them forward to a later station they shouldn’t have reached yet.
iii. This also lets you help by looking at your answer sheet and saying “you have to go back to ‘B’. You did it correctly up until then.”
c. What the Reward is! Makes it competitive if 1st, 2nd, 3rd get different rewards. Ex. +3, +2, +1 bonus marks on quiz.
PLEASE DO NOT REMOVE!!!
Write this Code Letter down for this Station: A
Next Clue for each group:(if you don't see your group go back to your last clue, you've made a mistake)
Red 5x - y = 18 Yellow x/3 + y/2 = 5/23x + 2y = 16 2x - 3y = -3
Orange Green
Blue Black
Purple Brown
White Silver 2x + 8y = 8-2x + y = 10
Gold Gray
Mauve Copper
PLEASE DO NOT REMOVE!!!
Write this Code Letter down for this Station: O
Next Clue for each group:(if you don't see your group go back to your last clue, you've made a mistake)
Red 2x + 8y = 8 Yellow-2x + y = 10
Orange Green
Blue Black
Purple 2x + y = -11 Brown-3x - 3y = 21
White Silver
Gold Gray
Mauve Copper
Enter the question that leads to station “O”
Leads them to...
Equation that has “J” as the answer
Leads to “J”

33 Vector
I had concerns that arose as I was creating it:
1) What about cheaters? If they all had the same route they could follow the smart kids. So I had to make up different routes for each team. I also required they write down the stations they went to in order (to eliminate just wandering the halls looking for random stations that had their team name on it)
2) Won’t they be totally lost if they get a wrong answer? At each location the team names would be listed, and there would only be clues listed for teams that were supposed to be there. Usually 11 of the 15 teams would have nothing there. At each location it specified “if you don’t see your group, go back to your last location, you’ve made a mistake”. I especially enjoyed that forgetting a negative sign would put them on the right side of the entire school instead of the left side. That’ll teach ‘em to think it’s not a big deal!
3) Would there be chaos and kids running around? There ended up being speedwalking but no running. It may depend on your kids, but the threat of disqualification and “I’d like to do more things like this, but we can’t if there’s any complaints of disturbances” worked great. This could also be done entirely outside if you wanted, just draw a map of outside.
Email me at [email protected] if you have questions.
Post script: There were some great suggestions at the conference, about how one could adapt this to any subject. ex. The questions could be definitions, and the locations on the map labeled A, B, C, … that refer to a vocabulary sheet. I’m also working with a colleague to come up with Excel formulas that would do a lot of the grunt work automatically. Perhaps to be shared next year.
MA
TH
ED
UC
AT
ION
The students
absolutely loved
it.
Spring 2011 34
Project-Based Math Learning with Direct Connections to Curricula: A Practical Approach for TeachersBy Ian JonesIan Jones is a tutor and math teacher with the Vancouver School Board. He can be contacted at [email protected].
This article offers a specific student-centered project within a project-based learning environment that directly covers core data analysis curriculum and also extends linear functions as well as other topics. It is particularly relevant for the newly implemented Math 9 curriculum and for Foundations and Pre Calculus 10.
INTRODUCTION
Is there a relationship between how much time students spend on homework and how much stress they feel? Do kids sleep less
the older they get? Are secondary school students assigned more homework as they approach graduation?
These are just a couple of the many questions secondary school students have found pertinent1. These questions, as well as many others, have motivated my students to work hard to find answers while learning core math curriculum at the same time. I believe students are more highly motivated when they have questions that they genuinely want to know the answers to.
Fortunately, it is easy to connect a wide range of student-generated research questions to the BC and WNCP math curricula. In this paper, I will outline a linear relations project that provides the link between 1In my experience, students generate a rich variety of questions, ranging from the biological (“Does the number of apple seeds increase in proportion to the volume of an apple?”), to the everyday (“Do people drink fewer soft-drinks per day the older they are?”), to the teenage-centric (“Do girls who own more make-up take longer getting ready for school in the morning?”).
MA
TH
EDU
CA
TIO
N

35 Vector
student-generated research questions and core curricula. The projects they complete directly fulfill curriculum requirements and also serve as a foundation for introducing, developing and illustrating a variety of other curriculum topics throughout the school year.
PEDAGOGICAL BACKGROUND
Problem-based and experiential approaches to learning have a long history in the math education literature and, even recently, are of increasing interest among educators (Hmelo-Silver, 2004, p. 236). In the traditions of Kilpatrick (1918, 1921) and Dewey (1938), problem-based learning attempts to incorporate practical, real-world experience in learning. When successful, problem-based approaches help students construct an extensive and flexible knowledge base, develop effective problem-solving skills, develop self-directed, life-long learning skills, become effective collaborators, and become intrinsically motivated to learn (Hmelo-Silver, 2004, p. 240).
One of the greatest challenges for a classroom teacher, however, is finding or creating relevant problems (cf Krajcik, McNeill, & Reiser, 2008, pp. 4-5). Many excellent problems and projects have been developed, however it is sometimes difficult and time-consuming for classroom teachers to find problems that closely match the curriculum they need to address. It can be even more difficult to find problems that are flexible enough to meet the individual needs of diverse learners within a single classroom. For teachers deluged by many demands, finding or creating appropriate problems is sometimes cast aside in favour of more expedient, albeit sometimes less interesting, instructional approaches.
Allowing students to generate their own problems leads to increased individualization and, I believe, greater student motivation. It is the approach I follow in the project outlined in this paper. Teaching students to brainstorm potential project questions in small groups and letting individual students choose their favourite question – subject to teacher approval – preserves many of the traditional benefits of problem-based learning while introducing additional benefits. Students still benefit from the fundamental goals of problem based learning outlined by Hmelo-Silver (2004, pp. 240-241). Moreover, students are often more intrinsically motivated to learn when they select their own project problem and there is oftern more collaboration when students within each group who have chosen different and interesting problems to work on, can then discuss those problems with other members of the group. Brainstorming potential project topics also develops a valuable skill. Students naturally choose topics suited to individual tastes, experience and motivation.
CONNECTION TO WESTERN AND NORTHERN CANADIAN PROTOCOL GOALS
One of the
greatest
challenges for
a classroom
teacher,
however, is
finding or
creating relevant
problems

Spring 2011 36
It is worth briefly mentioning the strong alignment between student-selected projects and the goals stated by the Western and Northern Canadian Protocol. The WNCP states:
Students are curious, active learners with individual interests, abilities, needs and career goals. They come to school with varying knowledge, life experiences, expectations and backgrounds. A key component in developing mathematical literacy in students is making connections to these backgrounds, experiences, goals and aspirations. (WNCP, 2008, p. 2)
Problem-based project learning where students choose their own problems is clearly sensitive to individual backgrounds and experiences. The brainstorming process whereby students select their topics also gives teachers an excellent opportunity to learn more about the various backgrounds, goals and interests of their students.
The WNCP (2008, p. 17) also states that “wherever possible, meaningful contexts should be used in examples, problems and projects.” This is at the very heart of the student-chosen project. Students choose research questions that are meaningful to them, and in the process of completing their project, learn core math curriculum. Teachers also acquire a flood of real-world examples which students find meaningful and that can be used throughout the year.
SAMPLE LINEAR RELATIONS PROJECT
To clarify the direct implementation of this student-generated, project-based approach, I provide below an instruction sheet I have used with my classes.
For this project you will design a survey or experiment. You will examine the relationship between two variables that you think have a linear relationship. If they don’t turn out to have a linear relationship, that’s okay, but you’re objective is to try to pick two that do. Your teacher must approve your experiment and sign it off.
Proposal #1: I think there is probably a linear relationship between... _______________________________________________________________________
Proposal #2: I think there is probably a linear relationship between... _______________________________________________________________________
For your experiment you need to go through the following steps:
1. Brainstorm variables that are related in some way that you could measure. The values of the variables could be objectively measured (e.g. length, height, weight, price, temperature, etc.) or they could be subjectively
Problem-based
project learning
where students
choose their
own problems
is clearly
sensitive to
individual
backgrounds
and
experiences
MA
TH
EDU
CA
TIO
N

37 Vector
measured, perhaps through a survey (e.g. “Rate how tasty this is on a scale from 1 to 5 where 1 is revolting and 5 is delicious.”)
2. Design your experiment. What exactly are you going to measure? How are you going to measure it? If a survey is involved what exactly will the questions be? (You need your questions to be precise and unbiased.) When and where are you going to collect your data? (You need a random sample. i.e. If you survey all your friends the results might be biased because your friends might have more similarities than randomly chosen people.) Write the details down.
3. Conduct the experiment. Record your data carefully. You will need at least 20 data points. More is better.
4. Analyze your results. Plot the first 5 points by hand and then use a spreadsheet to plot the rest. (Remember to use the school library or public library if you need to. Using a spreadsheet is much less work than doing the full analysis by hand.) Include a scatter plot for each experiment.
5. Report your results. Does the relationship appear to be linear? If so, include an estimate of the line of best fit. You can even have your spreadsheet calculate the correlation if the data appears to be linear. (Including correlations is optional.) Is there anything surprising about your results? Is there anything that should be corrected for next time? Is there anything interesting that someone might like to investigate further?
Your final report will need the following sections. You don’t necessarily need to answer every question in each section.
1. Description of Experiment. Here are some questions to help you think about key points to describe your experiment: What were the variables? What relationship were you expecting between them? How many data points did you collect? If this is a small number, why not more? What exactly did you measure? How did you measure it? If you used a survey, provide the questions. How did you select your sample? How did you make sure the sample was random?
2. Table of the Data. Use headings that include the units. You can print this directly from your spreadsheet. For a nicer presentation, see if you can copy and paste or screen capture the data into a table for your report.
3. Scatter Plot of the Data. Again, you can print this straight from your spreadsheet, or copy and paste or screen capture for a nicer presentation. If there appears to be a linear relationship, make sure you also include your estimate of the line of best fit. Otherwise, leave the scatter plot as is.
4. Summary of Results. Again, here are some questions to help you think about what you could include in your summary: What were the results? Does there appear to be a relationship between the variables? Does there appear to be a linear relationship between the variables? Were the results as expected? Was there anything that you would do differently next time? Did you calculate the correlation (optional) or can you explain how you know the data is linear
What is math
good for,
anyway?

Spring 2011 38
than just by looking at it? Does this relationship imply anything special? Is there anything interesting that someone might like to investigate further? What can be learned from the results?
5. This Sheet as the Last Page. This is so I can check for my signature beside your proposal for the investigation you did.
Each experiment will be marked using the following rubric (or one similar to it):
LOW QUALITY (0-50)
MEDIUM QUALITY (50-65)
HIGH QUALITY(65-90)
EXCEPTIONAL QUALITY (90-100)
DESCRIPTION OF EXPERIMENT
Incomplete or poorly explained description. Procedure is confusing and / or insufficient.
Basic description. Variables are mentioned. General procedure of the experiment is clear.
Clear and sufficiently detailed description of experiment. The variables include units and are precisely defined. The description leaves the reader with a vivid image of the experiment.
Clarity and detail are exquisite. Reader has no doubt as to how the experiment was conducted. Reader could repeat the experiment exactly. Ample data was collected. The importance of the experiment is made clear with reference to why the relationship to be investigated is important or interesting.
PRESENTATION OF DATA IN TABLE
Data is incomplete, insufficient, questionable or unclear.
All data is presented clearly with labels. The amount of data collected may be insufficient.
All data is presented clearly with labels and units. A sufficient amount of data has been collected.
Same as High Quality.
PRESENTATION OF DATA IN SCATTER PLOT
Some data points are plotted incorrectly, some data points are missing, or the scatter plot is missing essential elements such as a title.
All data points are plotted correctly and the scatter plot includes x-axis labels, y-axis labels and a title. If appropriate a good estimate for the line of best fit has been drawn.
In addition to medium quality criteria, the scatter plot is aesthetically pleasing.
Same as High Quality.M
AT
HED
UC
AT
ION

39 Vector
SUMMARY / EXPLANATION OF RESULTS
Discussion is unrealistic, inaccurate or incomplete.
Discussion of results is honest and accurate. Relationships are identified where they exist and not assumed to exist where they do not.
Discussion of results is honest and insightful. Relationships are identified where they exist and not assumed to exist where they do not. Suggestions for possible causes of relationships or non-relationships are provided. Other interesting or insightful comments are provided.
In addition to High Quality criteria, summary gives reader a sense of the significance of the results and a better understanding of what further investigations should be made. Reader is genuinely motivated to extend this investigation by doing or funding further experiments.
COMMENTS ON LINEAR RELATIONS PROJECT
Brainstorming
As students generate ideas, they are indirectly answering the common question, “what is math good for, anyway?” By listening to and engaging students in conversation, a teacher can also learn information about student interests, which can be incorporated into future lessons, worksheets and formative assessment.
Teacher Sign Off & Rubric
For some students, finding a workable topic is the most difficult stage. I recommend a deadline where each student must have at least two ideas signed by the teacher. Also, by including the assessment rubric on the same sheet as the sign-off, students have clear expectations for their project and are generally able to complete higher quality work. Insisting they attach this rubric to their final report allows the teacher to check for his own signature and also saves time by streamlining the assessment process.
Designing the Experiment, Survey or Research Plan
Students must carefully write (and rewrite) their survey questions or experimental design and must decide how to select their sample. Generally more teacher involvement is needed at this stage.
METHOD OF INSTRUCTION
To maximize student learning, a teacher needs to find the right balance between direct instruction and background facilitation, both for the class as a whole and for individual students. A student-selected project approach works best when the classroom teacher is able to shift

Spring 2011 40
seamlessly among whole class direct instruction, student-lead collaboration, and individual student facilitation, as needed. Indeed, this is one of the hallmarks of skilled teaching and is undoubtedly an art! It must be emphasized, however, that unlike with problems crafted by a professional educator, student-selected project approaches require heightened teacher monitoring and intervention and some critical direct instruction.
MATCHING THE MATH 9 CURRICULUM
By appropriately supporting students in completing a their individual versions of the Linear Relations Project, students cover the entire data analysis section of the new Math 9 curriculum, namely sections D1, D2 and D3 (Ministry of Education, 2008, p. 51). Specific connections to the curriculum are outlined below.
Direct Connections to Math 9 Curriculum
Project Stage
Math 9 Curriculum Comments
All stages
Math 9: D3 Develop and implement a project plan for the collection, display, and analysis of data by formulating a question for investigation, choosing a data collection method that includes social considerations, selecting a population or a sample, collecting the data, displaying the collected data in an appropriate manner and drawing conclusions to answer the question [C, PS, R, T, V]
This PLO will be completely satisfied by the end of the project.
Design Math 9: D1 Describe the effect of bias, use of language, ethics, cost, time and timing, privacy and cultural sensitivity on the collection of data [C, CN, R, T]
Discussing these issues at the beginning of the design stage will help students design good surveys. Surveys are often the most popular choice among students.
MA
TH
EDU
CA
TIO
N

41 Vector
Design Math 9: D2 Select and defend the choice of using either a population or a sample of a population to answer a question [C, CN, PS, R]
During the design stage, discuss the difference between a population and sample, as well as types of samples and how to construct them.
All Stages After Design
Review Math 8: D1 Critique ways in which data is presented [C, R, T, V]
If students are situated in groups, they can be encouraged to view each others’ projects and should be able to offer some helpful critiques.
Graphing Review Math 8: B1 Graph and analyse two-variable linear relations [C, ME, PS, R, T,V]
Students should already have been introduced in Math 8 to basic concepts such as plotting points from a table of values.
Report & After Projects are Finished
Math 9: B2 Graph linear relations, analyse the graph, and interpolate or extrapolate to solve problems [C, CN, PS, R, T, V]
If B2 has already been taught, there is an opportunity to enhance understanding of B2 by using completed projects to interpolate and extrapolate.
CONNECTIONS TO THE FOUNDATIONS OF MATHEMATICS AND PRE-CALCULUS 10 CURRICULUM
In Foundations of Mathematics and Pre-Calculus 10, the same project can be employed. Although Foundations 10 does not include data analysis, a quicker version of the project would provide a context for addressing many aspects of relations and functions (WNCP 2008, p. 52-55).
The project addresses sub-topics C1.1 and C1.4 well (WNCP 2008, p. 52) and also serves as an excellent reference for contextualizing a very large portion of the course. Slopes, intercepts, domain, range, equations of lines, tables of values, ordered pairs, slope-intercept form of lines and many other aspects of linear relations and functions can be understood by students in terms of their personal, concrete examples. These mathematical concepts have specific meanings that can enhance students’ understanding of their project questions, showing the power math has to enhance understanding of real world questions. As many educators emphasize, “students are better able to construct new knowledge when they can relate it to what they already know” (Hmelo-Silver, 2004, p. 240). Specific suggestions for Foundations 10 follow.
Spring 2011 42
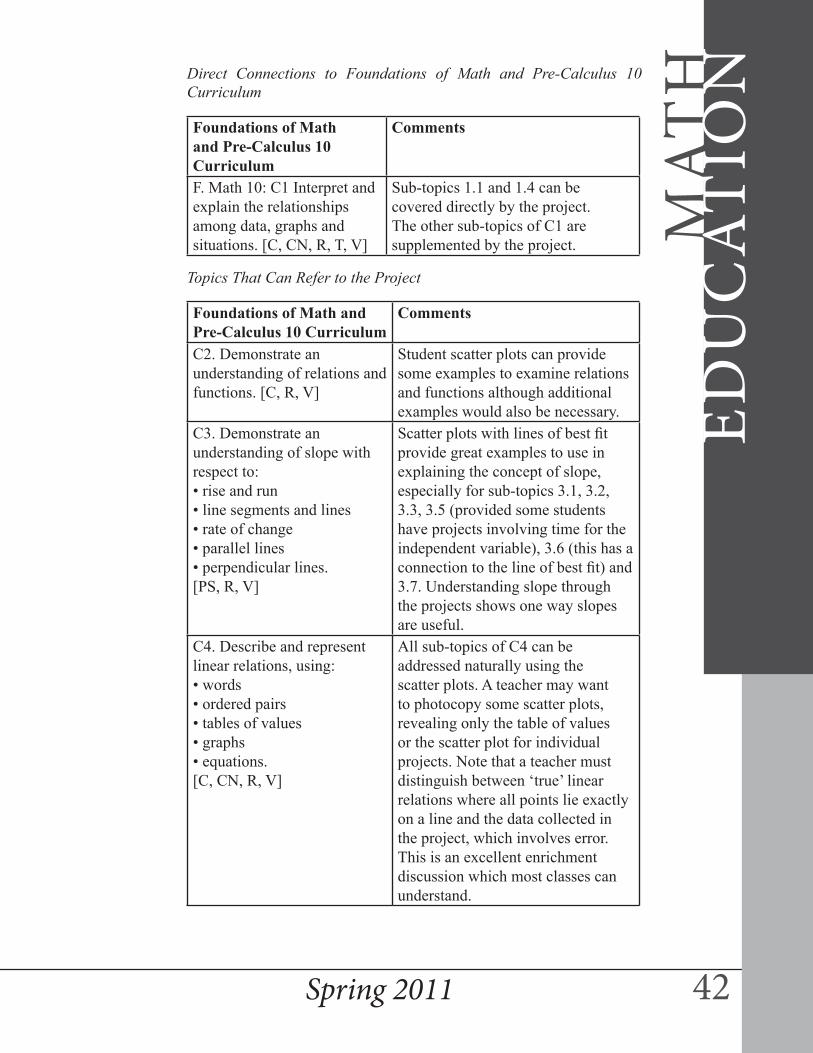
Direct Connections to Foundations of Math and Pre-Calculus 10 Curriculum
Foundations of Math and Pre-Calculus 10 Curriculum
Comments
F. Math 10: C1 Interpret and explain the relationships among data, graphs and situations. [C, CN, R, T, V]
Sub-topics 1.1 and 1.4 can be covered directly by the project. The other sub-topics of C1 are supplemented by the project.
Topics That Can Refer to the Project
Foundations of Math and Pre-Calculus 10 Curriculum
Comments
C2. Demonstrate an understanding of relations and functions. [C, R, V]
Student scatter plots can provide some examples to examine relations and functions although additional examples would also be necessary.
C3. Demonstrate an understanding of slope with respect to:• rise and run• line segments and lines• rate of change• parallel lines• perpendicular lines.[PS, R, V]
Scatter plots with lines of best fit provide great examples to use in explaining the concept of slope, especially for sub-topics 3.1, 3.2, 3.3, 3.5 (provided some students have projects involving time for the independent variable), 3.6 (this has a connection to the line of best fit) and 3.7. Understanding slope through the projects shows one way slopes are useful.
C4. Describe and represent linear relations, using:• words• ordered pairs• tables of values• graphs• equations.[C, CN, R, V]
All sub-topics of C4 can be addressed naturally using the scatter plots. A teacher may want to photocopy some scatter plots, revealing only the table of values or the scatter plot for individual projects. Note that a teacher must distinguish between ‘true’ linear relations where all points lie exactly on a line and the data collected in the project, which involves error. This is an excellent enrichment discussion which most classes can understand.
MA
TH
EDU
CA
TIO
N
43 Vector
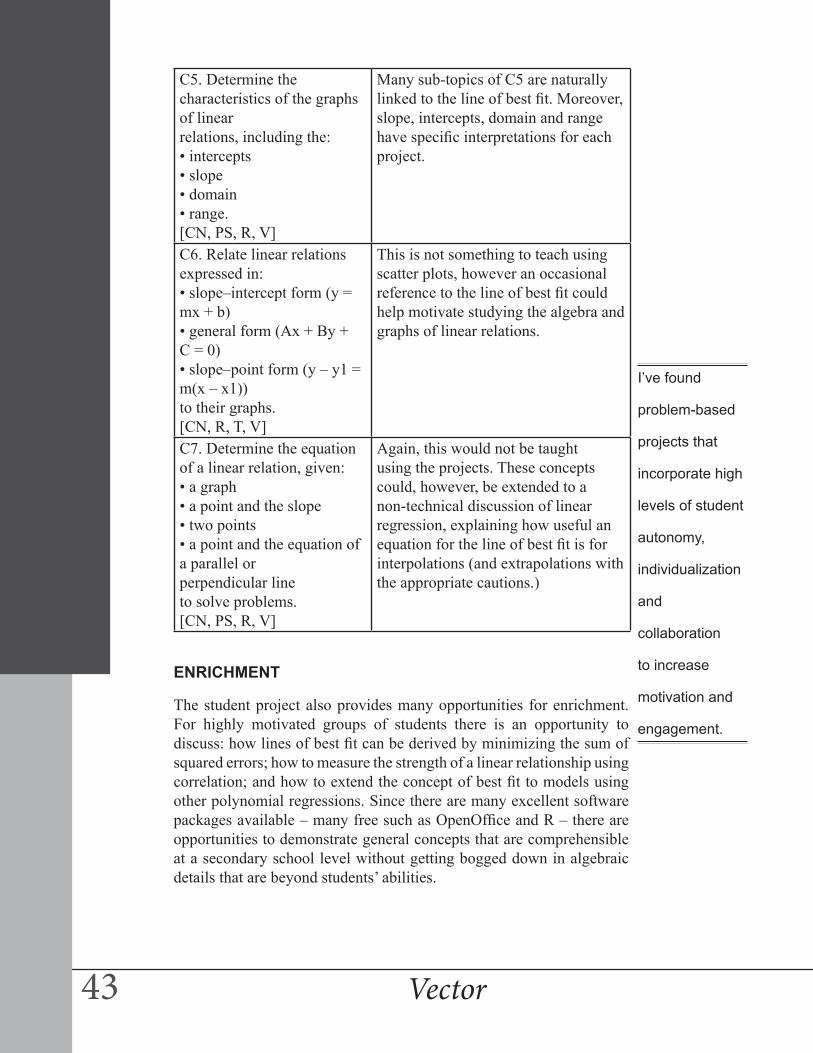
C5. Determine the characteristics of the graphs of linearrelations, including the:• intercepts• slope• domain• range.[CN, PS, R, V]
Many sub-topics of C5 are naturally linked to the line of best fit. Moreover, slope, intercepts, domain and range have specific interpretations for each project.
C6. Relate linear relations expressed in:• slope–intercept form (y = mx + b)• general form (Ax + By + C = 0)• slope–point form (y – y1 = m(x – x1))to their graphs.[CN, R, T, V]
This is not something to teach using scatter plots, however an occasional reference to the line of best fit could help motivate studying the algebra and graphs of linear relations.
C7. Determine the equation of a linear relation, given:• a graph• a point and the slope• two points• a point and the equation of a parallel orperpendicular lineto solve problems.[CN, PS, R, V]
Again, this would not be taught using the projects. These concepts could, however, be extended to a non-technical discussion of linear regression, explaining how useful an equation for the line of best fit is for interpolations (and extrapolations with the appropriate cautions.)
ENRICHMENT
The student project also provides many opportunities for enrichment. For highly motivated groups of students there is an opportunity to discuss: how lines of best fit can be derived by minimizing the sum of squared errors; how to measure the strength of a linear relationship using correlation; and how to extend the concept of best fit to models using other polynomial regressions. Since there are many excellent software packages available – many free such as OpenOffice and R – there are opportunities to demonstrate general concepts that are comprehensible at a secondary school level without getting bogged down in algebraic details that are beyond students’ abilities.
I’ve found
problem-based
projects that
incorporate high
levels of student
autonomy,
individualization
and
collaboration
to increase
motivation and
engagement.
Spring 2011 44
FINAL REMARKS
In my classroom, I’ve found problem-based projects that incorporate high levels of student autonomy, individualization and collaboration to increase motivation and engagement. I hope you will find similar success
REFERENCES
Dewey, J. (1938). Experience and Education, Macmillan, New York.
Hmelo-Silver, C. E. (2004). Problem-based learning: What and how to students learn? Educational Psychology Review, 16, 235-266.
Kilpatrick, W. H. (1918). The project method. Teachers College Record 19: 319–335.
Kilpatrick, W. H. (1921). Dangers and difficulties of the project method and how to overcome them: Introductory statement: Definition of terms. Teachers College Record 22: 282–288.
Krajcik, J., McNeill, K. L., & Reiser, B. J. (2008). Learning-Goals-Driven Design Model: Developing Curriculum Materials That Align With National Standards and Incorporate Project-Based Pedagogy. Science Education, 92:1, 1-32.
Ministry of Education, Province of British Columbia. (2008). Mathematics 8 and 9: integrated resource package 2008. British Columbia: Author.
Western and Northern Canadian Protocol. (2008). The Common Curriculum Framework for Grades 10-12 Mathematics. Western and Northern Canada: Author.
MA
TH
EDU
CA
TIO
N

45 Vector
Analogy and Problem SolvingA tool for helping childrento develop a better concept of capacityBy Walter SzetelaThis article was originally published in the March 1978 issue of Vector
When students compare different shaped regions or different shaped containers, they are often misled by visual deceptions or
by application of incorrect mathematical generalizations. For example, given the two triangular regions with congruent bases and altitudes shown in figure 1, when students are asked to select the triangle of larger area, they are more likely to select triangle DEF because it ‘looks larger’. The longer sides of triangle DEF are a deceptive visual clue typical of misconceptions held by students without well-established concepts of area.
An example of an incorrect generalization is that equal perimeters imply equal areas. In reporting on results from the mathematical assessment of the National Assessment of Educational Progress (NAEP), Carpenter, Coburn, Reys, and Wilson (1975) observed that, in addition to problems with area, children have great difficulty with volume. They attribute some of the difficulty to the fact that some unit cubes are contained entirely inside the solid and are not directly observable. They also observe that much of the students’ difficulty with an exercise in the mathematics assessment test of the NAEP on finding the volume of a
An example
of an incorrect
generalization
is that equal
perimeters imply
equal areas
FRO
MT
HE PA
ST

Spring 2011 46
solid resulted from their having to deal with a picture rather than the solid itself. They also observe that, on the basis of results from the NAEP test, measurement concepts develop later in average American students than studies by Piaget, Inhelder, and Szeminska indicate. Piaget and his associates concluded that by the age of 11 or 12, children should be able to make volume calculations. Carpenter, Coburn, Reys, and Wilson conclude that if shortcuts for finding area and volume are introduced too early, the concepts will not be understood. They observe that authors of recent elementary texts do recognize the need for concrete measuring experiences and that problems on a printed page cannot provide sufficient experience with area and volume concepts. They therefore suggest hands-on experience with physical models for partitioning regions and solids into unit squares and cubes.
I believe that teachers should follow up such partitioning activities with problem-solving situations that are interesting and that lead students to focus on the relevant attributes of area and capacity. This suggestion is based on my experiences in working with Grade 7 and 8 students.
Analogous to the incorrect generalization that equal perimeters imply equal areas is the incorrect generalization that equal surfaces imply equal volumes. If volume concepts are more difficult than area concepts, one might expect that more students would make the incorrect generalization with surfaces and volumes than with perimeters and areas. If this is true, it would be useful to provide experiences to help to overcome this misconception. Mann and Philippi (1970) describe some activities with rectangular prisms that help students to attain better concepts of surface and volume in problem-solving situations. I explored the following questions:
1. How well are Grade 7 and 8 students able to identify the larger of two containers of different shapes that have congruent lateral surfaces
a. when they have knowledge that the lateral surfaces are congruent?
b. when they do not have knowledge that the surfaces are congruent?
2. How well are grade 7 and 8 students able to identify the polygon of larger area given two different shaped polygons known to have congruent perimeters?
3. How well are Grade 7 and 8 students able to relate the solution of an area problem to the solution of a capacity problem? (Use of analogy in problem solving)
4. How well are Grade 7 and 8 students able to transfer the use of analogy in one capacity problem to solve a related capacity problem?
Teachers should
follow up such
partitioning
activities with
problem-solving
situations that
are interesting
and that lead
students to
focus on
the relevant
attributes of area
and capacity.
squares and
cubes

47 Vector
To obtain answers to these questions, I constructed class sets of the following:
1. Hexagonal and triangular prisms. (Figure 2) These bottomless ‘containers’ were made from identical rectangular strips of tagboard 36m long and 15m wide. The capacity of the hexagon container was one and one-half times the capacity of the triangular prism.
2. Hexagonal and triangular polygons. (Figure 3) All polygons had perimeters of 36cm. The areas of the hexagons were one and one-half times the areas of the triangles.
3. Two different shaped rectangular prisms. These containers were made from identical rectangular regions 20cm long and 12cm wide. One container had a rectangular cross section 8cm long and 2cm wide. The other container had a square cross section 5cm on each edge.
4. Problem sheets to answer questions and provide reasons for answer during the one period of presentation of materials and instruction.
In each of the two Grade 7 and two Grade 8 classes, I gave every student containers, polygons, and metric rulers. At each grade level I showed one class that the hexagonal and triangular containers were actually constructed from rectangular regions of exactly the same size and shape. I folded a rectangle into three congruent sections and bent it to make a triangular prism. Following this, I folded a congruent rectangle into six congruent sections and formed it into a hexagonal prism.
FRO
MT
HE PA
ST

Spring 2011 48
In one Grade 7 and one Grade 8 class, I gave the students the hexagonal and triangular containers, but I did not show that they were constructed from material of the same size and shape. In each class, I instructed students to refrain from discussion and to follow my instructions. During the instruction, I was ably assisted by a graduate student who quietly and efficiently distributed and collected materials at appropriate times. As the students examined, measured and pondered each set of materials, they were to answer questions printed on two sheets. Enough time was allowed for each student to write his/her reason for the answer as well as the answer itself. I had to obtain the reasons so that I could assess the type of mathematical thinking each student used.
I directed each student to examine the hexagonal and triangular containers, to decide which container would hold the most material, and to give a reason for the answer. Three choices were indicated, one of which the student checked off. The first question indicates the format of several of the questions asked during the period.
1. Which container on your desk do you think holds the most material? a. The triangle container b. The hexagon container c. They both hold the same amount Give the reason for your answer:
I expected that students who had been shown that the two containers were made from congruent rectangular regions would have a greater tendency to be misled than would those who examined the two containers without that knowledge. To my surprise, that was not the case. Despite the fact that the hexagonal container had 50percent more capacity than the triangular container, only 11 out of the 94 students in the four classes selected the hexagonal container as the larger. Four students elected the triangular container as the larger, and the other 79 stated that the capacities were the same. The most common reason given was that the containers had the same measurements. Students had measured the altitudes, which were identical, and the perimeters, which were the same. The second most common reason given was surprising. Twenty-seven students wrote that the containers had the same capacity because one container, the hexagon, could be deformed into a triangular container. The hexagonal container was flexible and easily bent to form a triangular container. Here was an example of a Piaget-related conservation task with an incorrect generalization. The results are shown in Table 1.
For the second problem, I gave students a hexagon and a triangle. I instructed them to measure the perimeters of the two regions. Only after all students had measured and agreed that the perimeters of both regions were 36 cm, did I ask the students to select the polygon of larger area. The area of the hexagon was one and one-half times the area of the triangle. The results indicated that, as I expected, children do have
Here was an
example of a
Piaget-related
conservation
task with
an incorrect
generalization
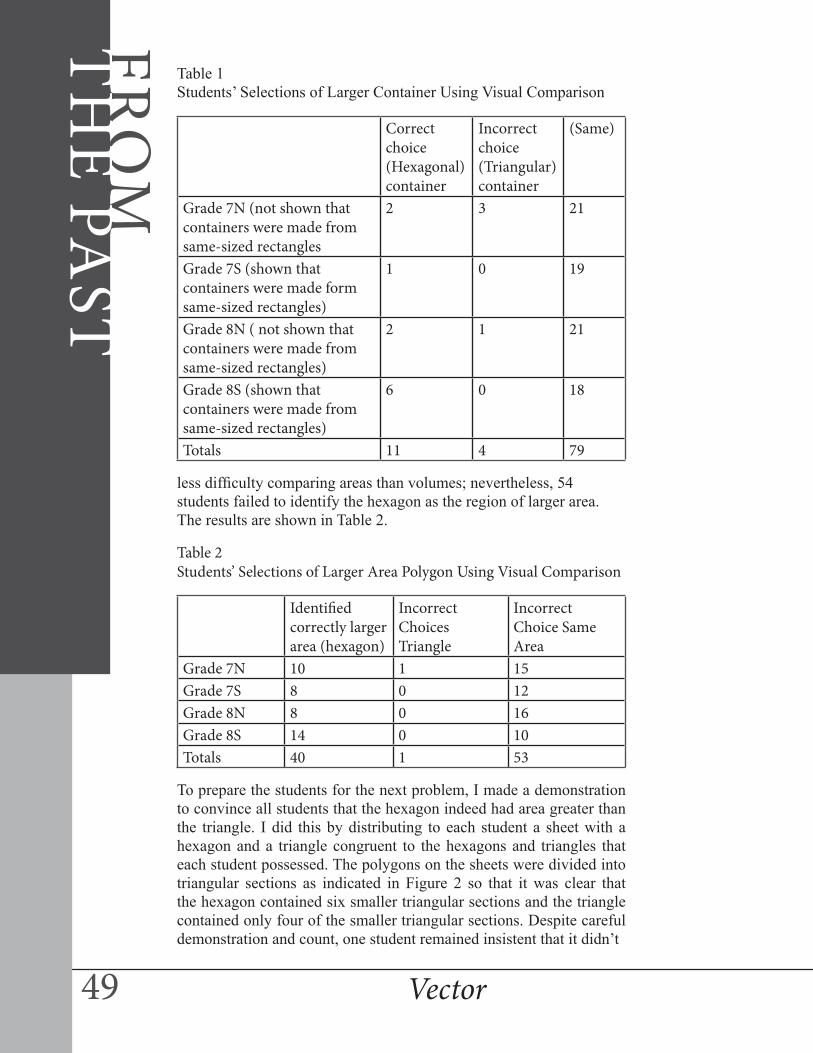
49 Vector
Table 1 Students’ Selections of Larger Container Using Visual Comparison
Correct choice (Hexagonal) container
Incorrect choice (Triangular) container
(Same)
Grade 7N (not shown that containers were made from same-sized rectangles
2 3 21
Grade 7S (shown that containers were made form same-sized rectangles)
1 0 19
Grade 8N ( not shown that containers were made from same-sized rectangles)
2 1 21
Grade 8S (shown that containers were made from same-sized rectangles)
6 0 18
Totals 11 4 79
less difficulty comparing areas than volumes; nevertheless, 54 students failed to identify the hexagon as the region of larger area. The results are shown in Table 2.
Table 2 Students’ Selections of Larger Area Polygon Using Visual Comparison
Identified correctly larger area (hexagon)
Incorrect Choices Triangle
Incorrect Choice Same Area
Grade 7N 10 1 15Grade 7S 8 0 12Grade 8N 8 0 16Grade 8S 14 0 10Totals 40 1 53
To prepare the students for the next problem, I made a demonstration to convince all students that the hexagon indeed had area greater than the triangle. I did this by distributing to each student a sheet with a hexagon and a triangle congruent to the hexagons and triangles that each student possessed. The polygons on the sheets were divided into triangular sections as indicated in Figure 2 so that it was clear that the hexagon contained six smaller triangular sections and the triangle contained only four of the smaller triangular sections. Despite careful demonstration and count, one student remained insistent that it didn’t
FRO
MT
HE PA
ST

Spring 2011 50
matter; the areas were the same.
The purpose of demonstrating that the area of the hexagonal region was larger than that of the triangular region was to determine if students could use the information in the area comparisons to make an analogy to the capacity problem instead of using visual comparisons or irrelevant measurements. I presented students with the triangular and hexagonal containers a second time and asked them to compare the capacities again and select the container of larger capacity. In all four classes, the number of students who selected the correct container increased considerably. Fifty-one students chose the correct container. On reading the reasons given for the choice, I observed that 45 of the 51 students used the fact that the measure of the hexagonal cross section was greater than that of the triangular cross section. The results for the four groups are given in Table 3.
Table 3 Students’ Selections of Larger Container on Reconsideration of Problem and Number of Students Successfully Using Analogy
Incorrect Choices Correct Choice Hexagonal Prism
Number Using AnalogyTriangular
PrismSame Capacity
Grade 7N 0 12 14 12Grade 7S 0 8 12 12Grade 8N 0 14 10 10Grade 8S 0 9 15 11Totals 0 43 51 45
To determine if students could transfer the analogy of area comparison to capacity comparison for a different pair of containers, I gave students the two rectangular containers each having a cross section of perimeter 20 cm, one with a square cross section and one with a rectangular cross section 8 cm by 2 cm. The capacity of the rectangular prism was 64 percent of the capacity of the square prism. In all four groups, there was a close correlation between students who had correctly selected the container of larger capacity when comparing the hexagonal and triangular containers and those students who selected

51 Vector
the container of larger capacity when comparing the rectangular and square prisms. Of the 51 students who made the right choice on the container problem following the area problem, 42 also made the right choice on the transfer problem. In both cases, most of the students who solved the problem gave a reason indicating that they used analogy with the area problem to solve it. The results of the student’s selections on the transfer problem are given in Table 4.
Table 4 Student’s Selection of Larger Container on New Capacity Problem and Number of Students Successfully Using Analogy
Incorrect Choices Correct Choice Square Prism
Number Using AnalogyRectangular
PrismSame Capacity
Grade 7N 3 8 15 10Grade 7S 0 7 13 12Grade 8N 0 14 10 10Grade 8S 1 10 13 8Totals 4 39 51 40
Summary and Conclusions
This investigation with two Grade 7 and two Grade 8 classes indicates that students have great difficulty in making comparisons of capacities of containers, even when one container is one and one-half times the capacity of the other. Students are more successful in making similar area comparisons, yet nearly half of them could not correctly identify the larger polygon even though one had an area one and one-half times that of the other. When students were given an experience that corrected their misconceptions about the areas of the two polygons considered, more than half of the students were able to use the information, most making an analogy in the capacity problem with the area problem. On another problem involving a different pair of containers, more than half the students solved the problem, most of them using the analogy with the area problem.
There was little observable difference between the performances of the Grade 7 and 8 students, but the students came from rather different schools and communities so it is not fair to make this comparison here. A surprising result of this investigation was that 27 out of 94 students erroneously concluded that the two containers held the same amount because although they differed in shape, one could be deformed into the shape of the other. It seems evident that students need more concrete experiences with surface and volume to dispel such misconceptions.
Problem solving has been neglected in elementary school mathematics. Analogy, in particular, is an effective problem-solving strategy that has not been utilized in children’s problem-solving experiences. This
Students have
great difficulty
in making
comparisons
of capacities
of containers,
even when one
container is
one and one-
half times the
capacity of the
other
FRO
MT
HE PA
ST

Spring 2011 52
investigation indicates that the use of analogy in problem solving may well be appropriate for children at Grade 7 and 8 levels, particularly with respect to its use in helping children to focus mathematical concepts in which children have had little success of understanding.
While the results of this investigation indicated that Grade 7 and 8 students have difficulty making capacity comparisons, another investigation by McClintic (1970) produced results indicating that children as young as 3.5 to 9 years of age had excellent success in selecting the container of greater capacity where the larger of two containers was 1.25, 1.5, and 2 times as large as the smaller. In that study, children were not given an alternative choice that the capacities of the two containers might be equal. Whatever the reasons for the different results may be, concepts of area and volume need to be developed with more active learning experiences, and some of the experiences should include interesting problem-solving situations that may include the use of analogy.
References
Carpenter, Thomas P., Coburn, Terrence G., Reys, Robert E., and Wilson, James W. ‘Notes from National Assessment: Basic Concepts of Area and Volume.’ The Arithmetic Teacher, 22 (October 1975), 501-507.
Mann III, Nathaniel, and Philippi, Dale. ‘Volume and Surface Area of Rectangular Prisms: A Maximum-Minimum Problem for the Grades.’ The Arithmetic Teacher, 17 (April 1970), 291-292.
McClintic, Joan. ‘Capacity Comparison by Children.’ The Arithmetic Teacher, 17 (January 1970), 19-25.
It seems
evident that
students need
more concrete
experiences
with surface
and volume
to dispel such
misconceptions

53 Vector
Mathematical Recreations and Essays was originally written by W. W. Rouse Ball
over a hundred years ago (1892) under the title Mathematical Recreations and Problems. It is now in its 13th edition and has been revised and updated by one of the most noted geometers of the 20th century, H.S.M. Coxeter. It contains a collection of popular mathematical problems and topics, some that have solutions and some that are yet to be solved.
I came across this book while reading a biography of H.S.M. Coxeter, King of Infinite Spaces by Siobhan Roberts (which I highly recommend). Since its first publication, some topics have been removed such as Mechanical recreations, Bees and their cells and Kirkman’s School-Girls Problems. Coxeter has shown his love of geometry with the addition of a chapter on Polyhedra. Older editions can be found in “Google Books” for anyone interested in the omitted chapters.
The problems found within the covers of the 13th edition are not new problems. Some you may have encountered in one form or another, such as The Tower of Hanoi (p. 316) or Magic Squares (p. 193). One aspect I found frustrating was when Coxeter ends a problem with “The solution presents no difficulty” (p. 27) and I found it difficult! Antique problems such as “A man goes to a tub of water with two jars, of which one holds exactly 3 pints and the other 5 pints. How can he bring back exactly 4 pints of water?” (p. 27) are included. I enjoyed using this type of problem with my students since there were often additional examples as well as ‘extensions’ to problems and ‘explorations.’ In addition, there are classic problems such as the proof of Pythagorean Theorem. The Indian mathematician Arya-Bhata’s symmetrical proof is presented as an alternative to Euclid’s “clumsy and hard to memorize” proof (p. 88). Considering the de-emphasis on
Mathematical Recreations and EssaysReviewed By Lisa TurnbullRevised and Updated by: H. S. M. CoxeterOriginal Author: W. W. Rouse BallISBN: 978-0486253572© 2010 Dover PublicationsPaperback, 448 pages
I enjoyed using
this type of
problem with
my students
since there were
often additional
examples
as well as
‘extensions’ to
problems and
‘explorations.’
BO
OK
REV
IEW

Spring 2011 54
geometry in secondary mathematics, it was good to see geometry well represented with the inclusion of discussions about the three classical geometric problems: the quadature of a circle, the trisection of an angle and the duplication of the cube (p.339). Popular discussions such as the Four-Colour Conjecture for map-colouring (p.222), Tessellations (p. 105), Triangular and Pyramidal Numbers (p.59), Divisibility (p.60) and Fermat’s Last Theorem (p. 67)Cryptography (p.389), and Dragon Designs (p.266), to name only a few, are also explored. Discussions and problems include many historical references to some of the great mathematicians including Apollonius, Descartes and Newton while an entire chapter is devoted to the stories of men with “extraordinary powers of mental calculation” (p.360) which Coxeter calls “Calculating Prodigies.”
I would recommend this book for anyone interested in exploring different areas of mathematics. Much of the book is accessible to the layman mathematician although there are definitely topics which require a deeper understanding in order to be fully appreciated. It is by no means a comprehensive treatise on these topics but rather a great reminder and an introduction to different fields of mathematics which may be the starting point to some good classroom discussions and general interest.
Get practical, hands-on experience with the Post-Baccalaureate Diploma in Mathematics and Science Teaching. Designed for working elementary or middle-school teachers, you’ll:
• Take classes in the evening, on weekends and online• Get comfortable with the new mathematics curriculum• Rediscover chemistry, biology, physics and earth science• Become eligible for TQS upgrading• Connect with other teachers in a friendly and positive environment
Dread teaching math? Science lessons “by the book”?It’s time to get inspired.
Classes start in September – attend a free information session soon! For details call 604-527-5221 or visit douglascollege.ca/MSTE
10-240

55 Vector
On October 14, 2010, at the age of 85 the mathematical community lost Benoit Mandelbrot, well known as the father of fractal geometry. As the creator of our most
famous contemporary mathematical image – the Mandelbrot set – Mandelbrot had few rivals in the category of mathematicians whose work was recognized (if not understood) by the general public.
In 2002 I had the pleasure of interacting with Mandelbrot through a series of email exchanges about his thoughts on mathematical creativity and the AHA! experience. These exchanges, along with similar exchanges with 25 other prominent research mathematicians, were designed and implemented as part of a research project to build a greater understanding of the mathematical mind vis-à-vis the creation and discovery of mathematics. This research was modeled on the work of Jacques Hadamard who, in 1943, gave a series of lectures on mathematical invention at the Ecole Libre des Hautes Etudes in New York City. These talks were subsequently published as The Psychology of Mathematical Invention in the Mathematical Field (Princeton University Press).
Hadamard’s seminal work outlines the beliefs of contemporary mathematicians as to the mechanism by which they come to create new mathematics. He based his survey on an earlier one that was published in the periodical L’Enseignement Mathematique (Vol. I, 1902 and Vol. VI, 1904). adamarde was critical of this earlier survey in that it failed to solicit the views of “mathematicians whose creative processes are worthy of interest” (Hadamard, p.10). Hadamard set excellence in the field of mathematics as a criterion for participation in his study. In keeping with Hadamard’s standards I chose to survey the most prominent mathematicians (Fields medallists, Nevanlinna Prize winners, and members of: The Royal Society, American Society of Arts & Sciences, and the Academie des Sciences). Mandelbrot was such a mathematician.
Rather than go into the life history of Benoit Mandelbrot, or the nuances and relationships between fractal geometry, fractional dimension, and the Mandelbrot set, I thought it would be interesting to instead publish here Mandelbrot’s thoughts on the creation and discovery of mathematics. Although excerpts of these thoughts have been published in a number of research articles, as well as a forthcoming MAA book on the subject, this is the first time they have been published in their entirety.
It happens that I knew Hadamard personally since an uncle of mine was his successor at College de France. I also read and liked his “creativity” book. In addition, please understand that the mathematicians you are “polling” were largely trained in the 1950s or 1960s. Among them I am very atypical
MEM
OR
IUM
Benoit Mandelbrot(November 20, 1924 - October 14, 2010)By Peter Liljedahl
Spring 2011 56
and may be the person whose view of mathematics is farthest from the “norms” of yesterday and closest to Hadamard’s.
Would you say that your principle discoveries have been the result of deliberate endeavour in a definite direction, or have they arisen, so to speak, spontaneously? Have you a specific anecdote of a moment of insight/inspiration/illumination that would demonstrate this?
Most definitely. My principal discoveries have arisen “spontaneously.” Also, nearly everyone was perceived as a change of direction, in fact their topics were first reputed to wander all around. But every so often there was a spurt of after-the-fact “self-organization” and reorganization that affected future progress. One major spurt occurred in 1973 and led to a new concept (and also a new word), namely, fractal geometry. The latest spurt occurred recently: fifty years after my Ph.D. thesis, I realized that fractal geometry is the long awaited theory of roughness in its mathematical and other aspects.
How much of mathematical creation do you attribute to chance, insight, inspiration, or illumination? Have you come to rely on this in any way?
Was insight important? Constantly, but it may well be that one major insight was already reflected in my Ph.D. thesis was of endless benefit. Do I experience feelings of illumination? Rarely, except in connection with chance, whose offerings I treasure. In my wandering life between concrete fields and problems, chance is continually important in two ways. A chance reading or encounter has often brought an awareness of existing mathematical tools that were new to me and allowed me to return to old problems I was previously obliged to leave aside. In other cases, a chance encounter suggested that old tools could have new uses that helped them expand.
Could you comment on the differences in the manner in which you work when you are trying to assimilate the results of others (learning mathematics) as compared to when you are indulging in personal research (creating mathematics)?
There is not much difference. More precisely, I seldom study or learn mathematics in detail. On occasion, I merely quote some existing result that I trust. When there is a need to fully assimilate something, I must redo everything in my own way.
Have your methods of learning and creating mathematics changed since you were a student? How so?
My methods of work show no real change, in fact – against every cliché – a steady improvement that may still continue at age 77.
Among your greatest works have you ever attempted to discern the origin of the ideas that lead you to your discoveries? Could you comment on the creative process that lead you to your discoveries?
My passion for the history of ideas is boundless and I go to endless lengths, not to hide the influences from which I benefited, but to understand and express them thoroughly. To me, the value of a thought combines its novelty and difficulty with the depth of its roots. The greatest thrill is to add to streams of ideas that already have a long and recognizable past. As to my creative process, the sole peculiar feature that is identifiable, significant and worthy reporting is the essential role the eye continues to play. Hadamard would have understood this very well. But in my working life, I may, from this viewpoint, be unique.

57 Vector
His family lived in awe of him. His fellow educators and teachers who knew him well were inspired by his love of mathematics and his ability to make that subject
meaningful and entertaining.
This was Walter – charming, charismatic and endearing all of his life.
He promoted the wonders and beauty of mathematics in many articles that he wrote in Vector and other journals in Canada and the U.S., even after he retired as professor of mathematics education at the University of BC.
His family wrote in his obituary that he was a man of many talents who wrote poems of personal, baseball, and mathematical themes. He was stirred by the overtures of Wagner, the marches of Elgar and the arias of Puccini and he was inspired by the songs from the Sound Of Music.
He had a lifetime obsession with stamp collecting which brought him many welcome hours of relaxation and he enjoyed his many travels to Europe, China and Australia with his wife, Teri.
He adored the game of baseball and as a mathematics teacher, I was always delighted to be around when he shared stories and statistical analysis of his beloved Boston Red Sox.
He was extremely loyal to the mathematics teachers of B.C. and to the BCAMT and never missed an opportunity to present at a North West or local BCAMT conference sometimes on a moments notice.
Walter was born in Chicopee, Massachusetts and taught mathematics for a year in New York and for 14 years in Massachusetts.
He earned a Master’s degree in Mathematics at the University of Michigan and a doctoral degree at the University of Georgia. He came to B.C. in 1970 with his family to teach at UBC for the next 21 years.
While teaching at UBC, he received invitations to share his love of mathematics education from universities in Poland, Germany, France, and in retirement from Prague, Czech Republic and Penang, Malaysia.
Kanwal Neel, a Past President of BCAMT said, on learning of his passing: “Walter was a mentor and a guide to many educators in BC, across Canada and USA. I happen to be one of the lucky ones who had many conversations with him and learned so much from his wisdom and teaching.
MEM
OR
IUM
Dr. Walter Szetela(May 27, 1928 - January 31, 2011)By Ian deGrootIan is a past president of the BCAMT.

Spring 2011 58
Walter had many remarkable qualities, one that comes to mind is his zest for learning. I remember attending many of his presentations at different conferences (BCAMT, NCTM, etc.), he would always inspire the participants with new learning. Invariably somewhere in his presentation he would stop and look at some mathematical pattern and say “WOW! Isn’t that just amazing!”
Walter always believed that his glass was full and that teaching mathematics to young people was the greatest gift of all. He will be missed.

59 Vector
PRO
BLEMSET
GRADESK-1
Using interlocking cubes make as many different shapes as you can following these conditions:• everyshapemustuseexactly5cubes.• everyshapemustbeabletolayflatonthetablesothatALLfivecubesaretouchingthetable.
GRADES2-3 What is longer – you or your bicycle tire?
GRADES4-6
How many ways can you make a dollar using only nickels, dimes, and quarters?
GRADES7-9
Create a sequence of numbers as follows. Pick any whole numbers to be term #1 and term #2. These are called the seed numbers. Term three will be the sum of term #1 and term #2. Term fourwillbethesumofthetwopreviousterms,andsoon.I’minterestedinterm#5.Findalltheseednumberssuchthatterm#5willbe100.
Spring 2011 • Problem Set

Spring 2011 60
GRADES10-12
TheotherdayIdrovetoHope.WhenIwashalfwaythereIdidaquickcalculationandfiguredoutthatmyaveragespeedthusfarwas50km/h.HowfastwouldIhavetodrivethesecondhalfofthetripinorderformyaveragespeedforthewholetriptobe100km/h?
CALCULUS Whatisthederivativeofsinθ,ifθisanangleexpressedindegrees?
andBEYOND
A round table has four deep pockets equally spaced around its perimeter. There is a cup in each pocket oriented either up or down, but you cannot see which. The goal of the game is to get all the cups up or all the cups down. You do this by reaching into any two pockets, feeling the orientation of the glasses, and then doing somethingwiththem(youcanflipone,two,ornone).However,assoonasyoutakeyourhandsout of the pockets the table spins in such a way thatyoucan’tkeeptrackofwherethepocketsyouhavevisitedare.Ifthefourglasseseverget oriented all up or all down a bell rings to signal you are done. Can you guarantee that you willgetthebelltoringinafinitenumberofmoves,andifso,howmany?

61 Vector
MA
TH
W
EBSITES
Math Central – problem of the month Thissitehasover100pastproblems(withsolutions)archived.
http://mathcentral.uregina.ca/mp/current/
Vi Hart – Math Doodling Aseriesofvideosaboutdoodlinginmathclasseach of which has a surprising and engaging outcome.
http://vihart.com/doodling/
Hans Rosling Thebeststatisticseverseen.
http://www.ted.com/talks/hans_rosling_shows_the_best_stats_you_ve_ever_seen.html
Undersea Treasure
A mathematician who specializes in mathematics helpsfindthelargestsunkentreasureinU.S.history.
http://www.thefutureschannel.com/dockets/hands-on_math/undersea_treasure/
Dancing with Geometry
A professional dancer and an orthopaedic surgeon demonstrate the fundamental role geometry and technology play in keeping dancersperformingatthehighestlevel.
http://www.thefutureschannel.com/dockets/realworld/dancing/
Spring 2011 • Math Web Sites

Peter Liljedahl Faculty of Education Simon Fraser University 8888 University Drive Burnaby, BC V5A 1S6