Embed Size (px)
Citation preview
23
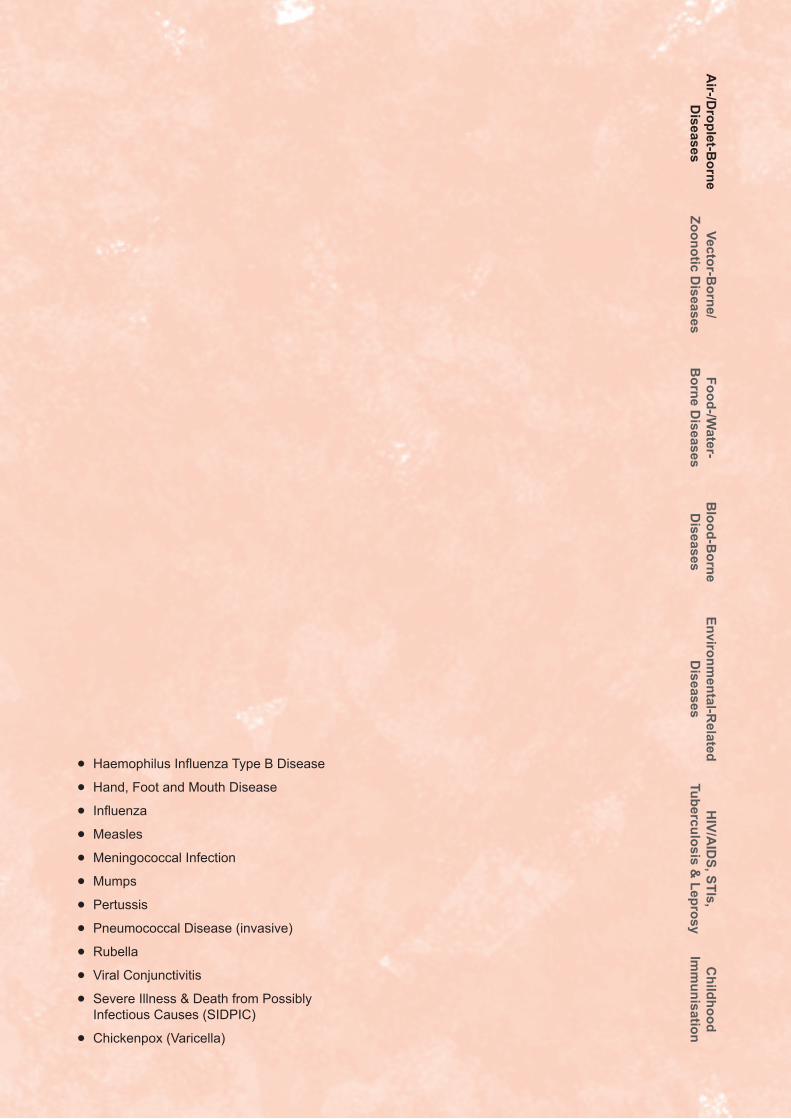
=Haemophilus Influenza Type B Disease
=Hand, Foot and Mouth Disease
= Influenza
=Measles
=Meningococcal Infection
=Mumps
=Pertussis
=Pneumococcal Disease (invasive)
=Rubella
=Viral Conjunctivitis
=Severe Illness & Death from Possibly Infectious Causes (SIDPIC)
=Chickenpox (Varicella)
Air-/D
roplet-Borne
Diseases
Vector-Borne/
Zoonotic Diseases
Food-/Water-
Borne D
iseasesB
lood-Borne
Diseases
Environmental-R
elated D
iseasesH
IV/AID
S, STIs,Tuberculosis &
LeprosyC
hildhood Im
munisation
24
IAIR-/DROPLET-BORNE DISEASES
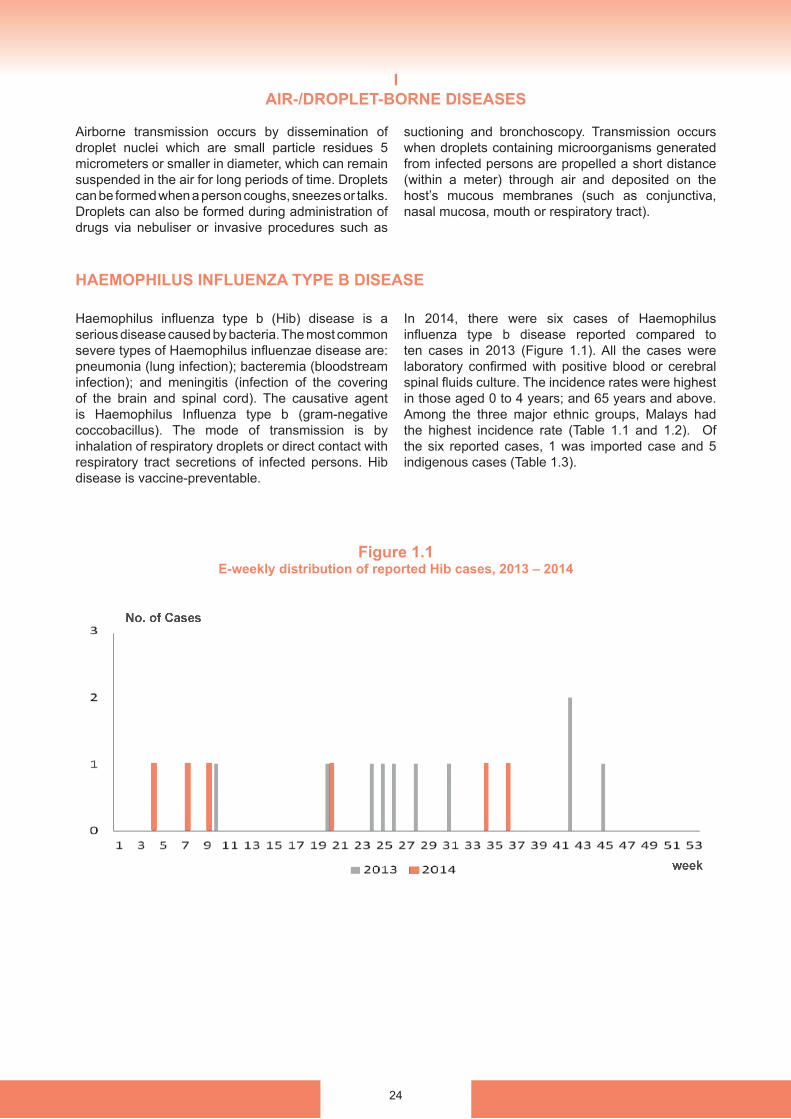
Figure 1.1E-weekly distribution of reported Hib cases, 2013 – 2014
Haemophilus influenza type b (Hib) disease is a serious disease caused by bacteria. The most common severe types of Haemophilus influenzae disease are: pneumonia (lung infection); bacteremia (bloodstream infection); and meningitis (infection of the covering of the brain and spinal cord). The causative agent is Haemophilus Influenza type b (gram-negative coccobacillus). The mode of transmission is by inhalation of respiratory droplets or direct contact with respiratory tract secretions of infected persons. Hib disease is vaccine-preventable.
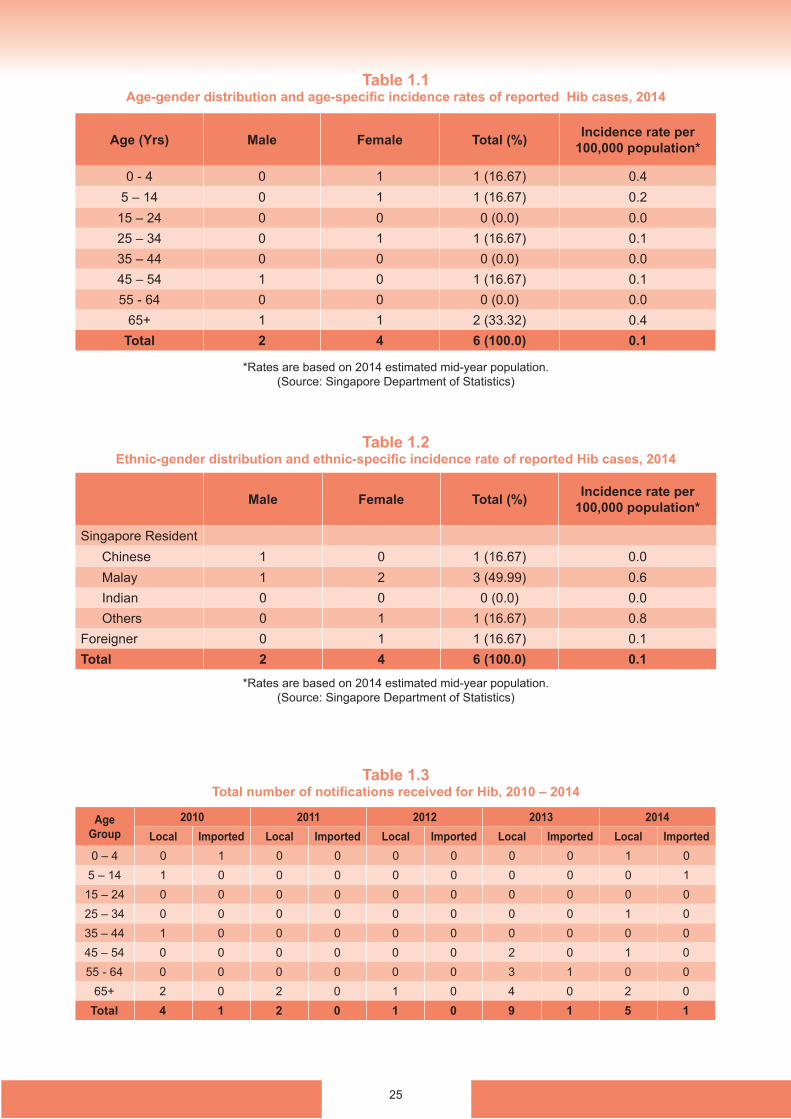
In 2014, there were six cases of Haemophilus influenza type b disease reported compared to ten cases in 2013 (Figure 1.1). All the cases were laboratory confirmed with positive blood or cerebral spinal fluids culture. The incidence rates were highest in those aged 0 to 4 years; and 65 years and above. Among the three major ethnic groups, Malays had the highest incidence rate (Table 1.1 and 1.2). Of the six reported cases, 1 was imported case and 5 indigenous cases (Table 1.3).
Airborne transmission occurs by dissemination of droplet nuclei which are small particle residues 5 micrometers or smaller in diameter, which can remain suspended in the air for long periods of time. Droplets can be formed when a person coughs, sneezes or talks. Droplets can also be formed during administration of drugs via nebuliser or invasive procedures such as
suctioning and bronchoscopy. Transmission occurs when droplets containing microorganisms generated from infected persons are propelled a short distance (within a meter) through air and deposited on the host’s mucous membranes (such as conjunctiva, nasal mucosa, mouth or respiratory tract).
HAEMOPHILUS INFLUENZA TYPE B DISEASE
25
Table 1.1Age-gender distribution and age-specific incidence rates of reported Hib cases, 2014
Table 1.2Ethnic-gender distribution and ethnic-specific incidence rate of reported Hib cases, 2014
Table 1.3Total number of notifications received for Hib, 2010 – 2014
*Rates are based on 2014 estimated mid-year population.(Source: Singapore Department of Statistics)
*Rates are based on 2014 estimated mid-year population.(Source: Singapore Department of Statistics)
Age (Yrs) Male Female Total (%) Incidence rate per 100,000 population*
0 - 4 0 1 1 (16.67) 0.45 – 14 0 1 1 (16.67) 0.215 – 24 0 0 0 (0.0) 0.025 – 34 0 1 1 (16.67) 0.135 – 44 0 0 0 (0.0) 0.045 – 54 1 0 1 (16.67) 0.155 - 64 0 0 0 (0.0) 0.0
65+ 1 1 2 (33.32) 0.4Total 2 4 6 (100.0) 0.1
Male Female Total (%) Incidence rate per 100,000 population*
Singapore ResidentChinese 1 0 1 (16.67) 0.0Malay 1 2 3 (49.99) 0.6Indian 0 0 0 (0.0) 0.0Others 0 1 1 (16.67) 0.8
Foreigner 0 1 1 (16.67) 0.1Total 2 4 6 (100.0) 0.1
Age Group
2010 2011 2012 2013 2014Local Imported Local Imported Local Imported Local Imported Local Imported
0 – 4 0 1 0 0 0 0 0 0 1 05 – 14 1 0 0 0 0 0 0 0 0 1
15 – 24 0 0 0 0 0 0 0 0 0 025 – 34 0 0 0 0 0 0 0 0 1 035 – 44 1 0 0 0 0 0 0 0 0 045 – 54 0 0 0 0 0 0 2 0 1 055 - 64 0 0 0 0 0 0 3 1 0 0
65+ 2 0 2 0 1 0 4 0 2 0Total 4 1 2 0 1 0 9 1 5 1
26
HAND, FOOT AND MOUTH DISEASE (HFMD)
Figure 1.2 E-weekly distribution of reported hand, foot and mouth cases, 2013 – 2014
Hand, foot and mouth disease (HFMD) is a common childhood viral disease characterised by brief prodromal fever, followed by pharyngitis, mouth ulcers and rash on the hands and feet. Children may have reduced appetite due to painful oral ulcers erupting on the tongue, gums or inside of the cheeks. A non-pruritic vesicular rash or red spots typically appears on the hands and feet, most commonly on the palms and soles. The common causative agents for HFMD are the coxsackieviruses type A (CA), echovirus (EC) and enterovirus 71 (EV71). HFMD can be transmitted from person to person through the faecal-oral or respiratory route.
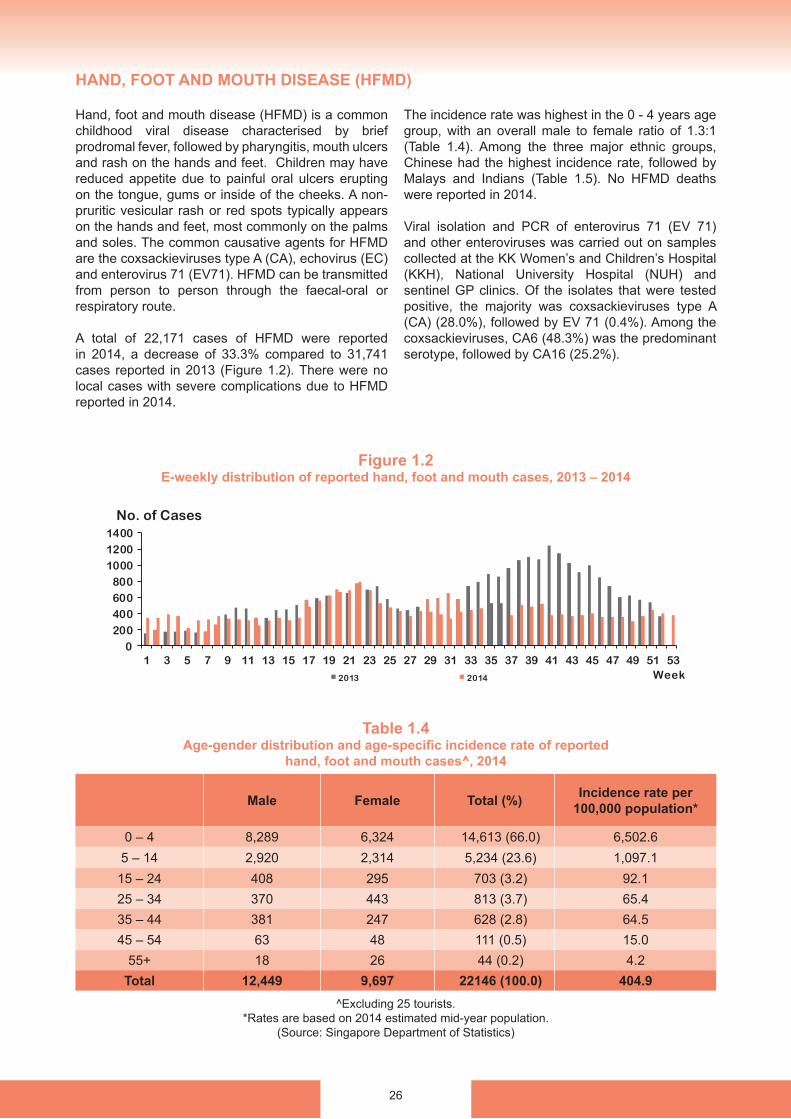
A total of 22,171 cases of HFMD were reported in 2014, a decrease of 33.3% compared to 31,741 cases reported in 2013 (Figure 1.2). There were no local cases with severe complications due to HFMD reported in 2014.
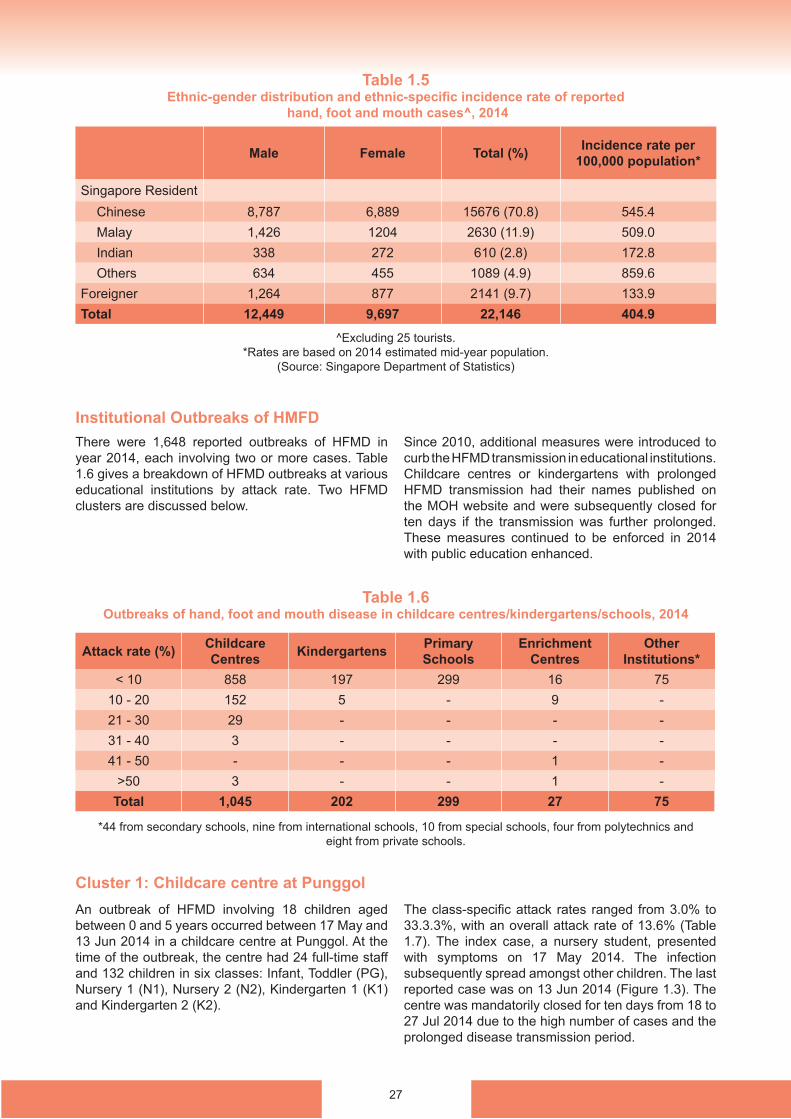
The incidence rate was highest in the 0 - 4 years age group, with an overall male to female ratio of 1.3:1 (Table 1.4). Among the three major ethnic groups, Chinese had the highest incidence rate, followed by Malays and Indians (Table 1.5). No HFMD deaths were reported in 2014.
Viral isolation and PCR of enterovirus 71 (EV 71) and other enteroviruses was carried out on samples collected at the KK Women’s and Children’s Hospital (KKH), National University Hospital (NUH) and sentinel GP clinics. Of the isolates that were tested positive, the majority was coxsackieviruses type A (CA) (28.0%), followed by EV 71 (0.4%). Among the coxsackieviruses, CA6 (48.3%) was the predominant serotype, followed by CA16 (25.2%).
Table 1.4Age-gender distribution and age-specific incidence rate of reported
hand, foot and mouth cases^, 2014
^Excluding 25 tourists.*Rates are based on 2014 estimated mid-year population.
(Source: Singapore Department of Statistics)
Male Female Total (%) Incidence rate per 100,000 population*
0 – 4 8,289 6,324 14,613 (66.0) 6,502.65 – 14 2,920 2,314 5,234 (23.6) 1,097.115 – 24 408 295 703 (3.2) 92.125 – 34 370 443 813 (3.7) 65.435 – 44 381 247 628 (2.8) 64.545 – 54 63 48 111 (0.5) 15.0
55+ 18 26 44 (0.2) 4.2Total 12,449 9,697 22146 (100.0) 404.9
27
Institutional Outbreaks of HMFD
Table 1.6Outbreaks of hand, foot and mouth disease in childcare centres/kindergartens/schools, 2014
*44 from secondary schools, nine from international schools, 10 from special schools, four from polytechnics and eight from private schools.
Cluster 1: Childcare centre at Punggol
Table 1.5Ethnic-gender distribution and ethnic-specific incidence rate of reported
hand, foot and mouth cases^, 2014
There were 1,648 reported outbreaks of HFMD in year 2014, each involving two or more cases. Table 1.6 gives a breakdown of HFMD outbreaks at various educational institutions by attack rate. Two HFMD clusters are discussed below.
Since 2010, additional measures were introduced to curb the HFMD transmission in educational institutions. Childcare centres or kindergartens with prolonged HFMD transmission had their names published on the MOH website and were subsequently closed for ten days if the transmission was further prolonged. These measures continued to be enforced in 2014 with public education enhanced.
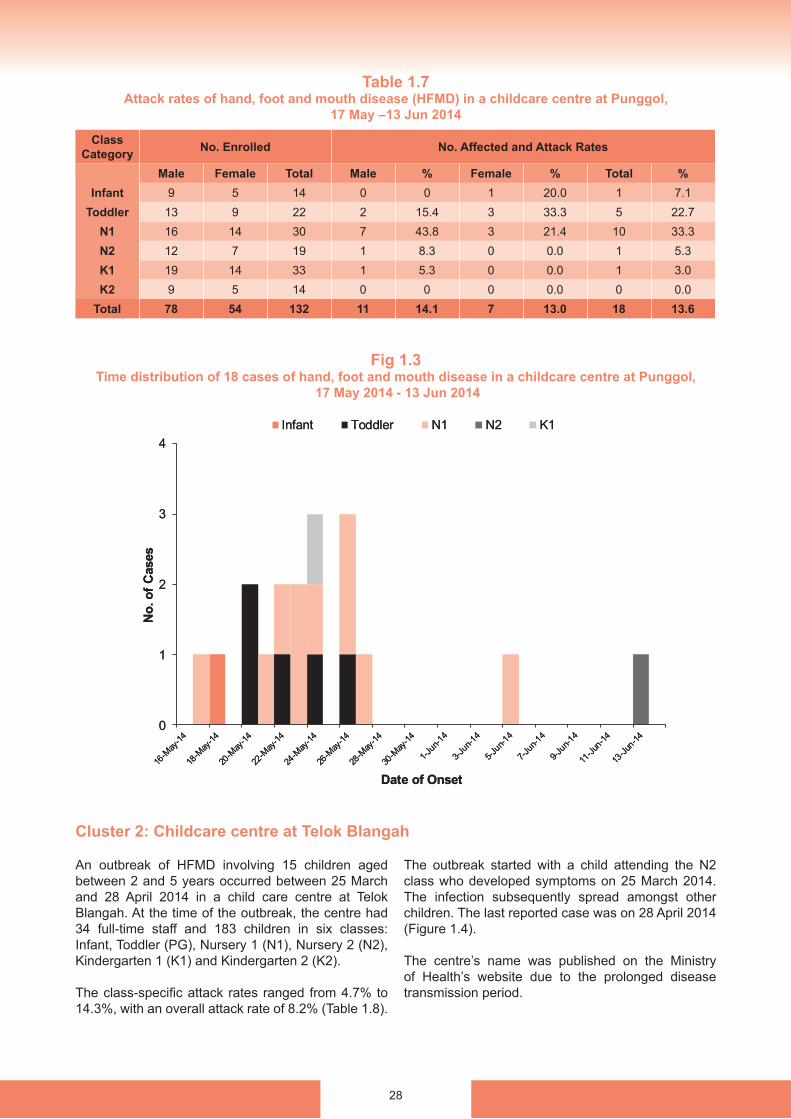
An outbreak of HFMD involving 18 children aged between 0 and 5 years occurred between 17 May and 13 Jun 2014 in a childcare centre at Punggol. At the time of the outbreak, the centre had 24 full-time staff and 132 children in six classes: Infant, Toddler (PG), Nursery 1 (N1), Nursery 2 (N2), Kindergarten 1 (K1) and Kindergarten 2 (K2).
The class-specific attack rates ranged from 3.0% to 33.3.3%, with an overall attack rate of 13.6% (Table 1.7). The index case, a nursery student, presented with symptoms on 17 May 2014. The infection subsequently spread amongst other children. The last reported case was on 13 Jun 2014 (Figure 1.3). The centre was mandatorily closed for ten days from 18 to 27 Jul 2014 due to the high number of cases and the prolonged disease transmission period.
^Excluding 25 tourists.*Rates are based on 2014 estimated mid-year population.
(Source: Singapore Department of Statistics)
Male Female Total (%) Incidence rate per 100,000 population*
Singapore ResidentChinese 8,787 6,889 15676 (70.8) 545.4Malay 1,426 1204 2630 (11.9) 509.0Indian 338 272 610 (2.8) 172.8Others 634 455 1089 (4.9) 859.6
Foreigner 1,264 877 2141 (9.7) 133.9Total 12,449 9,697 22,146 404.9
Attack rate (%) Childcare Centres Kindergartens Primary
SchoolsEnrichment
CentresOther
Institutions*< 10 858 197 299 16 75
10 - 20 152 5 - 9 -21 - 30 29 - - - -31 - 40 3 - - - -41 - 50 - - - 1 -
>50 3 - - 1 -Total 1,045 202 299 27 75
28
Table 1.7Attack rates of hand, foot and mouth disease (HFMD) in a childcare centre at Punggol,
17 May –13 Jun 2014
Cluster 2: Childcare centre at Telok Blangah
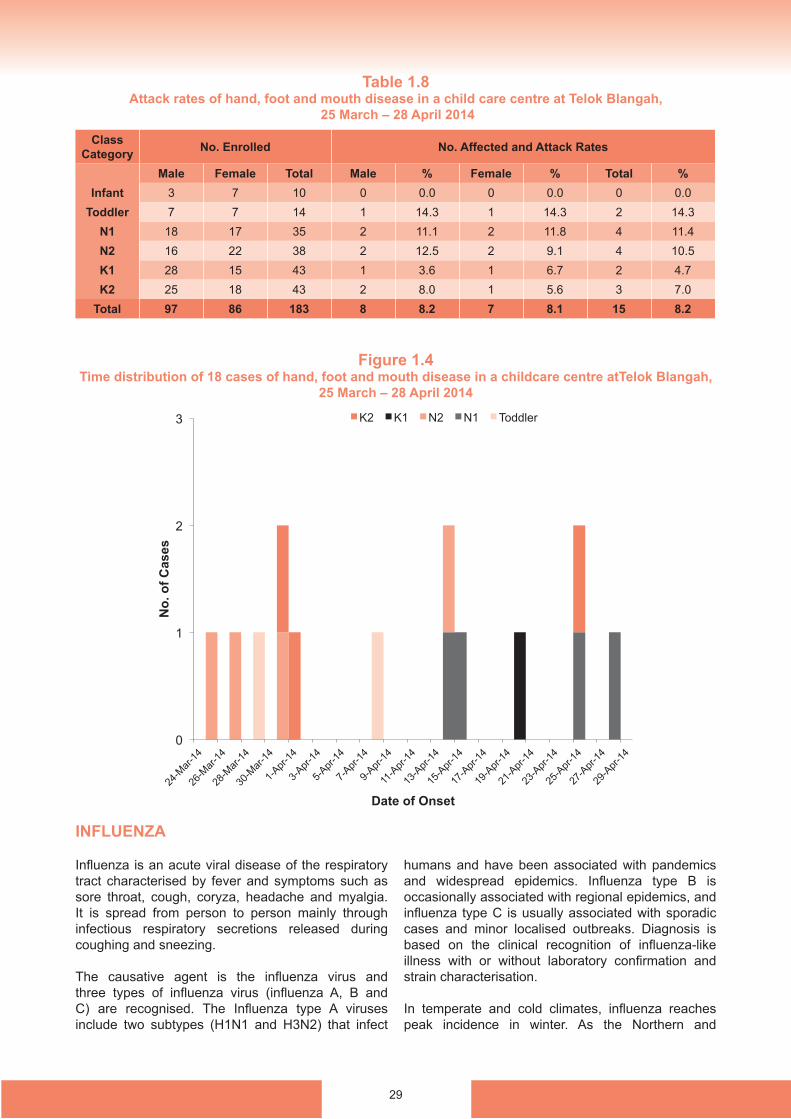
An outbreak of HFMD involving 15 children aged between 2 and 5 years occurred between 25 March and 28 April 2014 in a child care centre at Telok Blangah. At the time of the outbreak, the centre had 34 full-time staff and 183 children in six classes: Infant, Toddler (PG), Nursery 1 (N1), Nursery 2 (N2), Kindergarten 1 (K1) and Kindergarten 2 (K2).
The class-specific attack rates ranged from 4.7% to 14.3%, with an overall attack rate of 8.2% (Table 1.8).
The outbreak started with a child attending the N2 class who developed symptoms on 25 March 2014. The infection subsequently spread amongst other children. The last reported case was on 28 April 2014 (Figure 1.4).
The centre’s name was published on the Ministry of Health’s website due to the prolonged disease transmission period.
Fig 1.3Time distribution of 18 cases of hand, foot and mouth disease in a childcare centre at Punggol,
17 May 2014 - 13 Jun 2014
Class Category No. Enrolled No. Affected and Attack Rates
Male Female Total Male % Female % Total %Infant 9 5 14 0 0 1 20.0 1 7.1
Toddler 13 9 22 2 15.4 3 33.3 5 22.7N1 16 14 30 7 43.8 3 21.4 10 33.3N2 12 7 19 1 8.3 0 0.0 1 5.3K1 19 14 33 1 5.3 0 0.0 1 3.0K2 9 5 14 0 0 0 0.0 0 0.0
Total 78 54 132 11 14.1 7 13.0 18 13.6
Infant Toddler N1 N2 K1
29
INFLUENZA
Influenza is an acute viral disease of the respiratory tract characterised by fever and symptoms such as sore throat, cough, coryza, headache and myalgia. It is spread from person to person mainly through infectious respiratory secretions released during coughing and sneezing.
The causative agent is the influenza virus and three types of influenza virus (influenza A, B and C) are recognised. The Influenza type A viruses include two subtypes (H1N1 and H3N2) that infect
humans and have been associated with pandemics and widespread epidemics. Influenza type B is occasionally associated with regional epidemics, and influenza type C is usually associated with sporadic cases and minor localised outbreaks. Diagnosis is based on the clinical recognition of influenza-like illness with or without laboratory confirmation and strain characterisation.
In temperate and cold climates, influenza reaches peak incidence in winter. As the Northern and
Table 1.8Attack rates of hand, foot and mouth disease in a child care centre at Telok Blangah,
25 March – 28 April 2014
Figure 1.4Time distribution of 18 cases of hand, foot and mouth disease in a childcare centre atTelok Blangah,
25 March – 28 April 2014
Class Category No. Enrolled No. Affected and Attack Rates
Male Female Total Male % Female % Total %Infant 3 7 10 0 0.0 0 0.0 0 0.0
Toddler 7 7 14 1 14.3 1 14.3 2 14.3N1 18 17 35 2 11.1 2 11.8 4 11.4N2 16 22 38 2 12.5 2 9.1 4 10.5K1 28 15 43 1 3.6 1 6.7 2 4.7K2 25 18 43 2 8.0 1 5.6 3 7.0
Total 97 86 183 8 8.2 7 8.1 15 8.2
30
Southern Hemispheres have winter at different times of the year, there are two flu seasons each year: December-March in the Northern Hemisphere; and June-September in the Southern Hemisphere.
In tropical and subtropical areas, influenza epidemics can occur either twice a year or even throughout the year. In Singapore, influenza viruses circulate year round, with a bimodal increase in incidence observed in April–July and November–January.
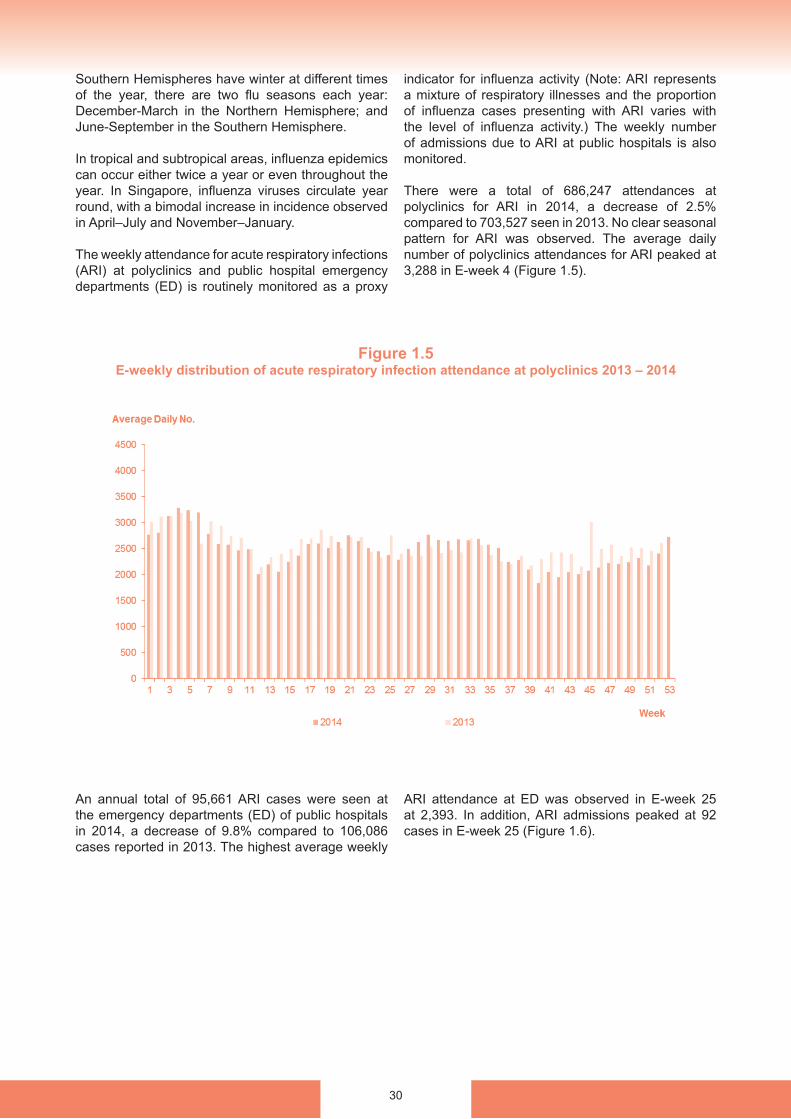
The weekly attendance for acute respiratory infections (ARI) at polyclinics and public hospital emergency departments (ED) is routinely monitored as a proxy
indicator for influenza activity (Note: ARI represents a mixture of respiratory illnesses and the proportion of influenza cases presenting with ARI varies with the level of influenza activity.) The weekly number of admissions due to ARI at public hospitals is also monitored.
There were a total of 686,247 attendances at polyclinics for ARI in 2014, a decrease of 2.5% compared to 703,527 seen in 2013. No clear seasonal pattern for ARI was observed. The average daily number of polyclinics attendances for ARI peaked at 3,288 in E-week 4 (Figure 1.5).
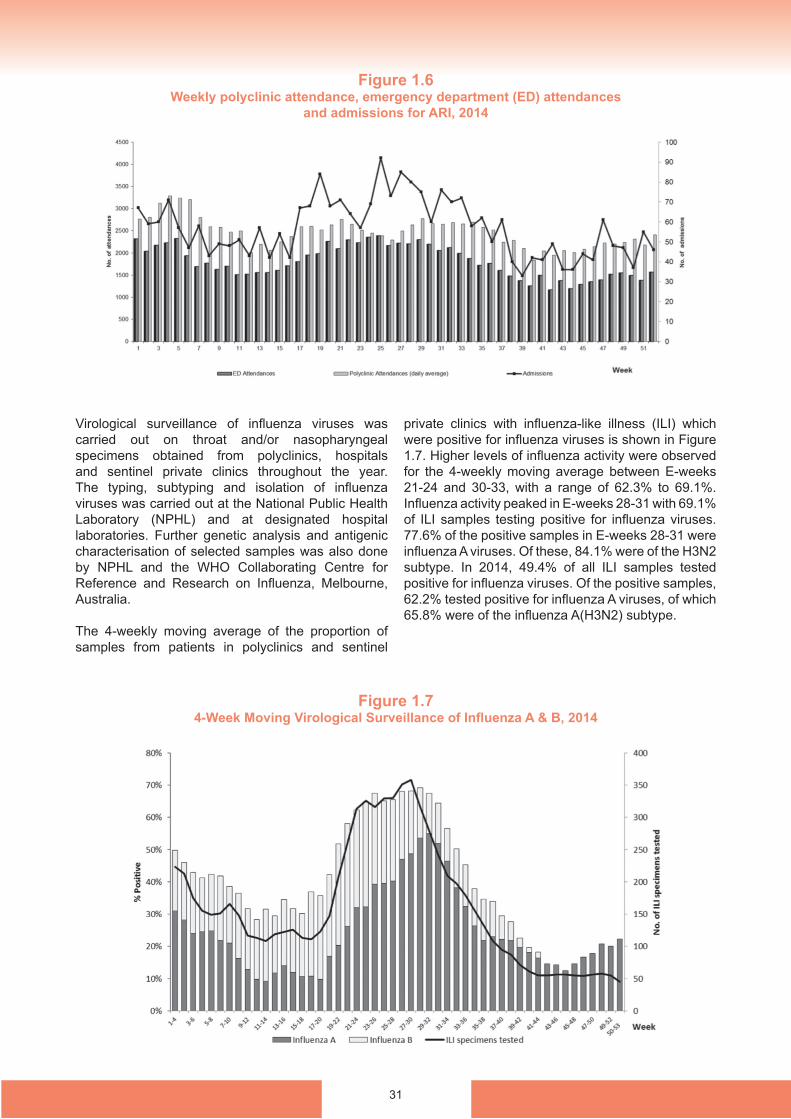
An annual total of 95,661 ARI cases were seen at the emergency departments (ED) of public hospitals in 2014, a decrease of 9.8% compared to 106,086 cases reported in 2013. The highest average weekly
ARI attendance at ED was observed in E-week 25 at 2,393. In addition, ARI admissions peaked at 92 cases in E-week 25 (Figure 1.6).
Figure 1.5E-weekly distribution of acute respiratory infection attendance at polyclinics 2013 – 2014
31
Virological surveillance of influenza viruses was carried out on throat and/or nasopharyngeal specimens obtained from polyclinics, hospitals and sentinel private clinics throughout the year. The typing, subtyping and isolation of influenza viruses was carried out at the National Public Health Laboratory (NPHL) and at designated hospital laboratories. Further genetic analysis and antigenic characterisation of selected samples was also done by NPHL and the WHO Collaborating Centre for Reference and Research on Influenza, Melbourne, Australia.
The 4-weekly moving average of the proportion of samples from patients in polyclinics and sentinel
private clinics with influenza-like illness (ILI) which were positive for influenza viruses is shown in Figure 1.7. Higher levels of influenza activity were observed for the 4-weekly moving average between E-weeks 21-24 and 30-33, with a range of 62.3% to 69.1%. Influenza activity peaked in E-weeks 28-31 with 69.1% of ILI samples testing positive for influenza viruses. 77.6% of the positive samples in E-weeks 28-31 were influenza A viruses. Of these, 84.1% were of the H3N2 subtype. In 2014, 49.4% of all ILI samples tested positive for influenza viruses. Of the positive samples, 62.2% tested positive for influenza A viruses, of which 65.8% were of the influenza A(H3N2) subtype.
Figure 1.6Weekly polyclinic attendance, emergency department (ED) attendances
and admissions for ARI, 2014
Figure 1.74-Week Moving Virological Surveillance of Influenza A & B, 2014
32
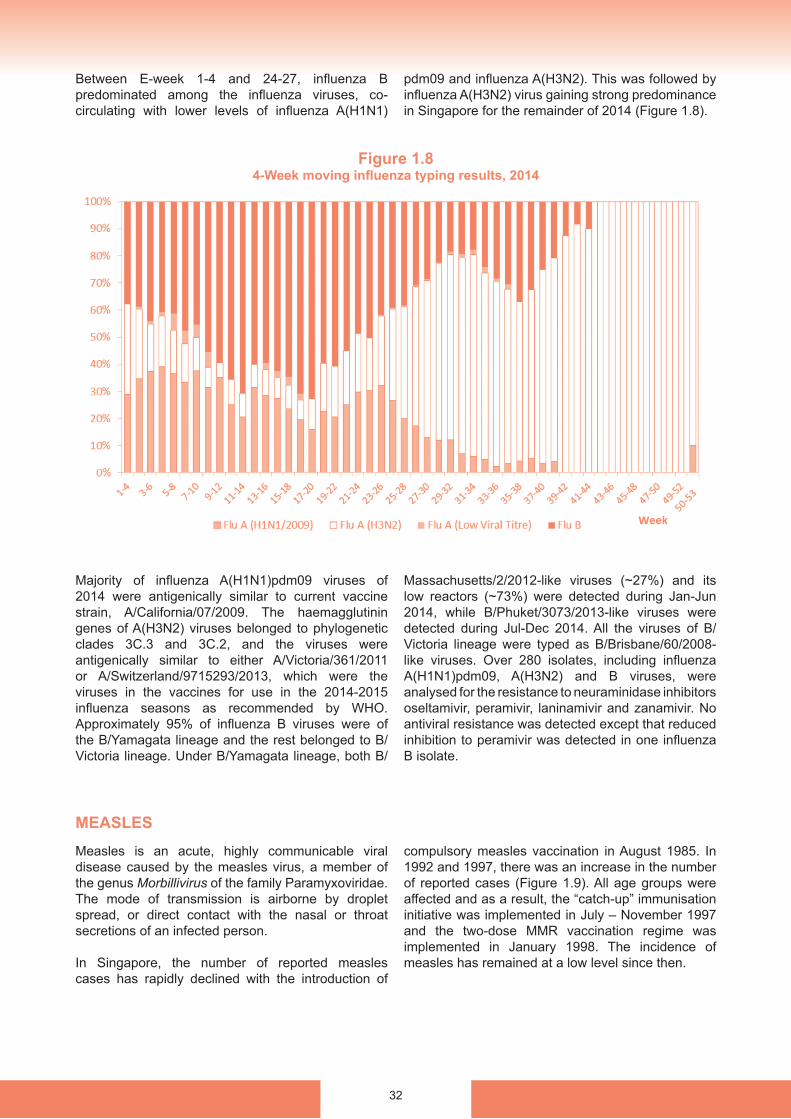
Between E-week 1-4 and 24-27, influenza B predominated among the influenza viruses, co-circulating with lower levels of influenza A(H1N1)
pdm09 and influenza A(H3N2). This was followed by influenza A(H3N2) virus gaining strong predominance in Singapore for the remainder of 2014 (Figure 1.8).
Majority of influenza A(H1N1)pdm09 viruses of 2014 were antigenically similar to current vaccine strain, A/California/07/2009. The haemagglutinin genes of A(H3N2) viruses belonged to phylogenetic clades 3C.3 and 3C.2, and the viruses were antigenically similar to either A/Victoria/361/2011 or A/Switzerland/9715293/2013, which were the viruses in the vaccines for use in the 2014-2015 influenza seasons as recommended by WHO. Approximately 95% of influenza B viruses were of the B/Yamagata lineage and the rest belonged to B/Victoria lineage. Under B/Yamagata lineage, both B/
Massachusetts/2/2012-like viruses (~27%) and its low reactors (~73%) were detected during Jan-Jun 2014, while B/Phuket/3073/2013-like viruses were detected during Jul-Dec 2014. All the viruses of B/Victoria lineage were typed as B/Brisbane/60/2008-like viruses. Over 280 isolates, including influenza A(H1N1)pdm09, A(H3N2) and B viruses, were analysed for the resistance to neuraminidase inhibitors oseltamivir, peramivir, laninamivir and zanamivir. No antiviral resistance was detected except that reduced inhibition to peramivir was detected in one influenza B isolate.
Measles is an acute, highly communicable viral disease caused by the measles virus, a member of the genus Morbillivirus of the family Paramyxoviridae. The mode of transmission is airborne by droplet spread, or direct contact with the nasal or throat secretions of an infected person.
In Singapore, the number of reported measles cases has rapidly declined with the introduction of
compulsory measles vaccination in August 1985. In 1992 and 1997, there was an increase in the number of reported cases (Figure 1.9). All age groups were affected and as a result, the “catch-up” immunisation initiative was implemented in July – November 1997 and the two-dose MMR vaccination regime was implemented in January 1998. The incidence of measles has remained at a low level since then.
Figure 1.84-Week moving influenza typing results, 2014
MEASLES
33
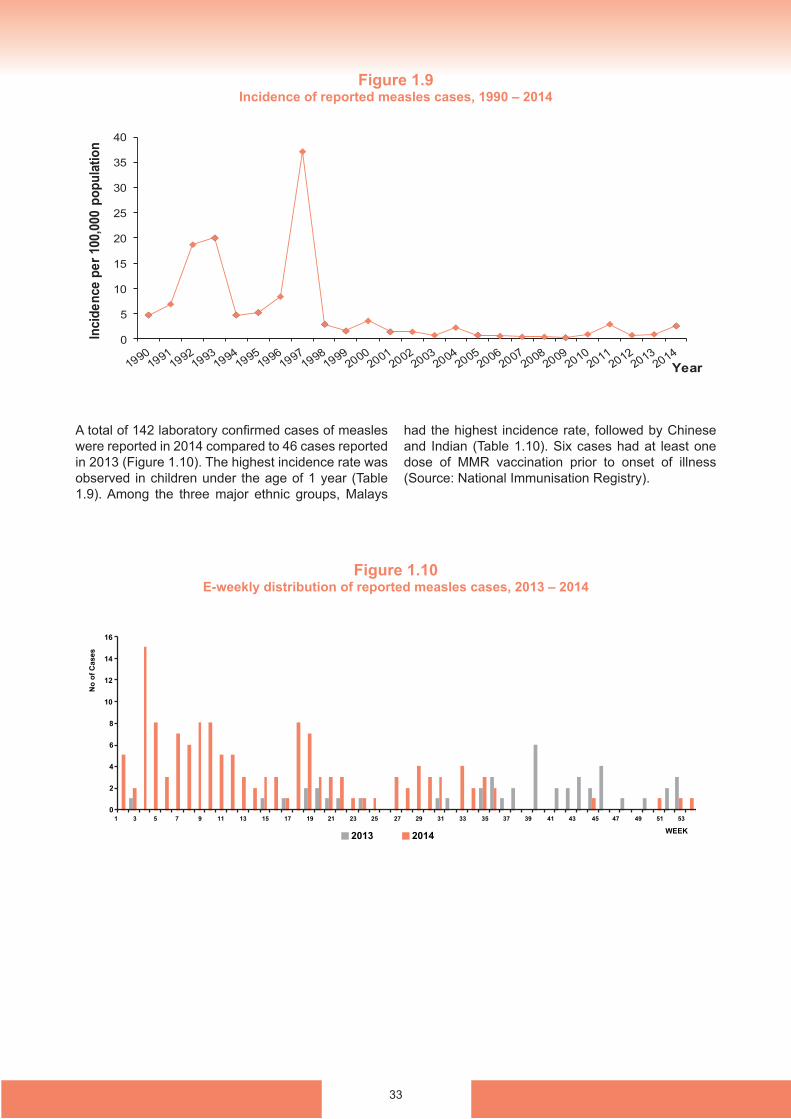
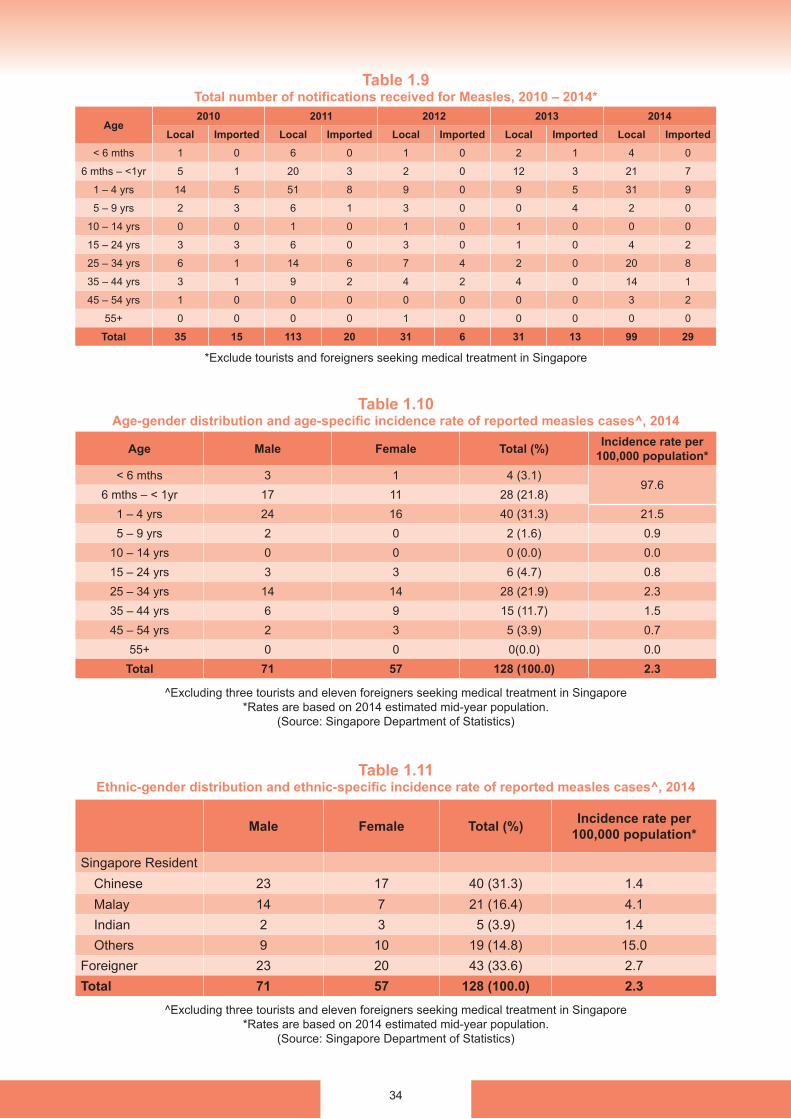
A total of 142 laboratory confirmed cases of measles were reported in 2014 compared to 46 cases reported in 2013 (Figure 1.10). The highest incidence rate was observed in children under the age of 1 year (Table 1.9). Among the three major ethnic groups, Malays
had the highest incidence rate, followed by Chinese and Indian (Table 1.10). Six cases had at least one dose of MMR vaccination prior to onset of illness (Source: National Immunisation Registry).
Figure 1.9 Incidence of reported measles cases, 1990 – 2014
Figure 1.10E-weekly distribution of reported measles cases, 2013 – 2014
34
Table 1.9Total number of notifications received for Measles, 2010 – 2014*
Table 1.10Age-gender distribution and age-specific incidence rate of reported measles cases^, 2014
Table 1.11Ethnic-gender distribution and ethnic-specific incidence rate of reported measles cases^, 2014
^Excluding three tourists and eleven foreigners seeking medical treatment in Singapore*Rates are based on 2014 estimated mid-year population.
(Source: Singapore Department of Statistics)
^Excluding three tourists and eleven foreigners seeking medical treatment in Singapore*Rates are based on 2014 estimated mid-year population.
(Source: Singapore Department of Statistics)
*Exclude tourists and foreigners seeking medical treatment in Singapore
Age2010 2011 2012 2013 2014
Local Imported Local Imported Local Imported Local Imported Local Imported< 6 mths 1 0 6 0 1 0 2 1 4 0
6 mths – <1yr 5 1 20 3 2 0 12 3 21 7
1 – 4 yrs 14 5 51 8 9 0 9 5 31 9
5 – 9 yrs 2 3 6 1 3 0 0 4 2 0
10 – 14 yrs 0 0 1 0 1 0 1 0 0 0
15 – 24 yrs 3 3 6 0 3 0 1 0 4 2
25 – 34 yrs 6 1 14 6 7 4 2 0 20 8
35 – 44 yrs 3 1 9 2 4 2 4 0 14 1
45 – 54 yrs 1 0 0 0 0 0 0 0 3 2
55+ 0 0 0 0 1 0 0 0 0 0
Total 35 15 113 20 31 6 31 13 99 29
Age Male Female Total (%) Incidence rate per 100,000 population*
< 6 mths 3 1 4 (3.1)97.6
6 mths – < 1yr 17 11 28 (21.8)1 – 4 yrs 24 16 40 (31.3) 21.5 5 – 9 yrs 2 0 2 (1.6) 0.9
10 – 14 yrs 0 0 0 (0.0) 0.0 15 – 24 yrs 3 3 6 (4.7) 0.825 – 34 yrs 14 14 28 (21.9) 2.3 35 – 44 yrs 6 9 15 (11.7) 1.5 45 – 54 yrs 2 3 5 (3.9) 0.7
55+ 0 0 0(0.0) 0.0 Total 71 57 128 (100.0) 2.3
Male Female Total (%) Incidence rate per 100,000 population*
Singapore ResidentChinese 23 17 40 (31.3) 1.4Malay 14 7 21 (16.4) 4.1Indian 2 3 5 (3.9) 1.4Others 9 10 19 (14.8) 15.0
Foreigner 23 20 43 (33.6) 2.7Total 71 57 128 (100.0) 2.3
35
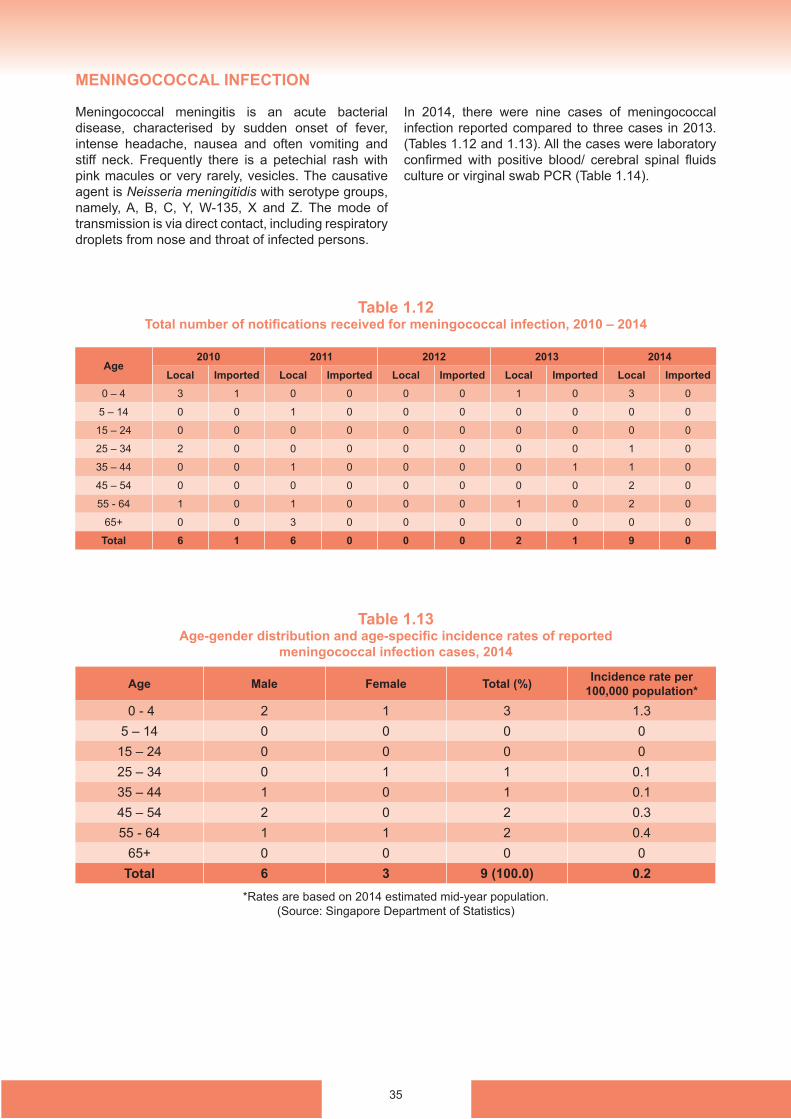
Table 1.12Total number of notifications received for meningococcal infection, 2010 – 2014
Table 1.13Age-gender distribution and age-specific incidence rates of reported
meningococcal infection cases, 2014
*Rates are based on 2014 estimated mid-year population.(Source: Singapore Department of Statistics)
Age2010 2011 2012 2013 2014
Local Imported Local Imported Local Imported Local Imported Local Imported0 – 4 3 1 0 0 0 0 1 0 3 0
5 – 14 0 0 1 0 0 0 0 0 0 0
15 – 24 0 0 0 0 0 0 0 0 0 0
25 – 34 2 0 0 0 0 0 0 0 1 0
35 – 44 0 0 1 0 0 0 0 1 1 0
45 – 54 0 0 0 0 0 0 0 0 2 0
55 - 64 1 0 1 0 0 0 1 0 2 0
65+ 0 0 3 0 0 0 0 0 0 0
Total 6 1 6 0 0 0 2 1 9 0
Age Male Female Total (%) Incidence rate per 100,000 population*
0 - 4 2 1 3 1.35 – 14 0 0 0 015 – 24 0 0 0 025 – 34 0 1 1 0.135 – 44 1 0 1 0.145 – 54 2 0 2 0.355 - 64 1 1 2 0.4
65+ 0 0 0 0Total 6 3 9 (100.0) 0.2
Meningococcal meningitis is an acute bacterial disease, characterised by sudden onset of fever, intense headache, nausea and often vomiting and stiff neck. Frequently there is a petechial rash with pink macules or very rarely, vesicles. The causative agent is Neisseria meningitidis with serotype groups, namely, A, B, C, Y, W-135, X and Z. The mode of transmission is via direct contact, including respiratory droplets from nose and throat of infected persons.
In 2014, there were nine cases of meningococcal infection reported compared to three cases in 2013. (Tables 1.12 and 1.13). All the cases were laboratory confirmed with positive blood/ cerebral spinal fluids culture or virginal swab PCR (Table 1.14).
MENINGOCOCCAL INFECTION
36
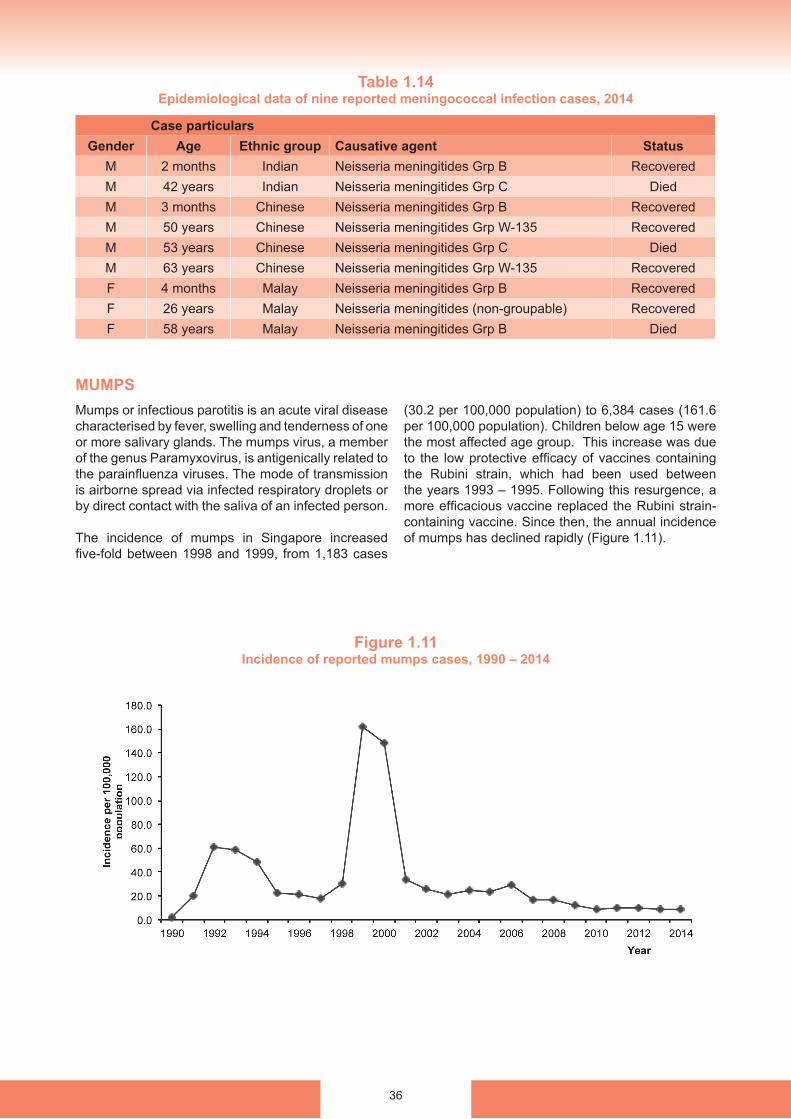
Table 1.14Epidemiological data of nine reported meningococcal infection cases, 2014
Figure 1.11Incidence of reported mumps cases, 1990 – 2014
Mumps or infectious parotitis is an acute viral disease characterised by fever, swelling and tenderness of one or more salivary glands. The mumps virus, a member of the genus Paramyxovirus, is antigenically related to the parainfluenza viruses. The mode of transmission is airborne spread via infected respiratory droplets or by direct contact with the saliva of an infected person.
The incidence of mumps in Singapore increased five-fold between 1998 and 1999, from 1,183 cases
(30.2 per 100,000 population) to 6,384 cases (161.6 per 100,000 population). Children below age 15 were the most affected age group. This increase was due to the low protective efficacy of vaccines containing the Rubini strain, which had been used between the years 1993 – 1995. Following this resurgence, a more efficacious vaccine replaced the Rubini strain-containing vaccine. Since then, the annual incidence of mumps has declined rapidly (Figure 1.11).
Case particularsGender Age Ethnic group Causative agent Status
M 2 months Indian Neisseria meningitides Grp B RecoveredM 42 years Indian Neisseria meningitides Grp C DiedM 3 months Chinese Neisseria meningitides Grp B RecoveredM 50 years Chinese Neisseria meningitides Grp W-135 RecoveredM 53 years Chinese Neisseria meningitides Grp C DiedM 63 years Chinese Neisseria meningitides Grp W-135 RecoveredF 4 months Malay Neisseria meningitides Grp B RecoveredF 26 years Malay Neisseria meningitides (non-groupable) RecoveredF 58 years Malay Neisseria meningitides Grp B Died
MUMPS
37
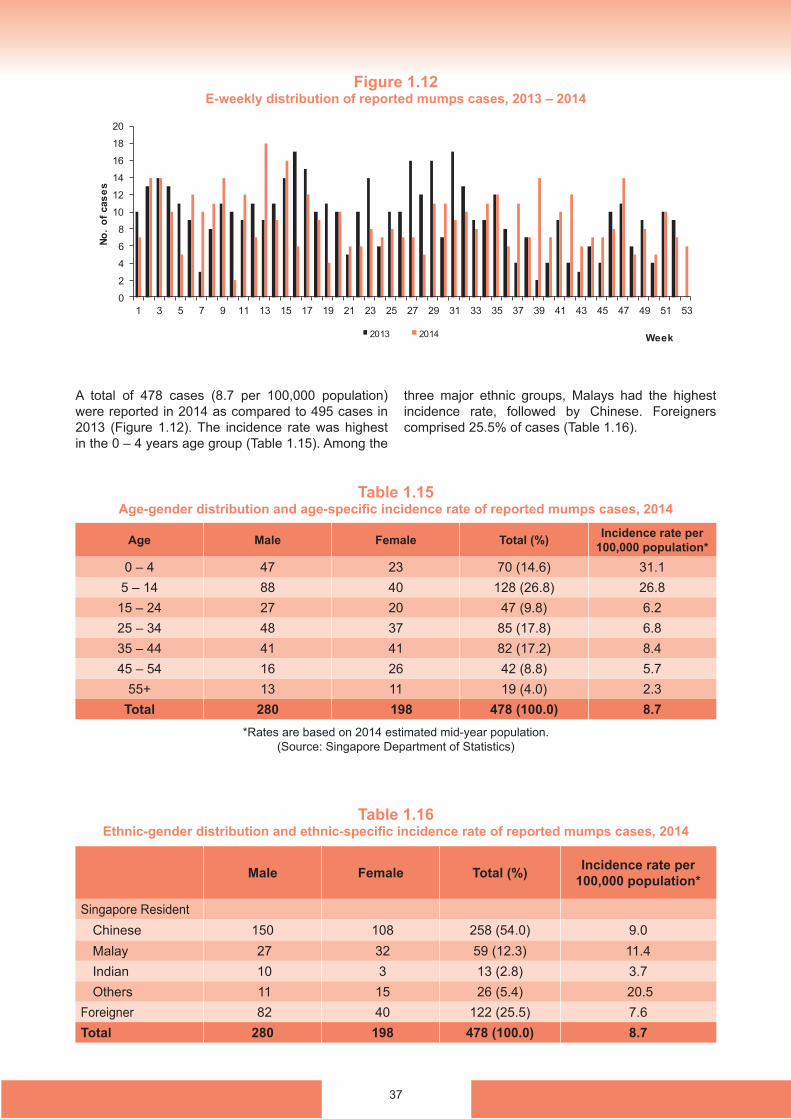
Figure 1.12E-weekly distribution of reported mumps cases, 2013 – 2014
Table 1.15Age-gender distribution and age-specific incidence rate of reported mumps cases, 2014
Table 1.16Ethnic-gender distribution and ethnic-specific incidence rate of reported mumps cases, 2014
A total of 478 cases (8.7 per 100,000 population) were reported in 2014 as compared to 495 cases in 2013 (Figure 1.12). The incidence rate was highest in the 0 – 4 years age group (Table 1.15). Among the
three major ethnic groups, Malays had the highest incidence rate, followed by Chinese. Foreigners comprised 25.5% of cases (Table 1.16).
*Rates are based on 2014 estimated mid-year population. (Source: Singapore Department of Statistics)
Age Male Female Total (%) Incidence rate per 100,000 population*
0 – 4 47 23 70 (14.6) 31.15 – 14 88 40 128 (26.8) 26.815 – 24 27 20 47 (9.8) 6.225 – 34 48 37 85 (17.8) 6.835 – 44 41 41 82 (17.2) 8.445 – 54 16 26 42 (8.8) 5.7
55+ 13 11 19 (4.0) 2.3Total 280 198 478 (100.0) 8.7
Male Female Total (%) Incidence rate per 100,000 population*
Singapore ResidentChinese 150 108 258 (54.0) 9.0Malay 27 32 59 (12.3) 11.4Indian 10 3 13 (2.8) 3.7Others 11 15 26 (5.4) 20.5
Foreigner 82 40 122 (25.5) 7.6Total 280 198 478 (100.0) 8.7
38
Pertussis is an acute bacterial infection of the respiratory tract caused by Bordetella pertussis. The mode of transmission is via respiratory droplets or direct contact with the nasal or throat secretions of an infected person.
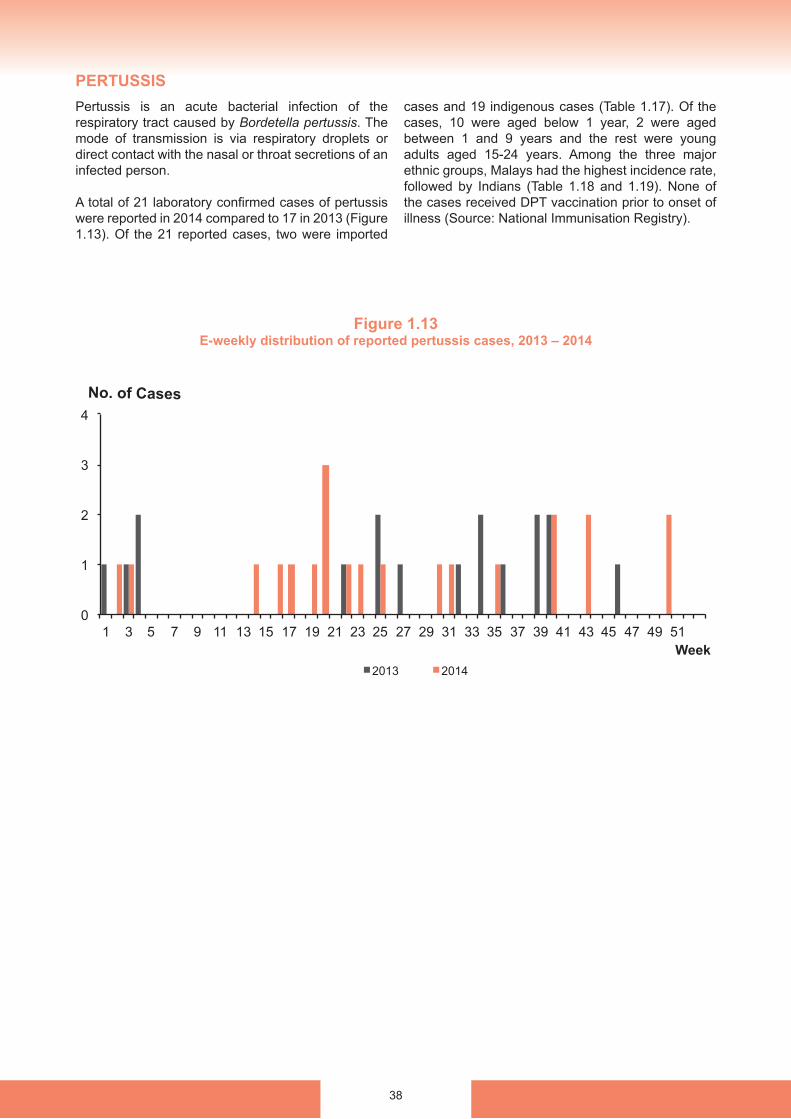
A total of 21 laboratory confirmed cases of pertussis were reported in 2014 compared to 17 in 2013 (Figure 1.13). Of the 21 reported cases, two were imported
cases and 19 indigenous cases (Table 1.17). Of the cases, 10 were aged below 1 year, 2 were aged between 1 and 9 years and the rest were young adults aged 15-24 years. Among the three major ethnic groups, Malays had the highest incidence rate, followed by Indians (Table 1.18 and 1.19). None of the cases received DPT vaccination prior to onset of illness (Source: National Immunisation Registry).
Figure 1.13E-weekly distribution of reported pertussis cases, 2013 – 2014
PERTUSSIS
39
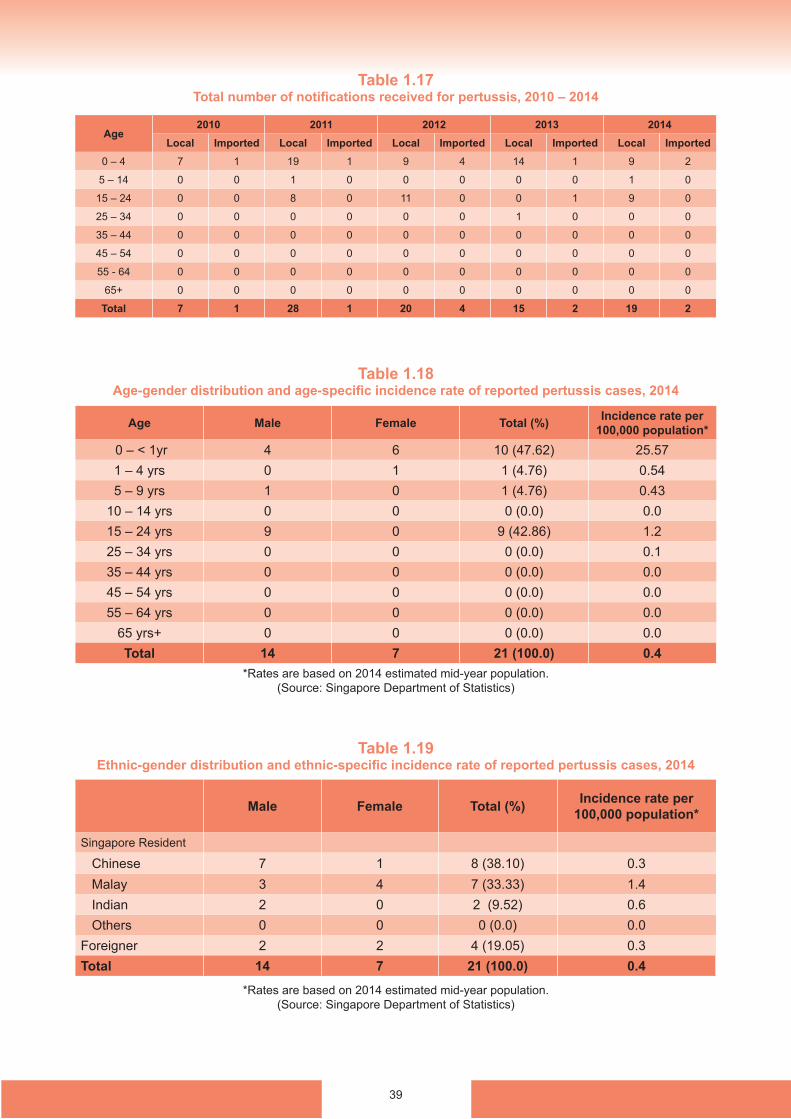
Table 1.17Total number of notifications received for pertussis, 2010 – 2014
Table 1.18Age-gender distribution and age-specific incidence rate of reported pertussis cases, 2014
Table 1.19Ethnic-gender distribution and ethnic-specific incidence rate of reported pertussis cases, 2014
Age2010 2011 2012 2013 2014
Local Imported Local Imported Local Imported Local Imported Local Imported0 – 4 7 1 19 1 9 4 14 1 9 2
5 – 14 0 0 1 0 0 0 0 0 1 0
15 – 24 0 0 8 0 11 0 0 1 9 0
25 – 34 0 0 0 0 0 0 1 0 0 0
35 – 44 0 0 0 0 0 0 0 0 0 0
45 – 54 0 0 0 0 0 0 0 0 0 0
55 - 64 0 0 0 0 0 0 0 0 0 0
65+ 0 0 0 0 0 0 0 0 0 0
Total 7 1 28 1 20 4 15 2 19 2
Age Male Female Total (%) Incidence rate per 100,000 population*
0 – < 1yr 4 6 10 (47.62) 25.571 – 4 yrs 0 1 1 (4.76) 0.545 – 9 yrs 1 0 1 (4.76) 0.43
10 – 14 yrs 0 0 0 (0.0) 0.015 – 24 yrs 9 0 9 (42.86) 1.225 – 34 yrs 0 0 0 (0.0) 0.135 – 44 yrs 0 0 0 (0.0) 0.045 – 54 yrs 0 0 0 (0.0) 0.055 – 64 yrs 0 0 0 (0.0) 0.0
65 yrs+ 0 0 0 (0.0) 0.0Total 14 7 21 (100.0) 0.4
*Rates are based on 2014 estimated mid-year population.(Source: Singapore Department of Statistics)
*Rates are based on 2014 estimated mid-year population.(Source: Singapore Department of Statistics)
Male Female Total (%) Incidence rate per 100,000 population*
Singapore Resident
Chinese 7 1 8 (38.10) 0.3 Malay 3 4 7 (33.33) 1.4 Indian 2 0 2 (9.52) 0.6 Others 0 0 0 (0.0) 0.0Foreigner 2 2 4 (19.05) 0.3Total 14 7 21 (100.0) 0.4
40
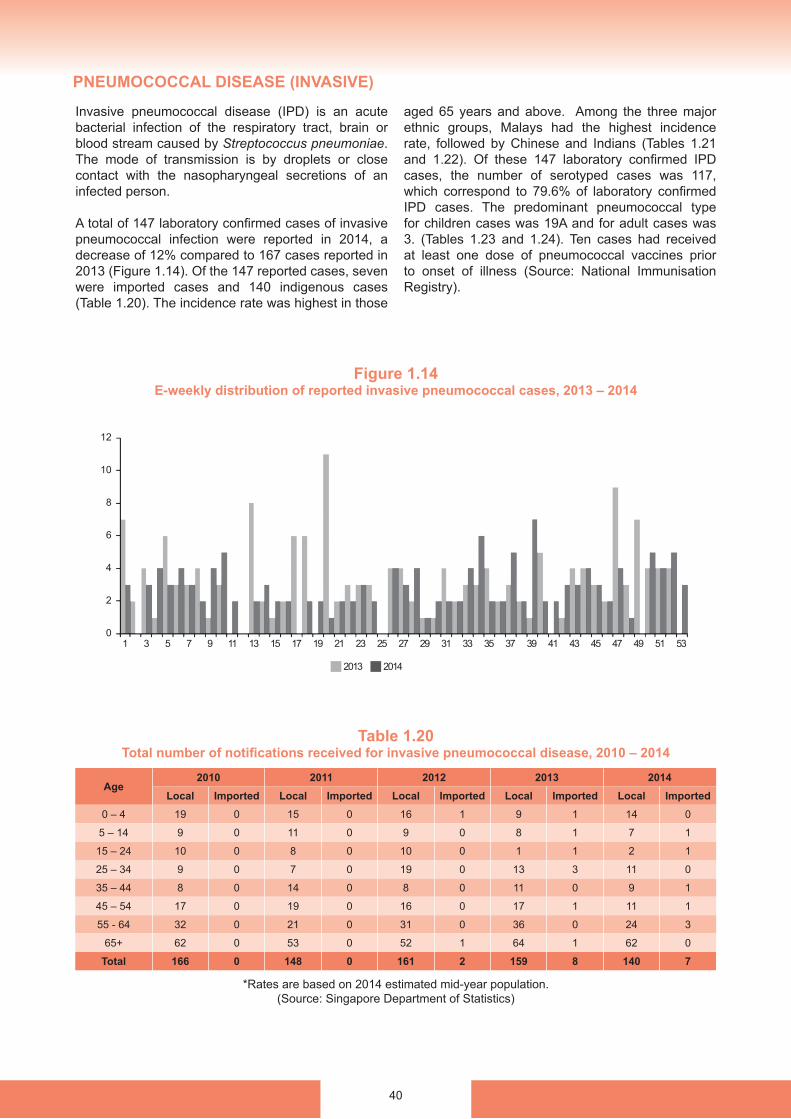
Invasive pneumococcal disease (IPD) is an acute bacterial infection of the respiratory tract, brain or blood stream caused by Streptococcus pneumoniae. The mode of transmission is by droplets or close contact with the nasopharyngeal secretions of an infected person.
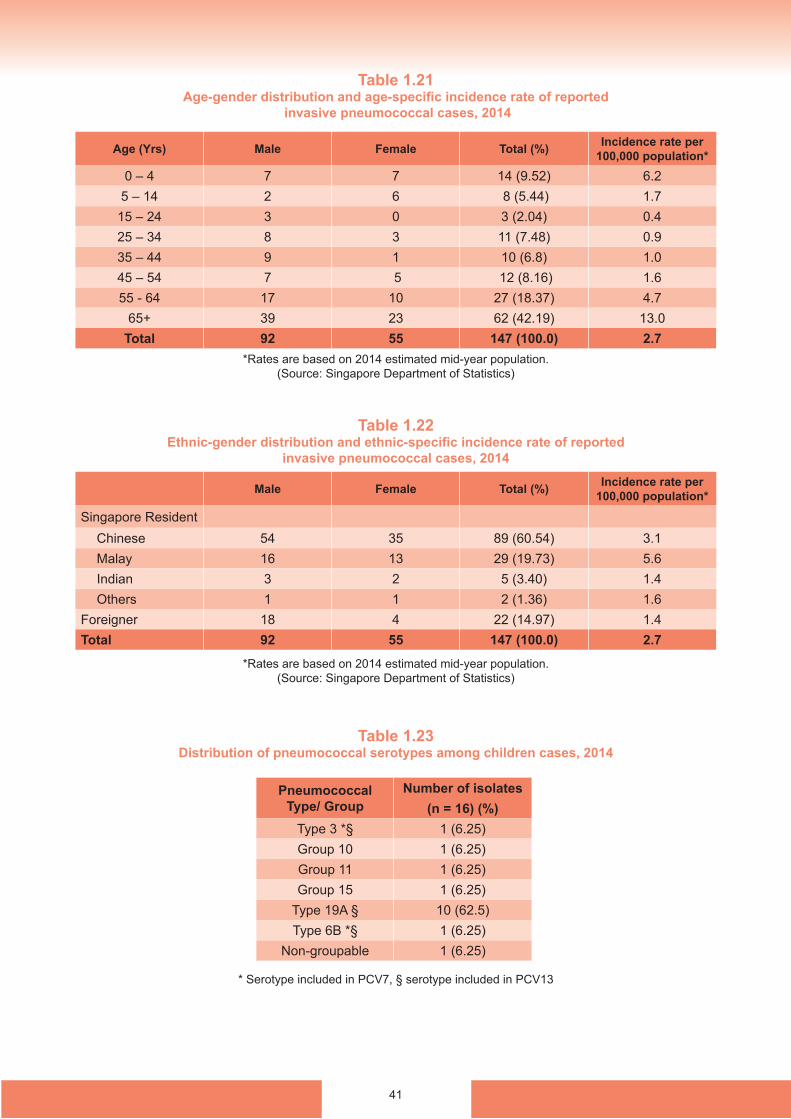
A total of 147 laboratory confirmed cases of invasive pneumococcal infection were reported in 2014, a decrease of 12% compared to 167 cases reported in 2013 (Figure 1.14). Of the 147 reported cases, seven were imported cases and 140 indigenous cases (Table 1.20). The incidence rate was highest in those
aged 65 years and above. Among the three major ethnic groups, Malays had the highest incidence rate, followed by Chinese and Indians (Tables 1.21 and 1.22). Of these 147 laboratory confirmed IPD cases, the number of serotyped cases was 117, which correspond to 79.6% of laboratory confirmed IPD cases. The predominant pneumococcal type for children cases was 19A and for adult cases was 3. (Tables 1.23 and 1.24). Ten cases had received at least one dose of pneumococcal vaccines prior to onset of illness (Source: National Immunisation Registry).
Figure 1.14E-weekly distribution of reported invasive pneumococcal cases, 2013 – 2014
Table 1.20Total number of notifications received for invasive pneumococcal disease, 2010 – 2014
Age2010 2011 2012 2013 2014
Local Imported Local Imported Local Imported Local Imported Local Imported0 – 4 19 0 15 0 16 1 9 1 14 0
5 – 14 9 0 11 0 9 0 8 1 7 1
15 – 24 10 0 8 0 10 0 1 1 2 1
25 – 34 9 0 7 0 19 0 13 3 11 0
35 – 44 8 0 14 0 8 0 11 0 9 1
45 – 54 17 0 19 0 16 0 17 1 11 1
55 - 64 32 0 21 0 31 0 36 0 24 3
65+ 62 0 53 0 52 1 64 1 62 0
Total 166 0 148 0 161 2 159 8 140 7
*Rates are based on 2014 estimated mid-year population.(Source: Singapore Department of Statistics)
12
10
8
6
4
2
01 3 5 7 9 11 13 15 17 19 21
2013 2014
23 25 27 29 31 33 35 37 39 41 43 45 47 49 51 53
PNEUMOCOCCAL DISEASE (INVASIVE)
41
Table 1.21Age-gender distribution and age-specific incidence rate of reported
invasive pneumococcal cases, 2014
Table 1.22Ethnic-gender distribution and ethnic-specific incidence rate of reported
invasive pneumococcal cases, 2014
Table 1.23Distribution of pneumococcal serotypes among children cases, 2014
Age (Yrs) Male Female Total (%) Incidence rate per 100,000 population*
0 – 4 7 7 14 (9.52) 6.25 – 14 2 6 8 (5.44) 1.715 – 24 3 0 3 (2.04) 0.425 – 34 8 3 11 (7.48) 0.935 – 44 9 1 10 (6.8) 1.045 – 54 7 5 12 (8.16) 1.655 - 64 17 10 27 (18.37) 4.7
65+ 39 23 62 (42.19) 13.0Total 92 55 147 (100.0) 2.7
Male Female Total (%) Incidence rate per 100,000 population*
Singapore ResidentChinese 54 35 89 (60.54) 3.1Malay 16 13 29 (19.73) 5.6Indian 3 2 5 (3.40) 1.4Others 1 1 2 (1.36) 1.6
Foreigner 18 4 22 (14.97) 1.4Total 92 55 147 (100.0) 2.7
*Rates are based on 2014 estimated mid-year population.(Source: Singapore Department of Statistics)
*Rates are based on 2014 estimated mid-year population.(Source: Singapore Department of Statistics)
* Serotype included in PCV7, § serotype included in PCV13
Pneumococcal Type/ Group
Number of isolates(n = 16) (%)
Type 3 *§ 1 (6.25)Group 10 1 (6.25)Group 11 1 (6.25)Group 15 1 (6.25)
Type 19A § 10 (62.5)Type 6B *§ 1 (6.25)
Non-groupable 1 (6.25)

42
* Serotype included in PCV7, § serotype included in PCV13
Pneumococcal Type/ Group
Number of isolates(n = 101) (%)
Type 1 *§ 2 (1.98) Type 2 1 (0.99)
Type 3 *§ 15 (14.85) Type 4 *§ 5 (4.95) Type 5 § 1 (0.99) Type 8 5 (4.95)
Group 11 6 (5.94) Group 12 1 (0.99)
Type 14 *§ 8 (7.92) Group 17 1 (0.99) Type 20 4 (3.96)
Group 33 1 (0.99) Type 15A 2 (1.98) Type 15B 2 (1.98) Type 15C 1 (0.99) Type 15F 1 (0.99)
Type 18C *§ 1 (0.99) Type 19A § 7 (6.93) Type 19F *§ 2 (1.98)
Type 22F 1 (0.99) Type 23A 4 (3.96)
Type 23F *§ 6 (5.94) Type 6A § 4 (3.96) Type 6B *§ 4 (3.96)
Type 6C 2 (1.98)Type 7F § 1 (0.99)Type 9V *§ 3 (2.97)Group 18 1 (0.99)
Non-groupable 9 (8.92)
Table 1.24Distribution of pneumococcal serotypes among adult cases, 2014
43
Figure 1.15Incidence of reported rubella cases, 1991 – 2014
Figure 1.16 E-weekly distribution of reported rubella cases, 2013 – 2014
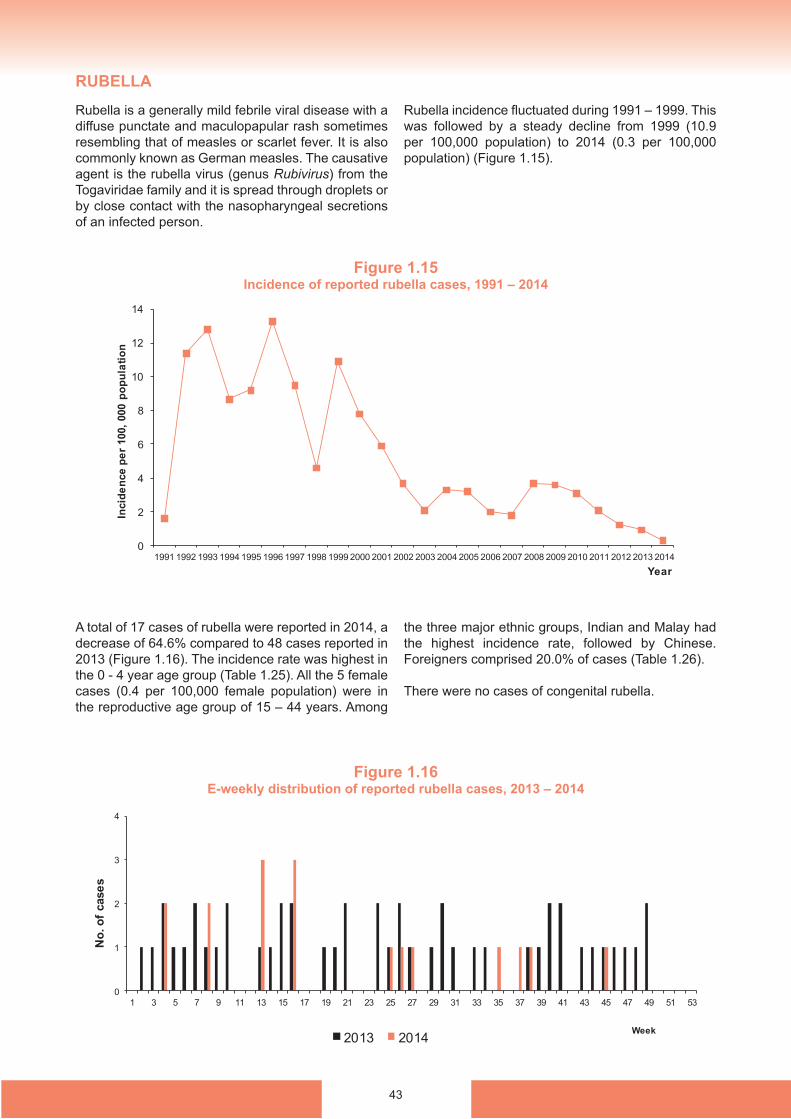
Rubella is a generally mild febrile viral disease with a diffuse punctate and maculopapular rash sometimes resembling that of measles or scarlet fever. It is also commonly known as German measles. The causative agent is the rubella virus (genus Rubivirus) from the Togaviridae family and it is spread through droplets or by close contact with the nasopharyngeal secretions of an infected person.
Rubella incidence fluctuated during 1991 – 1999. This was followed by a steady decline from 1999 (10.9 per 100,000 population) to 2014 (0.3 per 100,000 population) (Figure 1.15).
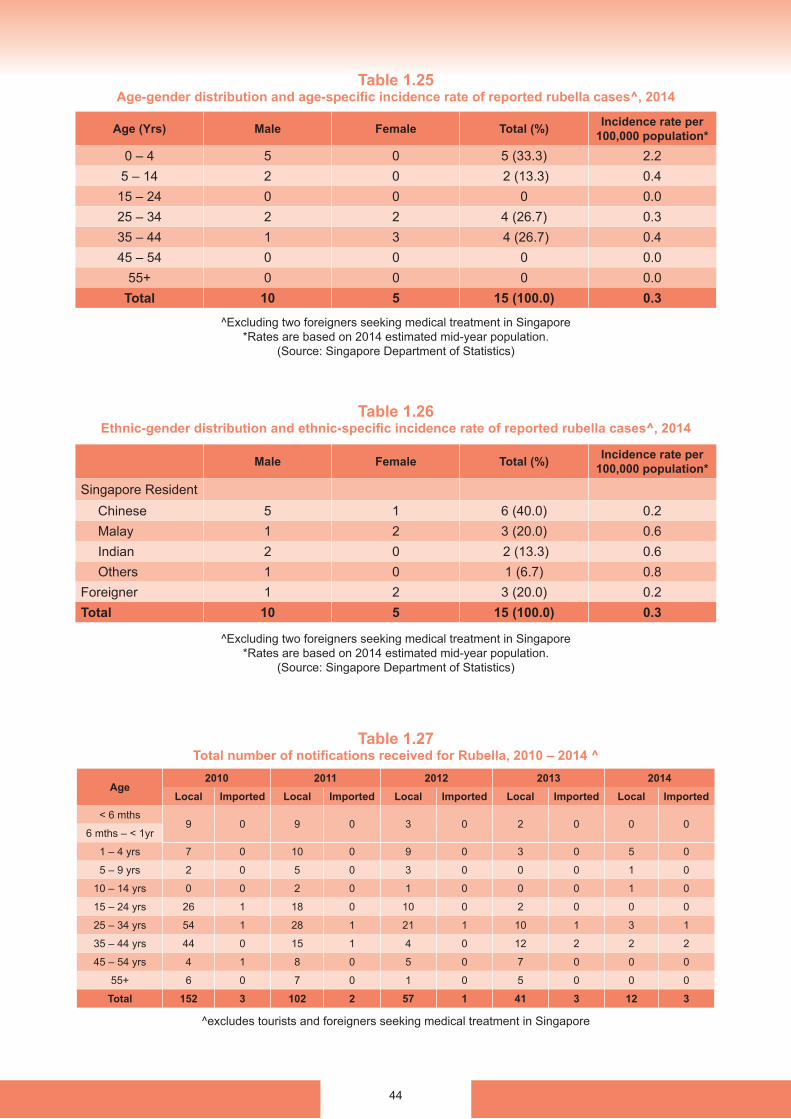
A total of 17 cases of rubella were reported in 2014, a decrease of 64.6% compared to 48 cases reported in 2013 (Figure 1.16). The incidence rate was highest in the 0 - 4 year age group (Table 1.25). All the 5 female cases (0.4 per 100,000 female population) were in the reproductive age group of 15 – 44 years. Among
the three major ethnic groups, Indian and Malay had the highest incidence rate, followed by Chinese. Foreigners comprised 20.0% of cases (Table 1.26).
There were no cases of congenital rubella.
RUBELLA
44
Table 1.25Age-gender distribution and age-specific incidence rate of reported rubella cases^, 2014
Table 1.26Ethnic-gender distribution and ethnic-specific incidence rate of reported rubella cases^, 2014
Table 1.27Total number of notifications received for Rubella, 2010 – 2014 ^
^Excluding two foreigners seeking medical treatment in Singapore*Rates are based on 2014 estimated mid-year population.
(Source: Singapore Department of Statistics)
^Excluding two foreigners seeking medical treatment in Singapore*Rates are based on 2014 estimated mid-year population.
(Source: Singapore Department of Statistics)
Age (Yrs) Male Female Total (%) Incidence rate per 100,000 population*
0 – 4 5 0 5 (33.3) 2.25 – 14 2 0 2 (13.3) 0.415 – 24 0 0 0 0.025 – 34 2 2 4 (26.7) 0.335 – 44 1 3 4 (26.7) 0.445 – 54 0 0 0 0.0
55+ 0 0 0 0.0Total 10 5 15 (100.0) 0.3
Male Female Total (%) Incidence rate per 100,000 population*
Singapore ResidentChinese 5 1 6 (40.0) 0.2Malay 1 2 3 (20.0) 0.6Indian 2 0 2 (13.3) 0.6Others 1 0 1 (6.7) 0.8
Foreigner 1 2 3 (20.0) 0.2Total 10 5 15 (100.0) 0.3
Age2010 2011 2012 2013 2014
Local Imported Local Imported Local Imported Local Imported Local Imported< 6 mths
9 0 9 0 3 0 2 0 0 06 mths – < 1yr
1 – 4 yrs 7 0 10 0 9 0 3 0 5 0
5 – 9 yrs 2 0 5 0 3 0 0 0 1 0
10 – 14 yrs 0 0 2 0 1 0 0 0 1 0
15 – 24 yrs 26 1 18 0 10 0 2 0 0 0
25 – 34 yrs 54 1 28 1 21 1 10 1 3 1
35 – 44 yrs 44 0 15 1 4 0 12 2 2 2
45 – 54 yrs 4 1 8 0 5 0 7 0 0 0
55+ 6 0 7 0 1 0 5 0 0 0
Total 152 3 102 2 57 1 41 3 12 3
^excludes tourists and foreigners seeking medical treatment in Singapore
45
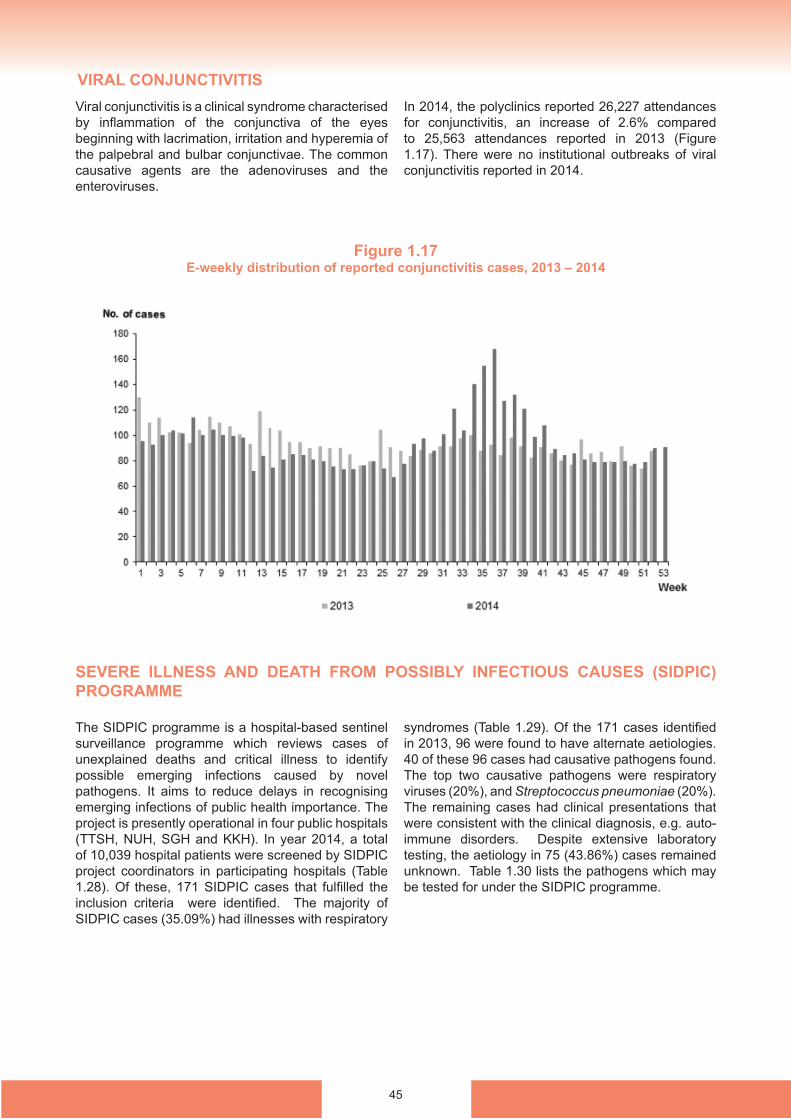
Viral conjunctivitis is a clinical syndrome characterised by inflammation of the conjunctiva of the eyes beginning with lacrimation, irritation and hyperemia of the palpebral and bulbar conjunctivae. The common causative agents are the adenoviruses and the enteroviruses.
In 2014, the polyclinics reported 26,227 attendances for conjunctivitis, an increase of 2.6% compared to 25,563 attendances reported in 2013 (Figure 1.17). There were no institutional outbreaks of viral conjunctivitis reported in 2014.
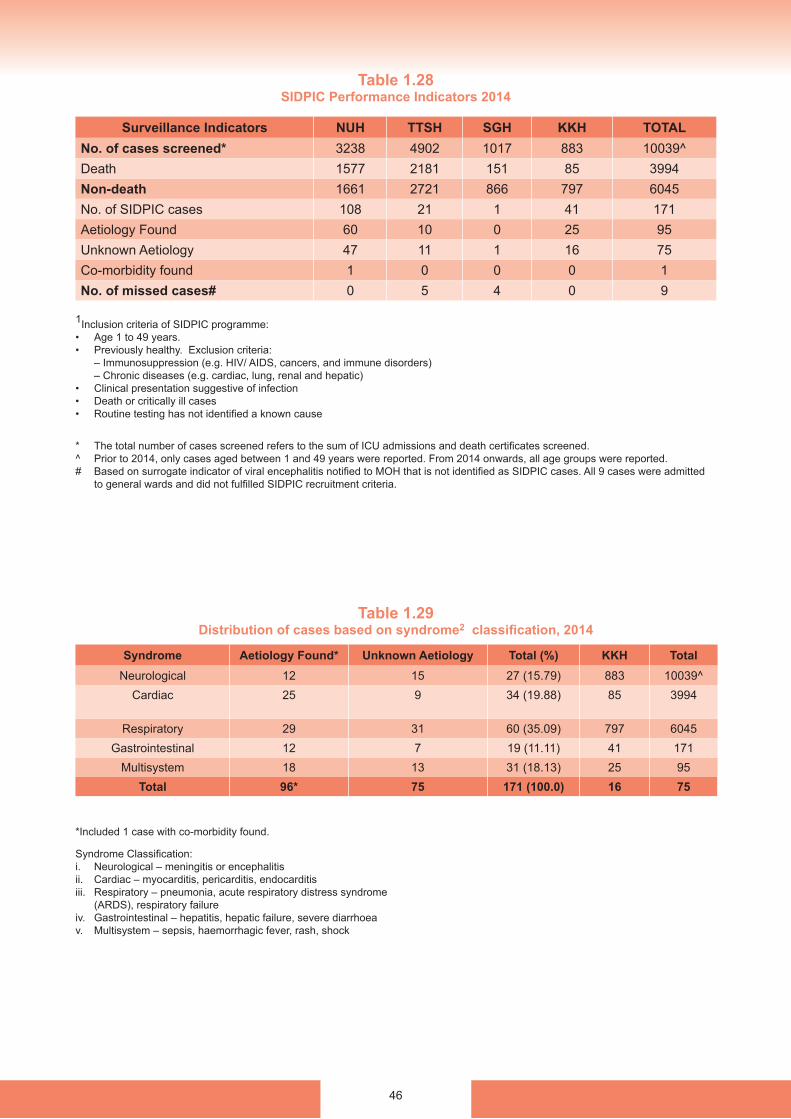
The SIDPIC programme is a hospital-based sentinel surveillance programme which reviews cases of unexplained deaths and critical illness to identify possible emerging infections caused by novel pathogens. It aims to reduce delays in recognising emerging infections of public health importance. The project is presently operational in four public hospitals (TTSH, NUH, SGH and KKH). In year 2014, a total of 10,039 hospital patients were screened by SIDPIC project coordinators in participating hospitals (Table 1.28). Of these, 171 SIDPIC cases that fulfilled the inclusion criteria were identified. The majority of SIDPIC cases (35.09%) had illnesses with respiratory
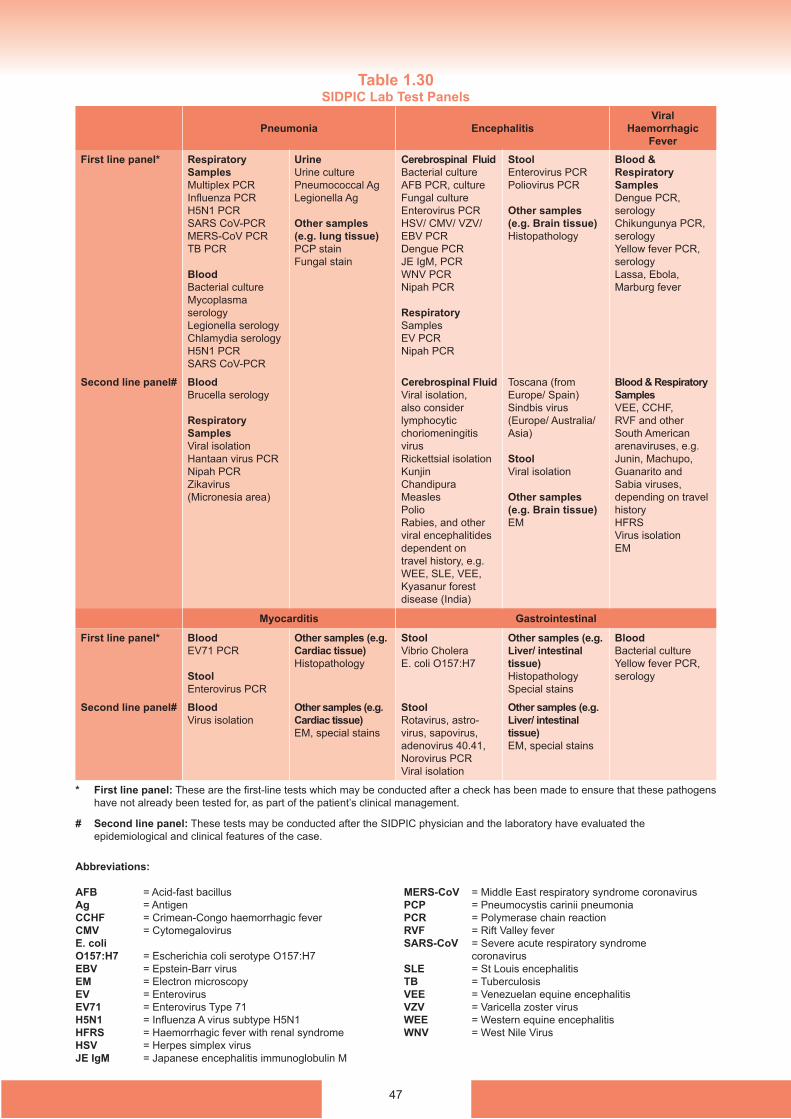
syndromes (Table 1.29). Of the 171 cases identified in 2013, 96 were found to have alternate aetiologies. 40 of these 96 cases had causative pathogens found. The top two causative pathogens were respiratory viruses (20%), and Streptococcus pneumoniae (20%). The remaining cases had clinical presentations that were consistent with the clinical diagnosis, e.g. auto-immune disorders. Despite extensive laboratory testing, the aetiology in 75 (43.86%) cases remained unknown. Table 1.30 lists the pathogens which may be tested for under the SIDPIC programme.
Figure 1.17E-weekly distribution of reported conjunctivitis cases, 2013 – 2014
VIRAL CONJUNCTIVITIS
SEVERE ILLNESS AND DEATH FROM POSSIBLY INFECTIOUS CAUSES (SIDPIC) PROGRAMME
46
Table 1.28 SIDPIC Performance Indicators 2014
Table 1.29 Distribution of cases based on syndrome2 classification, 2014
Surveillance Indicators NUH TTSH SGH KKH TOTALNo. of cases screened* 3238 4902 1017 883 10039^Death 1577 2181 151 85 3994Non-death 1661 2721 866 797 6045No. of SIDPIC cases 108 21 1 41 171Aetiology Found 60 10 0 25 95Unknown Aetiology 47 11 1 16 75Co-morbidity found 1 0 0 0 1No. of missed cases# 0 5 4 0 9
Syndrome Aetiology Found* Unknown Aetiology Total (%) KKH TotalNeurological 12 15 27 (15.79) 883 10039^
Cardiac 25 9 34 (19.88) 85 3994
Respiratory 29 31 60 (35.09) 797 6045Gastrointestinal 12 7 19 (11.11) 41 171
Multisystem 18 13 31 (18.13) 25 95Total 96* 75 171 (100.0) 16 75
1Inclusion criteria of SIDPIC programme:• Age 1 to 49 years. • Previously healthy. Exclusion criteria: – Immunosuppression (e.g. HIV/ AIDS, cancers, and immune disorders) – Chronic diseases (e.g. cardiac, lung, renal and hepatic)• Clinical presentation suggestive of infection• Death or critically ill cases• Routine testing has not identified a known cause
* The total number of cases screened refers to the sum of ICU admissions and death certificates screened. ^ Prior to 2014, only cases aged between 1 and 49 years were reported. From 2014 onwards, all age groups were reported.# Based on surrogate indicator of viral encephalitis notified to MOH that is not identified as SIDPIC cases. All 9 cases were admitted
to general wards and did not fulfilled SIDPIC recruitment criteria.
Syndrome Classification:i. Neurological – meningitis or encephalitisii. Cardiac – myocarditis, pericarditis, endocarditisiii. Respiratory – pneumonia, acute respiratory distress syndrome
(ARDS), respiratory failureiv. Gastrointestinal – hepatitis, hepatic failure, severe diarrhoeav. Multisystem – sepsis, haemorrhagic fever, rash, shock
*Included 1 case with co-morbidity found.
47
Table 1.30 SIDPIC Lab Test Panels
* First line panel: These are the first-line tests which may be conducted after a check has been made to ensure that these pathogens have not already been tested for, as part of the patient’s clinical management.
# Second line panel: These tests may be conducted after the SIDPIC physician and the laboratory have evaluated the epidemiological and clinical features of the case.
Abbreviations:
AFB = Acid-fast bacillusAg = AntigenCCHF = Crimean-Congo haemorrhagic feverCMV = CytomegalovirusE. coli O157:H7 = Escherichia coli serotype O157:H7EBV = Epstein-Barr virusEM = Electron microscopy EV = EnterovirusEV71 = Enterovirus Type 71H5N1 = Influenza A virus subtype H5N1HFRS = Haemorrhagic fever with renal syndromeHSV = Herpes simplex virusJE IgM = Japanese encephalitis immunoglobulin M
MERS-CoV = Middle East respiratory syndrome coronavirusPCP = Pneumocystis carinii pneumoniaPCR = Polymerase chain reactionRVF = Rift Valley feverSARS-CoV = Severe acute respiratory syndrome
coronavirus SLE = St Louis encephalitis TB = TuberculosisVEE = Venezuelan equine encephalitisVZV = Varicella zoster virusWEE = Western equine encephalitisWNV = West Nile Virus
Pneumonia EncephalitisViral
Haemorrhagic Fever
First line panel* Respiratory SamplesMultiplex PCRInfluenza PCRH5N1 PCRSARS CoV-PCRMERS-CoV PCRTB PCR
BloodBacterial cultureMycoplasma serologyLegionella serologyChlamydia serologyH5N1 PCRSARS CoV-PCR
UrineUrine culturePneumococcal AgLegionella Ag
Other samples (e.g. lung tissue)PCP stainFungal stain
Cerebrospinal FluidBacterial cultureAFB PCR, cultureFungal cultureEnterovirus PCRHSV/ CMV/ VZV/ EBV PCRDengue PCRJE IgM, PCRWNV PCRNipah PCR
Respiratory SamplesEV PCRNipah PCR
StoolEnterovirus PCRPoliovirus PCR
Other samples (e.g. Brain tissue)Histopathology
Blood & Respiratory SamplesDengue PCR, serologyChikungunya PCR, serologyYellow fever PCR, serologyLassa, Ebola, Marburg fever
Second line panel# BloodBrucella serology
Respiratory SamplesViral isolationHantaan virus PCRNipah PCRZikavirus (Micronesia area)
Cerebrospinal FluidViral isolation, also consider lymphocytic choriomeningitis virus Rickettsial isolationKunjinChandipuraMeaslesPolioRabies, and other viral encephalitides dependent on travel history, e.g. WEE, SLE, VEE, Kyasanur forest disease (India)
Toscana (from Europe/ Spain)Sindbis virus (Europe/ Australia/ Asia)
StoolViral isolation
Other samples (e.g. Brain tissue)EM
Blood & Respiratory SamplesVEE, CCHF, RVF and other South American arenaviruses, e.g. Junin, Machupo, Guanarito and Sabia viruses, depending on travel historyHFRSVirus isolationEM
Myocarditis Gastrointestinal
First line panel* BloodEV71 PCR
StoolEnterovirus PCR
Other samples (e.g. Cardiac tissue)Histopathology
StoolVibrio CholeraE. coli O157:H7
Other samples (e.g. Liver/ intestinal tissue)HistopathologySpecial stains
BloodBacterial cultureYellow fever PCR, serology
Second line panel# BloodVirus isolation
Other samples (e.g. Cardiac tissue)EM, special stains
StoolRotavirus, astro-virus, sapovirus, adenovirus 40.41, Norovirus PCRViral isolation
Other samples (e.g. Liver/ intestinal tissue)EM, special stains
48
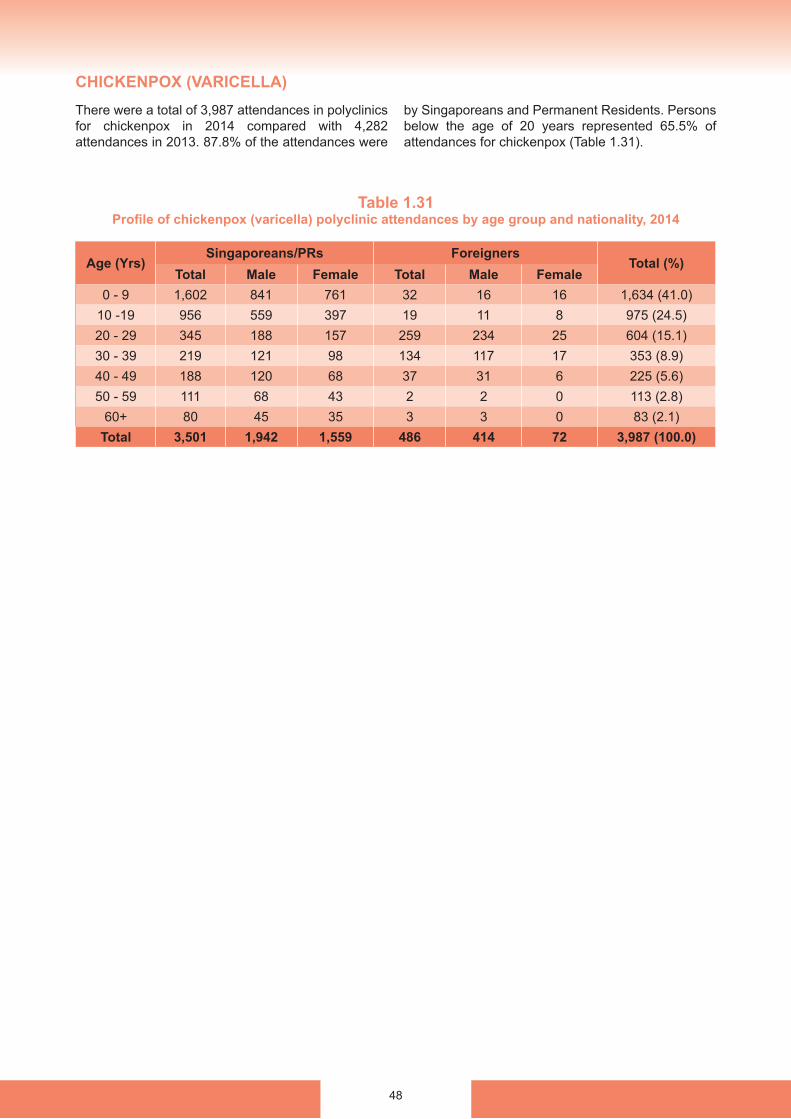
There were a total of 3,987 attendances in polyclinics for chickenpox in 2014 compared with 4,282 attendances in 2013. 87.8% of the attendances were
by Singaporeans and Permanent Residents. Persons below the age of 20 years represented 65.5% of attendances for chickenpox (Table 1.31).
Table 1.31Profile of chickenpox (varicella) polyclinic attendances by age group and nationality, 2014
Age (Yrs)Singaporeans/PRs Foreigners
Total (%)Total Male Female Total Male Female
0 - 9 1,602 841 761 32 16 16 1,634 (41.0)10 -19 956 559 397 19 11 8 975 (24.5)20 - 29 345 188 157 259 234 25 604 (15.1)30 - 39 219 121 98 134 117 17 353 (8.9)40 - 49 188 120 68 37 31 6 225 (5.6)50 - 59 111 68 43 2 2 0 113 (2.8)
60+ 80 45 35 3 3 0 83 (2.1)Total 3,501 1,942 1,559 486 414 72 3,987 (100.0)
CHICKENPOX (VARICELLA)