Embed Size (px)
Citation preview
VEDANTA ZINC DAY AUGUST 2017
Vedanta - Zinc Day
30 August, 2017
V E D A N T A – Z I N C – L E A D – S I L V E R | O I L & G A S | A L U M I N I U M | C O P P E R | I R O N O R E | P O W E R
VEDANTA ZINC DAY AUGUST 2017
Cautionary Statement & Disclaimer
2
The views expressed here may contain information derived from publicly available sources that have not been independently verified.
No representation or warranty is made as to the accuracy, completeness, reasonableness or reliability of this information. Any forward-
looking information in this presentation including, without limitation, any tables, charts and/or graphs, has been prepared on the basis
of a number of assumptions, which may prove to be incorrect. This presentation should not be relied upon as a recommendation or
forecast by Vedanta Resources plc, Vedanta Limited, Hindustan Zinc Limited and any of their subsidiaries. Past performance of Vedanta
Resources plc, Vedanta Limited, Hindustan Zinc Limited and any of their subsidiaries cannot be relied upon as a guide to future
performance.
This presentation contains 'forward-looking statements' – that is, statements related to future, not past, events. In this context,
forward-looking statements often address our expected future business and financial performance, and often contain words, such as
'expects,' 'anticipates,' 'intends,' 'plans,' 'believes,' 'seeks,' or 'will.' Forward–looking statements by their nature address matters that
are, to different degrees, uncertain. For us, uncertainties arise from the behaviour of financial and metals markets including the London
Metal Exchange, fluctuations in interest and or exchange rates and metal prices; from future integration of acquired businesses; and
from numerous other matters of national, regional and global scale, including those of a environmental, climatic, natural, political,
economic, business, competitive or regulatory nature. These uncertainties may cause our actual future results to be materially different
than those expressed in our forward-looking statements. We do not undertake to update our forward-looking statements. We caution
you that reliance on any forward-looking statement involves risk and uncertainties, and that, although we believe that the assumption
on which our forward-looking statements are based are reasonable, any of those assumptions could prove to be inaccurate and, as a
result, the forward-looking statement based on those assumptions could be materially incorrect.
This presentation is not intended, and does not, constitute or form part of any offer, invitation or the solicitation of an offer to purchase,
otherwise acquire, subscribe for, sell or otherwise dispose of, any securities in Vedanta Resources plc, Vedanta Limited, Hindustan Zinc
Limited and any of their subsidiaries or undertakings or any other invitation or inducement to engage in investment activities, nor shall
this presentation (or any part of it) nor the fact of its distribution form the basis of, or be relied on in connection with, any contract or
investment decision.
VEDANTA ZINC DAY AUGUST 2017 3
Arun Kumar G.R. –Group CFO
Introduction
3
VEDANTA ZINC DAY AUGUST 2017
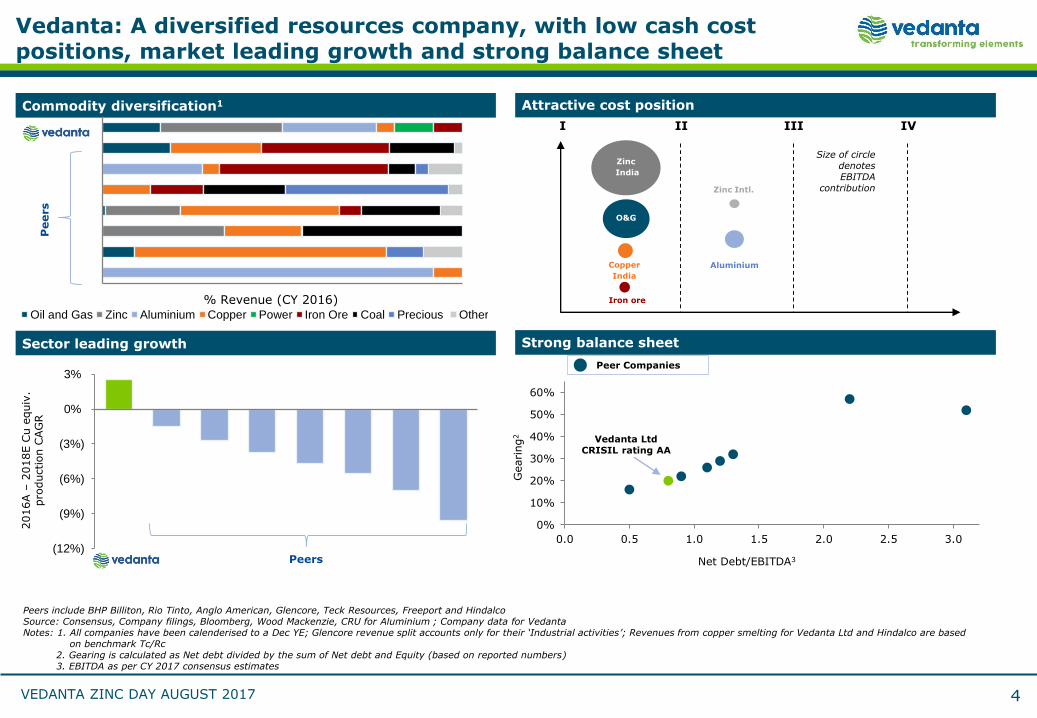
Vedanta: A diversified resources company, with low cash cost positions, market leading growth and strong balance sheet
Attractive cost positionCommodity diversification1
Strong balance sheetSector leading growth
I II III IV
Size of circle denotes EBITDA
contribution
Iron ore
Aluminium
Zinc
India
Copper
India
O&G
0%
10%
20%
30%
40%
50%
60%
0.0 0.5 1.0 1.5 2.0 2.5 3.0
Gearing
2
Net Debt/EBITDA3
Vedanta LtdCRISIL rating AA
Peers include BHP Billiton, Rio Tinto, Anglo American, Glencore, Teck Resources, Freeport and HindalcoSource: Consensus, Company filings, Bloomberg, Wood Mackenzie, CRU for Aluminium ; Company data for VedantaNotes: 1. All companies have been calenderised to a Dec YE; Glencore revenue split accounts only for their ‘Industrial activities’; Revenues from copper smelting for Vedanta Ltd and Hindalco are based
on benchmark Tc/Rc2. Gearing is calculated as Net debt divided by the sum of Net debt and Equity (based on reported numbers) 3. EBITDA as per CY 2017 consensus estimates
2016A –
2018E C
u e
quiv
. pro
duction C
AG
R
Peers
Peers
Peer Companies
% Revenue (CY 2016)
Zinc Intl.
Oil and Gas Zinc Aluminium Copper Power Iron Ore Coal Precious Other
(12%)
(9%)
(6%)
(3%)
0%
3%
4
VEDANTA ZINC DAY AUGUST 2017
A world-class natural resource powerhouse anchored in India
6th largest diversified resources company in the world1
Only global player with significant operations, expertise and majority sales in the
Indian market – the fastest growing G-20 economy2
Strong Balance sheet: Vedanta Ltd. Net Debt/EBITDA at 0.8x3 – amongst the lowest
and strongest among Indian and global peers
Completed Vedanta Ltd – Cairn India merger: Simplified group structure with greater
financial flexibility to allocate capital efficiently
Contributed INR 40,000 crores to Government of India in FY17
20% gender diverse leadership team; awarded one of the “Top Company to work for in
Asia” by ACES, 2016
6
Notes: 1. As per CY2016 reported EBITDA2. As per Moody’s3. LTM as of June 30, 2017
VEDANTA ZINC DAY AUGUST 2017
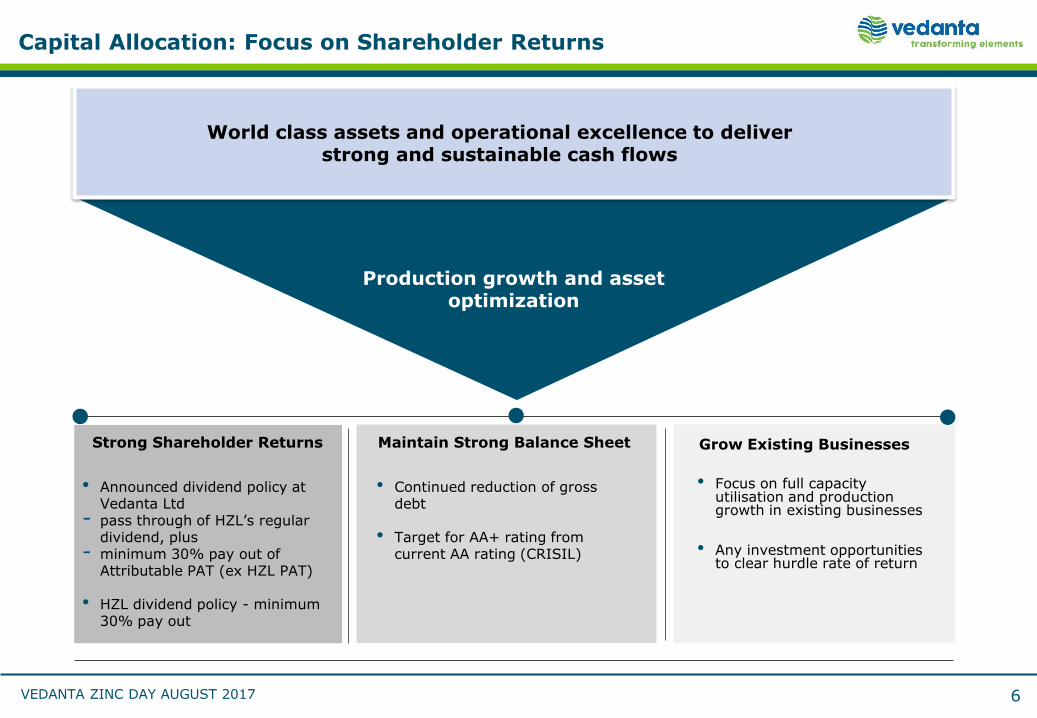
Capital Allocation: Focus on Shareholder Returns
World class assets and operational excellence to deliver strong and sustainable cash flows
Production growth and asset optimization
Strong Shareholder Returns
• Announced dividend policy at Vedanta Ltd
- pass through of HZL’s regular dividend, plus
- minimum 30% pay out of Attributable PAT (ex HZL PAT)
• HZL dividend policy - minimum 30% pay out
Maintain Strong Balance Sheet
• Continued reduction of gross debt
• Target for AA+ rating from current AA rating (CRISIL)
Grow Existing Businesses
• Focus on full capacity utilisation and production growth in existing businesses
• Any investment opportunities to clear hurdle rate of return
6
VEDANTA ZINC DAY AUGUST 2017
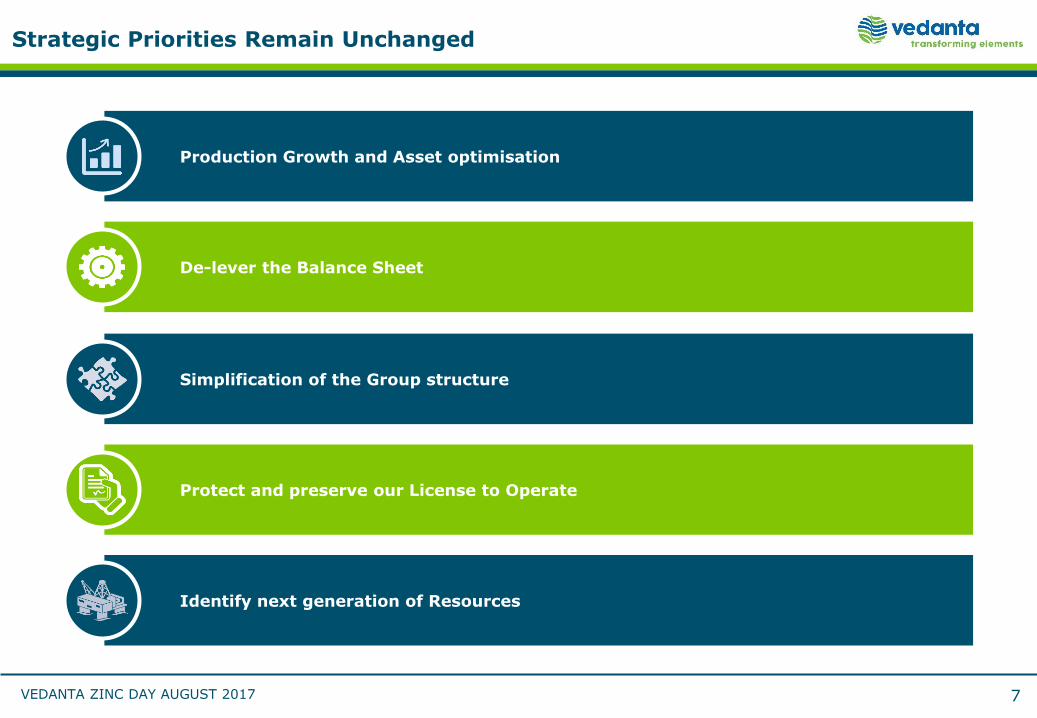
Strategic Priorities Remain Unchanged
Production Growth and Asset optimisation
De-lever the Balance Sheet
Identify next generation of Resources
Simplification of the Group structure
Protect and preserve our License to Operate
7
VEDANTA ZINC DAY AUGUST 2017 8
Phil Turner – Group Head, HSE and Sustainability
Health, Safety, Environment & Sustainability
8
VEDANTA ZINC DAY AUGUST 2017
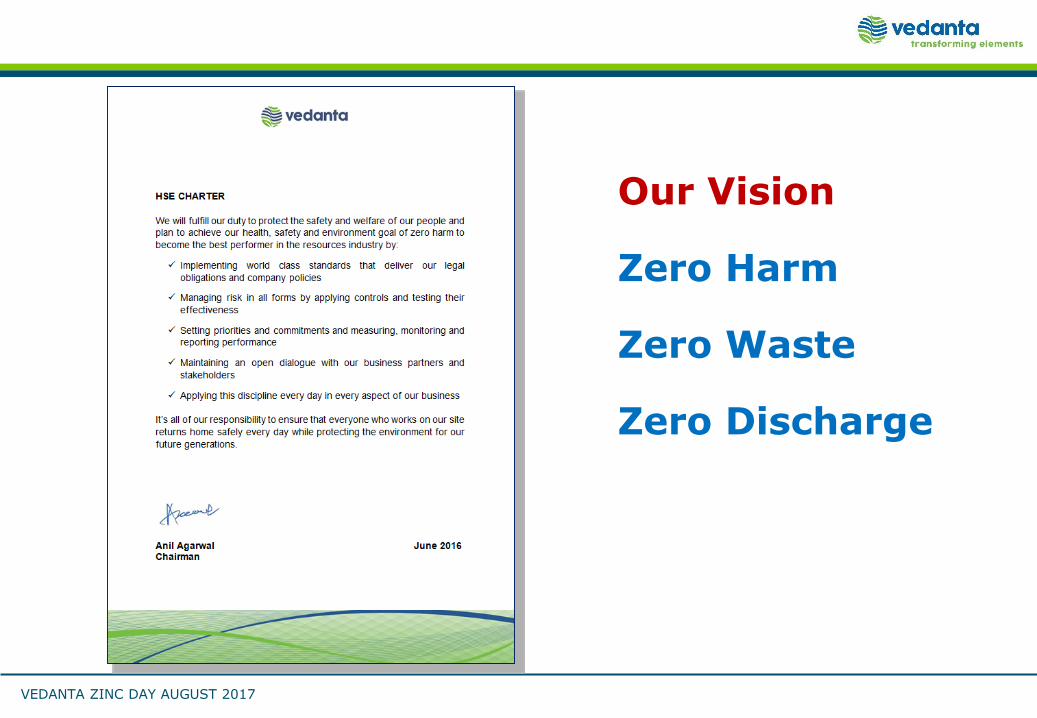
Our Vision
Zero Harm
Zero Waste
Zero Discharge
VEDANTA ZINC DAY AUGUST 2017
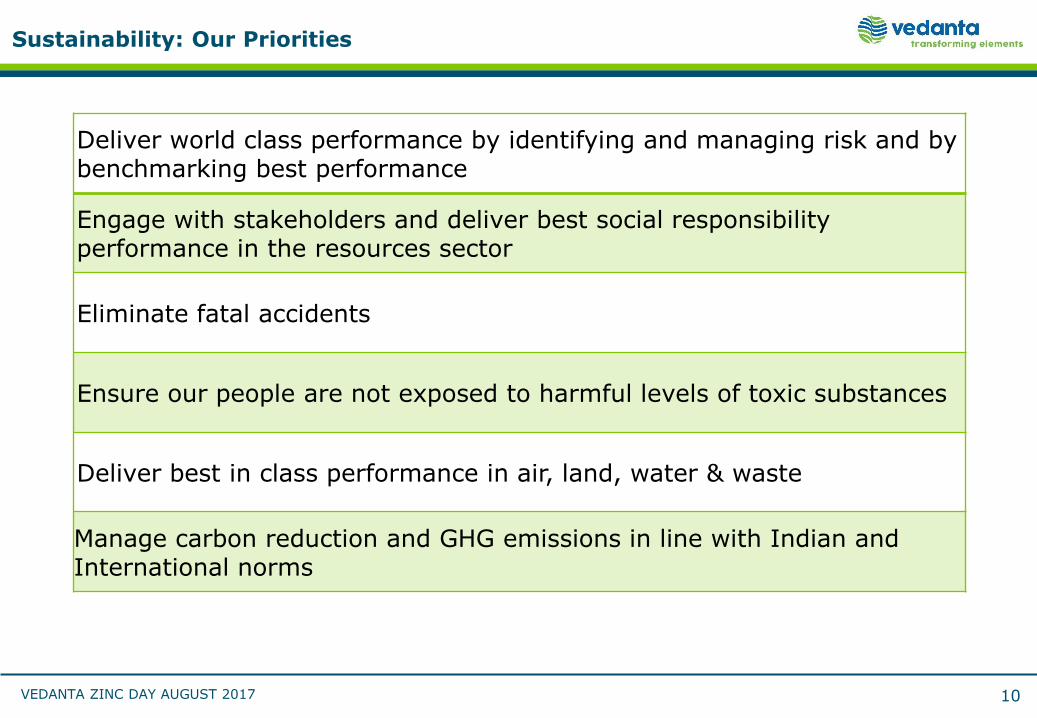
Sustainability: Our Priorities
10
Deliver world class performance by identifying and managing risk and by benchmarking best performance
Engage with stakeholders and deliver best social responsibility performance in the resources sector
Eliminate fatal accidents
Ensure our people are not exposed to harmful levels of toxic substances
Deliver best in class performance in air, land, water & waste
Manage carbon reduction and GHG emissions in line with Indian and International norms
VEDANTA ZINC DAY AUGUST 2017
Zinc International: Health, Safety, Environment
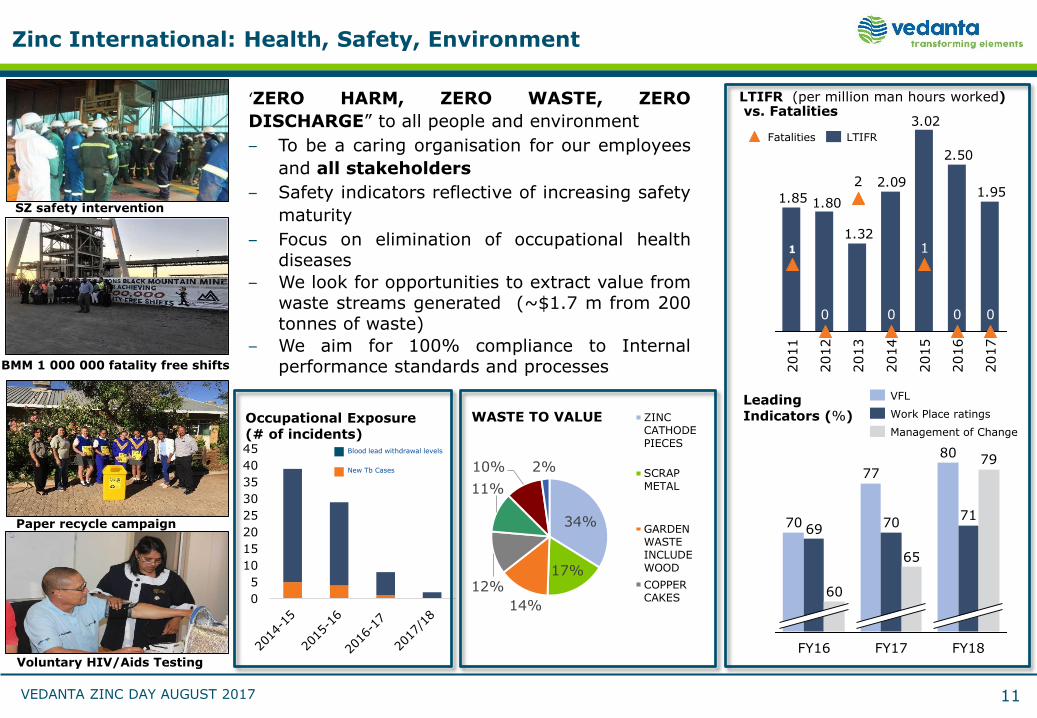
‘ZERO HARM, ZERO WASTE, ZERO
DISCHARGE” to all people and environment
‒ To be a caring organisation for our employees
and all stakeholders
‒ Safety indicators reflective of increasing safety
maturity
‒ Focus on elimination of occupational healthdiseases
‒ We look for opportunities to extract value fromwaste streams generated (~$1.7 m from 200tonnes of waste)
‒ We aim for 100% compliance to Internalperformance standards and processes
LTIFR (per million man hours worked)vs. Fatalities
SZ safety intervention
Paper recycle campaign
1.95
2.50
3.02
2.09
1.32
1.801.85
2013
2016
2017
0 00
2015
1
2014
2
2012
0
2011
1
Fatalities LTIFR
BMM 1 000 000 fatality free shifts
Voluntary HIV/Aids Testing
0
5
10
15
20
25
30
35
40
45
Occupational Exposure
(# of incidents)
70 7069
FY16
60
77
65
FY17
80
FY18
79
71
Management of Change
Work Place ratings
VFLLeading Indicators (%)
34%
17%
14%
12%
11%
10% 2%
WASTE TO VALUE ZINCCATHODEPIECES
SCRAPMETAL
GARDENWASTEINCLUDEWOOD
COPPERCAKES
Blood lead withdrawal levels
New Tb Cases
11
VEDANTA ZINC DAY AUGUST 2017
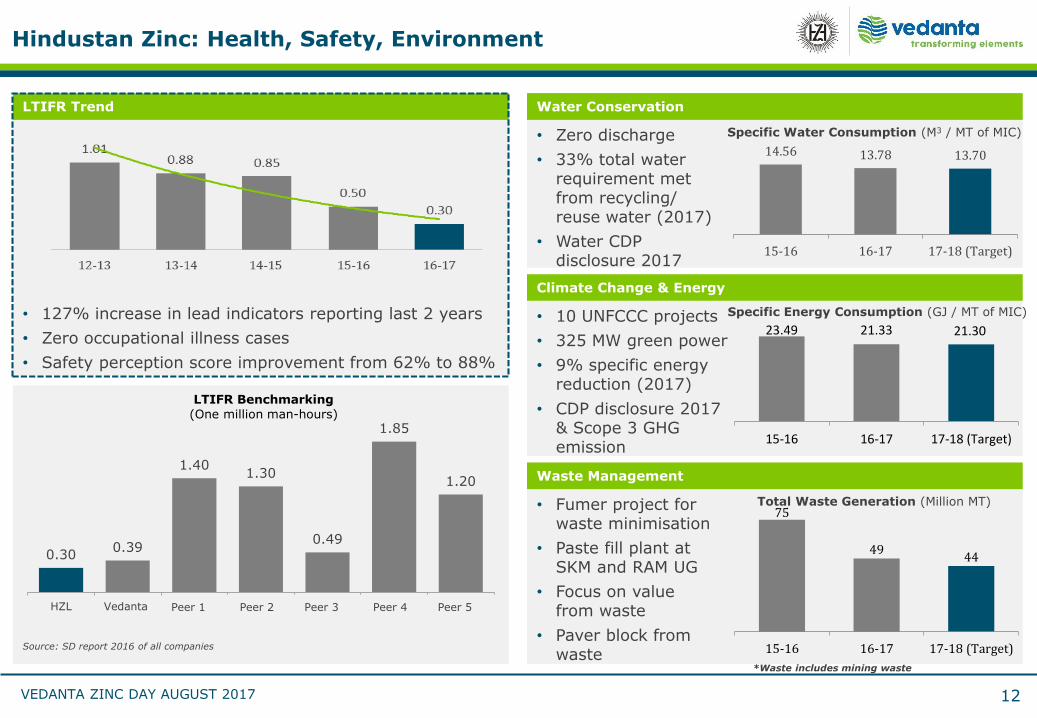
LTIFR Trend
Hindustan Zinc: Health, Safety, Environment
• 127% increase in lead indicators reporting last 2 years
• Zero occupational illness cases
• Safety perception score improvement from 62% to 88%
0.300.39
1.401.30
0.49
1.85
1.20
HZL Vedanta GlencoreXstrata
Rio Tinto Vale AngloAmerican
Antofagasta
LTIFR Benchmarking
(One million man-hours)
Source: SD report 2016 of all companies
Water Conservation
• Zero discharge
• 33% total water requirement met from recycling/ reuse water (2017)
• Water CDP disclosure 2017
14.56 13.78 13.70
15-16 16-17 17-18 (Target)
Specific Water Consumption (M3 / MT of MIC)
Climate Change & Energy
• 10 UNFCCC projects
• 325 MW green power
• 9% specific energy reduction (2017)
• CDP disclosure 2017& Scope 3 GHG emission
Specific Energy Consumption (GJ / MT of MIC)
23.49 21.33 21.30
15-16 16-17 17-18 (Target)
Waste Management
• Fumer project for waste minimisation
• Paste fill plant at SKM and RAM UG
• Focus on value from waste
• Paver block from waste
75
4944
15-16 16-17 17-18 (Target)
Total Waste Generation (Million MT)
*Waste includes mining waste
12
Peer 1 Peer 2 Peer 3 Peer 4 Peer 5
VEDANTA ZINC DAY AUGUST 2017 13
Sunil Duggal – CEO, Hindustan Zinc
Zinc Market Overview
13
VEDANTA ZINC DAY AUGUST 2017
Construction
50%
Transport
21%
Infrastructure
16%
Industrial
machinery7%
Consumer
products6%
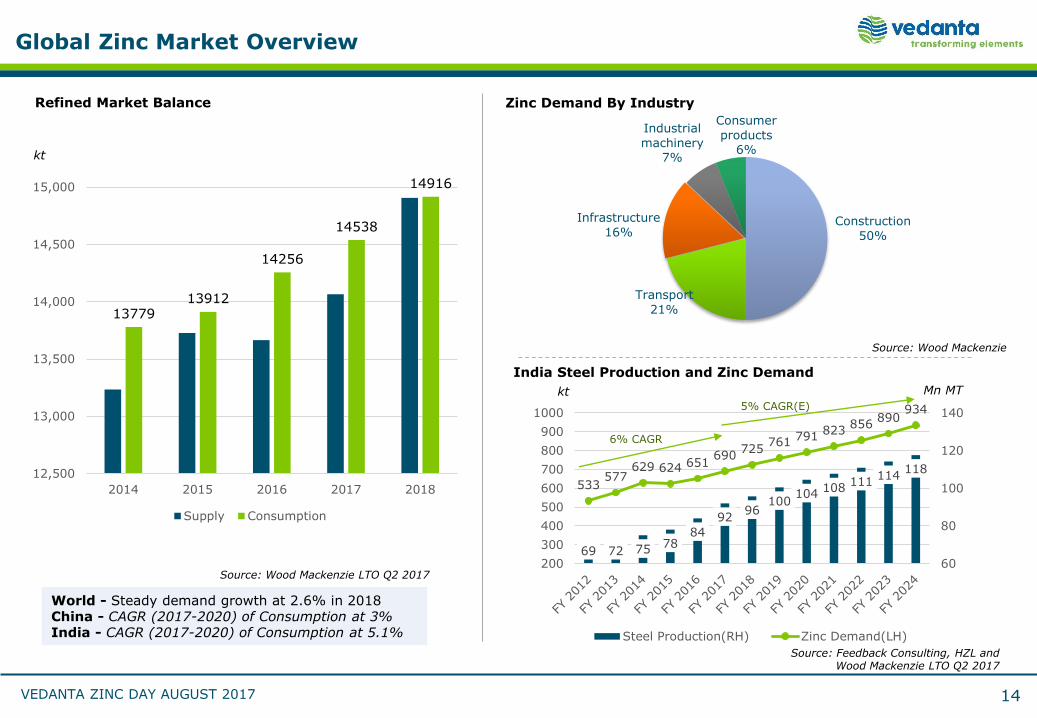
Global Zinc Market Overview
14
Source: Wood Mackenzie
kt
kt
World - Steady demand growth at 2.6% in 2018China - CAGR (2017-2020) of Consumption at 3%India - CAGR (2017-2020) of Consumption at 5.1%
Refined Market Balance
India Steel Production and Zinc Demand
Mn MT
Source: Feedback Consulting, HZL and Wood Mackenzie LTO Q2 2017
Source: Wood Mackenzie LTO Q2 2017
69 72 75 7884
9296
100104
108111
114118
533577
629 624 651690
725761 791
823856
890934
60
80
100
120
140
200
300
400
500
600
700
800
900
1000
Steel Production(RH) Zinc Demand(LH)
6% CAGR
5% CAGR(E)
1377913912
14256
14538
14916
12,500
13,000
13,500
14,000
14,500
15,000
2014 2015 2016 2017 2018
Supply Consumption
Zinc Demand By Industry
VEDANTA ZINC DAY AUGUST 2017
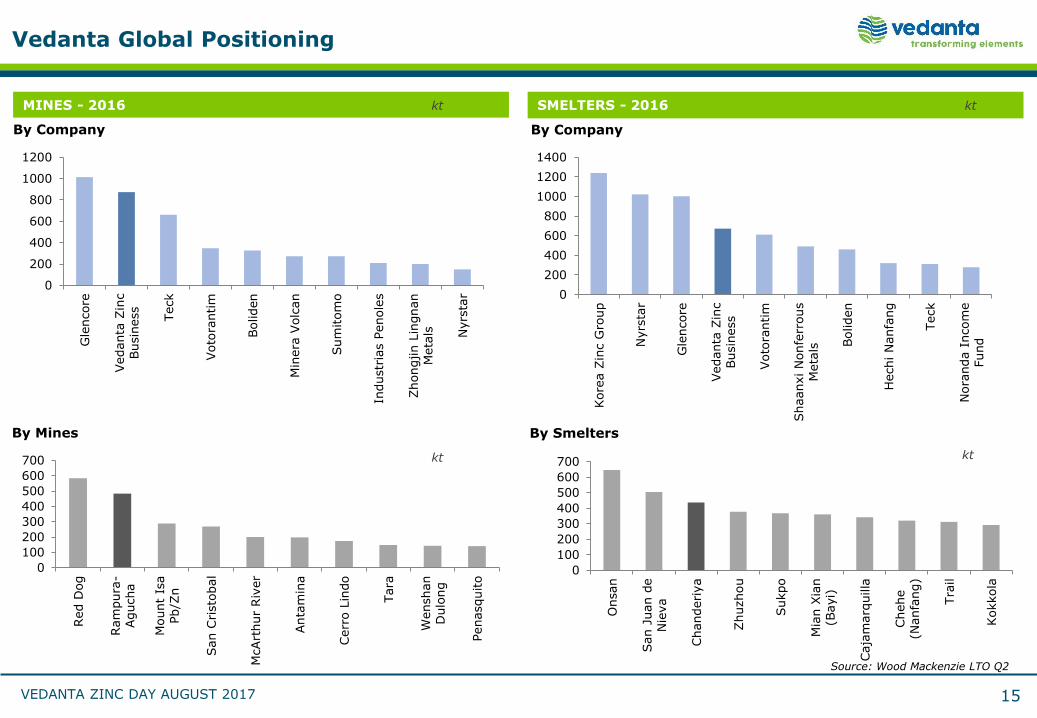
Vedanta Global Positioning
15
0
200
400
600
800
1000
1200
Gle
ncore
Vedanta
Zin
c
Busin
ess
Teck
Voto
rantim
Boliden
Min
era
Volc
an
Sum
itom
o
Industr
ias P
enole
s
Zhongjin L
ingnan
Meta
ls Nyrs
tar
0
100
200
300
400
500
600
700
Red D
og
Ram
pura
-
Agucha
Mount
Isa
Pb/Z
n
San C
risto
bal
McArt
hur
Riv
er
Anta
min
a
Cerr
o L
indo
Tara
Wenshan
Dulo
ng
Penasquito
0
100
200
300
400
500
600
700
Onsan
San J
uan d
e
Nie
va
Chanderiya
Zhuzhou
Sukpo
Mia
n X
ian
(Bayi)
Caja
marq
uilla
Chehe
(Nanfa
ng)
Tra
il
Kokkola
Source: Wood Mackenzie LTO Q2
MINES - 2016 SMELTERS - 2016
0
200
400
600
800
1000
1200
1400
Kore
a Z
inc G
roup
Nyrs
tar
Gle
ncore
Vedanta
Zin
c
Busin
ess
Voto
rantim
Shaanxi N
onfe
rrous
Meta
ls Boliden
Hechi N
anfa
ng
Teck
Nora
nda I
ncom
e
Fund
By Company By Company
By Mines By Smelters
kt kt
kt kt
VEDANTA ZINC DAY AUGUST 2017
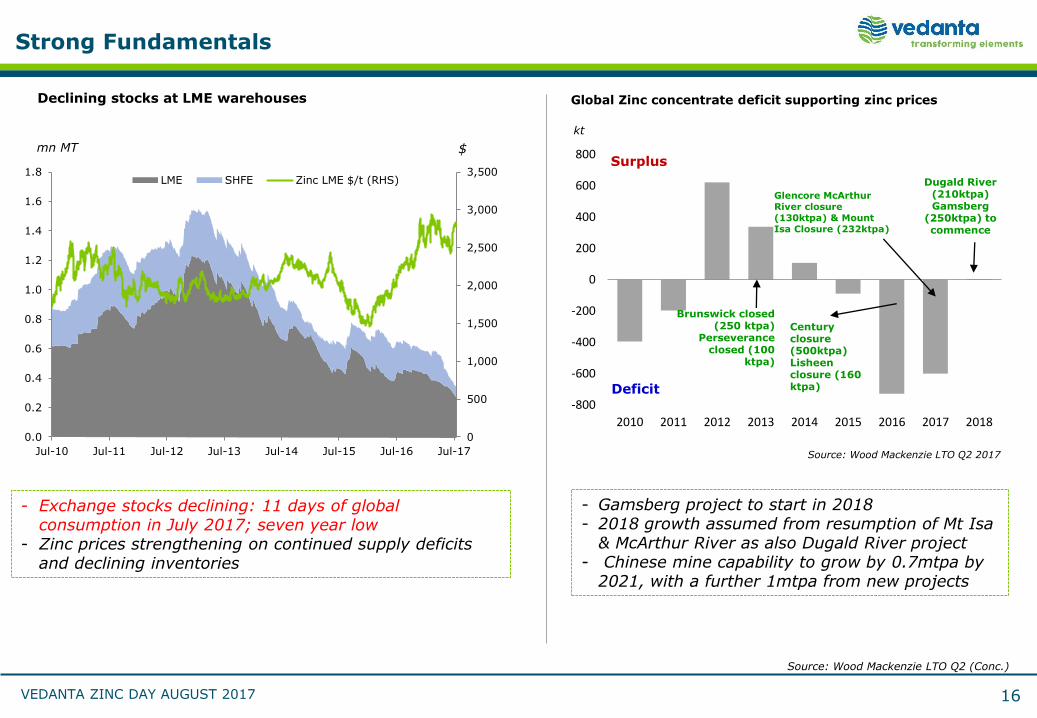
- Exchange stocks declining: 11 days of global consumption in July 2017; seven year low
- Zinc prices strengthening on continued supply deficits and declining inventories
0
500
1,000
1,500
2,000
2,500
3,000
3,500
0.0
0.2
0.4
0.6
0.8
1.0
1.2
1.4
1.6
1.8
Jul-10 Jul-11 Jul-12 Jul-13 Jul-14 Jul-15 Jul-16 Jul-17
LME SHFE Zinc LME $/t (RHS)
Strong Fundamentals
mn MT $
Declining stocks at LME warehouses
Source: Wood Mackenzie LTO Q2 (Conc.)
16
- Gamsberg project to start in 2018- 2018 growth assumed from resumption of Mt Isa
& McArthur River as also Dugald River project- Chinese mine capability to grow by 0.7mtpa by
2021, with a further 1mtpa from new projects
Source: Wood Mackenzie LTO Q2 2017
-800
-600
-400
-200
0
200
400
600
800
2010 2011 2012 2013 2014 2015 2016 2017 2018
Century closure(500ktpa)Lisheen closure (160 ktpa)
Brunswick closed (250 ktpa)
Perseverance closed (100
ktpa)
Dugald River (210ktpa) Gamsberg
(250ktpa) to commence
Surplus
Deficit
Global Zinc concentrate deficit supporting zinc prices
kt
Glencore McArthur River closure (130ktpa) & Mount Isa Closure (232ktpa)
VEDANTA ZINC DAY AUGUST 2017
Vedanta - Zinc Day Zinc International30 August, 2017
V E D A N T A – Z I N C – L E A D – S I L V E R | O I L & G A S | A L U M I N I U M | C O P P E R | I R O N O R E | P O W E R
VEDANTA ZINC DAY AUGUST 2017
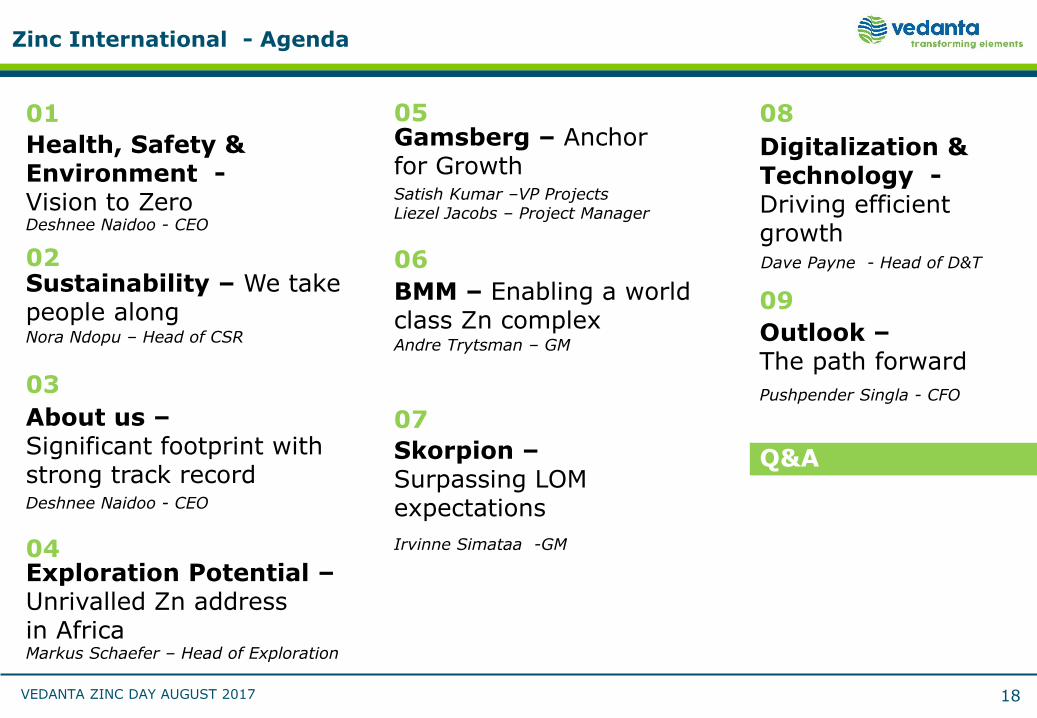
Zinc International - Agenda
18
Health, Safety & Environment -Vision to ZeroDeshnee Naidoo - CEO
Sustainability – We take people alongNora Ndopu – Head of CSR
About us –Significant footprint with strong track recordDeshnee Naidoo - CEO
Exploration Potential –Unrivalled Zn addressin AfricaMarkus Schaefer – Head of Exploration
Gamsberg – Anchor for GrowthSatish Kumar –VP ProjectsLiezel Jacobs – Project Manager
BMM – Enabling a world class Zn complex Andre Trytsman – GM
Skorpion –Surpassing LOM expectations
Irvinne Simataa -GM
Digitalization & Technology -Driving efficient growth Dave Payne - Head of D&T
Outlook –The path forward
Pushpender Singla - CFO
01
02
03
04
05
06
07
08
09
Q&A
VEDANTA ZINC DAY AUGUST 2017 19
Deshnee Naidoo - CEO
Health, Safety, Environment-Vision to Zero
01
19

VEDANTA ZINC DAY AUGUST 2017
Health, Safety, Environment & Sustainability
‘ZERO HARM, ZERO WASTE, ZERO
DISCHARGE” to all people and environment
‒ To be a caring organisation for our employees
and all stakeholders
‒ Safety indicators reflective of increasing safety
maturity
‒ Focus on elimination of occupational healthdiseases
‒ We look for opportunities to extract value fromwaste streams generated (~$1.7 m from 200tonnes of waste)
‒ We aim for 100% compliance to Internalperformance standards and processes
LTIFR (per million man hours worked)vs. Fatalities
SZ safety intervention
Paper recycle campaign
1.95
2.50
3.02
2.09
1.32
1.801.85
2013
2016
2017
0 00
2015
1
2014
2
2012
0
2011
1
Fatalities LTIFR
BMM 1 000 000 fatality free shifts
Voluntary HIV/Aids Testing
0
5
10
15
20
25
30
35
40
45
Occupational Exposure
(# of incidents)
70 7069
FY16
60
77
65
FY17
80
FY18
79
71
Management of Change
Work Place ratings
VFLLeading Indicators (%)
34%
17%
14%
12%
11%
10% 2%
WASTE TO VALUE ZINCCATHODEPIECES
SCRAPMETAL
GARDENWASTEINCLUDEWOOD
COPPERCAKES
Blood lead withdrawal levels
New Tb Cases
20
VEDANTA ZINC DAY AUGUST 2017 21
Nora Ndopu – Head of CSR
Sustainability -We take people along
02
21
VEDANTA ZINC DAY AUGUST 2017
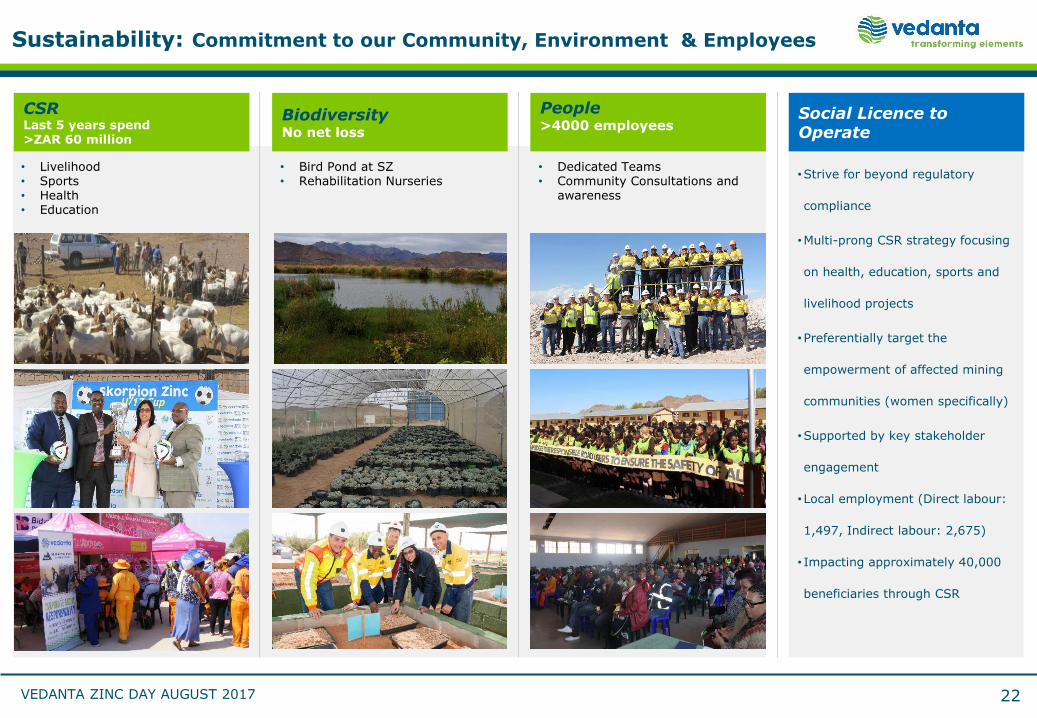
•Strive for beyond regulatory
compliance
•Multi-prong CSR strategy focusing
on health, education, sports and
livelihood projects
•Preferentially target the
empowerment of affected mining
communities (women specifically)
•Supported by key stakeholder
engagement
•Local employment (Direct labour:
1,497, Indirect labour: 2,675)
• Impacting approximately 40,000
beneficiaries through CSR
Sustainability: Commitment to our Community, Environment & Employees
22
CSRLast 5 years spend>ZAR 60 million
BiodiversityNo net loss
People >4000 employees
Social Licence to Operate
• Livelihood• Sports• Health• Education
• Bird Pond at SZ• Rehabilitation Nurseries
• Dedicated Teams• Community Consultations and
awareness
VEDANTA ZINC DAY AUGUST 2017 23
Deshnee Naidoo - CEO
About us –Significant footprint with strong track record
03
23
VEDANTA ZINC DAY AUGUST 2017
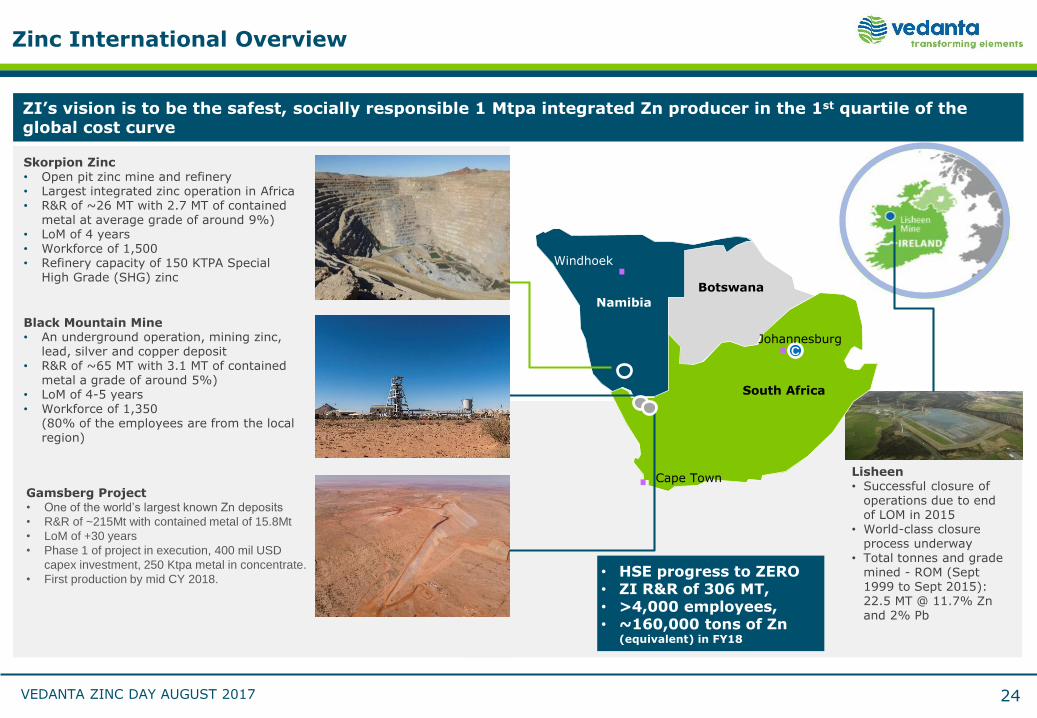
Zinc International Overview
24
Black Mountain Mine• An underground operation, mining zinc,
lead, silver and copper deposit• R&R of ~65 MT with 3.1 MT of contained
metal a grade of around 5%)• LoM of 4-5 years• Workforce of 1,350
(80% of the employees are from the local region)
Gamsberg Project• One of the world’s largest known Zn deposits
• R&R of ~215Mt with contained metal of 15.8Mt
• LoM of +30 years
• Phase 1 of project in execution, 400 mil USD
capex investment, 250 Ktpa metal in concentrate.
• First production by mid CY 2018.
Skorpion Zinc• Open pit zinc mine and refinery• Largest integrated zinc operation in Africa• R&R of ~26 MT with 2.7 MT of contained
metal at average grade of around 9%)• LoM of 4 years• Workforce of 1,500 • Refinery capacity of 150 KTPA Special
High Grade (SHG) zinc
Lisheen• Successful closure of
operations due to end of LOM in 2015
• World-class closure process underway
• Total tonnes and grade mined - ROM (Sept 1999 to Sept 2015): 22.5 MT @ 11.7% Zn and 2% Pb
C
South Africa
Johannesburg
Windhoek
Botswana
Cape Town
Namibia
• HSE progress to ZERO• ZI R&R of 306 MT, • >4,000 employees, • ~160,000 tons of Zn
(equivalent) in FY18
ZI’s vision is to be the safest, socially responsible 1 Mtpa integrated Zn producer in the 1st quartile of the global cost curve
VEDANTA ZINC DAY AUGUST 2017 25
Markus Schaefer – Head of Exploration
Exploration potential –Unrivalled Zn addressin Africa
04
25
VEDANTA ZINC DAY AUGUST 2017
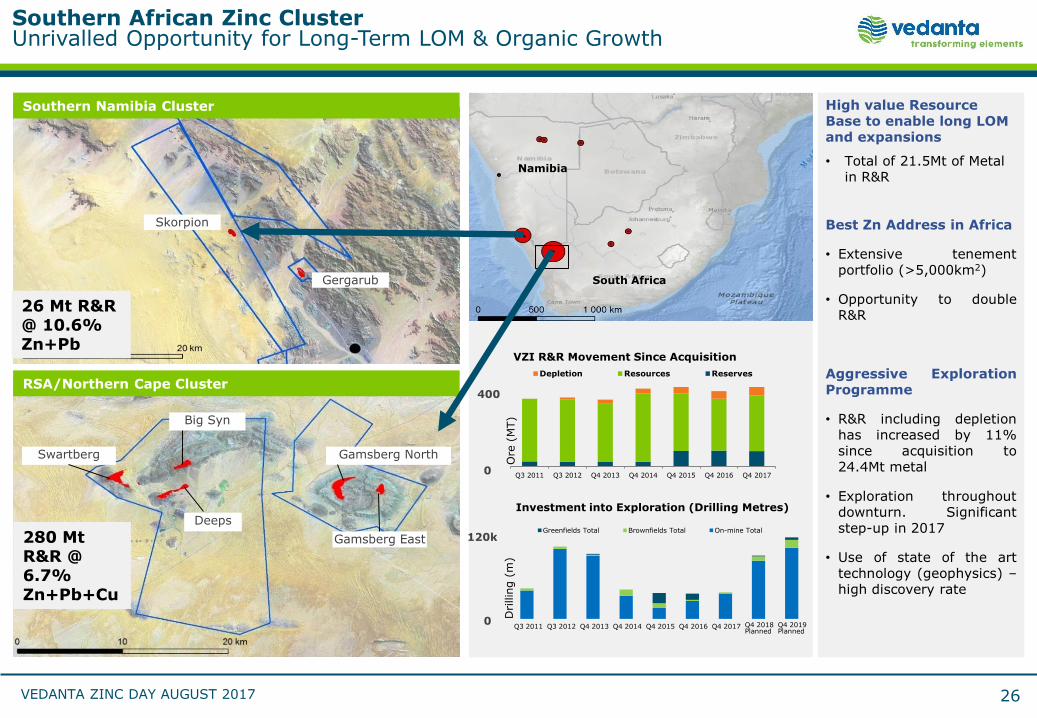
Southern African Zinc ClusterUnrivalled Opportunity for Long-Term LOM & Organic Growth
26
High value Resource Base to enable long LOMand expansions
• Total of 21.5Mt of Metal in R&R
Best Zn Address in Africa
• Extensive tenementportfolio (>5,000km2)
• Opportunity to doubleR&R
Aggressive ExplorationProgramme
• R&R including depletionhas increased by 11%since acquisition to24.4Mt metal
• Exploration throughoutdownturn. Significantstep-up in 2017
• Use of state of the arttechnology (geophysics) –high discovery rate
Skorpion
Gergarub
Swartberg
Deeps
Big Syn
Gamsberg North
Gamsberg East
Namibia
South Africa
Drillin
g (
m)
Greenfields Total Brownfields Total On-mine Total
Q3 2011 Q3 2012 Q4 2013 Q4 2014 Q4 2015 Q4 2016 Q4 2017
Ore
(M
T)
Depletion Resources Reserves
VZI R&R Movement Since Acquisition
Investment into Exploration (Drilling Metres)
0
400
Q3 2011 Q3 2012 Q4 2013 Q4 2014 Q4 2015 Q4 2016 Q4 2017 Q4 2018Planned
Q4 2019 Planned
0
120k
Southern Namibia Cluster
RSA/Northern Cape Cluster
26
280 Mt R&R @ 6.7% Zn+Pb+Cu
26 Mt R&R @ 10.6% Zn+Pb
VEDANTA ZINC DAY AUGUST 2017 27
Satish Kumar – VP ProjectsLiezel Jacobs – Project Manager
Gamsberg -Anchor for Growth
05
27
VEDANTA ZINC DAY AUGUST 2017 28
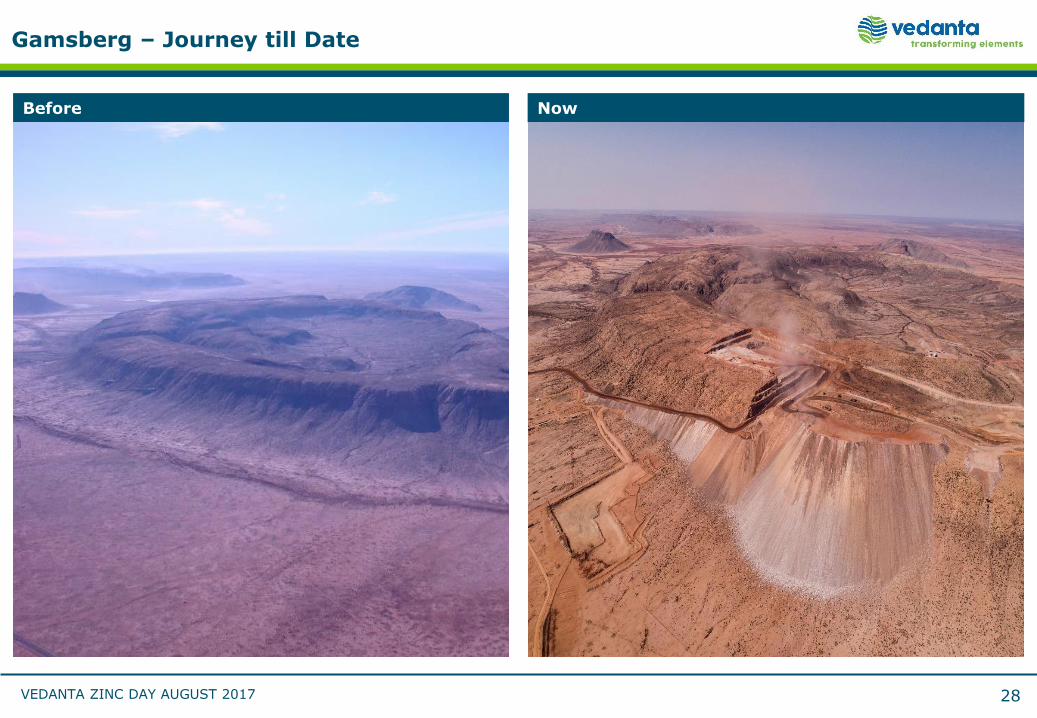
Before Now
Gamsberg – Journey till Date
VEDANTA ZINC DAY AUGUST 2017 29
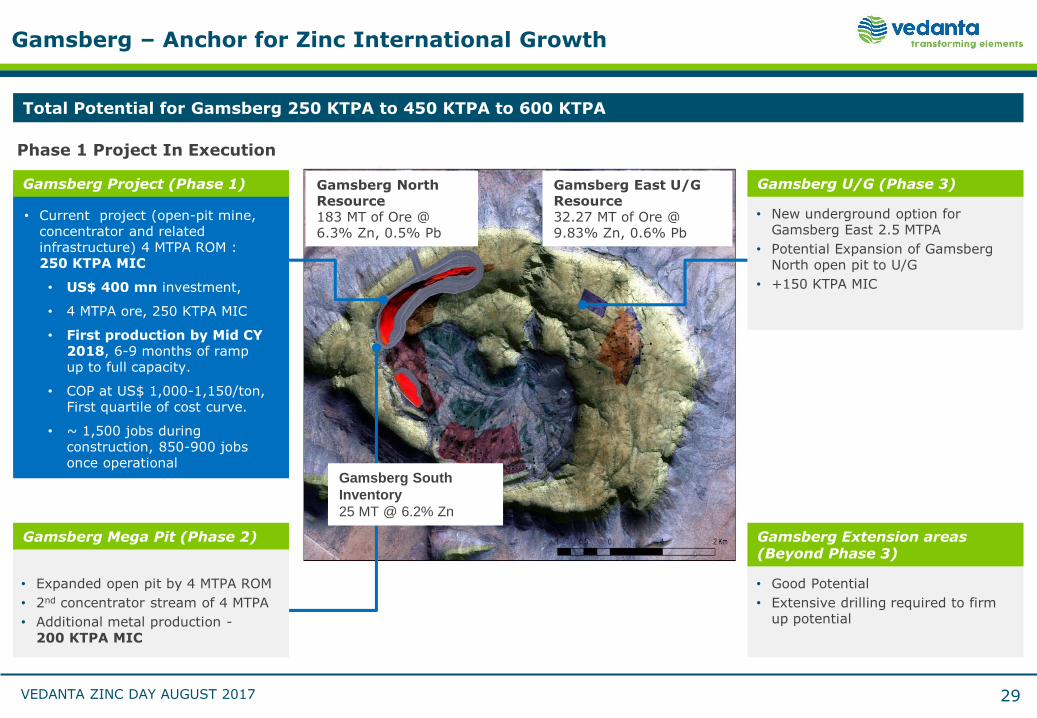
• Current project (open-pit mine, concentrator and related infrastructure) 4 MTPA ROM : 250 KTPA MIC
• US$ 400 mn investment,
• 4 MTPA ore, 250 KTPA MIC
• First production by Mid CY 2018, 6-9 months of ramp up to full capacity.
• COP at US$ 1,000-1,150/ton, First quartile of cost curve.
• ~ 1,500 jobs during construction, 850-900 jobs once operational
• Expanded open pit by 4 MTPA ROM
• 2nd concentrator stream of 4 MTPA
• Additional metal production -200 KTPA MIC
Gamsberg North Resource183 MT of Ore @ 6.3% Zn, 0.5% Pb
Gamsberg South
Inventory
25 MT @ 6.2% Zn
Gamsberg East U/G Resource32.27 MT of Ore @ 9.83% Zn, 0.6% Pb
Phase 1 Project In Execution
Gamsberg – Anchor for Zinc International Growth
Total Potential for Gamsberg 250 KTPA to 450 KTPA to 600 KTPA
Gamsberg Project (Phase 1)
Gamsberg Mega Pit (Phase 2) Gamsberg Extension areas (Beyond Phase 3)
• Good Potential
• Extensive drilling required to firm up potential
Gamsberg U/G (Phase 3)
• New underground option for Gamsberg East 2.5 MTPA
• Potential Expansion of GamsbergNorth open pit to U/G
• +150 KTPA MIC
VEDANTA ZINC DAY AUGUST 2017
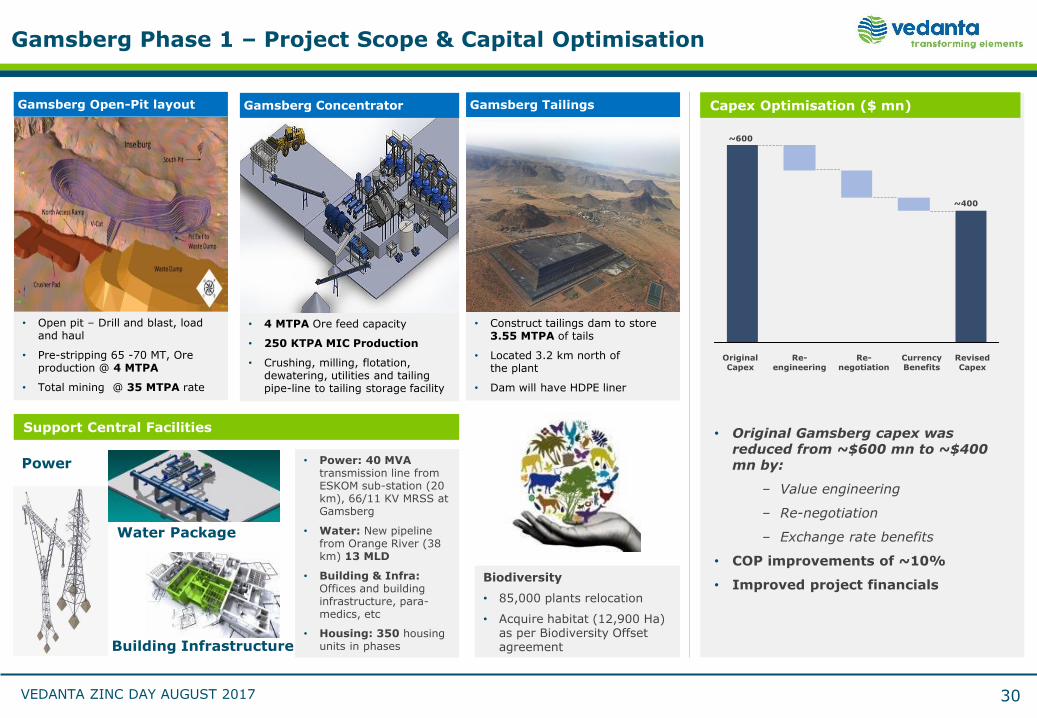
Biodiversity
• 85,000 plants relocation
• Acquire habitat (12,900 Ha) as per Biodiversity Offset agreement
Gamsberg Open-Pit layout
• Open pit – Drill and blast, load and haul
• Pre-stripping 65 -70 MT, Ore production @ 4 MTPA
• Total mining @ 35 MTPA rate
• 4 MTPA Ore feed capacity
• 250 KTPA MIC Production
• Crushing, milling, flotation, dewatering, utilities and tailing pipe-line to tailing storage facility
Gamsberg Tailings
• Construct tailings dam to store 3.55 MTPA of tails
• Located 3.2 km north of the plant
• Dam will have HDPE liner
Gamsberg Concentrator
Support Central Facilities
Capex Optimisation ($ mn)
Original Capex
~600
Re-negotiation
Re-engineering
Revised Capex
~400
Currency Benefits
• Original Gamsberg capex was reduced from ~$600 mn to ~$400 mn by:
‒ Value engineering
‒ Re-negotiation
‒ Exchange rate benefits
• COP improvements of ~10%
• Improved project financials
Power
Building Infrastructure
Water Package
• Power: 40 MVAtransmission line from ESKOM sub-station (20 km), 66/11 KV MRSS at Gamsberg
• Water: New pipeline from Orange River (38 km) 13 MLD
• Building & Infra: Offices and building infrastructure, para-medics, etc
• Housing: 350 housing units in phases
Gamsberg Phase 1 – Project Scope & Capital Optimisation
30
VEDANTA ZINC DAY AUGUST 2017 31
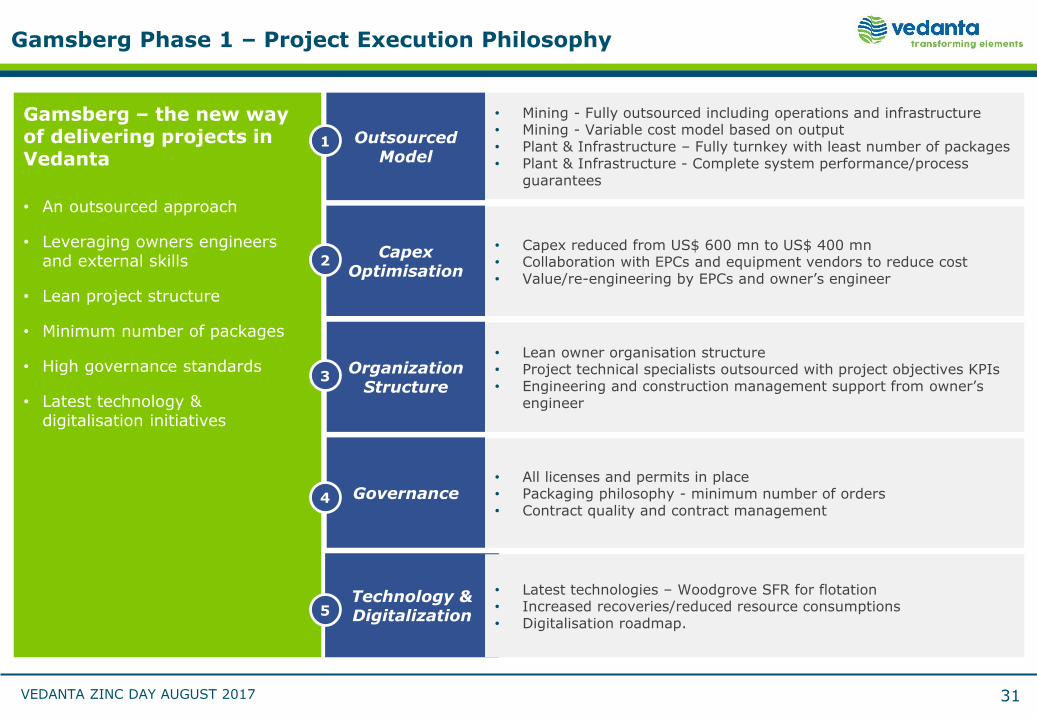
Gamsberg – the new way of delivering projects in Vedanta
• An outsourced approach
• Leveraging owners engineers and external skills
• Lean project structure
• Minimum number of packages
• High governance standards
• Latest technology & digitalisation initiatives
• Mining - Fully outsourced including operations and infrastructure • Mining - Variable cost model based on output• Plant & Infrastructure – Fully turnkey with least number of packages• Plant & Infrastructure - Complete system performance/process
guarantees
Outsourced Model
Capex Optimisation
Organization Structure
Governance
Technology & Digitalization
• Capex reduced from US$ 600 mn to US$ 400 mn• Collaboration with EPCs and equipment vendors to reduce cost• Value/re-engineering by EPCs and owner’s engineer
• Lean owner organisation structure • Project technical specialists outsourced with project objectives KPIs• Engineering and construction management support from owner’s
engineer
• All licenses and permits in place• Packaging philosophy - minimum number of orders• Contract quality and contract management
• Latest technologies – Woodgrove SFR for flotation• Increased recoveries/reduced resource consumptions• Digitalisation roadmap.
1
5
4
3
2
Gamsberg Phase 1 – Project Execution Philosophy
VEDANTA ZINC DAY AUGUST 2017
Gamsberg Project Progress on Target for First Production by Mid CY2018
32
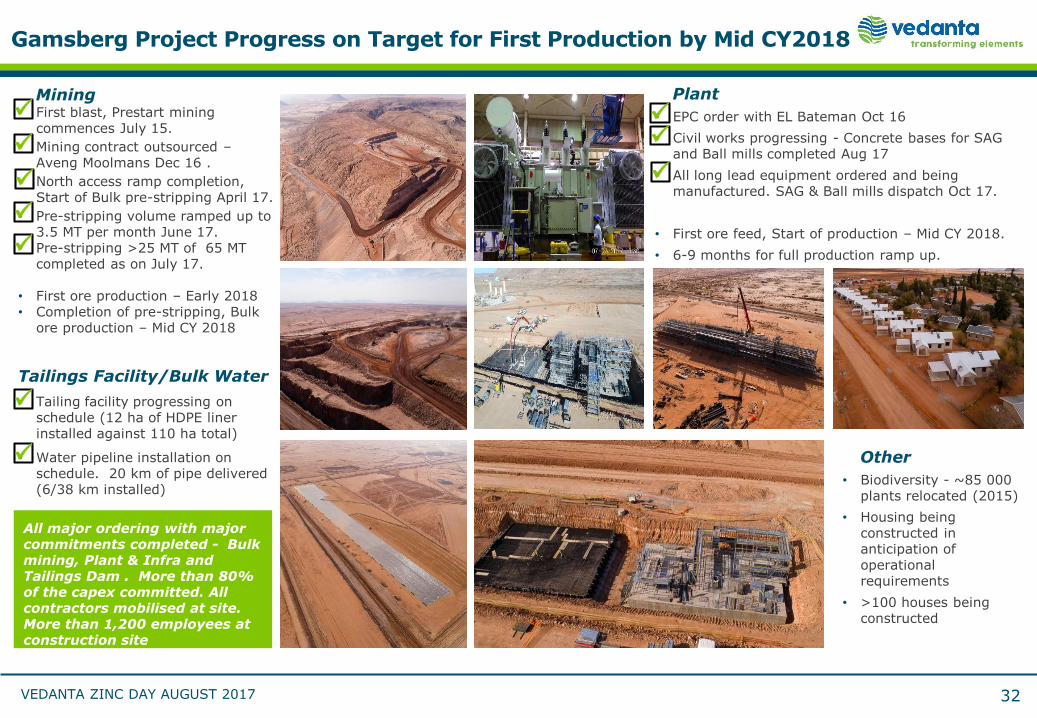
Mining• First blast, Prestart mining
commences July 15.
• Mining contract outsourced –Aveng Moolmans Dec 16 .
• North access ramp completion, Start of Bulk pre-stripping April 17.
• Pre-stripping volume ramped up to 3.5 MT per month June 17.
• Pre-stripping >25 MT of 65 MT completed as on July 17.
• First ore production – Early 2018• Completion of pre-stripping, Bulk
ore production – Mid CY 2018
Tailings Facility/Bulk Water
• Tailing facility progressing on schedule (12 ha of HDPE liner installed against 110 ha total)
• Water pipeline installation on schedule. 20 km of pipe delivered (6/38 km installed)
Plant
• EPC order with EL Bateman Oct 16
• Civil works progressing - Concrete bases for SAG and Ball mills completed Aug 17
• All long lead equipment ordered and being manufactured. SAG & Ball mills dispatch Oct 17.
• First ore feed, Start of production – Mid CY 2018.
• 6-9 months for full production ramp up.
Other
• Biodiversity - ~85 000 plants relocated (2015)
• Housing being constructed in anticipation of operational requirements
• >100 houses being constructed
All major ordering with major commitments completed - Bulk mining, Plant & Infra and Tailings Dam . More than 80% of the capex committed. All contractors mobilised at site. More than 1,200 employees at construction site
VEDANTA ZINC DAY AUGUST 2017
Gamsberg Phase 2 is Enabled by Phase 1
33
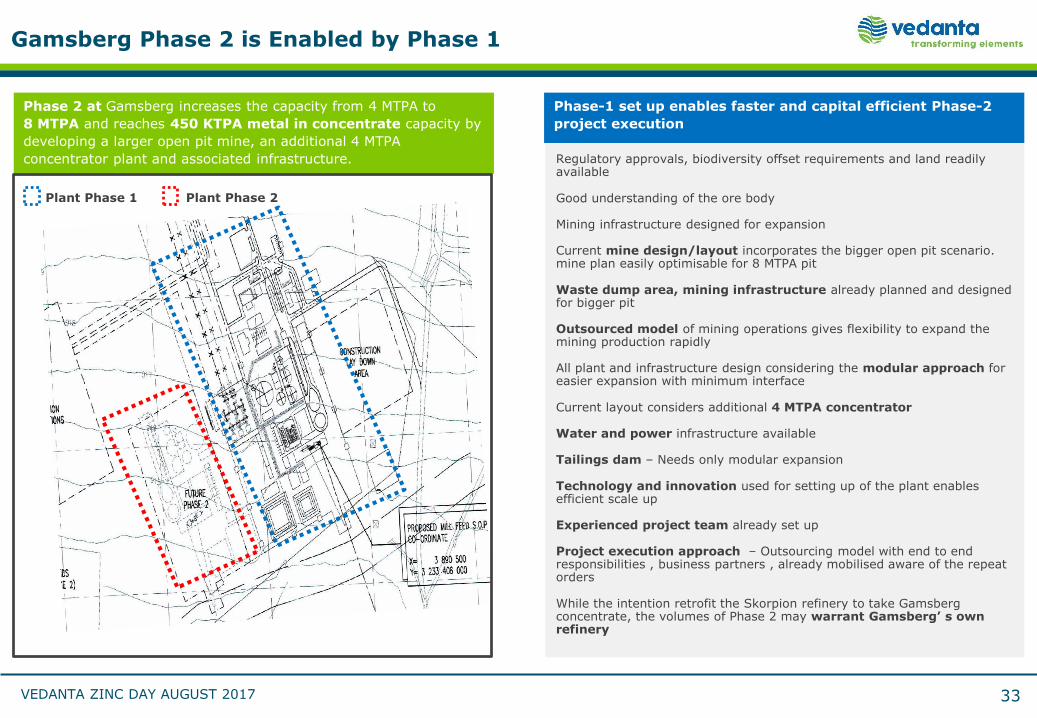
Phase-1 set up enables faster and capital efficient Phase-2
project execution
Regulatory approvals, biodiversity offset requirements and land readily available
Good understanding of the ore body
Mining infrastructure designed for expansion
Current mine design/layout incorporates the bigger open pit scenario. mine plan easily optimisable for 8 MTPA pit
Waste dump area, mining infrastructure already planned and designed for bigger pit
Outsourced model of mining operations gives flexibility to expand the mining production rapidly
All plant and infrastructure design considering the modular approach for easier expansion with minimum interface
Current layout considers additional 4 MTPA concentrator
Water and power infrastructure available
Tailings dam – Needs only modular expansion
Technology and innovation used for setting up of the plant enables efficient scale up
Experienced project team already set up
Project execution approach – Outsourcing model with end to end responsibilities , business partners , already mobilised aware of the repeat orders
While the intention retrofit the Skorpion refinery to take Gamsberg concentrate, the volumes of Phase 2 may warrant Gamsberg’ s own refinery
Phase 2 at Gamsberg increases the capacity from 4 MTPA to
8 MTPA and reaches 450 KTPA metal in concentrate capacity by
developing a larger open pit mine, an additional 4 MTPA
concentrator plant and associated infrastructure.
Plant Phase 1 Plant Phase 2
VEDANTA ZINC DAY AUGUST 2017 34
Andre Trytsman - GM
BMM –Enabling a world class Zn complex
06
34
VEDANTA ZINC DAY AUGUST 2017 35
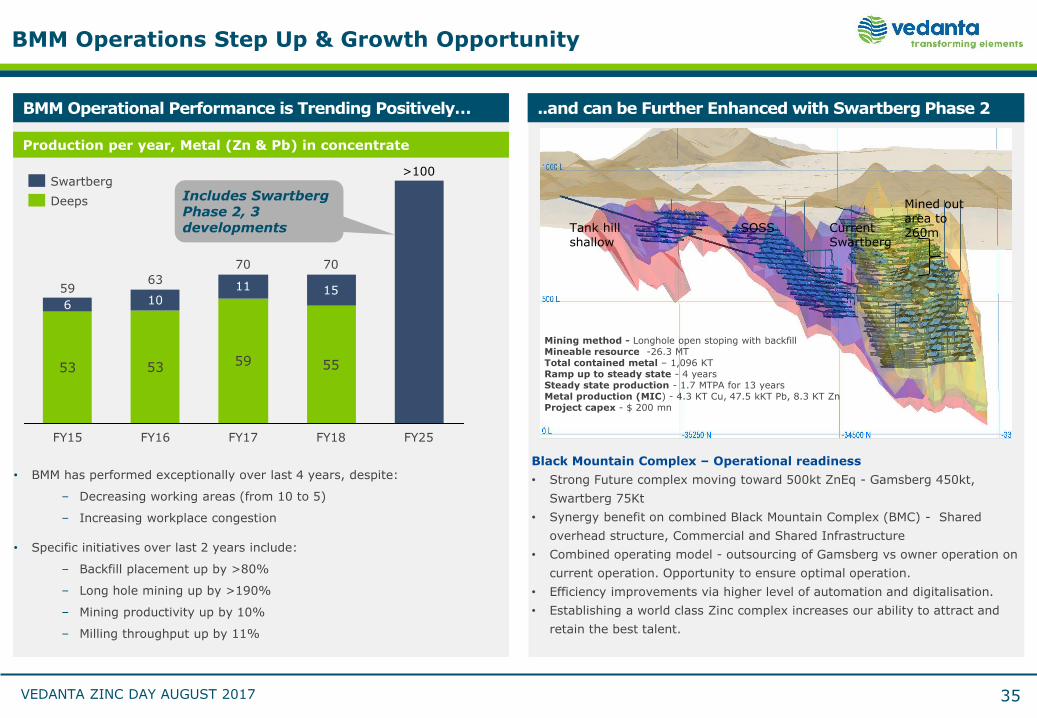
• BMM has performed exceptionally over last 4 years, despite:
‒ Decreasing working areas (from 10 to 5)
‒ Increasing workplace congestion
• Specific initiatives over last 2 years include:
‒ Backfill placement up by >80%
‒ Long hole mining up by >190%
‒ Mining productivity up by 10%
‒ Milling throughput up by 11%
Mined out area to 260m Tank hill
shallowSOSS Current
Swartberg
BMM Operations Step Up & Growth Opportunity
Mining method - Longhole open stoping with backfillMineable resource -26.3 MTTotal contained metal – 1,096 KTRamp up to steady state - 4 yearsSteady state production - 1.7 MTPA for 13 yearsMetal production (MIC) - 4.3 KT Cu, 47.5 kKT Pb, 8.3 KT ZnProject capex - $ 200 mn
Black Mountain Complex – Operational readiness
• Strong Future complex moving toward 500kt ZnEq - Gamsberg 450kt,
Swartberg 75Kt
• Synergy benefit on combined Black Mountain Complex (BMC) - Shared
overhead structure, Commercial and Shared Infrastructure
• Combined operating model - outsourcing of Gamsberg vs owner operation on
current operation. Opportunity to ensure optimal operation.
• Efficiency improvements via higher level of automation and digitalisation.
• Establishing a world class Zinc complex increases our ability to attract and
retain the best talent.
BMM Operational Performance is Trending Positively… ..and can be Further Enhanced with Swartberg Phase 2
6
15
>100
FY25FY18FY17
70
11
59
63
FY16
53 55
10
FY15
70
59
53
Production per year, Metal (Zn & Pb) in concentrate
Includes SwartbergPhase 2, 3 developments
Deeps
Swartberg
VEDANTA ZINC DAY AUGUST 2017 36
Irvinne Simataa - GM
Skorpion -Surpassing LOM expectations
07
36
VEDANTA ZINC DAY AUGUST 2017
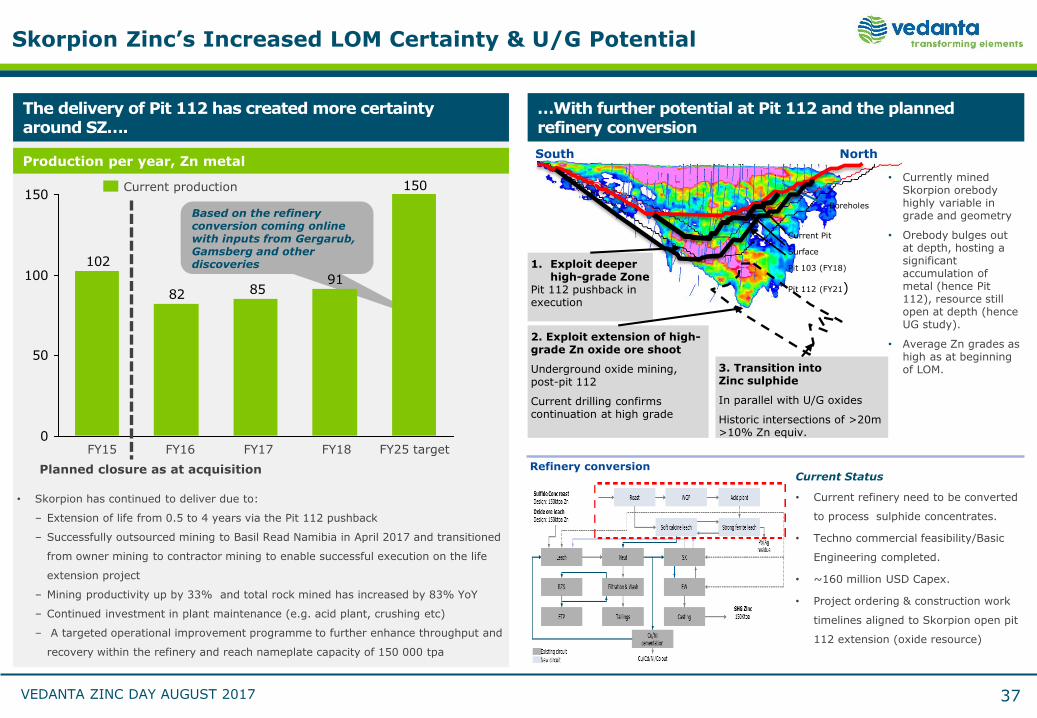
Skorpion Zinc’s Increased LOM Certainty & U/G Potential
37
The delivery of Pit 112 has created more certainty around SZ….
…With further potential at Pit 112 and the planned refinery conversion
• Skorpion has continued to deliver due to:
‒ Extension of life from 0.5 to 4 years via the Pit 112 pushback
‒ Successfully outsourced mining to Basil Read Namibia in April 2017 and transitioned
from owner mining to contractor mining to enable successful execution on the life
extension project
‒ Mining productivity up by 33% and total rock mined has increased by 83% YoY
‒ Continued investment in plant maintenance (e.g. acid plant, crushing etc)
‒ A targeted operational improvement programme to further enhance throughput and
recovery within the refinery and reach nameplate capacity of 150 000 tpa
Based on the refinery conversion coming online with inputs from Gergarub, Gamsberg and other discoveries
150
918582
102
0
50
100
150
FY17FY16FY15 FY18 FY25 target
Planned closure as at acquisition
Current production
Production per year, Zn metal
Current Status
• Current refinery need to be converted
to process sulphide concentrates.
• Techno commercial feasibility/Basic
Engineering completed.
• ~160 million USD Capex.
• Project ordering & construction work
timelines aligned to Skorpion open pit
112 extension (oxide resource)
Refinery conversion
Current Pit
Surface
Pit 103 (FY18)
Pit 112 (FY21)
1. Exploit deeper high-grade Zone
Pit 112 pushback in execution
Boreholes
2. Exploit extension of high-grade Zn oxide ore shoot
Underground oxide mining, post-pit 112
Current drilling confirms continuation at high grade
NorthSouth
3. Transition intoZinc sulphide
In parallel with U/G oxides
Historic intersections of >20m >10% Zn equiv.
• Currently mined Skorpion orebody highly variable in grade and geometry
• Orebody bulges out at depth, hosting a significant accumulation of metal (hence Pit 112), resource still open at depth (hence UG study).
• Average Zn grades as high as at beginning of LOM.
VEDANTA ZINC DAY AUGUST 2017 38
Dave Payne – Head of D&T
Digitalization & Technology - Driving efficient growth
08
38
VEDANTA ZINC DAY AUGUST 2017
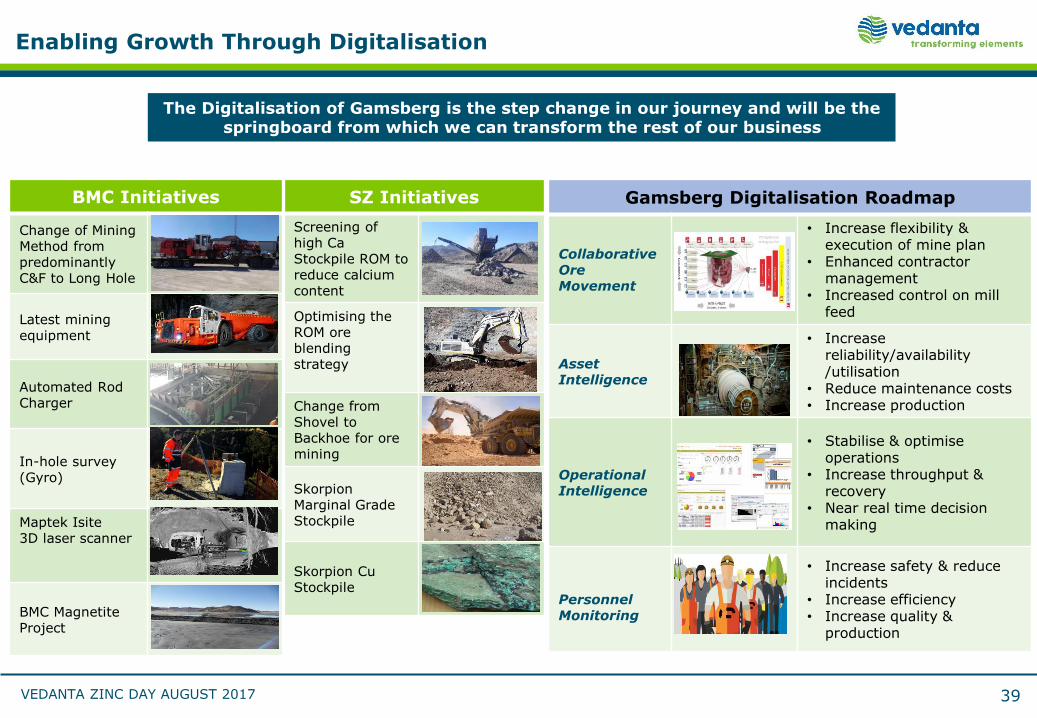
Enabling Growth Through Digitalisation
BMC Initiatives
Change of Mining Method from predominantly C&F to Long Hole
Latest mining equipment
Automated Rod Charger
In-hole survey (Gyro)
Maptek Isite3D laser scanner
BMC Magnetite Project
SZ Initiatives
Screening of high Ca Stockpile ROM to reduce calcium content
Optimising the ROM ore blendingstrategy
Change from Shovel to Backhoe for ore mining
SkorpionMarginal Grade Stockpile
Skorpion Cu Stockpile
The Digitalisation of Gamsberg is the step change in our journey and will be the springboard from which we can transform the rest of our business
Gamsberg Digitalisation Roadmap
Collaborative Ore Movement
• Increase flexibility & execution of mine plan
• Enhanced contractor management
• Increased control on mill feed
Asset Intelligence
• Increase reliability/availability /utilisation
• Reduce maintenance costs• Increase production
Operational Intelligence
• Stabilise & optimise operations
• Increase throughput & recovery
• Near real time decision making
Personnel Monitoring
• Increase safety & reduce incidents
• Increase efficiency• Increase quality &
production
39
VEDANTA ZINC DAY AUGUST 2017 40
Pushpender Singla – CFO
Financial outlook – The path forward
09
40
VEDANTA ZINC DAY AUGUST 2017
ZI Outlook
41
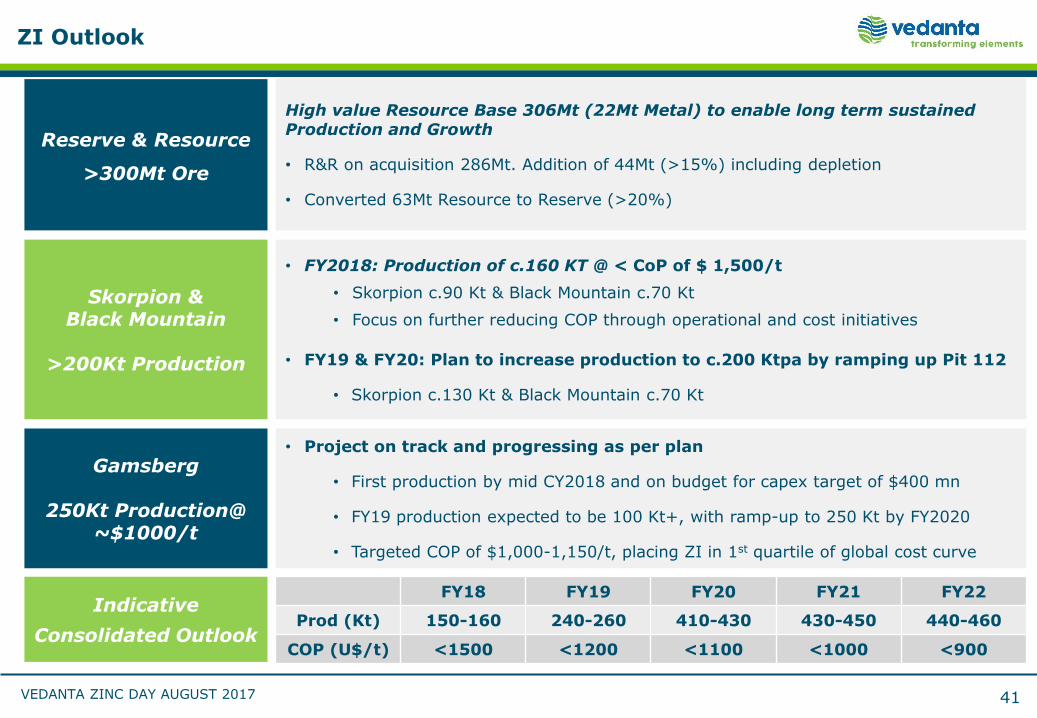
Skorpion & Black Mountain
>200Kt Production
• FY2018: Production of c.160 KT @ < CoP of $ 1,500/t
• Skorpion c.90 Kt & Black Mountain c.70 Kt
• Focus on further reducing COP through operational and cost initiatives
• FY19 & FY20: Plan to increase production to c.200 Ktpa by ramping up Pit 112
• Skorpion c.130 Kt & Black Mountain c.70 Kt
Gamsberg
250Kt Production@ ~$1000/t
• Project on track and progressing as per plan
• First production by mid CY2018 and on budget for capex target of $400 mn
• FY19 production expected to be 100 Kt+, with ramp-up to 250 Kt by FY2020
• Targeted COP of $1,000-1,150/t, placing ZI in 1st quartile of global cost curve
Reserve & Resource
>300Mt Ore
High value Resource Base 306Mt (22Mt Metal) to enable long term sustained Production and Growth
• R&R on acquisition 286Mt. Addition of 44Mt (>15%) including depletion
• Converted 63Mt Resource to Reserve (>20%)
Indicative
Consolidated Outlook
FY18 FY19 FY20 FY21 FY22
Prod (Kt) 150-160 240-260 410-430 430-450 440-460
COP (U$/t) <1500 <1200 <1100 <1000 <900
VEDANTA ZINC DAY AUGUST 2017
Gamsberg video
42
https://youtu.be/KKpDTXCszGU
VEDANTA ZINC DAY AUGUST 2017
Vedanta - Zinc Day Hindustan Zinc Limited30 August, 2017
V E D A N T A | Z I N C – L E A D – S I L V E R | O I L & G A S | A L U M I N I U M | C O P P E R | I R O N O R E | P O W E R
VEDANTA ZINC DAY AUGUST 2017
Hindustan Zinc - Agenda
44
Corporate OverviewAmitabh Gupta, CFO
Delivering 1.2 mtpaNaveen Singhal, Director Projects
Social Responsibility –Giving Back Neelima Khetan, Head CSR
Resource-Driven GrowthScott Caithness, Head Exploration
Way ForwardSunil Duggal, CEO
01
03
05
04
06
Q&A
Silver –Fastest Growing PortfolioSunil Duggal, CEO
02
Amitabh Gupta, CFO
Corporate Overview
01
VEDANTA ZINC DAY AUGUST 2017
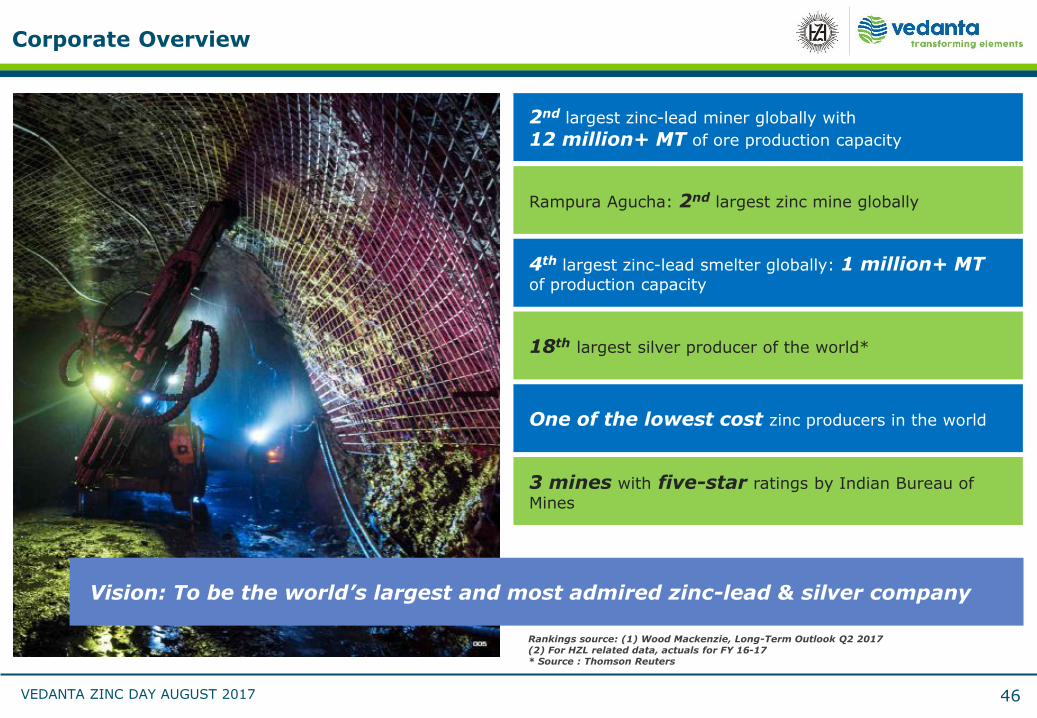
Corporate Overview
46
Rampura Agucha: 2nd largest zinc mine globally
2nd largest zinc-lead miner globally with
12 million+ MT of ore production capacity
4th largest zinc-lead smelter globally: 1 million+ MT of production capacity
18th largest silver producer of the world*
Rankings source: (1) Wood Mackenzie, Long-Term Outlook Q2 2017(2) For HZL related data, actuals for FY 16-17 * Source : Thomson Reuters
Vision: To be the world’s largest and most admired zinc-lead & silver company
One of the lowest cost zinc producers in the world
3 mines with five-star ratings by Indian Bureau of
Mines
VEDANTA ZINC DAY AUGUST 2017
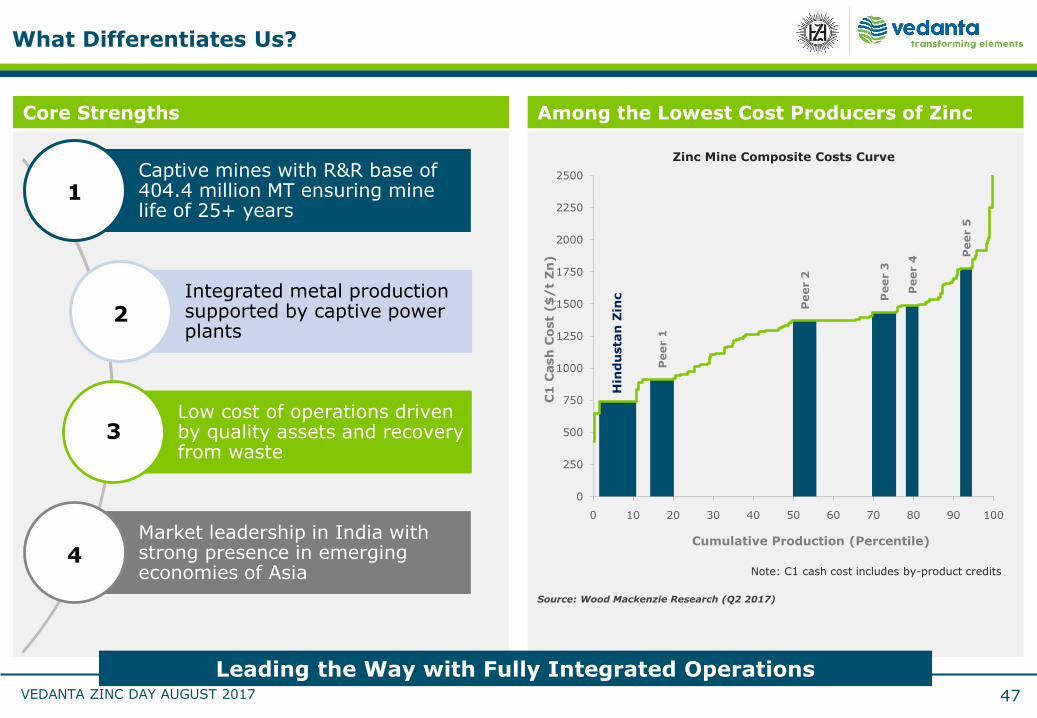
Core Strengths
Hin
du
sta
n Z
inc
Peer 1
Peer 2
Peer 3
Peer 4
Peer 5
0 10 20 30 40 50 60 70 80 90 100
0
250
500
750
1000
1250
1500
1750
2000
2250
2500
C1
Cash
Cost
($
/t
Zn
)Cumulative Production (Percentile)
Zinc Mine Composite Costs Curve
Captive mines with R&R base of 404.4 million MT ensuring mine life of 25+ years
Integrated metal production supported by captive power plants
Low cost of operations drivenby quality assets and recovery from waste
Market leadership in India with strong presence in emerging economies of Asia
What Differentiates Us?
47
Source: Wood Mackenzie Research (Q2 2017)
1
2
3
4
Leading the Way with Fully Integrated Operations
Among the Lowest Cost Producers of Zinc
Note: C1 cash cost includes by-product credits
VEDANTA ZINC DAY AUGUST 2017
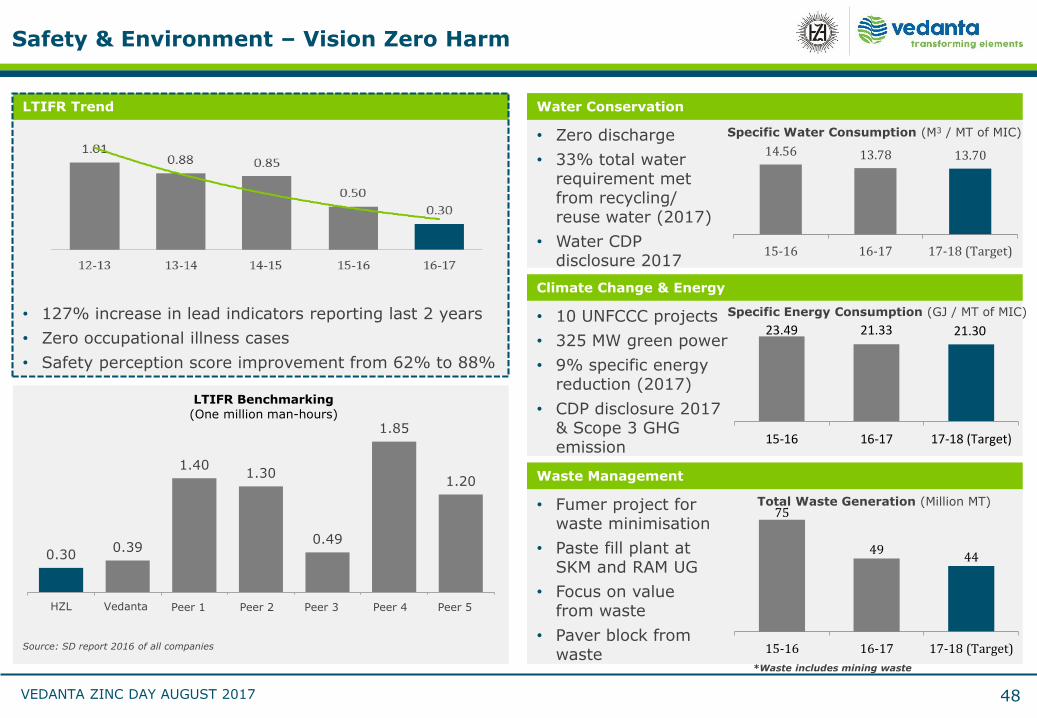
LTIFR Trend
Safety & Environment – Vision Zero Harm
• 127% increase in lead indicators reporting last 2 years
• Zero occupational illness cases
• Safety perception score improvement from 62% to 88%
0.300.39
1.401.30
0.49
1.85
1.20
HZL Vedanta GlencoreXstrata
Rio Tinto Vale AngloAmerican
Antofagasta
LTIFR Benchmarking
(One million man-hours)
Source: SD report 2016 of all companies
Water Conservation
• Zero discharge
• 33% total water requirement met from recycling/ reuse water (2017)
• Water CDP disclosure 2017
14.56 13.78 13.70
15-16 16-17 17-18 (Target)
Specific Water Consumption (M3 / MT of MIC)
Climate Change & Energy
• 10 UNFCCC projects
• 325 MW green power
• 9% specific energy reduction (2017)
• CDP disclosure 2017& Scope 3 GHG emission
Specific Energy Consumption (GJ / MT of MIC)
23.49 21.33 21.30
15-16 16-17 17-18 (Target)
Waste Management
• Fumer project for waste minimisation
• Paste fill plant at SKM and RAM UG
• Focus on value from waste
• Paver block from waste
75
4944
15-16 16-17 17-18 (Target)
Total Waste Generation (Million MT)
*Waste includes mining waste
48
Peer 1 Peer 2 Peer 3 Peer 4 Peer 5
VEDANTA ZINC DAY AUGUST 2017
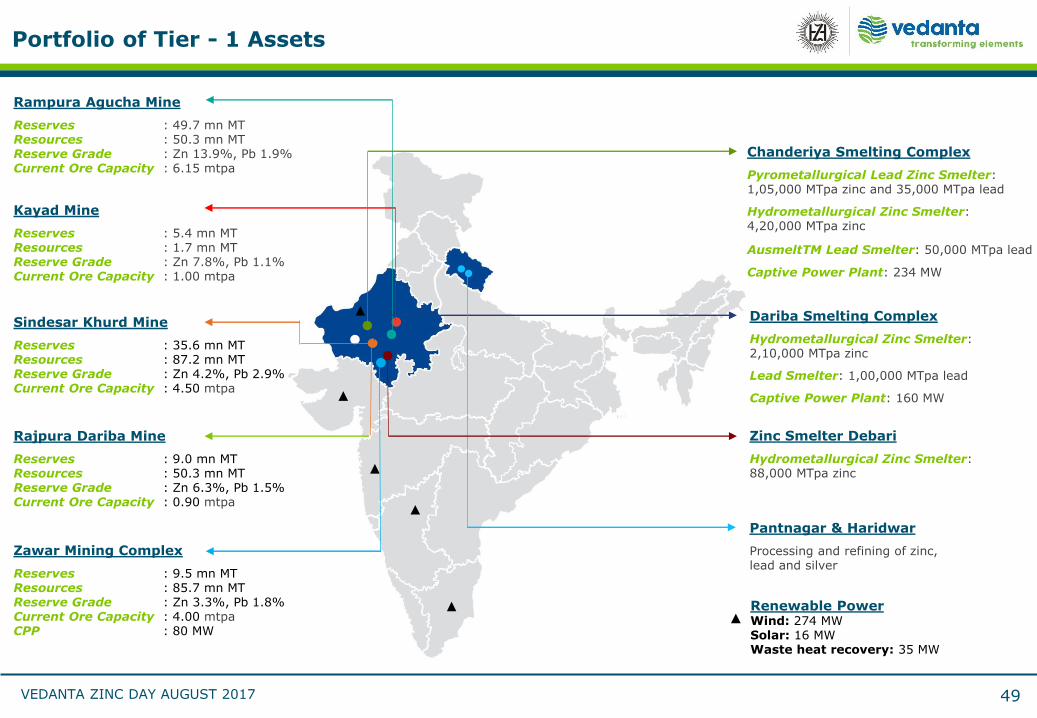
Portfolio of Tier - 1 Assets
49
Zawar Mining Complex
Reserves : 9.5 mn MT Resources : 85.7 mn MTReserve Grade : Zn 3.3%, Pb 1.8%Current Ore Capacity : 4.00 mtpaCPP : 80 MW
Renewable Power Wind: 274 MWSolar: 16 MWWaste heat recovery: 35 MW
Sindesar Khurd Mine
Reserves : 35.6 mn MTResources : 87.2 mn MTReserve Grade : Zn 4.2%, Pb 2.9%Current Ore Capacity : 4.50 mtpa
Rajpura Dariba Mine
Reserves : 9.0 mn MT Resources : 50.3 mn MTReserve Grade : Zn 6.3%, Pb 1.5%Current Ore Capacity : 0.90 mtpa
Rampura Agucha Mine
Reserves : 49.7 mn MTResources : 50.3 mn MTReserve Grade : Zn 13.9%, Pb 1.9%Current Ore Capacity : 6.15 mtpa
Kayad Mine
Reserves : 5.4 mn MTResources : 1.7 mn MTReserve Grade : Zn 7.8%, Pb 1.1%Current Ore Capacity : 1.00 mtpa
Chanderiya Smelting Complex
Pyrometallurgical Lead Zinc Smelter: 1,05,000 MTpa zinc and 35,000 MTpa lead
Hydrometallurgical Zinc Smelter: 4,20,000 MTpa zinc
AusmeltTM Lead Smelter: 50,000 MTpa lead
Captive Power Plant: 234 MW
Zinc Smelter Debari
Hydrometallurgical Zinc Smelter: 88,000 MTpa zinc
Dariba Smelting Complex
Hydrometallurgical Zinc Smelter: 2,10,000 MTpa zinc
Lead Smelter: 1,00,000 MTpa lead
Captive Power Plant: 160 MW
Pantnagar & Haridwar
Processing and refining of zinc, lead and silver
VEDANTA ZINC DAY AUGUST 2017
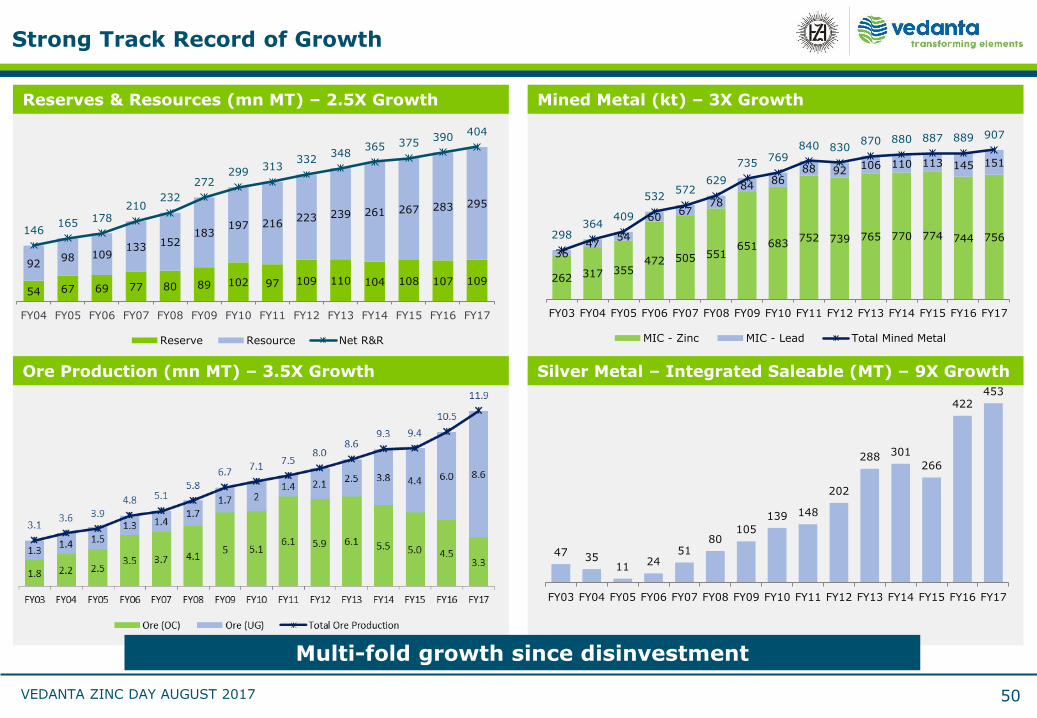
Mined Metal (kt) – 3X GrowthReserves & Resources (mn MT) – 2.5X Growth
Strong Track Record of Growth
50
54 67 69 77 80 89 102 97 109 110 104 108 107 109
9298 109
133 152183
197 216223 239 261 267 283 295
146165 178
210232
272299
313332
348365 375
390404
FY04 FY05 FY06 FY07 FY08 FY09 FY10 FY11 FY12 FY13 FY14 FY15 FY16 FY17
Reserve Resource Net R&R
262 317 355472 505 551
651 683752 739 765 770 774 744 756
3647
54
6067
78
8486
88 92106 110 113 145 151
298364
409
532572
629
735769
840 830870 880 887 889 907
FY03 FY04 FY05 FY06 FY07 FY08 FY09 FY10 FY11 FY12 FY13 FY14 FY15 FY16 FY17
MIC - Zinc MIC - Lead Total Mined Metal
47 3511
2451
80105
139 148
202
288 301
266
422453
FY03 FY04 FY05 FY06 FY07 FY08 FY09 FY10 FY11 FY12 FY13 FY14 FY15 FY16 FY17
Ore Production (mn MT) – 3.5X Growth Silver Metal – Integrated Saleable (MT) – 9X Growth
Multi-fold growth since disinvestment
VEDANTA ZINC DAY AUGUST 2017
-
5.00
10.00
15.00
20.00
25.00
FY02
FY03
FY04
FY05
FY06
FY07
FY08
FY09
FY10
FY11
FY12
FY13
FY14
FY15
FY16
FY17
PAT Rs. bn
-
10.00
20.00
30.00
40.00
50.00
60.00
70.00
80.00
90.00
FY02
FY03
FY04
FY05
FY06
FY07
FY08
FY09
FY10
FY11
FY12
FY13
FY14
FY15
FY16
FY17
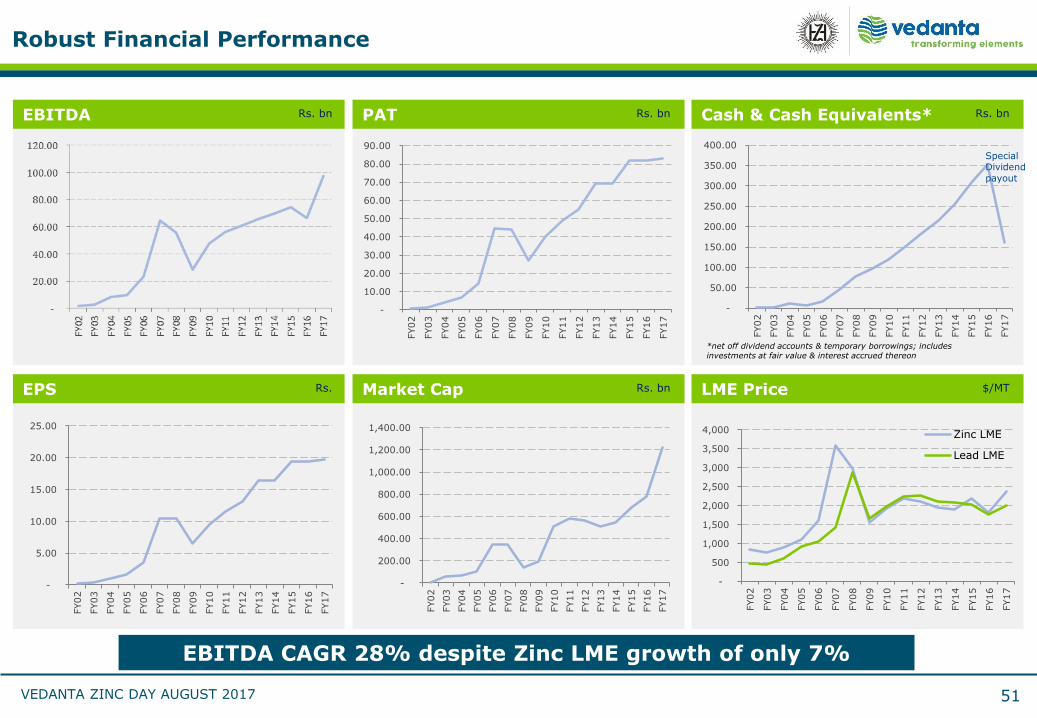
Robust Financial Performance
51
EBITDA CAGR 28% despite Zinc LME growth of only 7%
EBITDA Rs. bn Cash & Cash Equivalents* Rs. bn
-
50.00
100.00
150.00
200.00
250.00
300.00
350.00
400.00
FY02
FY03
FY04
FY05
FY06
FY07
FY08
FY09
FY10
FY11
FY12
FY13
FY14
FY15
FY16
FY17
Special Dividend payout
EPS Rs.
-
200.00
400.00
600.00
800.00
1,000.00
1,200.00
1,400.00FY02
FY03
FY04
FY05
FY06
FY07
FY08
FY09
FY10
FY11
FY12
FY13
FY14
FY15
FY16
FY17
Market Cap Rs. bn
-
500
1,000
1,500
2,000
2,500
3,000
3,500
4,000
FY02
FY03
FY04
FY05
FY06
FY07
FY08
FY09
FY10
FY11
FY12
FY13
FY14
FY15
FY16
FY17
Zinc LME
Lead LME
LME Price $/MT
*net off dividend accounts & temporary borrowings; includes investments at fair value & interest accrued thereon
VEDANTA ZINC DAY AUGUST 2017
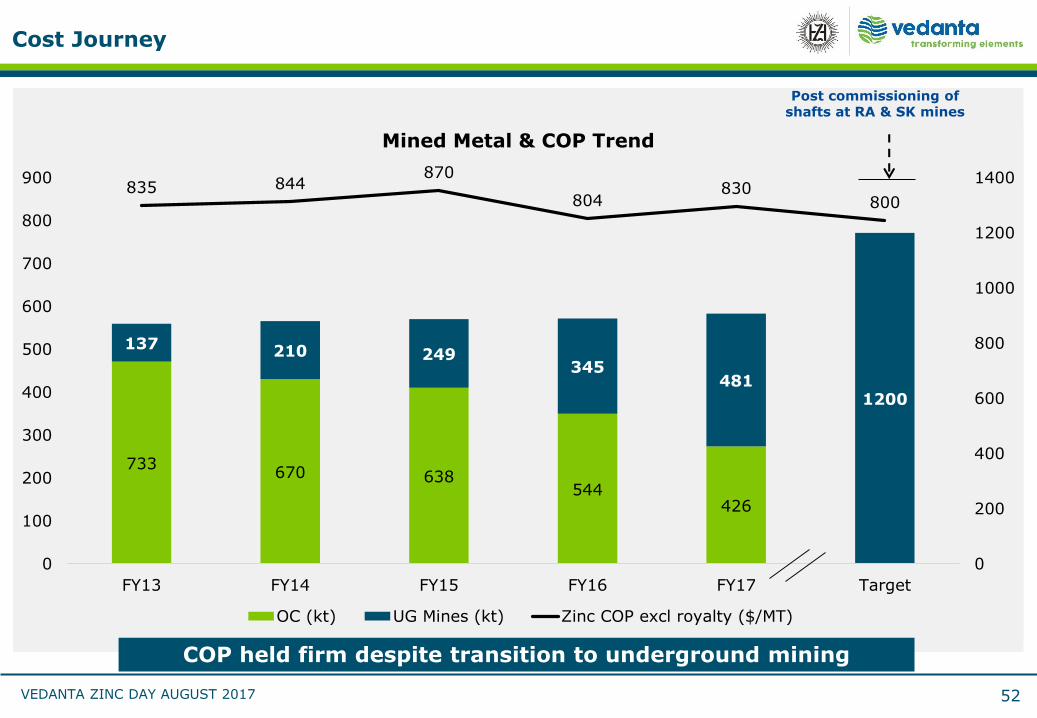
Cost Journey
52
kt
COP held firm despite transition to underground mining
Post commissioning of shafts at RA & SK mines
733670 638
544426
137 210 249345
4811200
835 844870
804830
800
0
200
400
600
800
1000
1200
1400
0
100
200
300
400
500
600
700
800
900
FY13 FY14 FY15 FY16 FY17 Target
Mined Metal & COP Trend
OC (kt) UG Mines (kt) Zinc COP excl royalty ($/MT)
Corporate Social Responsibility
02
Neelima KhetanHead CSR
VEDANTA ZINC DAY AUGUST 2017
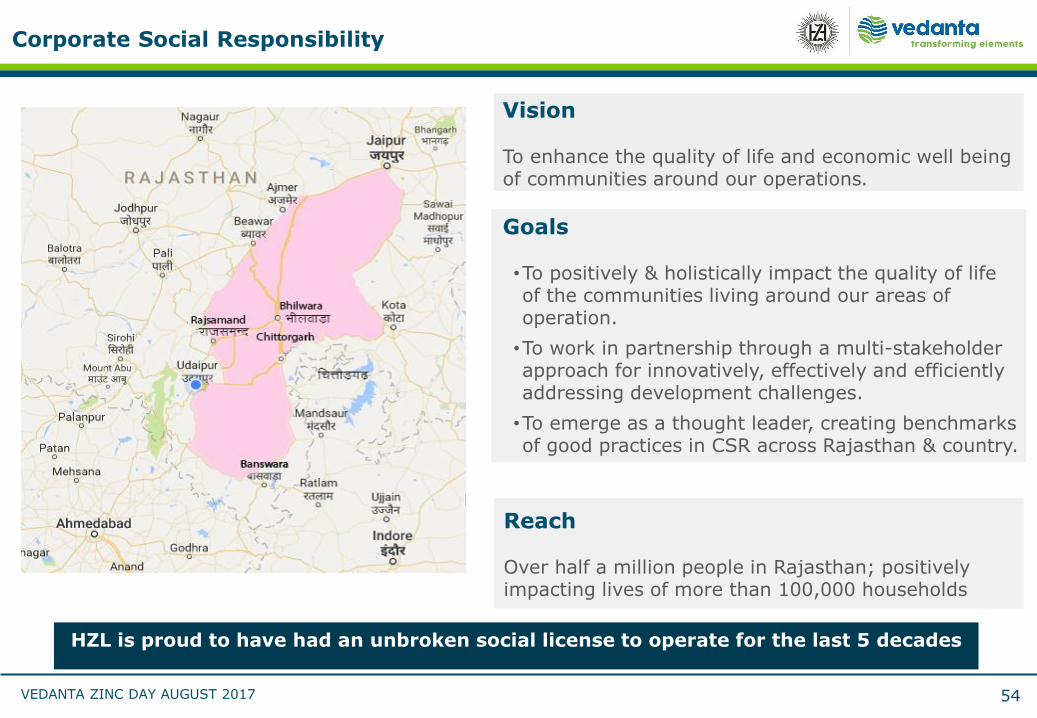
Corporate Social Responsibility
54
Reach
Over half a million people in Rajasthan; positively impacting lives of more than 100,000 households
Vision
To enhance the quality of life and economic well being of communities around our operations.
Goals
•To positively & holistically impact the quality of life of the communities living around our areas of operation.
•To work in partnership through a multi-stakeholder approach for innovatively, effectively and efficiently addressing development challenges.
•To emerge as a thought leader, creating benchmarks of good practices in CSR across Rajasthan & country.
HZL is proud to have had an unbroken social license to operate for the last 5 decades
VEDANTA ZINC DAY AUGUST 2017
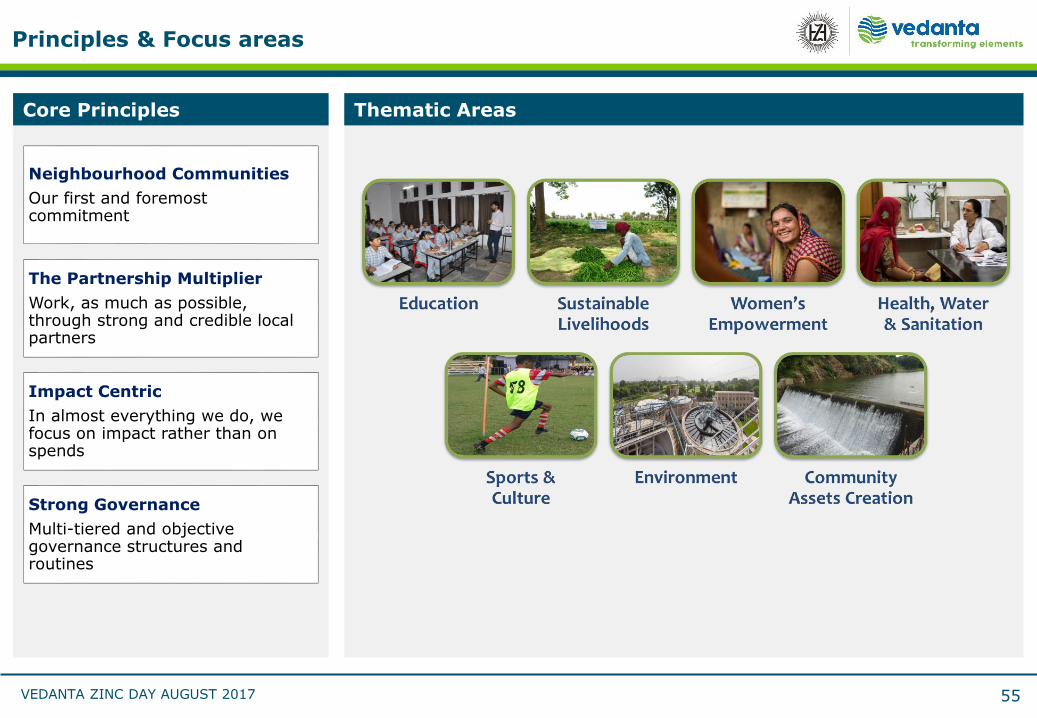
Principles & Focus areas
55
Neighbourhood Communities
Our first and foremost commitment
The Partnership Multiplier
Work, as much as possible, through strong and credible local partners
Impact Centric
In almost everything we do, we focus on impact rather than on spends
Strong Governance
Multi-tiered and objective governance structures and routines
Core Principles Thematic Areas
VEDANTA ZINC DAY AUGUST 2017
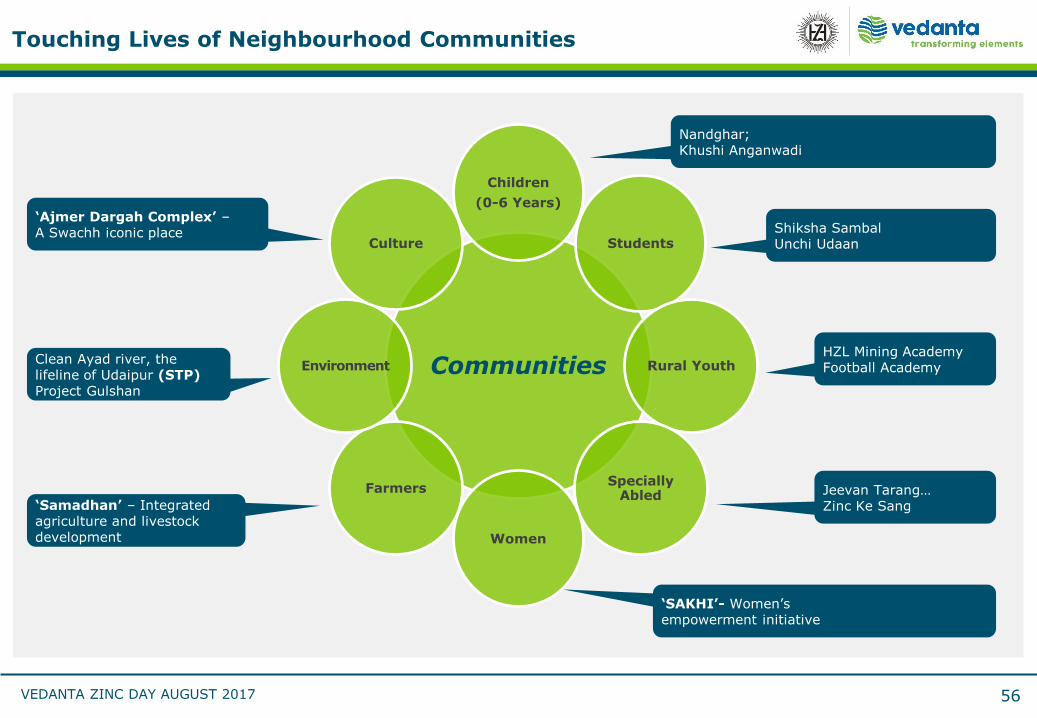
Touching Lives of Neighbourhood Communities
56
Communities
Children
(0-6 Years)
Students
Rural Youth
Specially Abled
Women
Farmers
Environment
Culture
Nandghar; Khushi Anganwadi
Shiksha SambalUnchi Udaan
‘SAKHI’- Women’sempowerment initiative
‘Samadhan’ – Integrated agriculture and livestock development
Clean Ayad river, the lifeline of Udaipur (STP)Project Gulshan
‘Ajmer Dargah Complex’ –A Swachh iconic place
Jeevan Tarang…Zinc Ke Sang
HZL Mining AcademyFootball Academy
Delivering1.2 mtpa
03
VEDANTA ZINC DAY AUGUST 2017
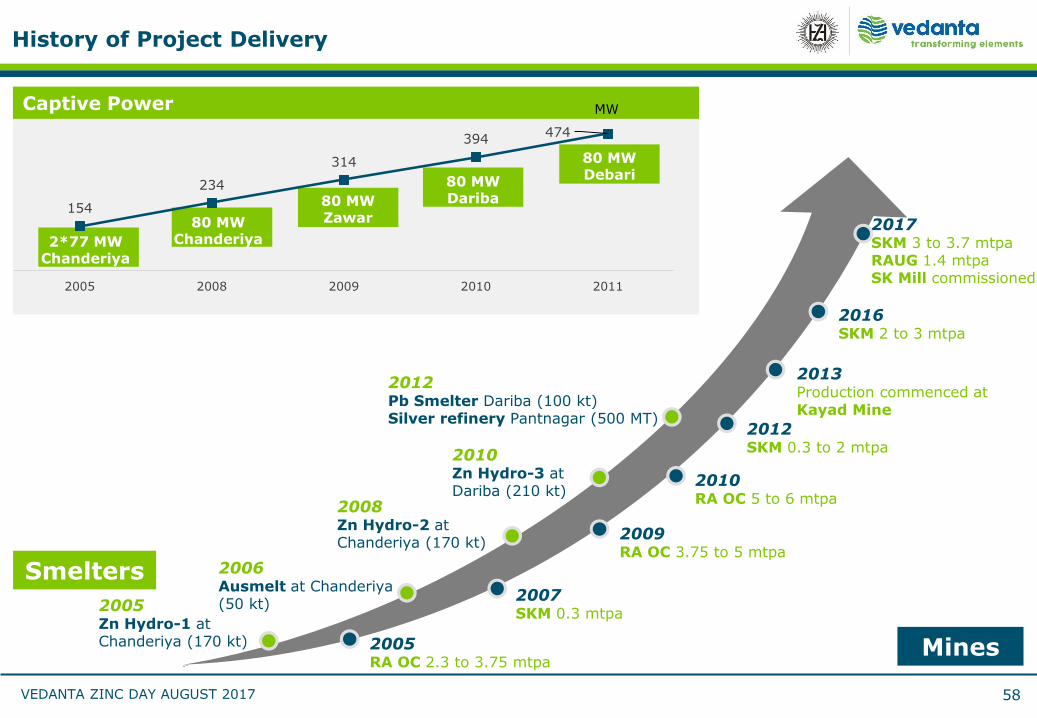
History of Project Delivery
58
2005Zn Hydro-1 at Chanderiya (170 kt)
2006Ausmelt at Chanderiya(50 kt)
2008Zn Hydro-2 at Chanderiya (170 kt)
2010Zn Hydro-3 at Dariba (210 kt)
2012Pb Smelter Dariba (100 kt)Silver refinery Pantnagar (500 MT)
2007SKM 0.3 mtpa
2009RA OC 3.75 to 5 mtpa
2013Production commenced at Kayad Mine
2012SKM 0.3 to 2 mtpa
2017SKM 3 to 3.7 mtpaRAUG 1.4 mtpaSK Mill commissioned
2010RA OC 5 to 6 mtpa
Smelters
Mines
2016SKM 2 to 3 mtpa
2*77 MW Chanderiya
80 MW Chanderiya
80 MW Zawar
80 MW Dariba
80 MW Debari
Captive Power
MW
154
234
314
394474
2005 2008 2009 2010 2011
2005RA OC 2.3 to 3.75 mtpa
MW
VEDANTA ZINC DAY AUGUST 2017
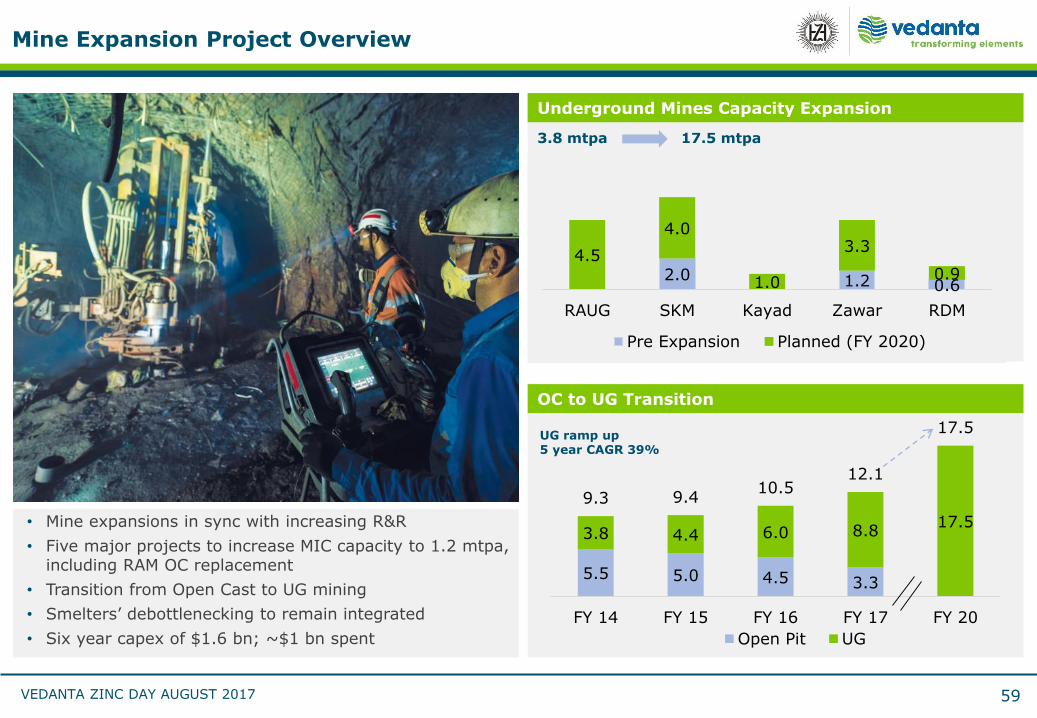
Mine Expansion Project Overview
59
• Mine expansions in sync with increasing R&R
• Five major projects to increase MIC capacity to 1.2 mtpa, including RAM OC replacement
• Transition from Open Cast to UG mining
• Smelters’ debottlenecking to remain integrated
• Six year capex of $1.6 bn; ~$1 bn spent
Underground Mines Capacity Expansion
3.8 mtpa 17.5 mtpa
2.0 1.2 0.6
4.5
4.0
1.0
3.3
0.9
RAUG SKM Kayad Zawar RDM
Pre Expansion Planned (FY 2020)
5.5 5.0 4.5 3.3
3.8 4.4 6.0 8.817.5
9.3 9.410.5
12.1
17.5
FY 14 FY 15 FY 16 FY 17 FY 20
Open Pit UG
UG ramp up 5 year CAGR 39%
OC to UG Transition
VEDANTA ZINC DAY AUGUST 2017
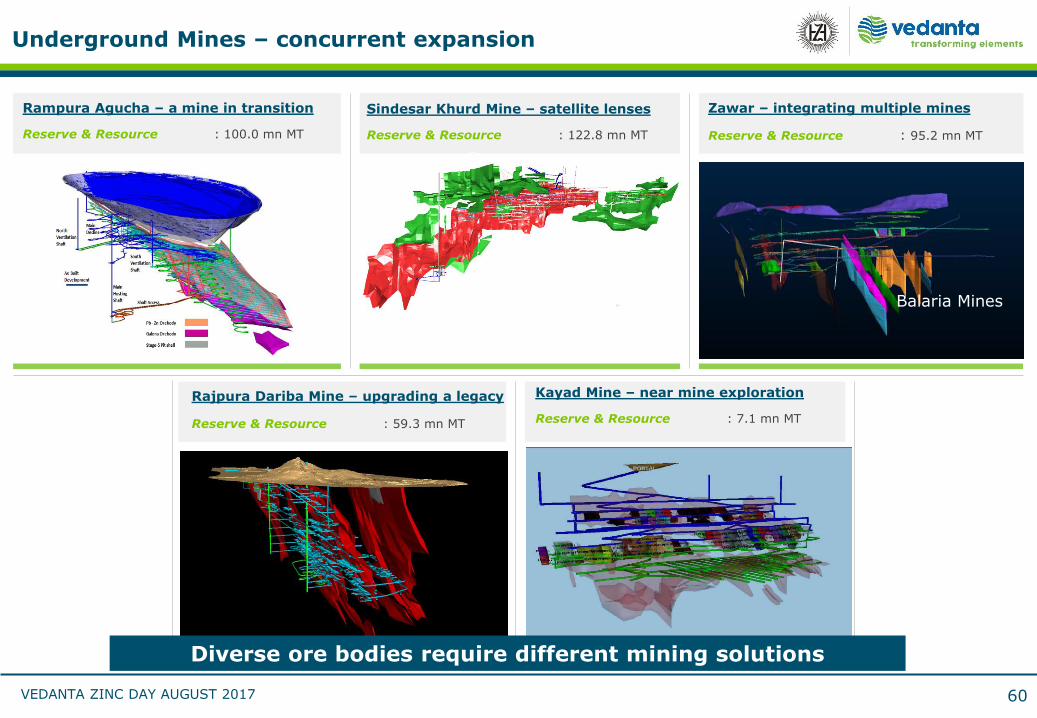
Underground Mines – concurrent expansion
Zawar – integrating multiple mines
Reserve & Resource : 95.2 mn MT
Sindesar Khurd Mine – satellite lenses
Reserve & Resource : 122.8 mn MT
Rampura Agucha – a mine in transition
Reserve & Resource : 100.0 mn MT
Balaria Mines
60
Rajpura Dariba Mine – upgrading a legacy
Reserve & Resource : 59.3 mn MT
Kayad Mine – near mine exploration
Reserve & Resource : 7.1 mn MT
Diverse ore bodies require different mining solutions
VEDANTA ZINC DAY AUGUST 2017
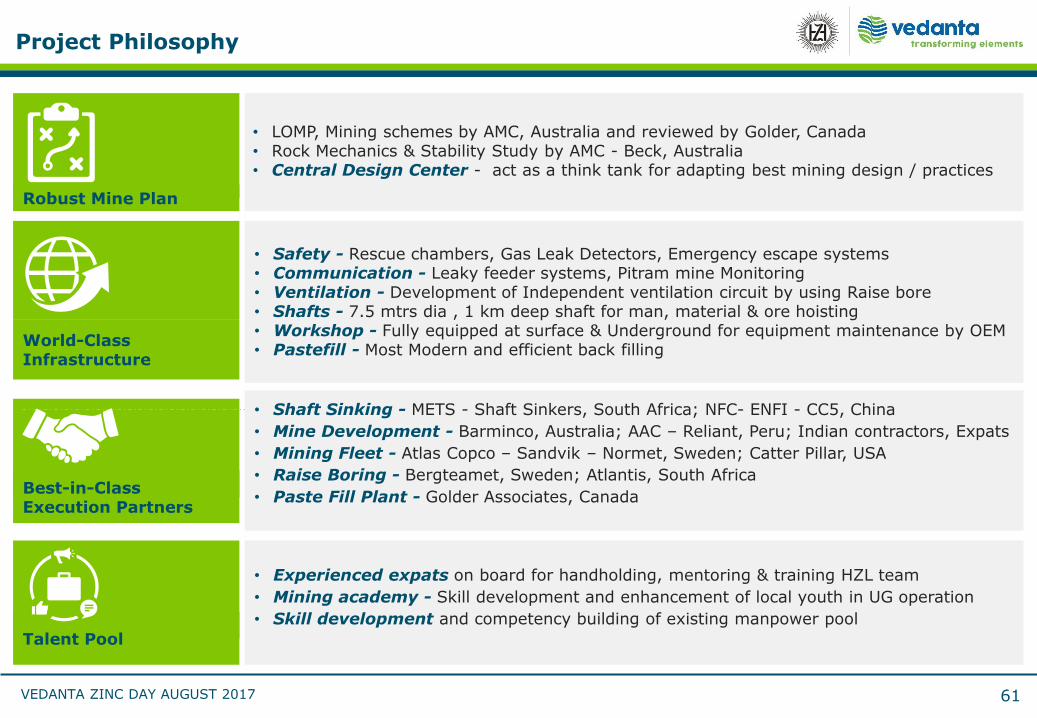
Project Philosophy
61
• LOMP, Mining schemes by AMC, Australia and reviewed by Golder, Canada• Rock Mechanics & Stability Study by AMC - Beck, Australia• Central Design Center - act as a think tank for adapting best mining design / practices
Robust Mine Plan
Best-in-Class Execution Partners
• Shaft Sinking - METS - Shaft Sinkers, South Africa; NFC- ENFI - CC5, China
• Mine Development - Barminco, Australia; AAC – Reliant, Peru; Indian contractors, Expats
• Mining Fleet - Atlas Copco – Sandvik – Normet, Sweden; Catter Pillar, USA
• Raise Boring - Bergteamet, Sweden; Atlantis, South Africa
• Paste Fill Plant - Golder Associates, Canada
Talent Pool
• Experienced expats on board for handholding, mentoring & training HZL team
• Mining academy - Skill development and enhancement of local youth in UG operation
• Skill development and competency building of existing manpower pool
• Safety - Rescue chambers, Gas Leak Detectors, Emergency escape systems• Communication - Leaky feeder systems, Pitram mine Monitoring • Ventilation - Development of Independent ventilation circuit by using Raise bore • Shafts - 7.5 mtrs dia , 1 km deep shaft for man, material & ore hoisting• Workshop - Fully equipped at surface & Underground for equipment maintenance by OEM• Pastefill - Most Modern and efficient back filling
World-Class Infrastructure
VEDANTA ZINC DAY AUGUST 2017
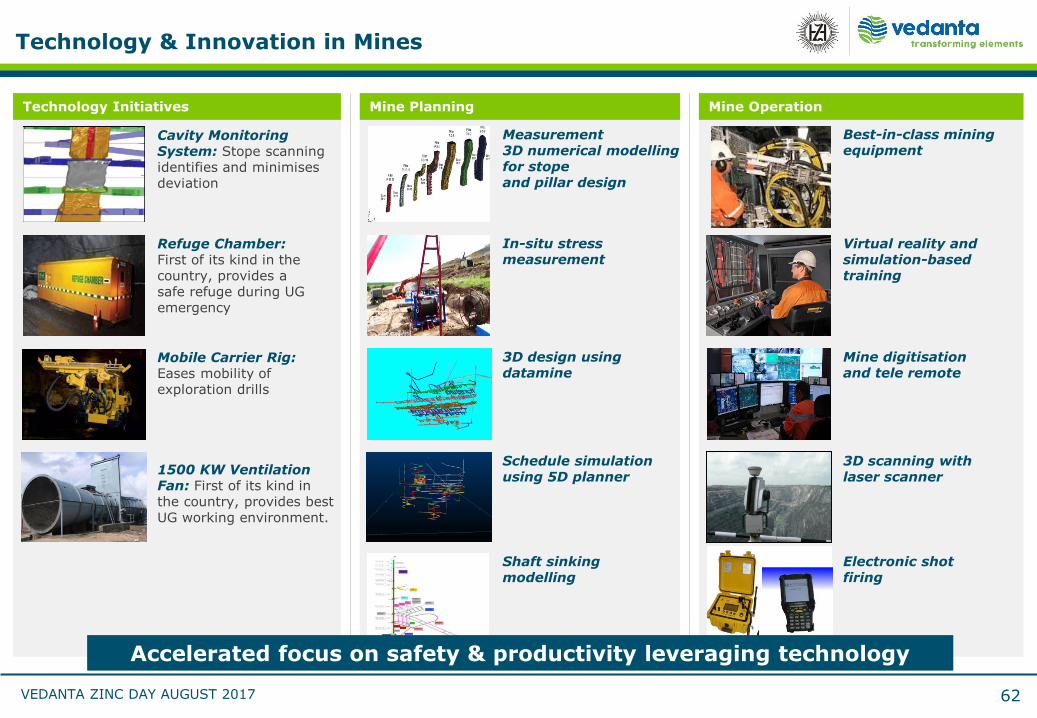
Technology & Innovation in Mines
62
Technology Initiatives Mine Planning Mine Operation
Cavity Monitoring System: Stope scanning identifies and minimisesdeviation
Refuge Chamber: First of its kind in the country, provides a safe refuge during UG emergency
Mobile Carrier Rig: Eases mobility of exploration drills
1500 KW Ventilation Fan: First of its kind in the country, provides best UG working environment.
Measurement3D numerical modellingfor stopeand pillar design
In-situ stress measurement
3D design using datamine
Schedule simulation using 5D planner
Shaft sinking modelling
Best-in-class mining equipment
Virtual reality and simulation-based training
Mine digitisationand tele remote
3D scanning with laser scanner
Electronic shot firing
Accelerated focus on safety & productivity leveraging technology
VEDANTA ZINC DAY AUGUST 2017
Phase 2 : December 2018
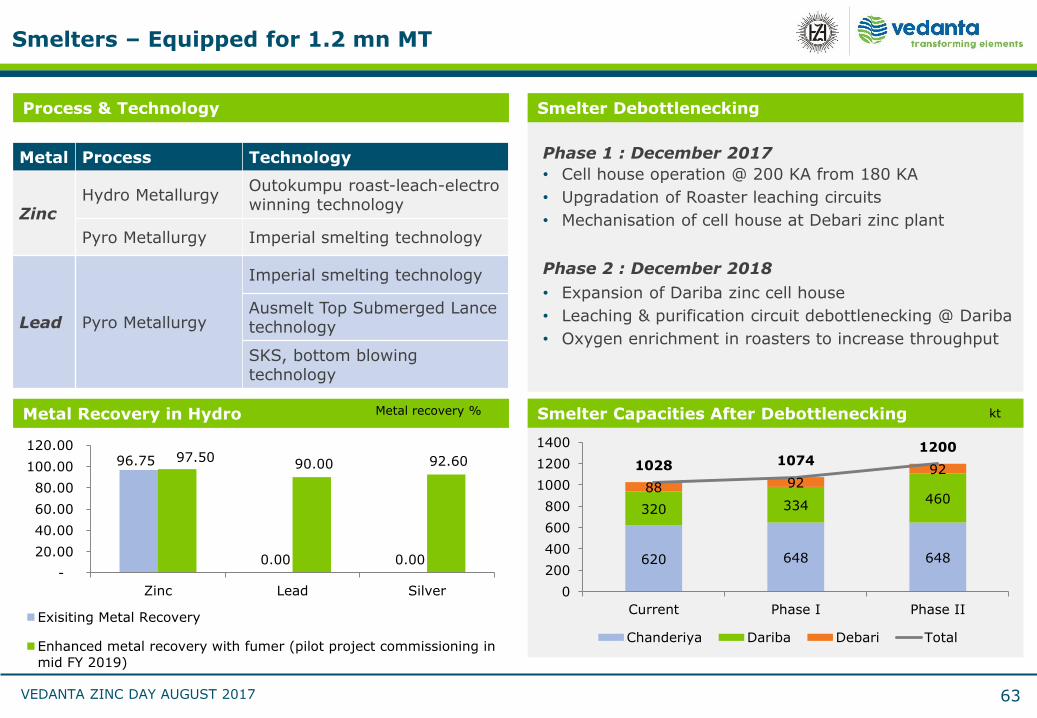
Smelters – Equipped for 1.2 mn MT
63
Smelter DebottleneckingProcess & Technology
Metal Process Technology
ZincHydro Metallurgy
Outokumpu roast-leach-electro winning technology
Pyro Metallurgy Imperial smelting technology
Lead Pyro Metallurgy
Imperial smelting technology
Ausmelt Top Submerged Lance technology
SKS, bottom blowing technology
• Cell house operation @ 200 KA from 180 KA
• Upgradation of Roaster leaching circuits
• Mechanisation of cell house at Debari zinc plant
• Expansion of Dariba zinc cell house
• Leaching & purification circuit debottlenecking @ Dariba
• Oxygen enrichment in roasters to increase throughput
Phase 1 : December 2017
Smelter Capacities After Debottlenecking ktMetal Recovery in Hydro
620 648 648
320 334460
88 92921028 1074
1200
0
200
400
600
800
1000
1200
1400
Current Phase I Phase II
Chanderiya Dariba Debari Total
96.75
0.00 0.00
97.50 90.00 92.60
-
20.00
40.00
60.00
80.00
100.00
120.00
Zinc Lead Silver
Exisiting Metal Recovery
Enhanced metal recovery with fumer (pilot project commissioning in
mid FY 2019)
Metal recovery %
Exploration04
Scott CaithnessHead Exploration
VEDANTA ZINC DAY AUGUST 2017
Exceptional Exploration Success
65
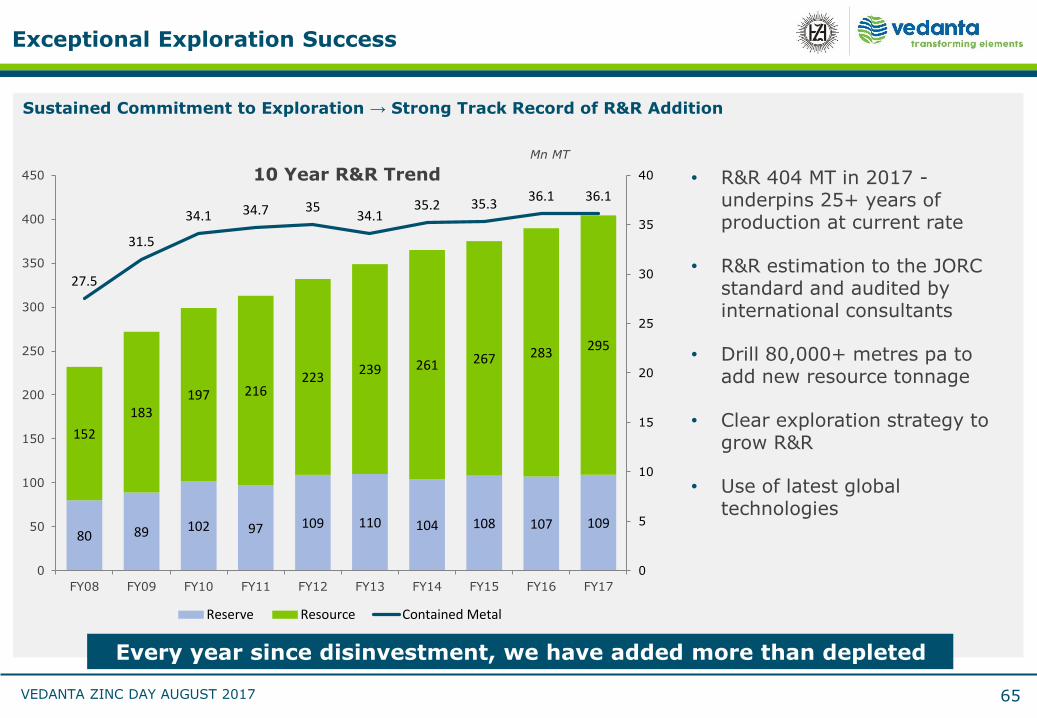
• R&R 404 MT in 2017 -underpins 25+ years of production at current rate
• R&R estimation to the JORC standard and audited by international consultants
• Drill 80,000+ metres pa to add new resource tonnage
• Clear exploration strategy to grow R&R
• Use of latest global technologies
80 89 102 97 109 110 104 108 107 109
152
183197 216
223239 261 267 283 295
27.5
31.5
34.1 34.7 3534.1
35.2 35.336.1 36.1
0
5
10
15
20
25
30
35
40
0
50
100
150
200
250
300
350
400
450
FY08 FY09 FY10 FY11 FY12 FY13 FY14 FY15 FY16 FY17
10 Year R&R Trend
Reserve Resource Contained Metal
Sustained Commitment to Exploration → Strong Track Record of R&R Addition
Mn MT
Every year since disinvestment, we have added more than depleted
VEDANTA ZINC DAY AUGUST 2017
Resource-Driven Growth
Zawar Targets
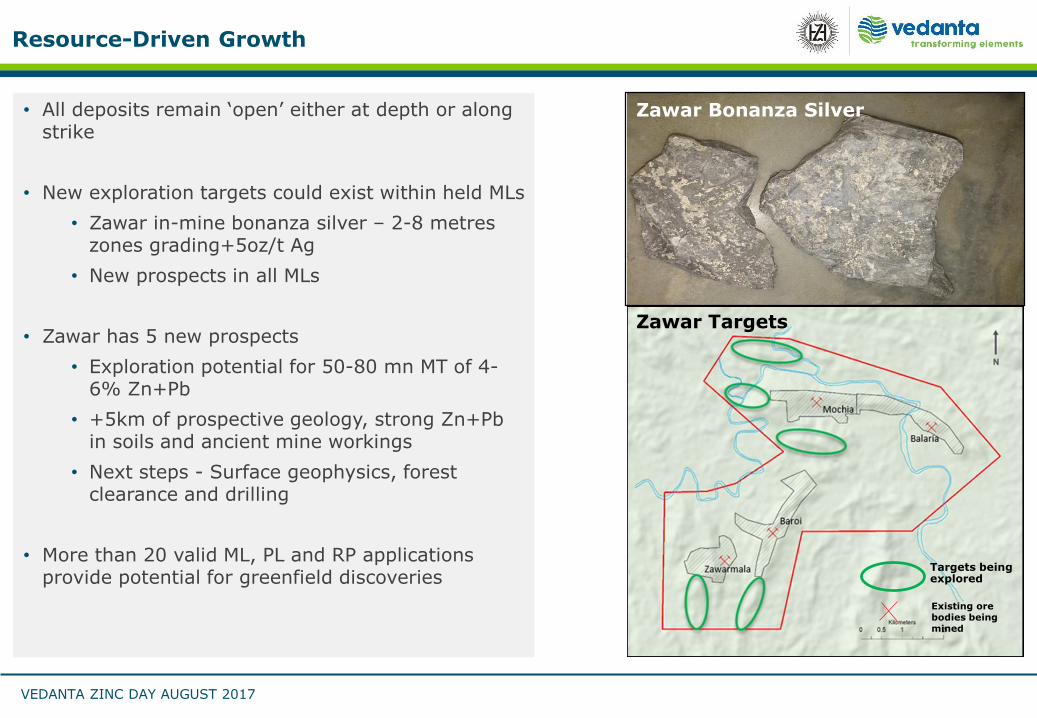
• All deposits remain ‘open’ either at depth or along strike
• New exploration targets could exist within held MLs
• Zawar in-mine bonanza silver – 2-8 metres zones grading+5oz/t Ag
• New prospects in all MLs
• Zawar has 5 new prospects
• Exploration potential for 50-80 mn MT of 4-6% Zn+Pb
• +5km of prospective geology, strong Zn+Pbin soils and ancient mine workings
• Next steps - Surface geophysics, forest clearance and drilling
• More than 20 valid ML, PL and RP applications provide potential for greenfield discoveries
Zawar Bonanza Silver
Existing ore bodies being mined
Targets being explored
VEDANTA ZINC DAY AUGUST 2017
Exploration Technologies
67
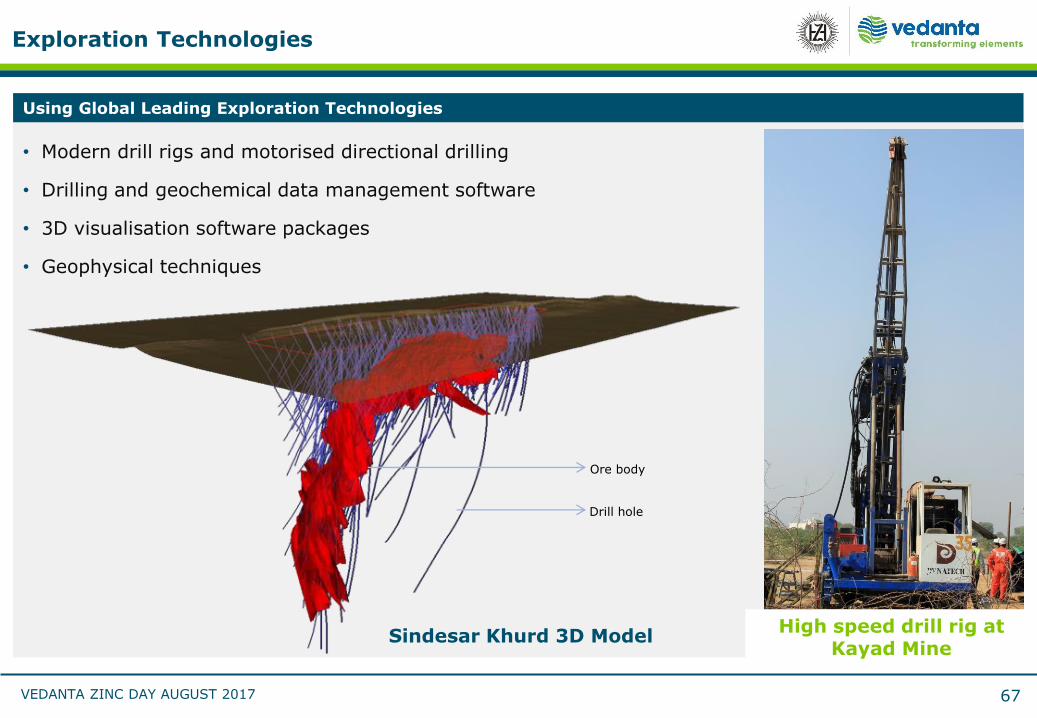
• Modern drill rigs and motorised directional drilling
• Drilling and geochemical data management software
• 3D visualisation software packages
• Geophysical techniques
Sindesar Khurd 3D Model
Using Global Leading Exploration Technologies
High speed drill rig at Kayad Mine
Ore body
Drill hole
Silver05
Sunil DuggalCEO
VEDANTA ZINC DAY AUGUST 2017
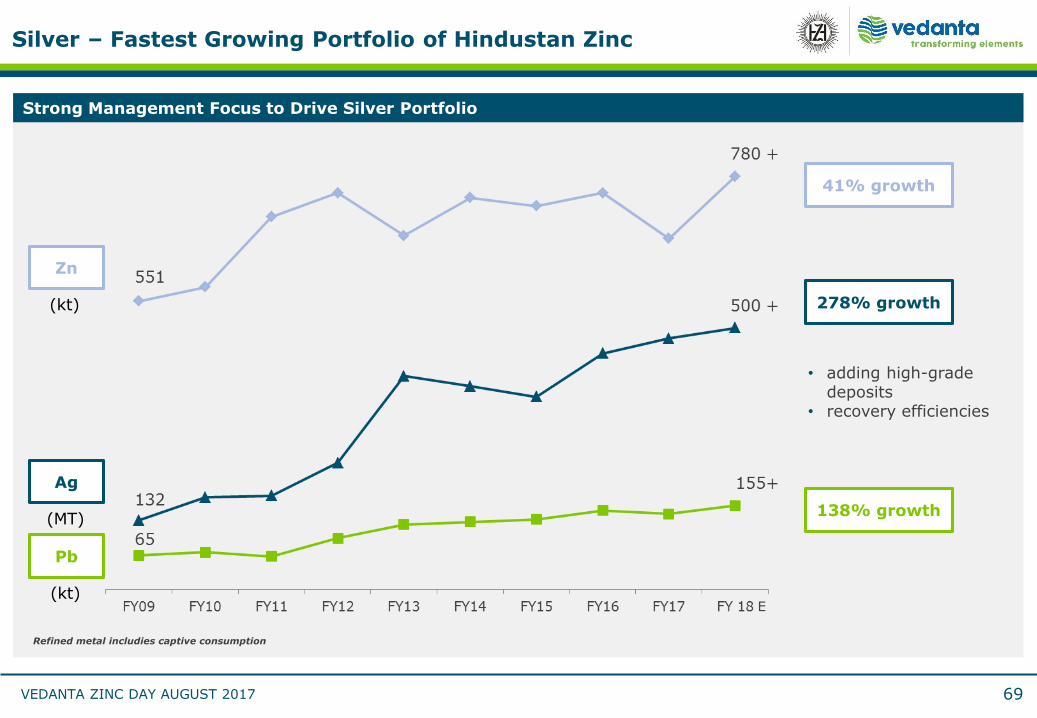
Zn
Ag
Pb
(kt)
(kt)
(MT)
278% growth
41% growth
138% growth
• adding high-grade deposits
• recovery efficiencies
E
Silver – Fastest Growing Portfolio of Hindustan Zinc
Strong Management Focus to Drive Silver Portfolio
Refined metal includies captive consumption
69
VEDANTA ZINC DAY AUGUST 2017
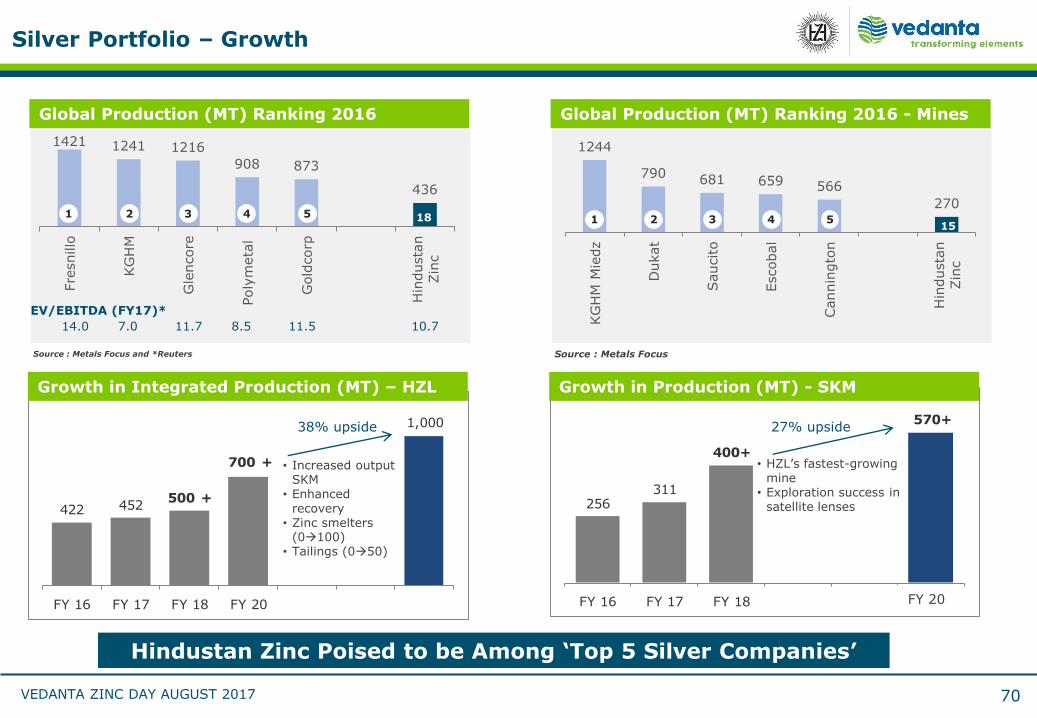
256311
400+
570+
FY 16 FY 17 FY 18 FY 19
422 452500 +
700 +
1,000
FY 16 FY 17 FY 18 FY 20
• Increased output SKM
• Enhanced recovery
• Zinc smelters (0100)
• Tailings (050)
38% upside
Hindustan Zinc Poised to be Among ‘Top 5 Silver Companies’
Silver Portfolio – Growth
70
Global Production (MT) Ranking 2016
Source : Metals Focus and *Reuters
Growth in Integrated Production (MT) – HZL
Global Production (MT) Ranking 2016 - Mines
Source : Metals Focus
Growth in Production (MT) - SKM
1421 1241 1216
908 873
436
Fre
snillo
KG
HM
Gle
ncore
Poly
meta
l
Gold
corp
Hin
dusta
n
Zin
c
1244
790 681 659 566
270
KG
HM
Mie
dz
Dukat
Saucito
Escobal
Cannin
gto
n
Hin
dusta
n
Zin
c
14.0 7.0 11.7 8.5 11.5 10.7
1 2 3 4 5 18 1 2 3 4 515
27% upside
• HZL’s fastest-growing mine
• Exploration success in satellite lenses
FY 20
EV/EBITDA (FY17)*
VEDANTA ZINC DAY AUGUST 2017
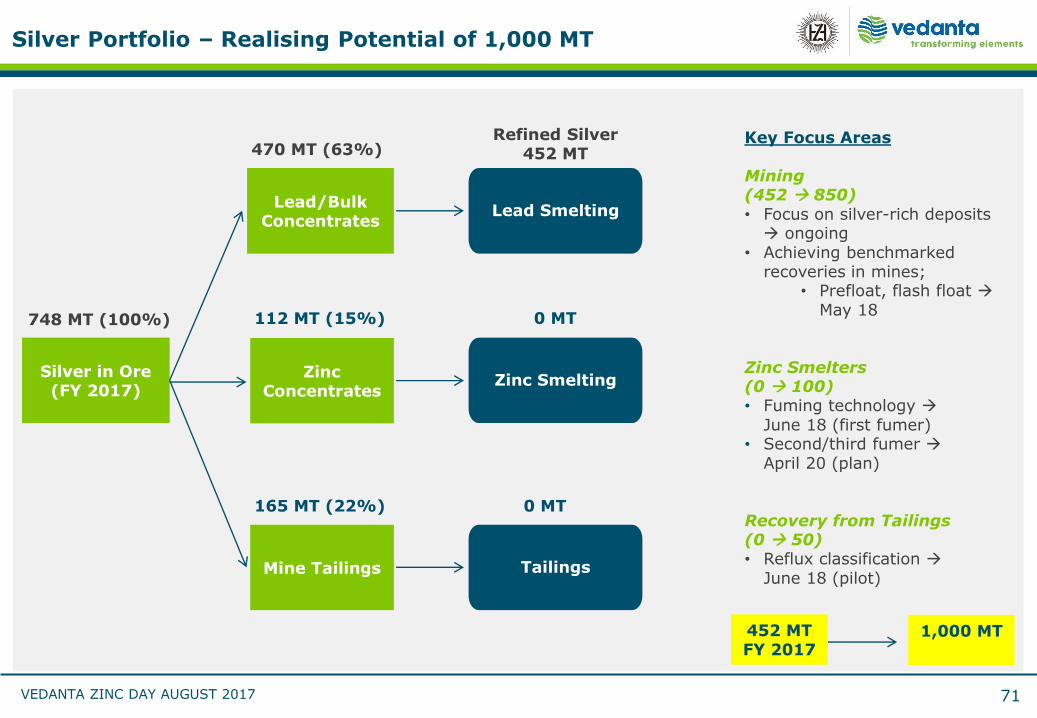
Key Focus Areas
Mining (452 850)• Focus on silver-rich deposits ongoing
• Achieving benchmarked recoveries in mines;
• Prefloat, flash float May 18
Zinc Smelters (0 100)• Fuming technology
June 18 (first fumer)• Second/third fumer
April 20 (plan)
Recovery from Tailings (0 50)• Reflux classification
June 18 (pilot)
Silver in Ore(FY 2017)
748 MT (100%)
Lead/Bulk Concentrates
470 MT (63%)
Lead Smelting
Refined Silver452 MT
Zinc Concentrates
Mine Tailings
112 MT (15%)
165 MT (22%)
Zinc Smelting
Tailings
0 MT
0 MT
452 MTFY 2017
1,000 MT
Silver Portfolio – Realising Potential of 1,000 MT
71
WayForward
06
Sunil Duggal,CEO
VEDANTA ZINC DAY AUGUST 2017
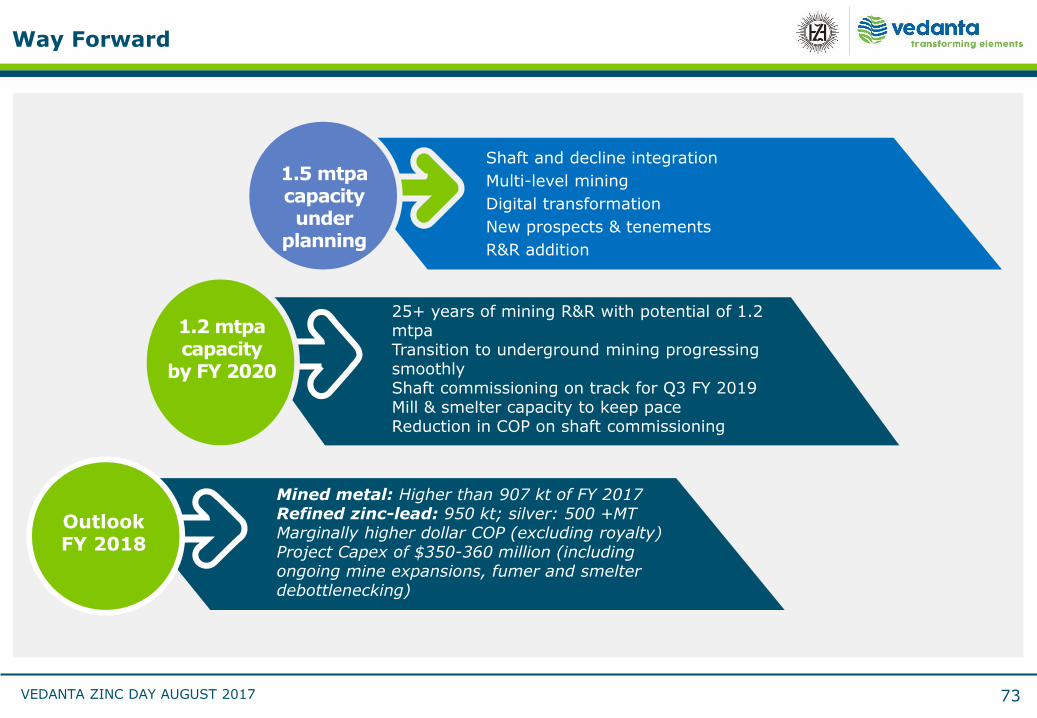
Way Forward
73
1.5 mtpacapacityunder
planning
Shaft and decline integration
Multi-level mining
Digital transformation
New prospects & tenements
R&R addition
25+ years of mining R&R with potential of 1.2 mtpaTransition to underground mining progressing smoothlyShaft commissioning on track for Q3 FY 2019Mill & smelter capacity to keep paceReduction in COP on shaft commissioning
1.2 mtpacapacity
by FY 2020
Mined metal: Higher than 907 kt of FY 2017Refined zinc-lead: 950 kt; silver: 500 +MTMarginally higher dollar COP (excluding royalty)Project Capex of $350-360 million (including ongoing mine expansions, fumer and smelter debottlenecking)
Outlook FY 2018
VEDANTA ZINC DAY AUGUST 2017
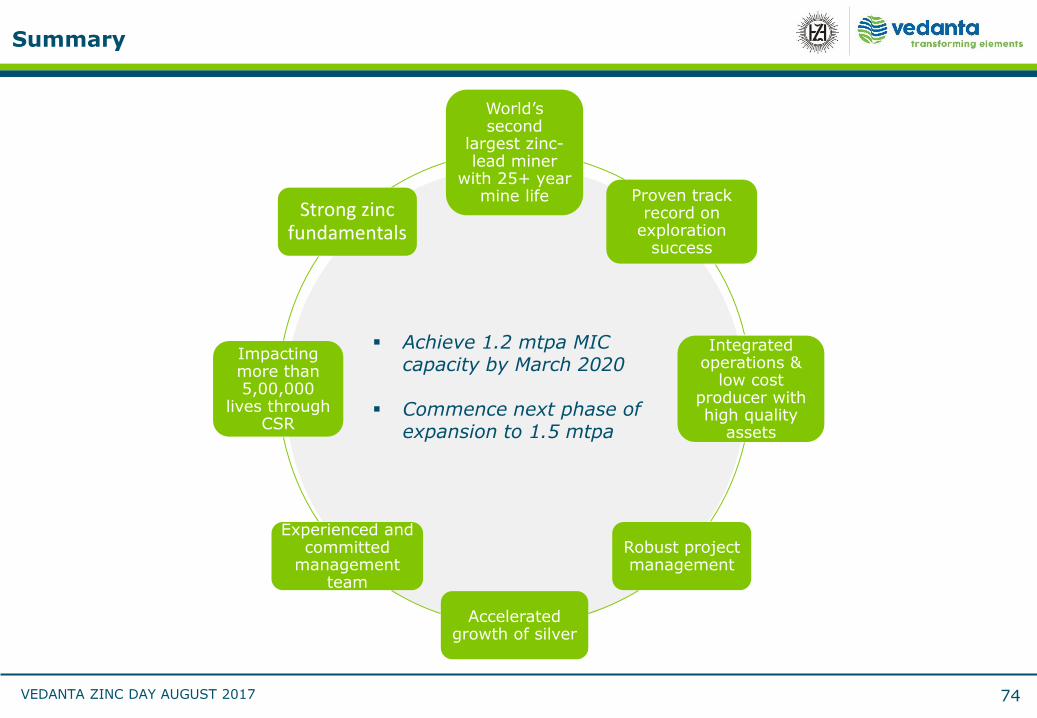
World’s second
largest zinc-lead miner
with 25+ year mine life Proven track
record on exploration
success
Integrated operations &
low cost producer with high quality
assets
Robust project management
Accelerated growth of silver
Experienced and committed
management team
Impacting more than 5,00,000
lives through CSR
Strong zinc fundamentals
Summary
74
Achieve 1.2 mtpa MIC capacity by March 2020
Commence next phase of expansion to 1.5 mtpa

Thank You
VEDANTA ZINC DAY AUGUST 2017
IN
PU
TS
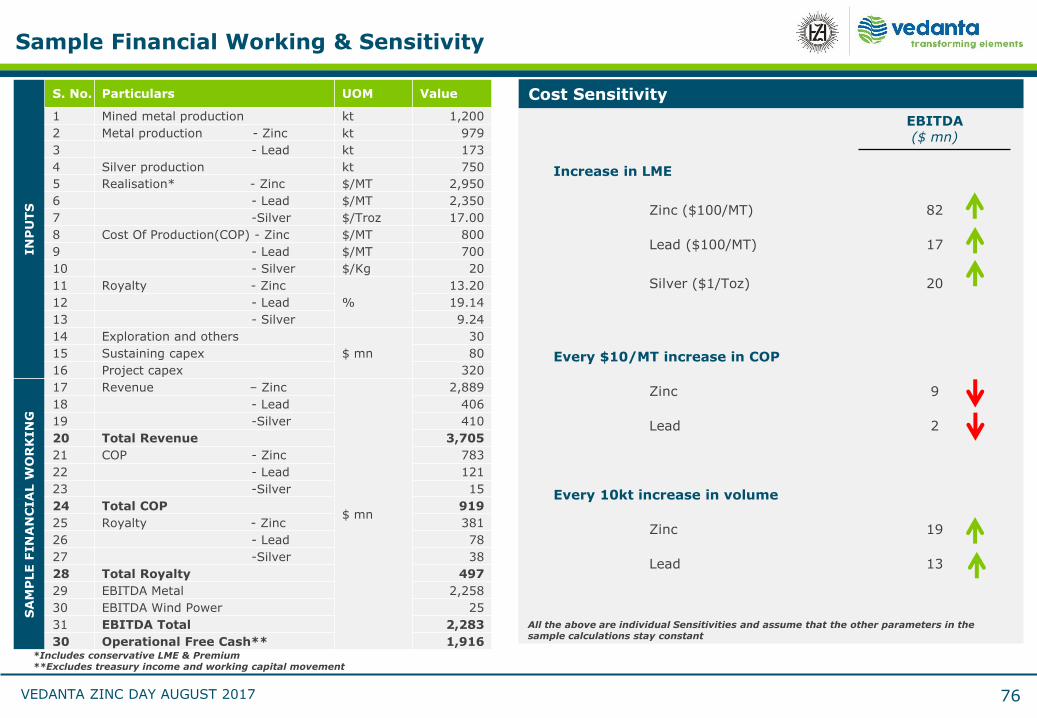
S. No. Particulars UOM Value
1 Mined metal production kt 1,200
2 Metal production - Zinc kt 979
3 - Lead kt 173
4 Silver production kt 750
5 Realisation* - Zinc $/MT 2,950
6 - Lead $/MT 2,350
7 -Silver $/Troz 17.00
8 Cost Of Production(COP) - Zinc $/MT 800
9 - Lead $/MT 700
10 - Silver $/Kg 20
11 Royalty - Zinc
%
13.20
12 - Lead 19.14
13 - Silver 9.24
14 Exploration and others
$ mn
30
15 Sustaining capex 80
16 Project capex 320
SA
MP
LE F
IN
AN
CIA
L W
OR
KIN
G
17 Revenue – Zinc
$ mn
2,889
18 - Lead 406
19 -Silver 410
20 Total Revenue 3,705
21 COP - Zinc 783
22 - Lead 121
23 -Silver 15
24 Total COP 919
25 Royalty - Zinc 381
26 - Lead 78
27 -Silver 38
28 Total Royalty 497
29 EBITDA Metal 2,258
30 EBITDA Wind Power 25
31 EBITDA Total 2,283
30 Operational Free Cash** 1,916*Includes conservative LME & Premium**Excludes treasury income and working capital movement
Sample Financial Working & Sensitivity
76
EBITDA($ mn)
Increase in LME
Zinc ($100/MT) 82
Lead ($100/MT) 17
Silver ($1/Toz) 20
Every $10/MT increase in COP
Zinc 9
Lead 2
Every 10kt increase in volume
Zinc 19
Lead 13
Cost Sensitivity
All the above are individual Sensitivities and assume that the other parameters in the sample calculations stay constant
VEDANTA ZINC DAY AUGUST 2017
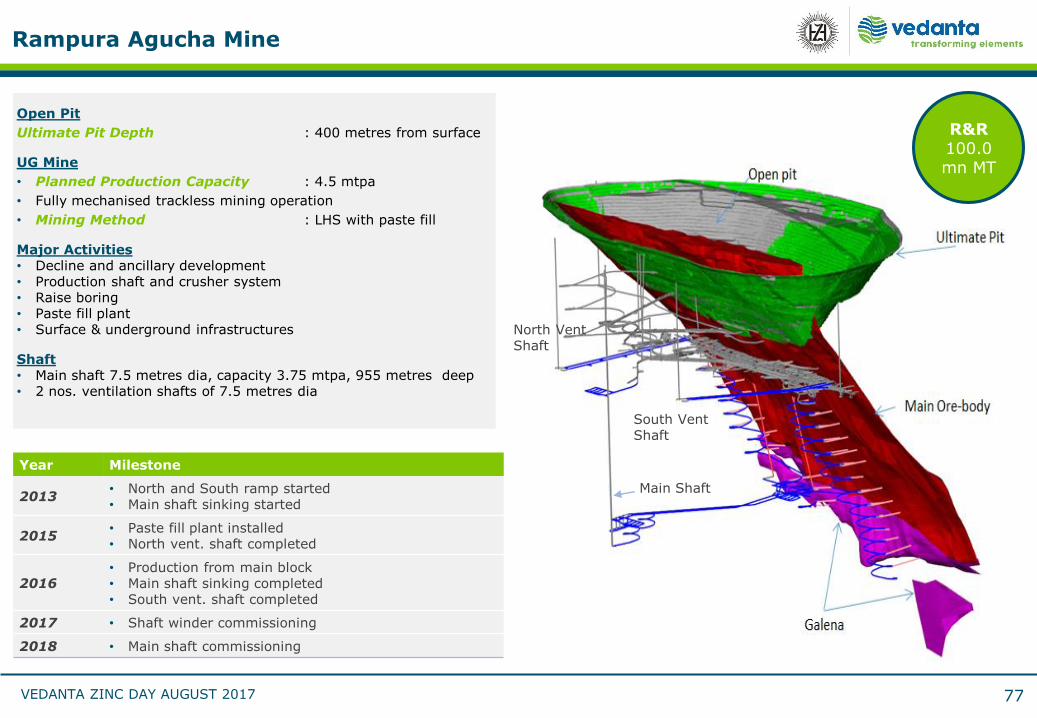
Rampura Agucha Mine
Open Pit
Ultimate Pit Depth : 400 metres from surface
UG Mine
• Planned Production Capacity : 4.5 mtpa
• Fully mechanised trackless mining operation
• Mining Method : LHS with paste fill
Major Activities• Decline and ancillary development • Production shaft and crusher system• Raise boring• Paste fill plant• Surface & underground infrastructures
Shaft• Main shaft 7.5 metres dia, capacity 3.75 mtpa, 955 metres deep• 2 nos. ventilation shafts of 7.5 metres dia
North Vent Shaft
South Vent Shaft
Main Shaft
Year Milestone
2013• North and South ramp started• Main shaft sinking started
2015• Paste fill plant installed• North vent. shaft completed
2016• Production from main block• Main shaft sinking completed• South vent. shaft completed
2017 • Shaft winder commissioning
2018 • Main shaft commissioning
77
R&R100.0 mn MT
VEDANTA ZINC DAY AUGUST 2017
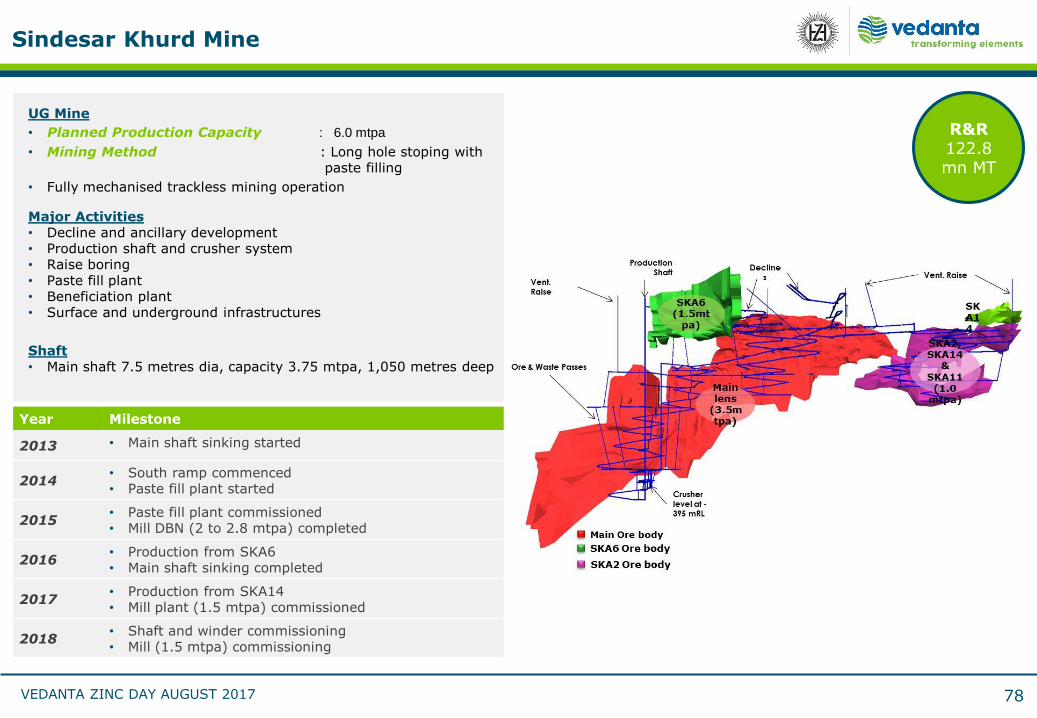
Sindesar Khurd Mine
78
UG Mine
• Planned Production Capacity : 6.0 mtpa
• Mining Method : Long hole stoping with paste filling
• Fully mechanised trackless mining operation
Major Activities• Decline and ancillary development • Production shaft and crusher system• Raise boring• Paste fill plant• Beneficiation plant• Surface and underground infrastructures
Shaft• Main shaft 7.5 metres dia, capacity 3.75 mtpa, 1,050 metres deep
Year Milestone
2013 • Main shaft sinking started
2014• South ramp commenced• Paste fill plant started
2015• Paste fill plant commissioned• Mill DBN (2 to 2.8 mtpa) completed
2016• Production from SKA6• Main shaft sinking completed
2017• Production from SKA14• Mill plant (1.5 mtpa) commissioned
2018• Shaft and winder commissioning• Mill (1.5 mtpa) commissioning
R&R122.8 mn MT
VEDANTA ZINC DAY AUGUST 2017
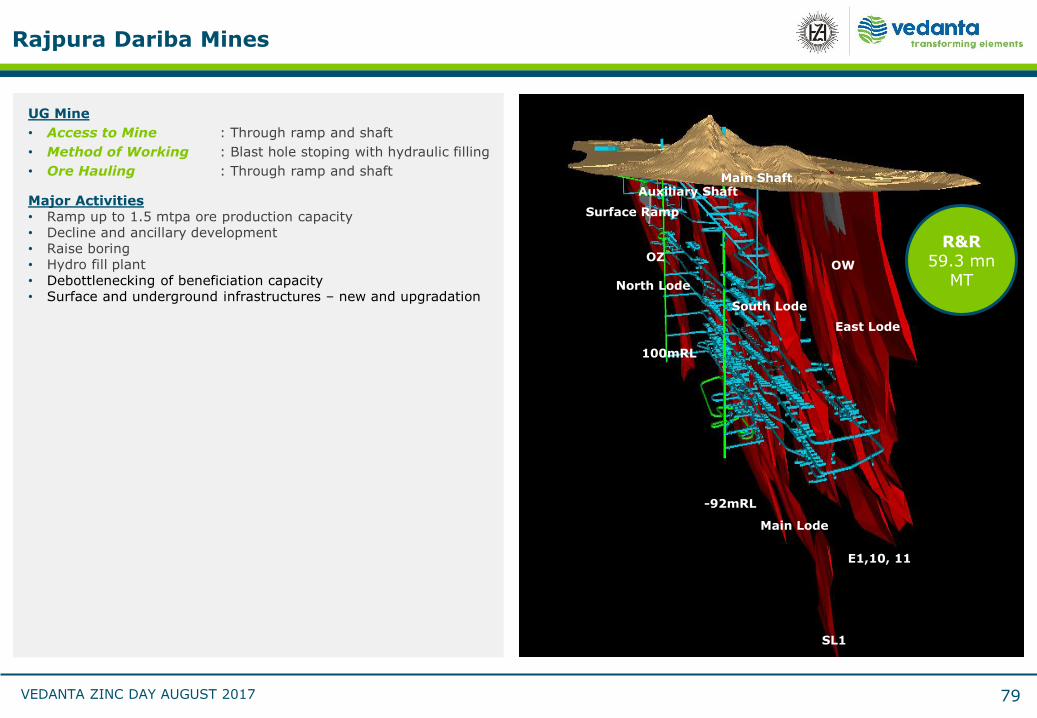
Rajpura Dariba Mines
79
East Lens
Surface Ramp
Auxiliary Shaft
-92mRL
Main Shaft
North Lens
South Lens
100mRL
Main Lens
SL1
E1,10, 11N
OWOZ
East Lode
Surface Ramp
Auxiliary Shaft
-92mRL
Main Shaft
North Lode
South Lode
100mRL
Main Lode
SL1
E1,10, 11
OWOZ
UG Mine
• Access to Mine : Through ramp and shaft
• Method of Working : Blast hole stoping with hydraulic filling
• Ore Hauling : Through ramp and shaft
Major Activities• Ramp up to 1.5 mtpa ore production capacity• Decline and ancillary development • Raise boring• Hydro fill plant• Debottlenecking of beneficiation capacity• Surface and underground infrastructures – new and upgradation
R&R59.3 mn
MT
VEDANTA ZINC DAY AUGUST 2017
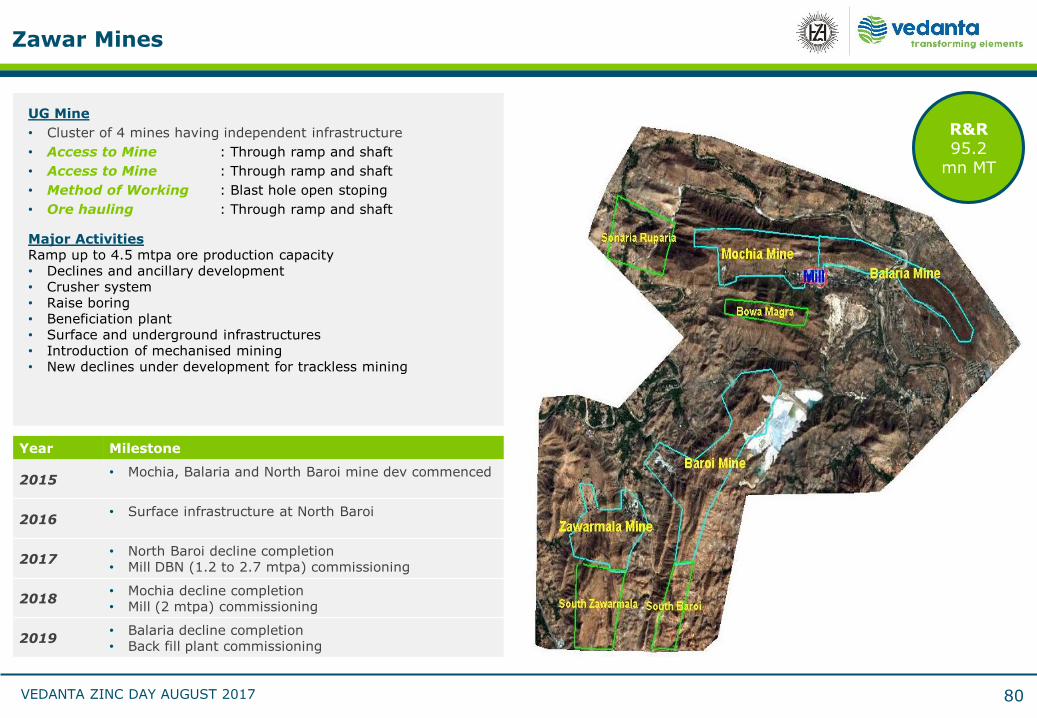
Zawar Mines
UG Mine
• Cluster of 4 mines having independent infrastructure
• Access to Mine : Through ramp and shaft
• Access to Mine : Through ramp and shaft
• Method of Working : Blast hole open stoping
• Ore hauling : Through ramp and shaft
Major ActivitiesRamp up to 4.5 mtpa ore production capacity • Declines and ancillary development • Crusher system• Raise boring• Beneficiation plant • Surface and underground infrastructures• Introduction of mechanised mining• New declines under development for trackless mining
Year Milestone
2015• Mochia, Balaria and North Baroi mine dev commenced
2016• Surface infrastructure at North Baroi
2017• North Baroi decline completion• Mill DBN (1.2 to 2.7 mtpa) commissioning
2018• Mochia decline completion• Mill (2 mtpa) commissioning
2019• Balaria decline completion• Back fill plant commissioning
80
R&R95.2
mn MT
VEDANTA ZINC DAY AUGUST 2017
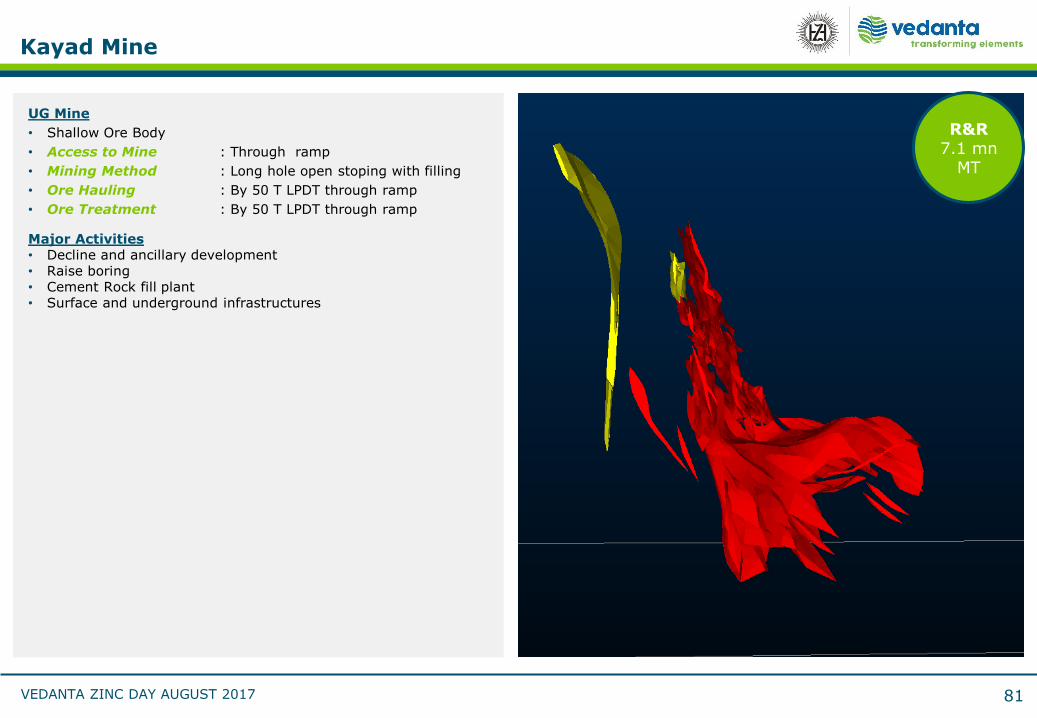
Kayad Mine
R&R7.1 mn
MT
UG Mine
• Shallow Ore Body
• Access to Mine : Through ramp
• Mining Method : Long hole open stoping with filling
• Ore Hauling : By 50 T LPDT through ramp
• Ore Treatment : By 50 T LPDT through ramp
Major Activities• Decline and ancillary development • Raise boring• Cement Rock fill plant• Surface and underground infrastructures
81