Embed Size (px)
Citation preview
WHAT’S NEW
To learn more, visit: www.veeam.com
Forecasting and planning for explosive growth of your virtual environments in today’s modern datacenter is a hot issue…but not anymore! With Veeam® Management Pack™ (MP) v6.0 and Microsoft System Center, you can leverage new capacity planning reports, storage heatmaps and real-time analytics to take control of virtualization management challenges once and for all.
Version 6.0 includes new features and enhancements in the following areas:
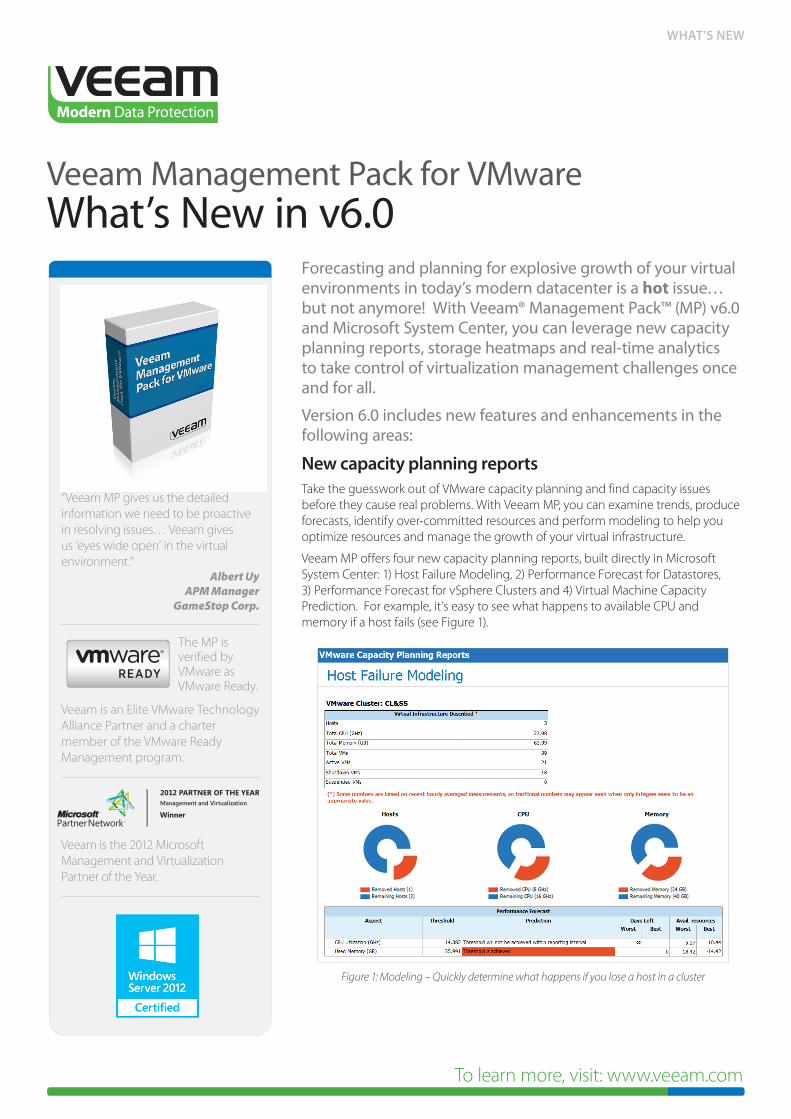
New capacity planning reports Take the guesswork out of VMware capacity planning and find capacity issues before they cause real problems. With Veeam MP, you can examine trends, produce forecasts, identify over-committed resources and perform modeling to help you optimize resources and manage the growth of your virtual infrastructure.
Veeam MP offers four new capacity planning reports, built directly in Microsoft System Center: 1) Host Failure Modeling, 2) Performance Forecast for Datastores, 3) Performance Forecast for vSphere Clusters and 4) Virtual Machine Capacity Prediction. For example, it’s easy to see what happens to available CPU and memory if a host fails (see Figure 1).
Figure 1: Modeling – Quickly determine what happens if you lose a host in a cluster
“Veeam MP gives us the detailed information we need to be proactive in resolving issues… Veeam gives us ‘eyes wide open’ in the virtual environment.”
Albert UyAPM Manager
GameStop Corp.
The MP is verified by VMware as VMware Ready.
Veeam is an Elite VMware Technology Alliance Partner and a charter member of the VMware Ready Management program.
Veeam Management Pack for VMwareWhat’s New in v6.0
Veeam is the 2012 Microsoft Management and Virtualization Partner of the Year.
WHAT’S NEW
To learn more, visit: www.veeam.com
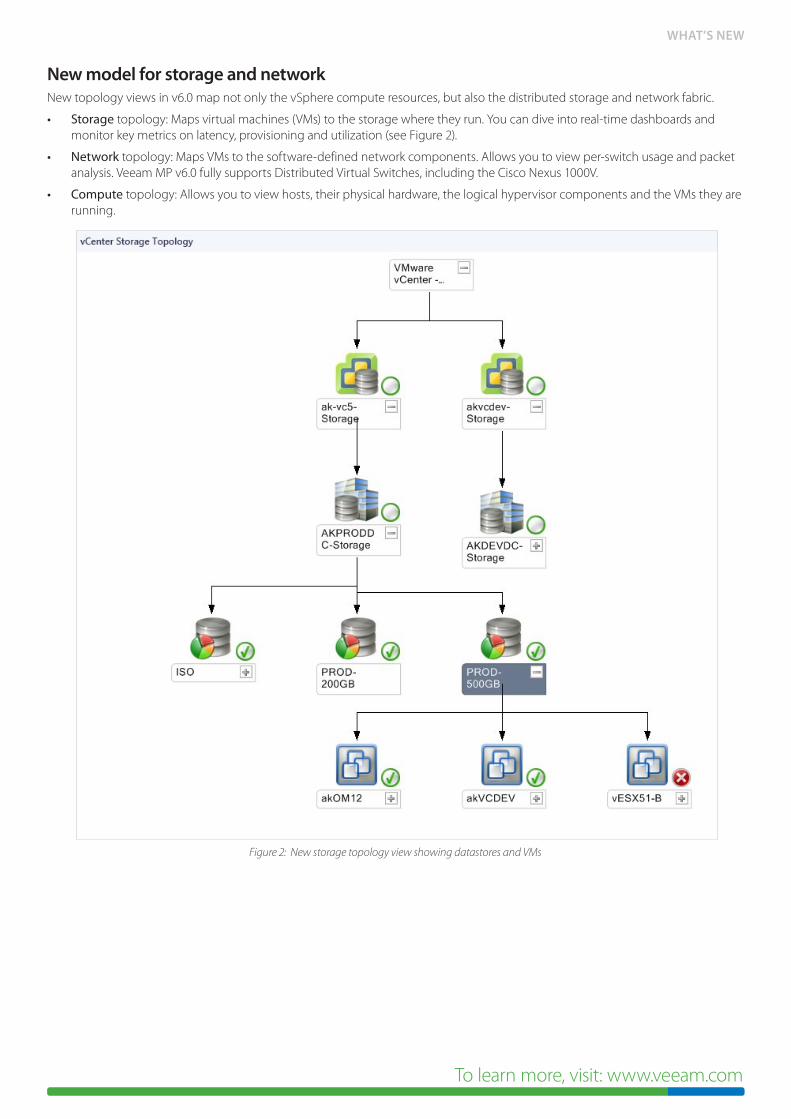
New model for storage and network New topology views in v6.0 map not only the vSphere compute resources, but also the distributed storage and network fabric.
• Storage topology: Maps virtual machines (VMs) to the storage where they run. You can dive into real-time dashboards and monitor key metrics on latency, provisioning and utilization (see Figure 2).
• Network topology: Maps VMs to the software-defined network components. Allows you to view per-switch usage and packet analysis. Veeam MP v6.0 fully supports Distributed Virtual Switches, including the Cisco Nexus 1000V.
• Compute topology: Allows you to view hosts, their physical hardware, the logical hypervisor components and the VMs they are running.
Figure 2: New storage topology view showing datastores and VMs
WHAT’S NEW
To learn more, visit: www.veeam.com
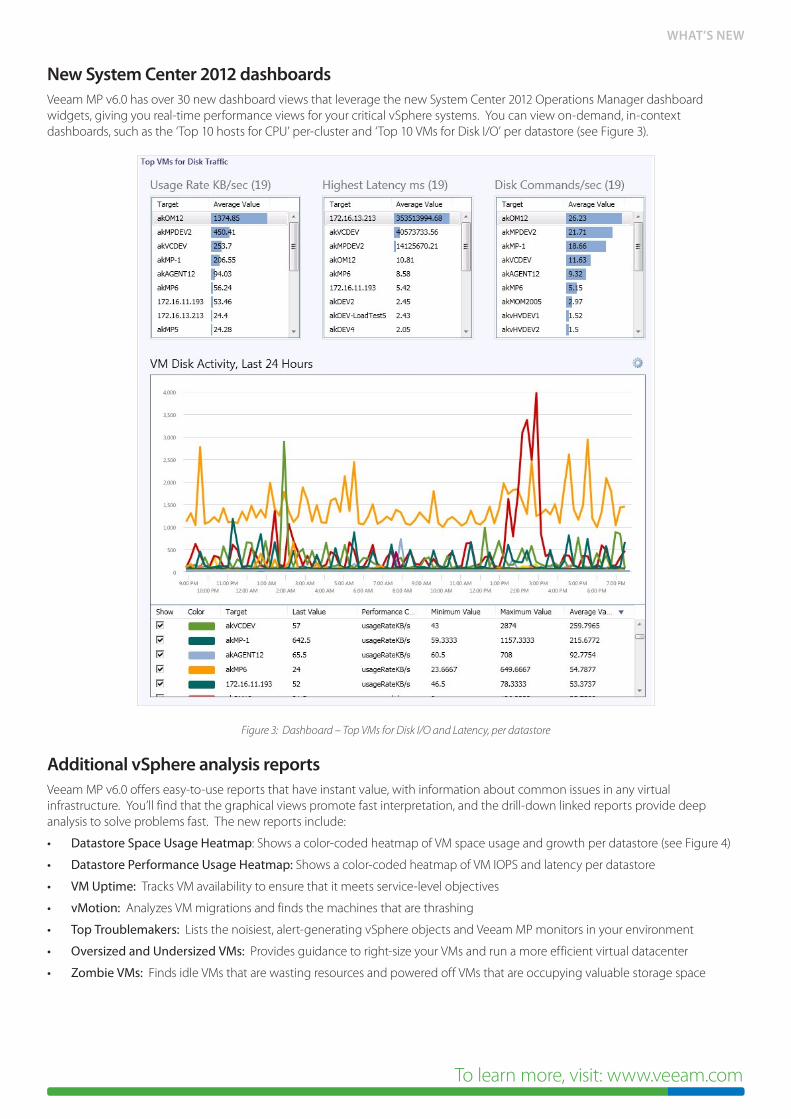
New System Center 2012 dashboards Veeam MP v6.0 has over 30 new dashboard views that leverage the new System Center 2012 Operations Manager dashboard widgets, giving you real-time performance views for your critical vSphere systems. You can view on-demand, in-context dashboards, such as the ‘Top 10 hosts for CPU’ per-cluster and ‘Top 10 VMs for Disk I/O’ per datastore (see Figure 3).
Figure 3: Dashboard – Top VMs for Disk I/O and Latency, per datastore
Additional vSphere analysis reportsVeeam MP v6.0 offers easy-to-use reports that have instant value, with information about common issues in any virtual infrastructure. You’ll find that the graphical views promote fast interpretation, and the drill-down linked reports provide deep analysis to solve problems fast. The new reports include:
• Datastore Space Usage Heatmap: Shows a color-coded heatmap of VM space usage and growth per datastore (see Figure 4)
• Datastore Performance Usage Heatmap: Shows a color-coded heatmap of VM IOPS and latency per datastore
• VM Uptime: Tracks VM availability to ensure that it meets service-level objectives
• vMotion: Analyzes VM migrations and finds the machines that are thrashing
• Top Troublemakers: Lists the noisiest, alert-generating vSphere objects and Veeam MP monitors in your environment
• Oversized and Undersized VMs: Provides guidance to right-size your VMs and run a more efficient virtual datacenter
• Zombie VMs: Finds idle VMs that are wasting resources and powered off VMs that are occupying valuable storage space
© 2013 Veeam Software. All rights reserved. All trademarks are the property of their respective owners.
To learn more, visit: www.veeam.com
WHAT’S NEWWHAT’S NEW
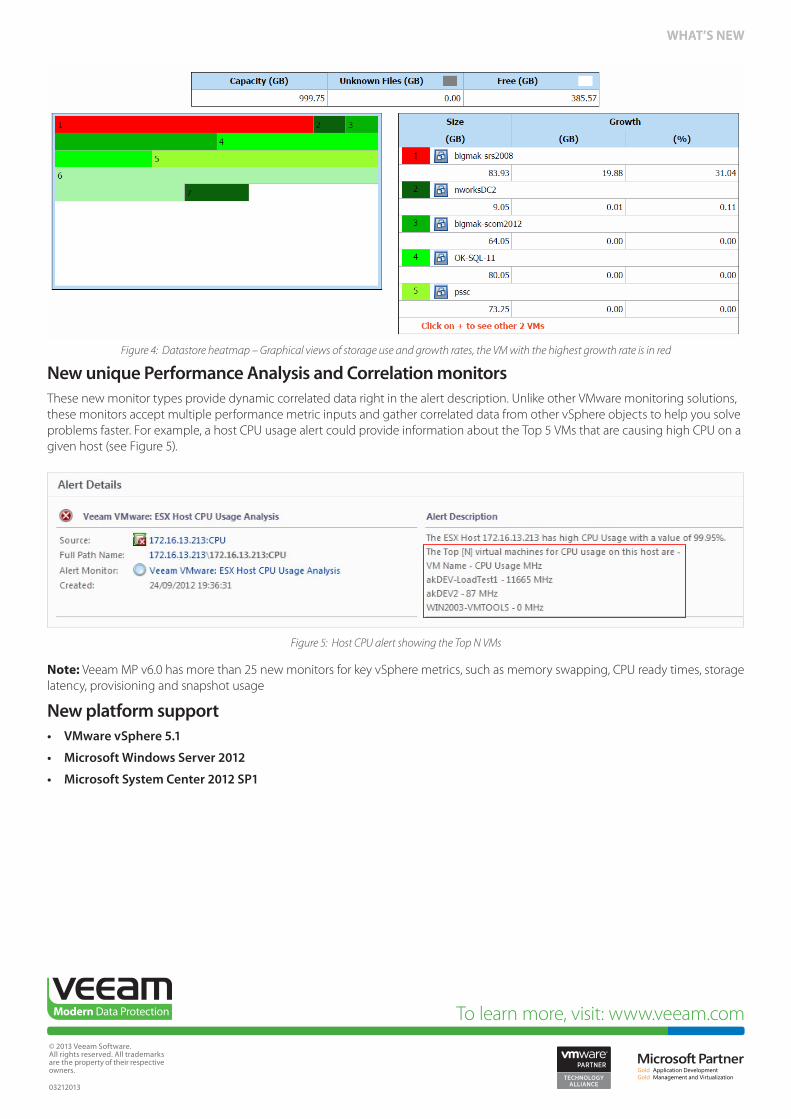
Figure 4: Datastore heatmap – Graphical views of storage use and growth rates, the VM with the highest growth rate is in red
New unique Performance Analysis and Correlation monitors These new monitor types provide dynamic correlated data right in the alert description. Unlike other VMware monitoring solutions, these monitors accept multiple performance metric inputs and gather correlated data from other vSphere objects to help you solve problems faster. For example, a host CPU usage alert could provide information about the Top 5 VMs that are causing high CPU on a given host (see Figure 5).
Figure 5: Host CPU alert showing the Top N VMs
Note: Veeam MP v6.0 has more than 25 new monitors for key vSphere metrics, such as memory swapping, CPU ready times, storage latency, provisioning and snapshot usage
New platform support • VMware vSphere 5.1
• Microsoft Windows Server 2012
• Microsoft System Center 2012 SP1
03212013


![Veeam Backup & Replication - Integra Group · Veeam Agent za fizičke servere [RTM] Veeam Agent for Microsoft Windows 2.0 • Free, Workstation and Server editions • Veeam Backup](https://img.pdfslide.net/doc/110x75/5ec8f4917e3eb61a633b269f/veeam-backup-replication-integra-group-veeam-agent-za-fizike-servere-rtm.jpg)