Embed Size (px)
Citation preview
Vegetable Oil Production: Industry Profile
Preliminary Final Report
Prepared for
Linda ChappellU.S. Environmental Protection Agency
Air Quality Standards and Strategies DivisionOffice of Air Quality Planning and StandardsInnovative Strategies and Economics Group
MD-15Research Triangle Park, NC 27711
Prepared by
Research Triangle InstituteCenter for Economics Research
Research Triangle Park, NC 27709
EPA Contract Number 68-D4-0099
RTI Project Number 7018-54
February 1998
EPA Contract Number RTI Project Number68-D4-0099 7018-54
Vegetable Oil Production: Industry Profile
Preliminary Final Report
February 1998
Prepared for
Linda ChappellU.S. Environmental Protection Agency
Air Quality Standards and Strategies DivisionOffice of Air Quality Planning and StandardsInnovative Strategies and Economics Group
MD-15Research Triangle Park, NC 27711
Prepared by
Mary K. MuthBrooks M. Depro
Jean L. DomanicoResearch Triangle Institute
Center for Economics ResearchResearch Triangle Park, NC 27709
iii
CONTENTS
Section Page
1 INTRODUCTION . . . . . . . . . . . . . . . . . 1-1
2 THE SUPPLY SIDE . . . . . . . . . . . . . . . . 2-1
2.1 Production Process, Inputs, and Outputs . 2-12.1.1 Production Process . . . . . . . . 2-12.1.2 Inputs . . . . . . . . . . . . . . 2-12
2.2 Types of Products and Services . . . . . 2-142.2.1 Soybean Oil . . . . . . . . . . . 2-142.2.2 Corn Oil . . . . . . . . . . . . . 2-152.2.3 Cottonseed Oil . . . . . . . . . . 2-15
2.3 Major By-products, Co-products, andSubstitution Possibilities . . . . . . . . 2-152.3.1 Cake and Meal . . . . . . . . . . 2-162.3.2 Hulls . . . . . . . . . . . . . . 2-162.3.3 Linters . . . . . . . . . . . . . 2-162.3.4 Lecithin . . . . . . . . . . . . . 2-162.3.5 Soapstock . . . . . . . . . . . . 2-172.3.6 Deodorizing Distillates . . . . . 2-172.3.7 Spent Bleaching Earth . . . . . . 2-17
2.4 Costs of Production . . . . . . . . . . . 2-19
3 THE DEMAND SIDE . . . . . . . . . . . . . . . . 3-1
3.1 Product Characteristics . . . . . . . . . 3-13.1.1 Functional Characteristics . . . . 3-23.1.2 Perceptions About Health Effects . 3-3
3.2 Uses and Consumers . . . . . . . . . . . . 3-63.2.1 Edible Uses of Vegetable Oils . . 3-73.2.2 Inedible Uses of Vegetable Oils . 3-103.2.3 Percentages of Vegetable Oils
Used in Various Products . . . . . 3-133.2.4 Elasticity of Demand . . . . . . . 3-16

iv
v
CONTENTS (CONTINUED)
Section Page
3.3 Substitution Possibilities in Consumption . . . . . . . . . . . . . . . 3-163.3.1 Tropical Oils . . . . . . . . . . 3-173.3.2 Animal Fats . . . . . . . . . . . 3-173.3.3 Olive Oil . . . . . . . . . . . . 3-183.3.4 Olestra . . . . . . . . . . . . . 3-18
4 INDUSTRY ORGANIZATION . . . . . . . . . . . . . 4-1
4.1 Market Structure . . . . . . . . . . . . . 4-14.2 Facility Characteristics . . . . . . . . . 4-4
4.2.1 Wet Corn Milling . . . . . . . . . 4-154.2.2 Cottonseed Oil Mills . . . . . . . 4-154.2.3 Soybean Oil Mills . . . . . . . . 4-184.2.4 Vegetable Oil Mills, Except Corn,
Cottonseed, and Soybean . . . . . 4-184.2.5 Current Trends . . . . . . . . . . 4-20
4.3 Company Characteristics . . . . . . . . . 4-214.3.1 Ownership . . . . . . . . . . . . 4-224.3.2 Size Distribution . . . . . . . . 4-224.3.3 Horizontal and Vertical
Integration . . . . . . . . . . . 4-26
4.4 Small Businesses Impacts . . . . . . . . . 4-28
5 MARKETS . . . . . . . . . . . . . . . . . . . . 5-1
5.1 Historical Market Data . . . . . . . . . . 5-15.1.1 Domestic Production . . . . . . . 5-15.1.2 Domestic Consumption . . . . . . . 5-45.1.3 Vegetable Oil Prices . . . . . . . 5-65.1.4 Imports and Exports . . . . . . . 5-10
5.2 Trends and Projections . . . . . . . . . . 5-175.2.1 Future Prices . . . . . . . . . . 5-175.2.2 Trends in Consumption . . . . . . 5-175.2.3 Trends in Production . . . . . . . 5-19
REFERENCES . . . . . . . . . . . . . . . . . . R-1

vi
vii
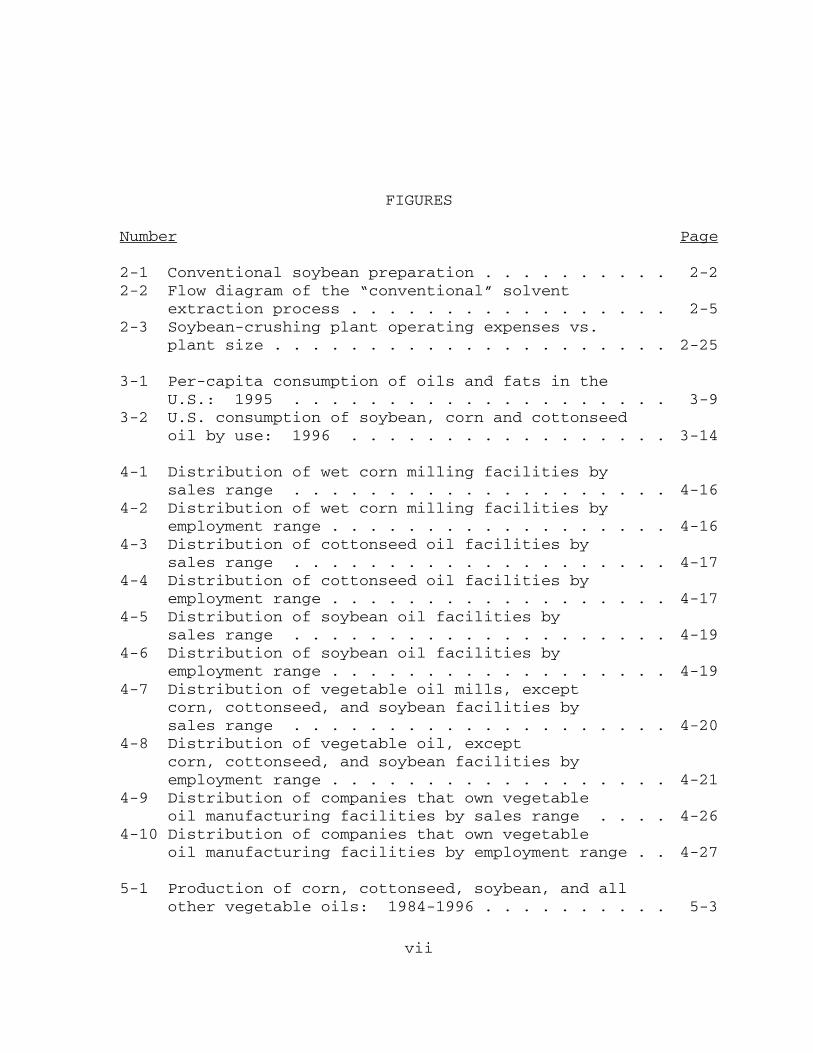
FIGURES
Number Page
2-1 Conventional soybean preparation . . . . . . . . . . 2-22-2 Flow diagram of the “conventional” solvent
extraction process . . . . . . . . . . . . . . . . . 2-52-3 Soybean-crushing plant operating expenses vs.
plant size . . . . . . . . . . . . . . . . . . . . . 2-25
3-1 Per-capita consumption of oils and fats in theU.S.: 1995 . . . . . . . . . . . . . . . . . . . . 3-9
3-2 U.S. consumption of soybean, corn and cottonseedoil by use: 1996 . . . . . . . . . . . . . . . . . 3-14
4-1 Distribution of wet corn milling facilities bysales range . . . . . . . . . . . . . . . . . . . . 4-16
4-2 Distribution of wet corn milling facilities byemployment range . . . . . . . . . . . . . . . . . . 4-16
4-3 Distribution of cottonseed oil facilities bysales range . . . . . . . . . . . . . . . . . . . . 4-17
4-4 Distribution of cottonseed oil facilities byemployment range . . . . . . . . . . . . . . . . . . 4-17
4-5 Distribution of soybean oil facilities by sales range . . . . . . . . . . . . . . . . . . . . 4-19
4-6 Distribution of soybean oil facilities byemployment range . . . . . . . . . . . . . . . . . . 4-19
4-7 Distribution of vegetable oil mills, except corn, cottonseed, and soybean facilities bysales range . . . . . . . . . . . . . . . . . . . . 4-20
4-8 Distribution of vegetable oil, exceptcorn, cottonseed, and soybean facilities byemployment range . . . . . . . . . . . . . . . . . . 4-21
4-9 Distribution of companies that own vegetable oil manufacturing facilities by sales range . . . . 4-26
4-10 Distribution of companies that own vegetableoil manufacturing facilities by employment range . . 4-27
5-1 Production of corn, cottonseed, soybean, and allother vegetable oils: 1984-1996 . . . . . . . . . . 5-3

viii
ix
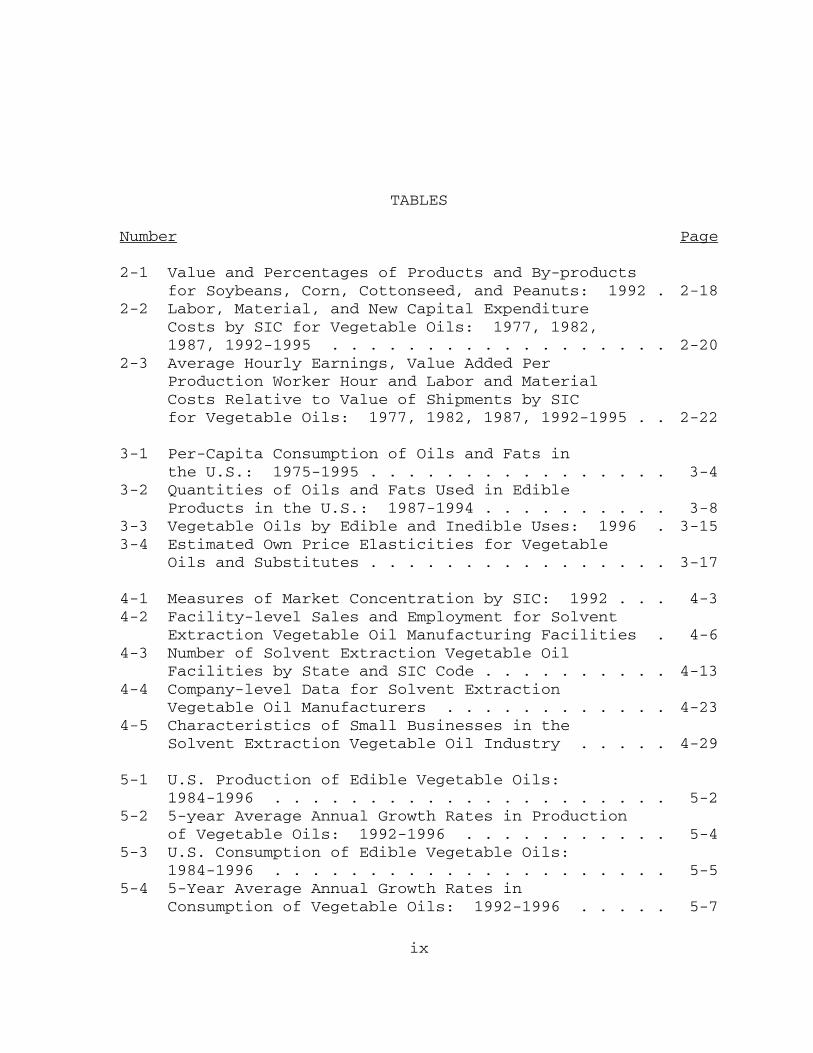
TABLES
Number Page
2-1 Value and Percentages of Products and By-productsfor Soybeans, Corn, Cottonseed, and Peanuts: 1992 . 2-18
2-2 Labor, Material, and New Capital ExpenditureCosts by SIC for Vegetable Oils: 1977, 1982,1987, 1992-1995 . . . . . . . . . . . . . . . . . . 2-20
2-3 Average Hourly Earnings, Value Added Per Production Worker Hour and Labor and MaterialCosts Relative to Value of Shipments by SICfor Vegetable Oils: 1977, 1982, 1987, 1992-1995 . . 2-22
3-1 Per-Capita Consumption of Oils and Fats inthe U.S.: 1975-1995 . . . . . . . . . . . . . . . . 3-4
3-2 Quantities of Oils and Fats Used in Edible Products in the U.S.: 1987-1994 . . . . . . . . . . 3-8
3-3 Vegetable Oils by Edible and Inedible Uses: 1996 . 3-153-4 Estimated Own Price Elasticities for Vegetable
Oils and Substitutes . . . . . . . . . . . . . . . . 3-17
4-1 Measures of Market Concentration by SIC: 1992 . . . 4-34-2 Facility-level Sales and Employment for Solvent
Extraction Vegetable Oil Manufacturing Facilities . 4-64-3 Number of Solvent Extraction Vegetable Oil
Facilities by State and SIC Code . . . . . . . . . . 4-134-4 Company-level Data for Solvent Extraction
Vegetable Oil Manufacturers . . . . . . . . . . . . 4-234-5 Characteristics of Small Businesses in the
Solvent Extraction Vegetable Oil Industry . . . . . 4-29
5-1 U.S. Production of Edible Vegetable Oils: 1984-1996 . . . . . . . . . . . . . . . . . . . . . 5-2
5-2 5-year Average Annual Growth Rates in Productionof Vegetable Oils: 1992-1996 . . . . . . . . . . . 5-4
5-3 U.S. Consumption of Edible Vegetable Oils: 1984-1996 . . . . . . . . . . . . . . . . . . . . . 5-5
5-4 5-Year Average Annual Growth Rates in Consumption of Vegetable Oils: 1992-1996 . . . . . 5-7

x
xi
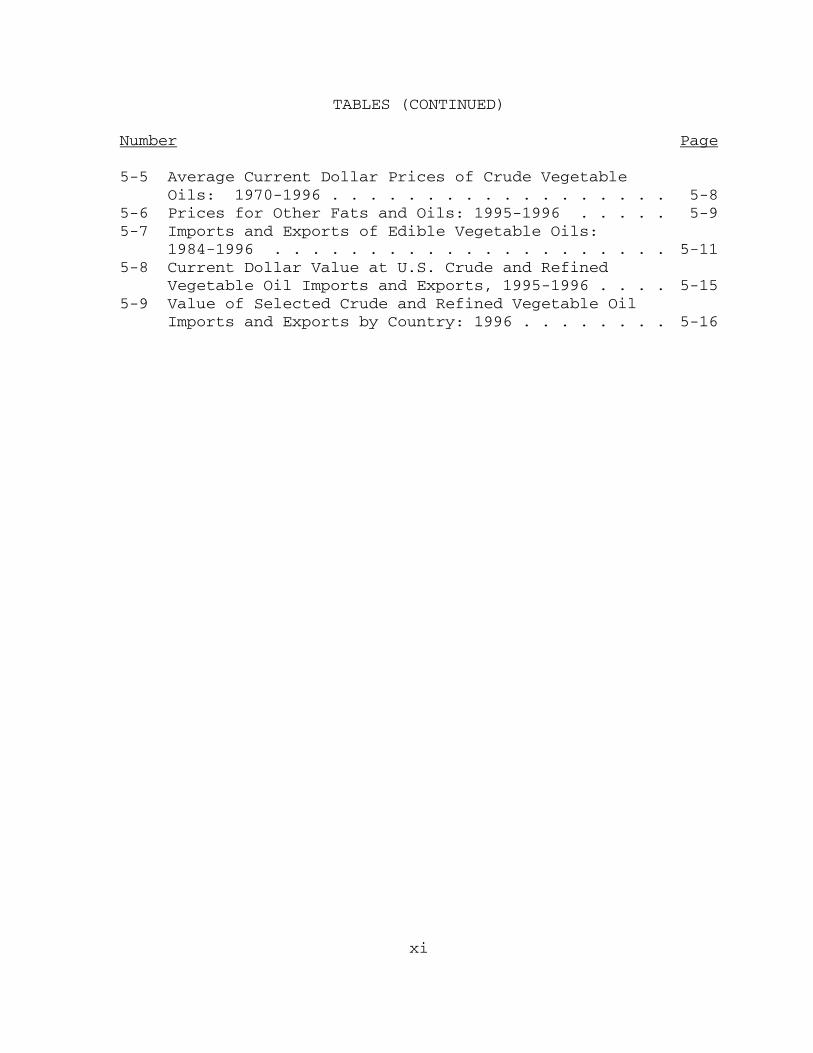
TABLES (CONTINUED)
Number Page
5-5 Average Current Dollar Prices of Crude VegetableOils: 1970-1996 . . . . . . . . . . . . . . . . . . 5-8
5-6 Prices for Other Fats and Oils: 1995-1996 . . . . . 5-95-7 Imports and Exports of Edible Vegetable Oils:
1984-1996 . . . . . . . . . . . . . . . . . . . . . 5-115-8 Current Dollar Value at U.S. Crude and Refined
Vegetable Oil Imports and Exports, 1995-1996 . . . . 5-155-9 Value of Selected Crude and Refined Vegetable Oil
Imports and Exports by Country: 1996 . . . . . . . . 5-16
1-1
SECTION 1
INTRODUCTION
The U.S. Environmental Protection Agency’s (EPA’s) Office
of Air Quality Planning and Standards (OAQPS) is compiling
information on vegetable oil plants as part of its
responsibility to develop National Emission Standards for
Hazardous Air Pollutants (NESHAP) under Section 112 of the
1990 Clean Air Act. The NESHAP is scheduled to be proposed in
1999 and the Innovative Strategies and Economics Group is
responsible for developing an economic impact analysis (EIA)
in support of the evaluation of impacts associated with the
regulatory options considered for this NESHAP.
This industry profile of the vegetable oil industry
provides information to be used to support the EIA of the
NESHAP. The vegetable oil industry includes the following SIC
codes: SIC 2046—Wet Corn Milling, SIC 2075—Soybean Oil Mills,
SIC 2074—Cottonseed Oil Mills, and SIC 2076—Vegetable Oil
Mills, not elsewhere classified (N.E.C.). Of the facilities
classified as wet corn mills (2046), only nine produce corn
oil.1 The facilities included in SIC 2076 process peanut,
sunflower, canola (rapeseed), safflower, and other minor
oilseeds.
1-2
Soybean oil processors comprise the largest share of the
vegetable oil industry, producing about 75 percent of the
domestic supply of vegetable oil. Vegetable oils are used
almost entirely for human consumption, although small
quantities are used for industrial purposes such as in paints,
resins, and animal feeds.
According to the 1992 Census of Manufactures, the most
recent year for which complete data are available,
221 establishments make up the industries in these four SIC
codes.2,3 In 1995, these industries employed 19,500 people and
had a total value of industry shipments of $953 million.4
About half of these establishments use a solvent extract
process to produce vegetable oils. The others use a
mechanical extraction process. However, data reported by the
Bureau of the Census group both types of establishments
together.
The establishments that use solvent extraction processes
produce hexane emissions—one of two sources of air pollution
for this industry. The other source, particulate emissions,
is not the subject of the NESHAP. To produce crude vegetable
oil, processors prepare the oilseeds for extraction and then
extract the oil using the solvent hexane, which EPA lists as a
hazardous air pollutant.5
This industry profile report is organized as follows.
Section 2 includes a detailed description of the production
process for vegetable oils, with discussions of individual oil
1-3
products, oilseed inputs, and costs of production. Section 3
describes the characteristics, uses, and consumers of
vegetable oils as well as substitution possibilities.
Section 4 discusses the organization of the industry and
provides facility-level and company-level data. In addition,
small businesses are reported separately for use in evaluating
the impact on small businesses to meet the requirements of the
Small Business Regulatory Enforcement and Fairness Act
(SBREFA). Section 5 contains market-level data on prices and
quantities and discusses trends and projections for the
industry. The information in this report will be used as
background in developing the EIA methodologies.
2-1
SECTION 2
THE SUPPLY SIDE
In this section, the supply side of the vegetable oils
industry is discussed. First, the production process is
described, including inputs used in the production process and
final outputs produced. Second, the types of products
produced are described in more detail. Third, by-products and
co-products of the production process are discussed as well as
input substitution possibilities. Finally, data on costs of
production and economies of scale are provided.
2.1 PRODUCTION PROCESS, INPUTS, AND OUTPUTS
The production process for vegetable oils is described,
from receiving oilseeds to refining, in this section.
Although the discussion concentrates on soybean oil,
differences in the production process for the other major
oilseeds are noted. In addition, this section describes
oilseeds and hexane, two specialized inputs in the production
of vegetable oil.
2.1.1 Production Process
Until the mid-1800s, vegetable oils were extracted from
oil seeds through mechanical or hydraulic means.6 Today,
2-2
Figure 2-1. Conventional soybean preparation.
Source: Moore, N.M. Journal of American Oil Chemical Society. 60:190. 1983. Cited in Erickson, D.R. (ed.). Practical Handbook ofSoybean Processing and Utilization. Chapter 6. 1983.
processors use solvent extraction as the primary method for
producing vegetable oil.7 The same basic process used for
extracting soybean oil is used for extracting other types of
vegetable oils. However, differences in the production
processes for cottonseed, corn, and peanut oil are also noted.
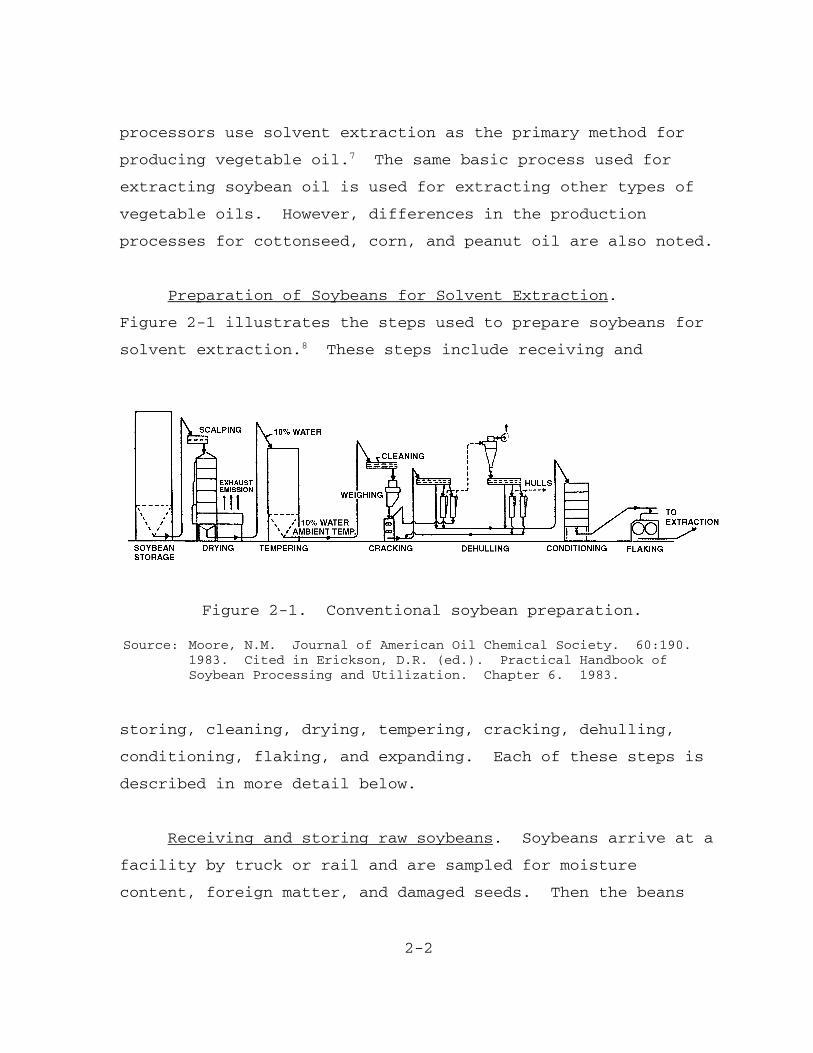
Preparation of Soybeans for Solvent Extraction.
Figure 2-1 illustrates the steps used to prepare soybeans for
solvent extraction.8 These steps include receiving and
storing, cleaning, drying, tempering, cracking, dehulling,
conditioning, flaking, and expanding. Each of these steps is
described in more detail below.
Receiving and storing raw soybeans. Soybeans arrive at a
facility by truck or rail and are sampled for moisture
content, foreign matter, and damaged seeds. Then the beans
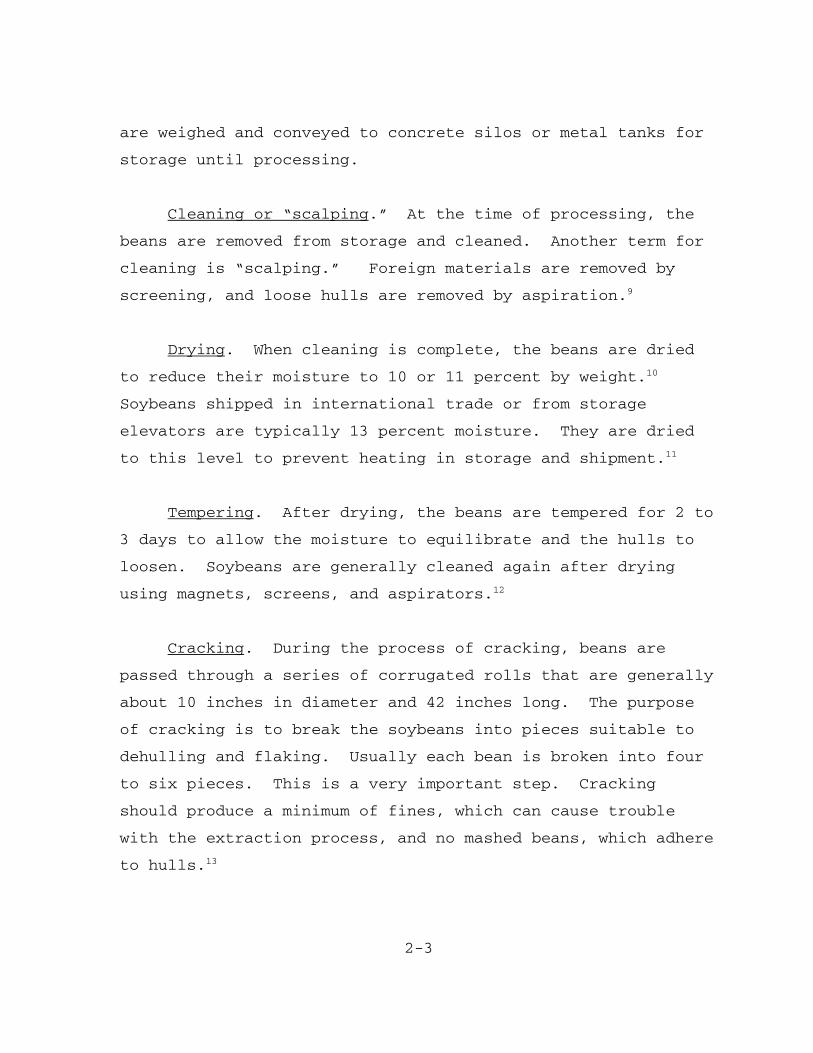
2-3
are weighed and conveyed to concrete silos or metal tanks for
storage until processing.
Cleaning or “scalping.” At the time of processing, the
beans are removed from storage and cleaned. Another term for
cleaning is “scalping.” Foreign materials are removed by
screening, and loose hulls are removed by aspiration.9
Drying. When cleaning is complete, the beans are dried
to reduce their moisture to 10 or 11 percent by weight.10
Soybeans shipped in international trade or from storage
elevators are typically 13 percent moisture. They are dried
to this level to prevent heating in storage and shipment.11
Tempering. After drying, the beans are tempered for 2 to
3 days to allow the moisture to equilibrate and the hulls to
loosen. Soybeans are generally cleaned again after drying
using magnets, screens, and aspirators.12
Cracking. During the process of cracking, beans are
passed through a series of corrugated rolls that are generally
about 10 inches in diameter and 42 inches long. The purpose
of cracking is to break the soybeans into pieces suitable to
dehulling and flaking. Usually each bean is broken into four
to six pieces. This is a very important step. Cracking
should produce a minimum of fines, which can cause trouble
with the extraction process, and no mashed beans, which adhere
to hulls.13
2-4
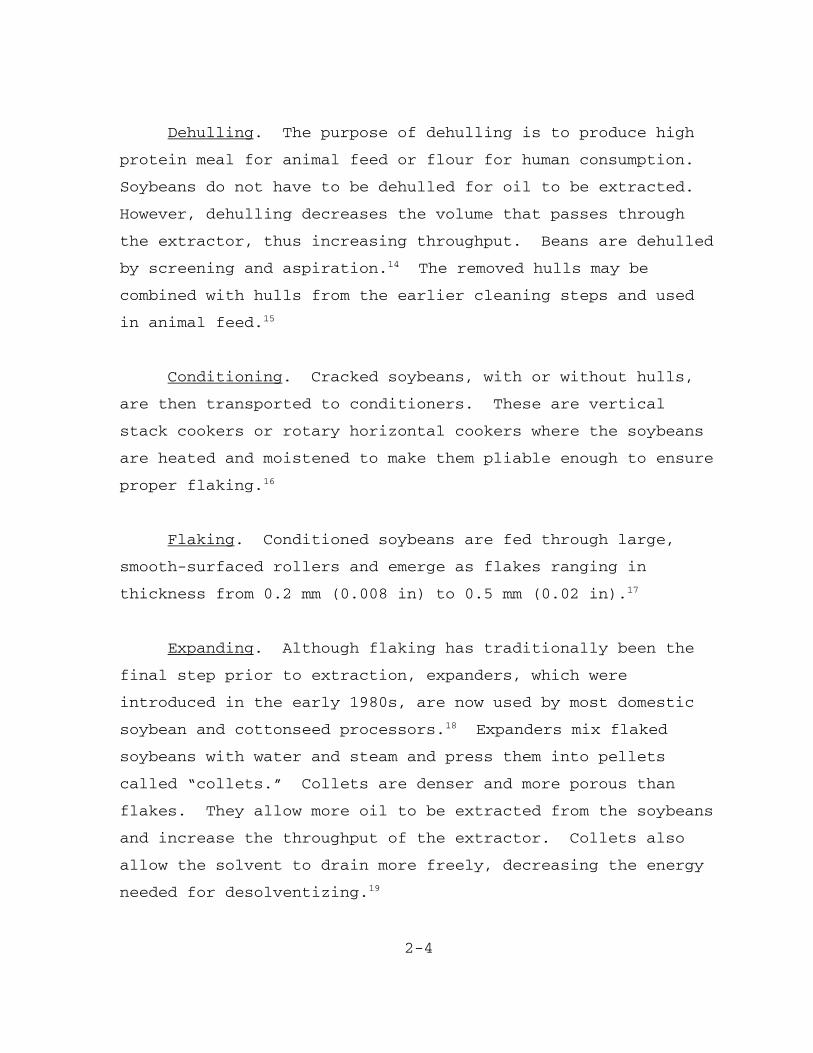
Dehulling. The purpose of dehulling is to produce high
protein meal for animal feed or flour for human consumption.
Soybeans do not have to be dehulled for oil to be extracted.
However, dehulling decreases the volume that passes through
the extractor, thus increasing throughput. Beans are dehulled
by screening and aspiration.14 The removed hulls may be
combined with hulls from the earlier cleaning steps and used
in animal feed.15
Conditioning. Cracked soybeans, with or without hulls,
are then transported to conditioners. These are vertical
stack cookers or rotary horizontal cookers where the soybeans
are heated and moistened to make them pliable enough to ensure
proper flaking.16
Flaking. Conditioned soybeans are fed through large,
smooth-surfaced rollers and emerge as flakes ranging in
thickness from 0.2 mm (0.008 in) to 0.5 mm (0.02 in).17
Expanding. Although flaking has traditionally been the
final step prior to extraction, expanders, which were
introduced in the early 1980s, are now used by most domestic
soybean and cottonseed processors.18 Expanders mix flaked
soybeans with water and steam and press them into pellets
called “collets.” Collets are denser and more porous than
flakes. They allow more oil to be extracted from the soybeans
and increase the throughput of the extractor. Collets also
allow the solvent to drain more freely, decreasing the energy
needed for desolventizing.19

2-5
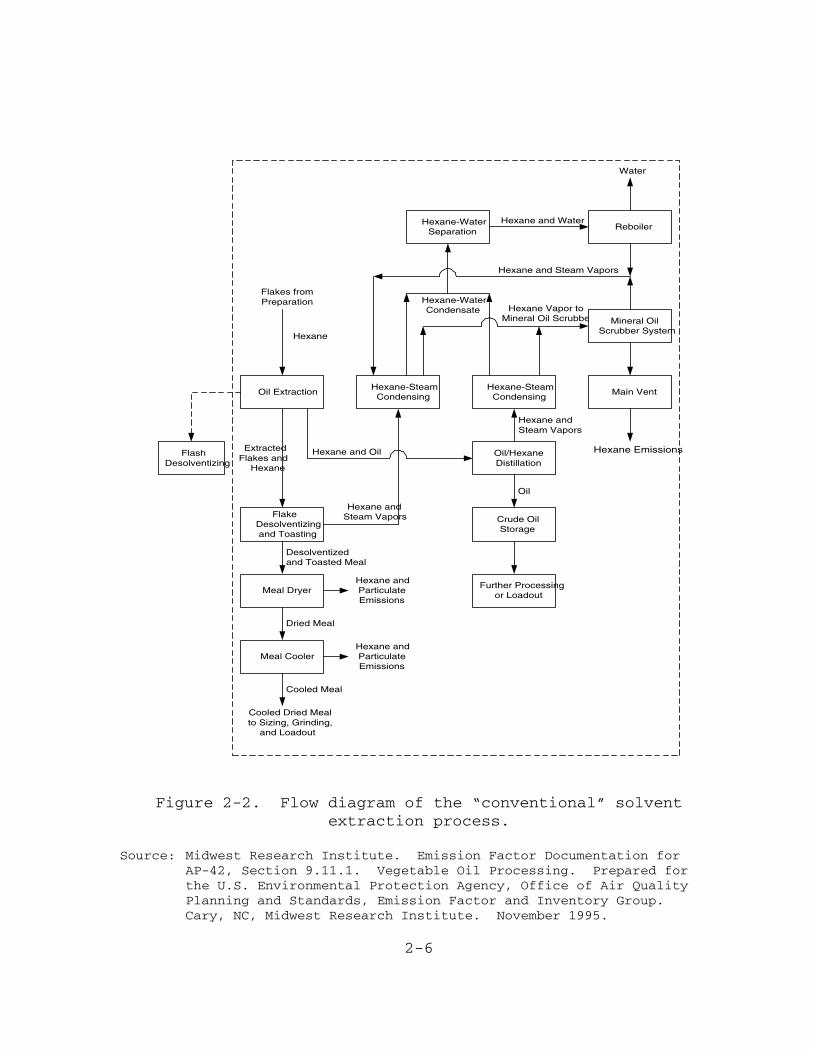
Solvent Extraction Process for Soybeans. Figure 2-2
shows a flow diagram of the conventional solvent extraction
process.20 The process uses the solvent hexane to dissolve the
oil present in the soybeans. The mixture of oil and hexane is
2-6
Hexane
Flakes fromPreparation
Hexane Vapor toMineral Oil Scrubber
Hexane Emissions
Hexane and Steam Vapors
Hexane and Oil
Hexane andSteam Vapors
Dried Meal
FlakeDesolventizingand Toasting
Meal DryerHexane andParticulateEmissions
Meal CoolerHexane andParticulateEmissions
Desolventizedand Toasted Meal
Cooled Meal
Cooled Dried Mealto Sizing, Grinding,
and Loadout
Oil
Oil/HexaneDistillation
Crude OilStorage
Further Processingor Loadout
Hexane-SteamCondensing
Oil Extraction
ExtractedFlakes and
Hexane
Hexane-SteamCondensing
Main Vent
Mineral OilScrubber System
FlashDesolventizing
Hexane-WaterSeparation
Hexane andSteam Vapors
Hexane-WaterCondensate
ReboilerHexane and Water
Water
Figure 2-2. Flow diagram of the “conventional” solventextraction process.
Source: Midwest Research Institute. Emission Factor Documentation forAP-42, Section 9.11.1. Vegetable Oil Processing. Prepared forthe U.S. Environmental Protection Agency, Office of Air QualityPlanning and Standards, Emission Factor and Inventory Group. Cary, NC, Midwest Research Institute. November 1995.
2-7
called “miscella.”21 There are several different types of
extractors, including rotary or deep-bed, horizontal belt, and
continuous loop extractors. Some immerse the solids in the
solvent, some percolate the solvent through the solids, and
some use a combination of both immersion and percolation.22
Rotary or deep-bed extractors have compartments or cells in
which solids are washed with successively less concentrated
miscella and finally with fresh solvent. At large facilities,
these cells can be as deep as 5 meters, hence the name “deep-
bed.” Horizontal belt extractors convey solids through a
series of solvent sprays. After percolating through the bed,
the miscella is collected in a hopper below the conveyor.
Continuous loop extractors are shallow-bed extractors that
carry the solid material through an enclosed vertical loop.
The solids go through both percolation and immersion, and are
completely turned over, allowing the solvent to contact flakes
from both sides.23
Solvent Recovery Process for Soybean Oil. The solvent
recovery process is the separation of solvent from both oil
and meal. Solvent leaves the extractor both in miscella and
as residual on the defatted flakes. The process of removing
solvent from each is described below as well as a discussion
of solvent losses. Vapors from either of the desolventizing
processes pass through the vapor recovery system previously
described.
Removing solvent from miscella. Solvent is removed from
the miscella by double-effect evaporation and steam stripping.
2-8
First, it passes through a long-tube vertical evaporator with
a vapor dome. As the miscella passes through the tubes, it is
heated, and 70 to 85 percent of the solvent evaporates. The
second-stage evaporator, which further concentrates the
miscella, is a rising film evaporator that operates under
partial vacuum. Most remaining solvent is finally removed as
the oil passes through an oil stripper where, under vacuum, it
is exposed to steam and then an oil dryer. The crude oil then
goes into storage to await refining.
Vapors pass through a condenser and a mineral oil
absorption system, which removes solvent from the air before
it is discharged. This system includes a packed absorption
column, a packed steam-jacketed stripping column and heat
exchangers.24
Removing solvent from spent soybean flakes. Defatted
flakes generally contain 35 to 40 percent solvent that must be
recovered before the flakes are used.25 (Flakes that have been
processed with expanders may contain as little as 25 percent
residual hexane.26) If the flakes will be used for animal
feed, they will undergo conventional desolventizing. If they
will be used for human consumption, they will undergo flash
desolventizing, which better preserves nutritional value.
Conventional desolventizing involves conveying the spent
flakes through a desolventizer-toaster (DT), where they are
toasted to about 100°C (212°F) and treated with both contact
and noncontact steam to remove solvent.
2-9
Flash desolventized, which is used on less than 5 percent
of soybeans processed, involves either processing flakes under
vacuum with noncontact steam or passing them through a loop
using superheated hexane. Flakes are then treated with small
quantities of steam in a rotary or agitated vessel. The
flakes produced by flash desolventizing are called “white
flakes.”
Solvent loss. Processing plants recover and reuse almost
all solvent. Losses may occur, however, through leaks in
equipment and process seals, and through retention by the meal
and oil. Because of the nature of the processes, hexane
losses from flash desolventizing tend to be higher than for
conventional desolventizing.27 Total solvent loss in a well-
run plant can be as low as 0.5 kg of solvent per metric ton of
beans processed (0.2 gal/short ton). About half of the loss
usually comes from residual solvent that remains in the meal
after desolventizing.28 This loss occurs during meal drying
and cooling, which are described below.
Further Processing of Meals and Oil. Following the
desolventizing process, meals and oils are further processed
for their respective end uses. These processes are described
briefly below.
Meal drying and cooling. Meal that has undergone
desolventizing-toasting is about 105°C (221°F) and contains
16 to 20 percent moisture. It must pass through drying and
cooling units. In the drying unit, hot air is blown into the
2-10
meal from below. Excessive heat and air velocity must be
avoided to minimize the risk of fire and excessive dust. The
same process is used for cooling, except the air used is at
room temperature.29
During drying and cooling, the air removes some residual
solvent from the meal in addition to dust. This air may be
passed through a particulate control device before being
released to the atmosphere. Once cooling and drying are
complete, the meal is ground, sized, and shipped for further
processing.
Further processing of crude oil. The oil produced by the
extraction process is crude oil that contains proteinaceous
material, free fatty acids, phosphatides, and other impurities
that must be removed before the oil is used.30 To remove these
impurities, the oil must undergo degumming, refining,
bleaching, and deodorizing. Each of these is described below.
Degumming. Sometimes processors “degum” crude oil to
remove phosphatides, or vegetable gums. This process prepares
the oil for long-term storage, transport, or further refining
and also produces lecithin, a food additive. Processors degum
crude oil by mixing it with water, then they put it through
settling or centrifugation to separate the gum.31
Caustic refining. The most common process for refining
vegetable oils is caustic refining. Oil may or may not be
degummed prior to caustic refining. Caustic refining involves
2-11
mixing the oil with an aqueous alkali solution. The alkali
neutralizes the free fatty acids, creating “soapstock.” The
soapstock then adsorbs colors and precipitates gums and
proteinaceous materials. Soapstock is removed by settling or
centrifugation. The oil is then washed with water to remove
residual soap.32
Physical refining. Physical refining, an alternative to
caustic refining for some oils, is a steam-stripping process
whereby steam is injected into the oil under low pressure and
high temperature, thus vaporizing impurities. Although this
process is feasible with palm oil, it is currently infeasible
for processing soybeans because of problems with flavor
stability. This method has received attention from
researchers because it has the advantage of not producing
soapstock, a waste product that may create water pollution
problems.33
Bleaching. The purpose of bleaching is to reduce or
remove the following: pigments, oxidation products,
phosphatides, soaps, and trace metals. Bleaching also
improves the flavor of the oil. The products used for soybean
bleaching are neutral earth, acid-activated earths, activated
carbon, and silicates. Diatomaceous earth or another inert
material may also be used to aid filtering. The process
involves mixing the oil with the earth, heating the mixture,
then filtering.34
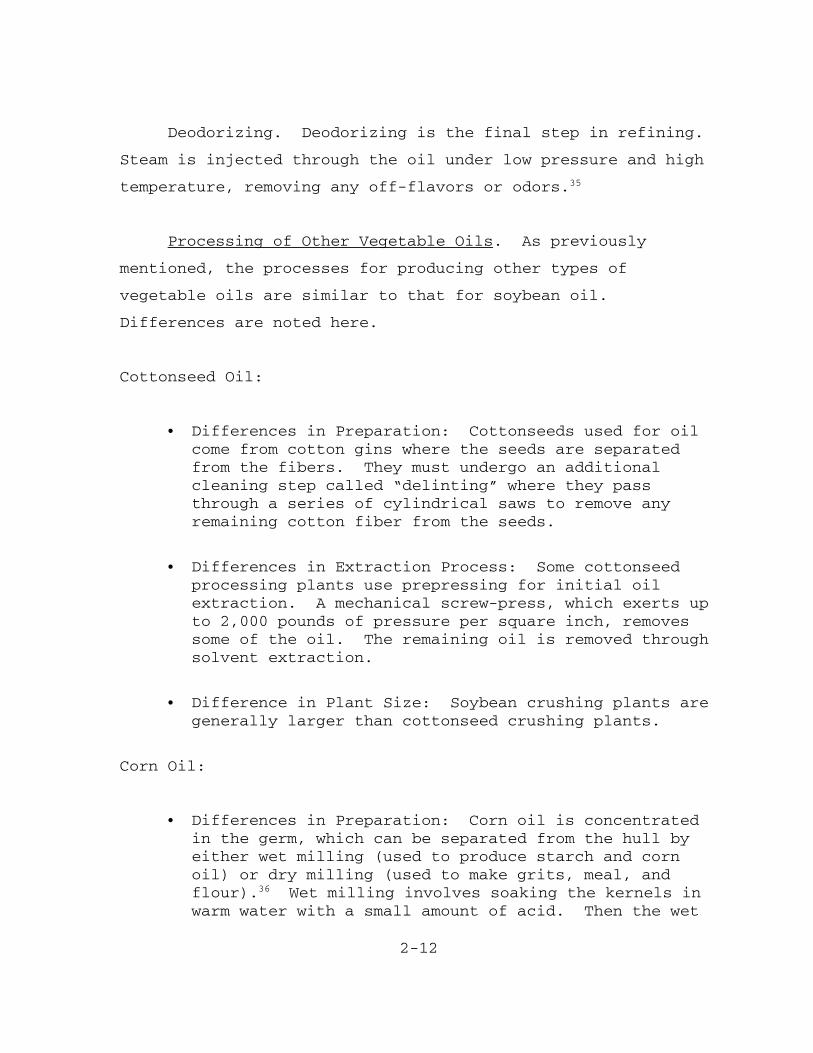
2-12
Deodorizing. Deodorizing is the final step in refining.
Steam is injected through the oil under low pressure and high
temperature, removing any off-flavors or odors.35
Processing of Other Vegetable Oils. As previously
mentioned, the processes for producing other types of
vegetable oils are similar to that for soybean oil.
Differences are noted here.
Cottonseed Oil:
� Differences in Preparation: Cottonseeds used for oilcome from cotton gins where the seeds are separatedfrom the fibers. They must undergo an additionalcleaning step called “delinting” where they passthrough a series of cylindrical saws to remove anyremaining cotton fiber from the seeds.
� Differences in Extraction Process: Some cottonseedprocessing plants use prepressing for initial oilextraction. A mechanical screw-press, which exerts upto 2,000 pounds of pressure per square inch, removessome of the oil. The remaining oil is removed throughsolvent extraction.
� Difference in Plant Size: Soybean crushing plants aregenerally larger than cottonseed crushing plants.
Corn Oil:
� Differences in Preparation: Corn oil is concentratedin the germ, which can be separated from the hull byeither wet milling (used to produce starch and cornoil) or dry milling (used to make grits, meal, andflour).36 Wet milling involves soaking the kernels inwarm water with a small amount of acid. Then the wet
2-13
corn is ground into a slurry and passed through germseparators. Here the germ is separated, washed toremove starch, and dried.37
� Differences in Extraction Process: Corn oil processorsremove about 80 percent of the oil from the germ byprepressing and use solvent extraction to remove therest.
Peanut Oil:
� Differences in Extraction Process: Prepressing removesabout 50 percent of the oil from peanuts. Solventextraction removes the rest.
2.1.2 Inputs
The primary inputs to vegetable oil processing are the
specialized inputs, oilseeds and hexane, and the
nonspecialized inputs, labor, capital, and energy. In this
section, each specialized input is described.
Oilseeds. Oilseeds are the primary input in the
production of vegetable oils. Domestically produced oilseeds
include soybean, corn, cottonseed, peanut, sunflower,
safflower, and canola (rapeseed). Because oilseeds are
agricultural products, their supply is determined by many
factors, including weather, disease, costs of agricultural
chemicals, prices of commodities, and government programs. In
particular, corn, soybean, and cotton production have been
affected by government programs. However, in the future,
government programs will play a less significant role in
determining the supply of agricultural products. The
2-14
1995-1996 growing season was the last to be regulated under
the 1990 Food, Agriculture, Conservation and Trade Act. This
Act contained numerous provisions intended to stabilize farm
income and regulate supply through acreage restrictions and
payments to farmers. The Federal Agricultural Improvement and
Reform Act of 1996 (also called the 1996 Farm Bill) legislates
major changes in federal agricultural programs. It provides
for a 7-year transition period of declining government
involvement in agriculture and payments to farmers that are
decoupled from production volumes.38 Thus, in the future, farm
programs will no longer affect the price or production of any
of the oilseeds.
Hexane. Hexane is the solvent used commercially to
extract vegetable oils. It is not pure hexane but is a
petroleum fraction that is a mixture of 6-carbon-atom
saturated hydrocarbons. The components of extraction-grade
hexane vary depending on suppliers. It will typically consist
of from 50 percent to 90 percent n-hexane by volume. It may
also contain isohexane and methylcyclopentane. The boiling
point is critical and may range between 65 and 70°C (149 to
158°F). Impurities such as sulfur, benzene, and other
aromatic compounds must be avoided in hexane used for
extraction because they may cause odors or toxicity.
Scientists have explored the possibility of alternative
solvents for vegetable oil extraction. A desirable solvent
would have the following characteristics: plentiful supply,
low toxicity, nonflammability, high solvency power, ease of
2-15
separation from extracted material, desirable boiling point,
low specific heat, low latent heat of vaporization, and high
stability. The disadvantages of hexane are its flammability
and dependence on the supply of petroleum. Because of
hexane’s flammability, processing plants must have very high
safety standards. Researchers have considered aqueous or
supercritical carbon dioxide extraction for vegetable oils.
This method has not yet been shown to be feasible and would
not be adaptable to existing plants without major capital
expenditures.39 At present, hexane is the best solvent
available to vegetable oil processors.
2.2 TYPES OF PRODUCTS AND SERVICES
The major domestic oil crops include soy, corn,
cottonseed, peanut, and sunflower. The minor oil crops
include canola, flax seed, mustard, canola (rapeseed), and
safflower.40 The following section describes each of the three
most significant oils: soybean, corn, and cottonseed.
2.2.1 Soybean Oil
Soybean oil makes up over 75 percent of the edible fats
and oils consumed in the United States.41 It also has an
number of industrial uses. Several characteristics make
soybean oil desirable. It has a high level of unsaturated
fat, it remains liquid over a wide temperature range, it can
be partially hydrogenated, it can be readily refined, and it
2-16
contains naturally occurring antioxidants. It has two
disadvantages:
� It has a relatively high content of phosphatides thatmust be removed in processing.
� Its high polyunsaturated fatty acid content makes itsusceptible to oxidation and flavor changes.
Salad oil, cooking oils, and frying fats can be made from pure
soybean oil. Semisolid shortenings can contain mostly
partially hydrogenated soybean oil with small amounts of
completely hydrogenated palm or cottonseed oil. Soybean oil
is the primary oil used in the manufacture of margarine.
2.2.2 Corn Oil
Corn oil is a very high quality oil because of its high
polyunsaturated fatty acid content and its low linolenic acid
content. Production of corn oil has increased recently
because of increased demand for other corn products that are
produced jointly with corn oil. These include ethanol for the
fuel market and high-fructose corn syrup.42
2.2.3 Cottonseed Oil
Cottonseed oil is higher in saturated fats than soybean
oil but has a very low linolenic acid content. Cottonseed oil
has become popular because of its functionality and flavor.
Acreage of cotton has remained stable in the United States,
while the demand for whole cotton seeds as a dairy feed and
2-17
oil seed has increased. The increased domestic demand has
caused a decrease in exports.43
2.3 MAJOR BY-PRODUCTS, CO-PRODUCTS, AND SUBSTITUTIONPOSSIBILITIES
A number of other commodities, such as cake or meal,
hulls, and linters, are produced jointly with vegetable oil.
In the case of corn oil, joint products also include corn
starch; corn sweeteners, including high-fructose corn syrup;
corn gluten feed; and corn gluten meal. By-products of the
degumming and refining processes also include lecithin,
soapstocks, deodorizing distillates, and spent bleaching
earth.44
2.3.1 Cake and Meal
Cake or meal is the residue left after the oil is
extracted from a seed, nut, or kernel. Most cake or meal is
used in high-protein animal feeds. Small amounts of soybean
meal (about 2 percent) are used for human consumption.45
2.3.2 Hulls
Hulls are the outer covering of soybeans and oilseeds.
Hulls are removed from cottonseeds, sunflower seed, peanuts,
and soybeans, but not from canola prior to extracting oil.
They are used primarily in animal feeds.
2.3.3 Linters
2-18
Linters are the short fibers that adhere to cottonseeds
and must be removed prior to processing. These fibers have
commercial value.
2.3.4 Lecithin
Lecithin is a mixed phosphatide product that results from
the degumming process. Food processors use it as a wetting
and dispersing agent, an emulsifier, and an antioxidant.
Lecithin also has many uses in pharmaceuticals, cosmetics,
animal feeds, and other industries.46 The supply of lecithin
is two to three times greater than the demand. To dispose of
excess lecithin, processors may add it to the meal or dispose
of it in the soapstock.47
2.3.5 Soapstock
Soapstock, a by-product of the caustic refining process,
has commercial value in animal feed and in the manufacture of
soap and other chemicals. In 1992 the National Oilseed
Processors Association changed the name from soapstock to
refining by-product lipid to better reflect the product’s use
as an animal feed.48
2.3.6 Deodorizing Distillates
Deodorizing distillates contain tocopherols and sterols,
both of which have commercial value. Tocopherols are used to
manufacture vitamin E and other antioxidants. The
2-19
pharmaceutical industry uses sterols in the production of many
drugs including hormones and steroids.49
2.3.7 Spent Bleaching Earth
Spent bleaching earth, which is a mixture of clay and
oil, must be handled with care because it is flammable.
Processors can add it to animal feed, and the oil adds
calories and the clay reduces caking. It can also be burned
as a fuel, mixed with organic materials and composted, or
disposed of in a landfill after treatment with water to reduce
flammability.50
Table 2-1 contains the dollar values for vegetable oil
and major co-products for corn, soybeans, cottonseed, and
peanuts.51,52 With the exception of peanut oil, the value of
other products exceeds the value of the oil.
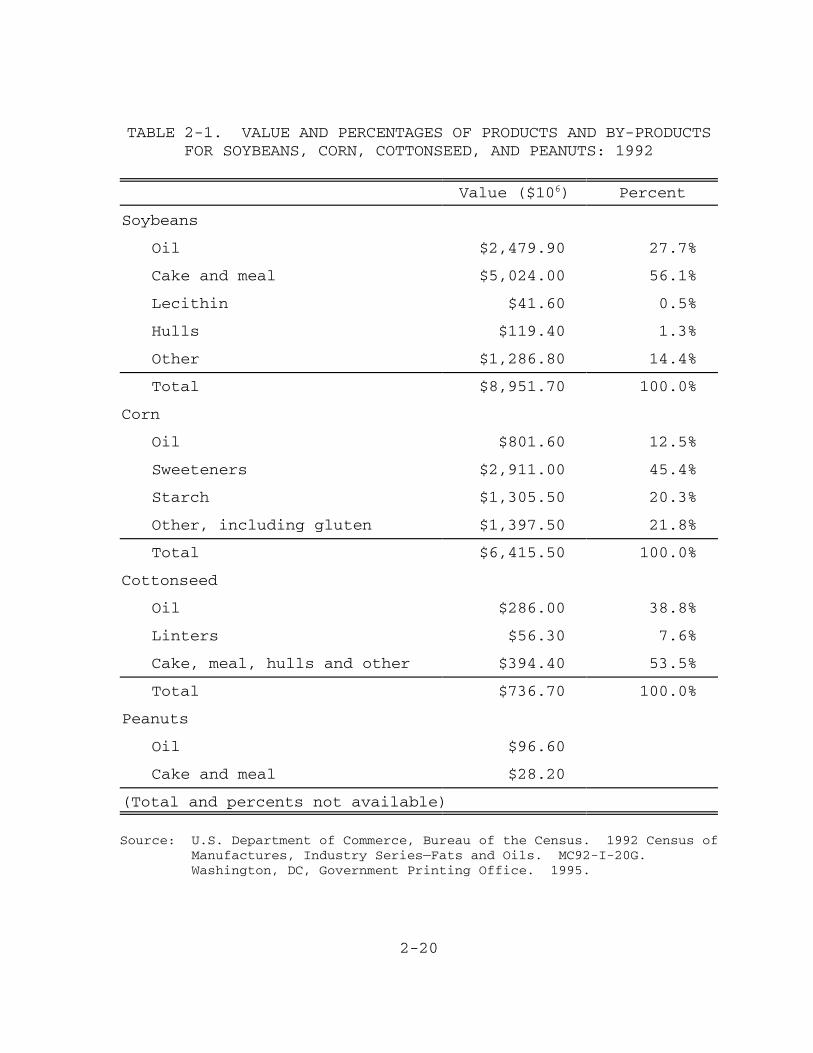
2-20
TABLE 2-1. VALUE AND PERCENTAGES OF PRODUCTS AND BY-PRODUCTSFOR SOYBEANS, CORN, COTTONSEED, AND PEANUTS: 1992
Value ($106) Percent
Soybeans
Oil $2,479.90 27.7%
Cake and meal $5,024.00 56.1%
Lecithin $41.60 0.5%
Hulls $119.40 1.3%
Other $1,286.80 14.4%
Total $8,951.70 100.0%
Corn
Oil $801.60 12.5%
Sweeteners $2,911.00 45.4%
Starch $1,305.50 20.3%
Other, including gluten $1,397.50 21.8%
Total $6,415.50 100.0%
Cottonseed
Oil $286.00 38.8%
Linters $56.30 7.6%
Cake, meal, hulls and other $394.40 53.5%
Total $736.70 100.0%
Peanuts
Oil $96.60
Cake and meal $28.20
(Total and percents not available)
Source: U.S. Department of Commerce, Bureau of the Census. 1992 Census ofManufactures, Industry Series—Fats and Oils. MC92-I-20G. Washington, DC, Government Printing Office. 1995.

2-21
U.S. Department of Commerce, Bureau of the Census. 1992 Census ofManufactures, Industry Series—Grain Mill Products. MC92-1-20D. Washington, DC, Government Printing Office. 1995.
2-22
2.4 COSTS OF PRODUCTION
Oilseed processing facilities are considered to be
“commodity businesses.” They are market-driven, low-margin,
high-volume operations that produce a generic product from a
widely available raw material.53
Table 2-2 contains aggregate information on costs for the
vegetable oil industry by SIC code.54,55 It includes costs for
payroll, materials, and new capital expenditures, as well as
value of shipments.
Material costs include five components:
� parts used in the manufacture of finished goods(materials, parts, containers, and suppliesincorporated into products or directly consumed in theprocess);
� purchased items later resold without furthermanufacture;
� fuels;
� electricity;
� commissions or fees to outside parties for contractmanufacturing.56
For comparison, costs are listed in both current and 1992
dollars.

2-23
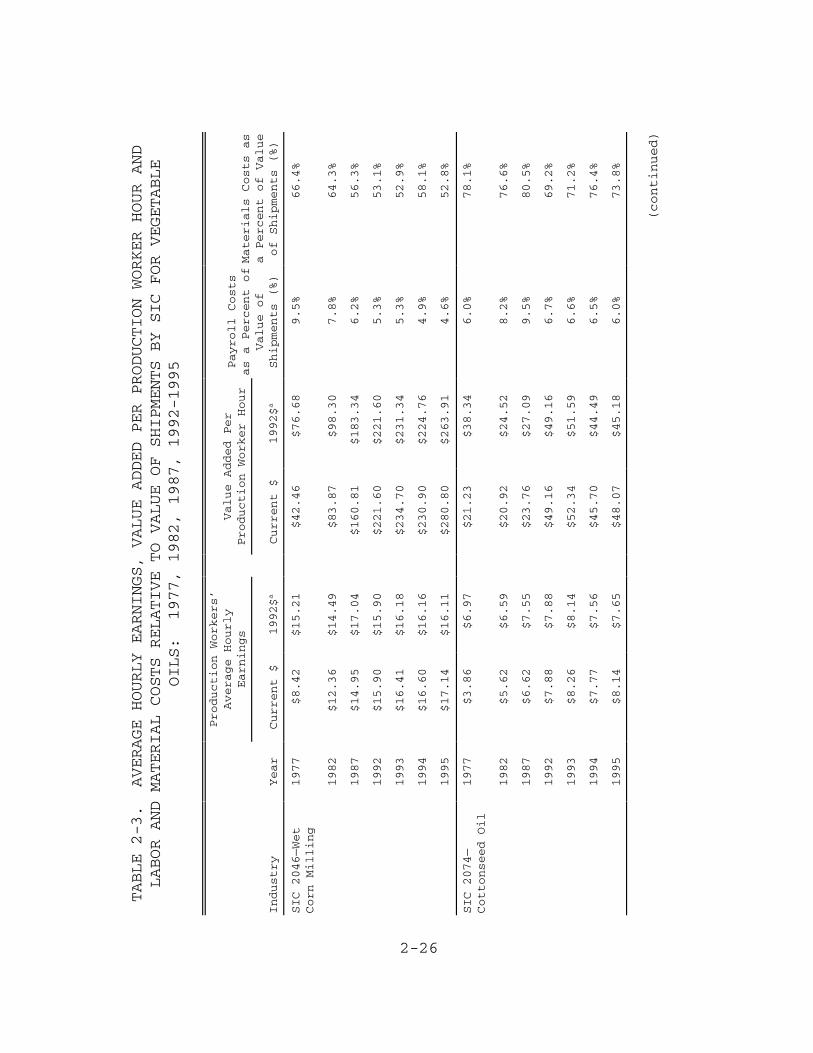
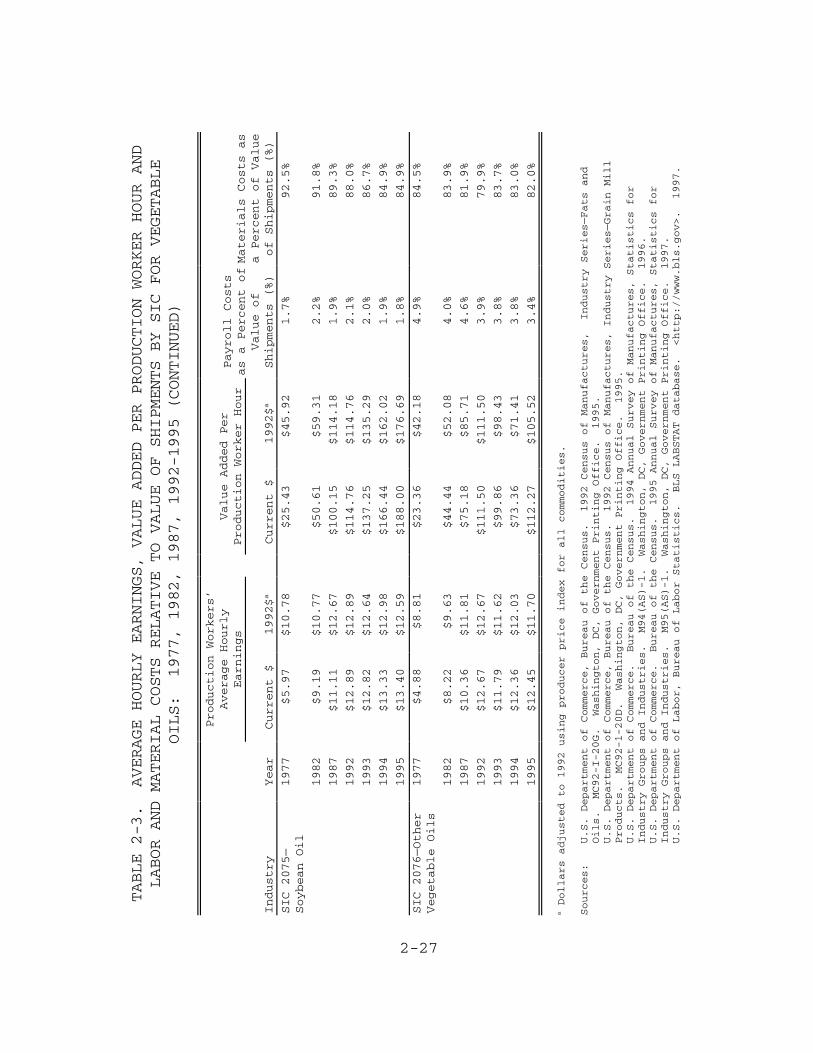
Table 2-3 presents average hourly earnings, value added
per production worker hour, and payroll and materials as a
percentage of value of shipments.57,58,59,60,61 In 1995, materials
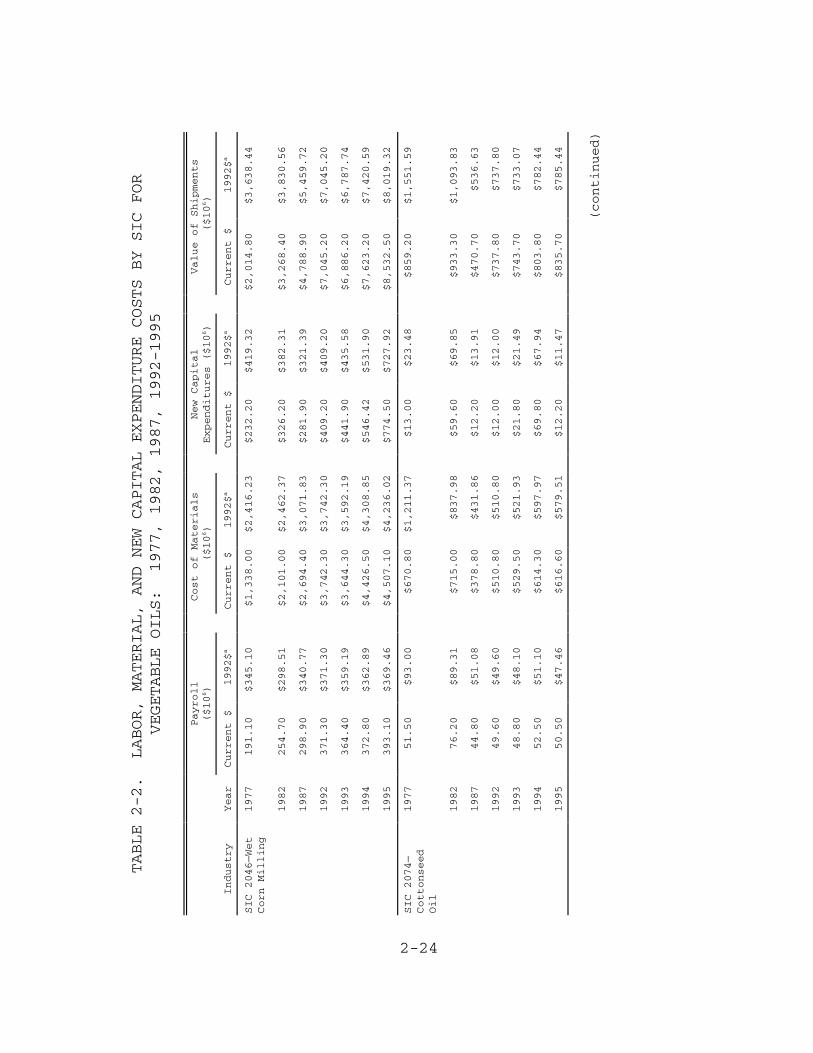
2-24
TABLE 2-2. LABOR, MATERIAL, AND NEW CAPITAL EXPENDITURE COSTS BY SIC FOR
VEGETABLE OILS: 1977, 1982, 1987, 1992-1995
Payroll
($106)
Cost of Materials
($106)
New Capital
Expenditures ($106)
Value of Shipments
($106)
Industry
Year
Current $
1992$a
Current $
1992$a
Current $
1992$a
Current $
1992$a
SIC 2046—Wet
Corn Milling
1977
191.10
$345.10
$1,338.00
$2,416.23
$232.20
$419.32
$2,014.80
$3,638.44
1982
254.70
$298.51
$2,101.00
$2,462.37
$326.20
$382.31
$3,268.40
$3,830.56
1987
298.90
$340.77
$2,694.40
$3,071.83
$281.90
$321.39
$4,788.90
$5,459.72
1992
371.30
$371.30
$3,742.30
$3,742.30
$409.20
$409.20
$7,045.20
$7,045.20
1993
364.40
$359.19
$3,644.30
$3,592.19
$441.90
$435.58
$6,886.20
$6,787.74
1994
372.80
$362.89
$4,426.50
$4,308.85
$546.42
$531.90
$7,623.20
$7,420.59
1995
393.10
$369.46
$4,507.10
$4,236.02
$774.50
$727.92
$8,532.50
$8,019.32
SIC 2074—
Cottonseed
Oil
1977
51.50
$93.00
$670.80
$1,211.37
$13.00
$23.48
$859.20
$1,551.59
1982
76.20
$89.31
$715.00
$837.98
$59.60
$69.85
$933.30
$1,093.83
1987
44.80
$51.08
$378.80
$431.86
$12.20
$13.91
$470.70
$536.63
1992
49.60
$49.60
$510.80
$510.80
$12.00
$12.00
$737.80
$737.80
1993
48.80
$48.10
$529.50
$521.93
$21.80
$21.49
$743.70
$733.07
1994
52.50
$51.10
$614.30
$597.97
$69.80
$67.94
$803.80
$782.44
1995
50.50
$47.46
$616.60
$579.51
$12.20
$11.47
$835.70
$785.44
(continued)
2-25
TABLE 2-2. LABOR, MATERIAL, AND NEW CAPITAL EXPENDITURE COSTS BY SIC FOR
VEGETABLE OILS: 1977, 1982, 1987, 1992-1995 (CONTINUED)
Payroll
($106)
Cost of Materials
($106)
New Capital
Expenditures ($106)
Value of Shipments ($106)
Industry
Year
Current $
1992$a
Current $
1992$a
Current $
1992$a
Current $
1992$a
SIC 2075—
Soybean Oil
1977
130.70
$236.03
$7,012.80
$12,664.10
$72.30
$130.56
$7,580.00
$13,688.38
1982
188.70
$221.16
$7,896.80
$9,255.05
$113.40
$132.90
$8,603.60
$10,083.42
1987
172.50
$196.66
$8,103.30
$9,238.39
$90.70
$103.41
$9,074.10
$10,345.18
1992
225.30
$225.30
$9,372.50
$9,372.50
$123.20
$123.20
$10,650.60
$10,650.60
1993
230.70
$227.40
$10,153.00
$10,007.84
$146.70
$144.60
$11,705.00
$11,537.65
1994
239.80
$233.43
$10,605.90
$10,324.02
$137.00
$133.36
$12,496.20
$12,164.08
1995
242.80
$228.20
$11,272.30
$10,594.33
$161.70
$151.97
$13,275.50
$12,477.05
SIC
2076—Other
Vegetable
Oils
1977
17.60
$31.78
$304.70
$550.24
$7.40
$13.36
$360.80
$651.55
1982
22.30
$26.14
$467.00
$547.32
$66.90
$78.41
$556.90
$652.69
1987
19.90
$22.69
$353.30
$402.79
$4.90
$5.59
$431.50
$491.94
1992
26.20
$26.20
$532.30
$532.30
$10.40
$10.40
$666.20
$666.20
1993
27.50
$27.11
$603.80
$595.17
$8.10
$7.98
$721.10
$710.79
1994
24.20
$23.56
$522.70
$508.81
$6.00
$5.84
$630.00
$613.26
1995
24.70
$23.21
$591.90
$556.30
$4.60
$4.32
$721.70
$678.29
a Dollars adjusted to 1992 using producer price index for all commodities.
Sources:
U.S. Department of Commerce, Bureau of the Census. 1992 Census of Manufactures, Industry Series—Fats and Oils.
MC92-I-20G. Washington, DC, Government Printing Office. 1995.
U.S. Department of Commerce, Bureau of the Census. 1992 Census of Manufactures, Industry Series—Grain Mill
Products. MC92-I-20D. Washington, DC, Government Printing Office. 1995.
2-26
TABLE 2-3. AVERAGE HOURLY EARNINGS, VALUE ADDED PER PRODUCTION WORKER HOUR AND
LABOR AND MATERIAL COSTS RELATIVE TO VALUE OF SHIPMENTS BY SIC FOR VEGETABLE
OILS: 1977, 1982, 1987, 1992-1995
Industry
Year
Production Workers’
Average Hourly
Earnings
Value Added Per
Production Worker Hour
Payroll Costs
as a Percent of
Value of
Shipments (%)
Materials Costs as
a Percent of Value
of Shipments (%)
Current $
1992$a
Current $
1992$a
SIC 2046—Wet
Corn Milling
1977
$8.42
$15.21
$42.46
$76.68
9.5%
66.4%
1982
$12.36
$14.49
$83.87
$98.30
7.8%
64.3%
1987
$14.95
$17.04
$160.81
$183.34
6.2%
56.3%
1992
$15.90
$15.90
$221.60
$221.60
5.3%
53.1%
1993
$16.41
$16.18
$234.70
$231.34
5.3%
52.9%
1994
$16.60
$16.16
$230.90
$224.76
4.9%
58.1%
1995
$17.14
$16.11
$280.80
$263.91
4.6%
52.8%
SIC 2074—
Cottonseed Oil
1977
$3.86
$6.97
$21.23
$38.34
6.0%
78.1%
1982
$5.62
$6.59
$20.92
$24.52
8.2%
76.6%
1987
$6.62
$7.55
$23.76
$27.09
9.5%
80.5%
1992
$7.88
$7.88
$49.16
$49.16
6.7%
69.2%
1993
$8.26
$8.14
$52.34
$51.59
6.6%
71.2%
1994
$7.77
$7.56
$45.70
$44.49
6.5%
76.4%
1995
$8.14
$7.65
$48.07
$45.18
6.0%
73.8%
(continued)
2-27
TABLE 2-3. AVERAGE HOURLY EARNINGS, VALUE ADDED PER PRODUCTION WORKER HOUR AND
LABOR AND MATERIAL COSTS RELATIVE TO VALUE OF SHIPMENTS BY SIC FOR VEGETABLE
OILS: 1977, 1982, 1987, 1992-1995 (CONTINUED)
Industry
Year
Production Workers’
Average Hourly
Earnings
Value Added Per
Production Worker Hour
Payroll Costs
as a Percent of
Value of
Shipments (%)
Materials Costs as
a Percent of Value
of Shipments (%)
Current $
1992$a
Current $
1992$a
SIC 2075—
Soybean Oil
1977
$5.97
$10.78
$25.43
$45.92
1.7%
92.5%
1982
$9.19
$10.77
$50.61
$59.31
2.2%
91.8%
1987
$11.11
$12.67
$100.15
$114.18
1.9%
89.3%
1992
$12.89
$12.89
$114.76
$114.76
2.1%
88.0%
1993
$12.82
$12.64
$137.25
$135.29
2.0%
86.7%
1994
$13.33
$12.98
$166.44
$162.02
1.9%
84.9%
1995
$13.40
$12.59
$188.00
$176.69
1.8%
84.9%
SIC 2076—Other
Vegetable Oils
1977
$4.88
$8.81
$23.36
$42.18
4.9%
84.5%
1982
$8.22
$9.63
$44.44
$52.08
4.0%
83.9%
1987
$10.36
$11.81
$75.18
$85.71
4.6%
81.9%
1992
$12.67
$12.67
$111.50
$111.50
3.9%
79.9%
1993
$11.79
$11.62
$99.86
$98.43
3.8%
83.7%
1994
$12.36
$12.03
$73.36
$71.41
3.8%
83.0%
1995
$12.45
$11.70
$112.27
$105.52
3.4%
82.0%
a Dollars adjusted to 1992 using producer price index for all commodities.
Sources:
U.S. Department of Commerce, Bureau of the Census. 1992 Census of Manufactures, Industry Series—Fats and
Oils. MC92-I-20G. Washington, DC, Government Printing Office. 1995.
U.S. Department of Commerce, Bureau of the Census. 1992 Census of Manufactures, Industry Series—Grain Mill
Products. MC92-1-20D. Washington, DC, Government Printing Office. 1995.
U.S. Department of Commerce. Bureau of the Census. 1994 Annual Survey of Manufactures, Statistics for
Industry Groups and Industries. M94(AS)-1. Washington, DC, Government Printing Office. 1996.
U.S. Department of Commerce. Bureau of the Census. 1995 Annual Survey of Manufactures, Statistics for
Industry Groups and Industries. M95(AS)-1. Washington, DC, Government Printing Office. 1997.
U.S. Department of Labor, Bureau of Labor Statistics. BLS LABSTAT database. <http://www.bls.gov>. 1997.
*A metric ton is equal to 2.2046 short tons.
2-28
costs as a percentage of value of shipments ranged from 52.8
percent for wet corn millers to 84.9 percent for soybean oil
producers. (Not all wet corn milling facilities produce corn
oil. As of 1996, it is estimated that nine corn mills were
engaged in corn oil production using solvent extraction.62
Payroll costs in the vegetable oil industry are fairly small
relative to value of shipments. In 1995, cottonseed oil
producers and wet corn millers had the highest payroll costs
relative to value of shipments (6.0 percent and 4.6 percent)
and soybean oil producers had the lowest (1.8 percent).
Soybean crushing plants with daily crushing capacities
between 1,000 and 3,000 metric tons per day have capital
installation costs ranging from $22,500 to $33,000 per metric
ton* of daily capacity, with an average of $27,500.
Differences can be attributed to site conditions, building
design, extent of automation, amount of storage, type of
shipping and receiving, and availability of utilities and
waste treatment. Capital costs per ton are higher for smaller
plants and lower for larger plants.63
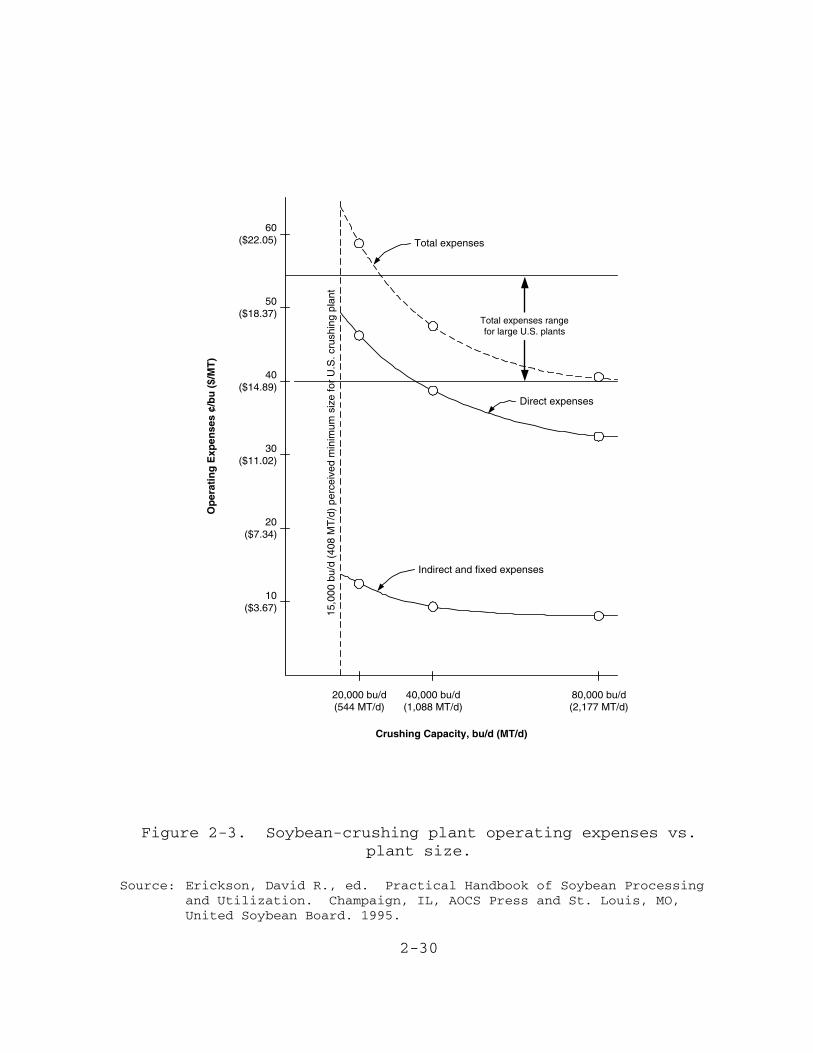
As indicated in Figure 2-3, operating expenses for
soybean-crushing plants average about $16.50 per metric ton,
ranging from $14.75 for the largest plants to $22.10 for the
*The source of this information was published in 1995. The year for whichthe dollars are reported is not given. Dollar amounts most likely referto the early 1990s.
2-29
smallest.64 Operating expenses vary across plants because of
differences in capacity and process design.65,*
2-30
20,000 bu/d(544 MT/d)
40,000 bu/d(1,088 MT/d)
80,000 bu/d(2,177 MT/d)
Crushing Capacity, bu/d (MT/d)
10($3.67)
40($14.89)
20($7.34)
30($11.02)
50($18.37)
60($22.05)
Op
erat
ing
Exp
ense
s ¢/
bu
($/
MT
)
15,0
00 b
u/d
(408
MT
/d)
perc
eive
d m
inim
um s
ize
for
U.S
. cru
shin
g pl
ant
Total expenses rangefor large U.S. plants
Indirect and fixed expenses
Direct expenses
Total expenses
Figure 2-3. Soybean-crushing plant operating expenses vs.plant size.
Source: Erickson, David R., ed. Practical Handbook of Soybean Processingand Utilization. Champaign, IL, AOCS Press and St. Louis, MO,United Soybean Board. 1995.

2-31
3-1
SECTION 3
THE DEMAND SIDE
In this section, the demand side of the vegetable oil
industry is described. First, the functional and nutritional
characteristics of vegetable oils that consumers consider to
be desirable are described. Next, the consumers are described
as well as the uses of vegetable oils. Finally, the
elasticities of demand for vegetable oils are provided, and
substitution possibilities are described.
3.1 PRODUCT CHARACTERISTICS
Oil purchasing agents normally buy oils in accordance
with the specifications adopted by the National Oilseed
Processors Association or the American Oilseed Association.
These specifications require the oil to have a bland flavor
and no odor and to meet many other specific criteria for
physical characteristics and chemical composition.66
According to Monoj Gupta, principal scientist at Frito-Lay,
Inc. “When selecting an oil, we first look for the flavor of
the product, then aftertaste, aroma, consumer acceptance and
shelf life stability.”67
3-2
The factors that influence the food processor’s or
consumer’s choice of vegetable oil can be grouped into two
categories:
� Functional characteristics and
� Perceptions about health effects.
This section describes the functional characteristics of
vegetable oils required by consumers and food processors and
the current thinking on the health effects of various fats and
oils.
3.1.1 Functional Characteristics
Functional characteristics determine how suitable a fat
or oil is for a particular purpose. Important functional
characteristics of fats and oils are melting behavior, crystal
structure, resistance to oxidation, and flavor.
Melting Behavior. Melting behavior is the temperature at
which and the speed with which a fat or oil becomes liquid.
The desired melting behavior varies depending on the intended
use for the fat or oil. For example, in the production of
margarine, processors require a fat that is soft at room
temperature and melts quickly at body temperature. Bakers
prefer shortening that has a high melting point for good
baking performance. Salad oils must be completely liquid at
room temperature.68
3-3
Crystal Structure. The crystal structure of a fat or oil
determines its texture. The appropriate crystal structure is
especially important in margarine for creating a desirable
“mouthfeel” and in shortening for providing texture and volume
to baked goods. Crystal structure is not as important in
frying shortenings and salad oils.69
Resistance to Oxidation. Oxidation causes rancidity and
off-flavors and must be avoided in all uses of vegetable fats
and oils. This factor is especially important in frying
shortenings that must be stable at high temperatures and in
salad oils where flavor is very important.70 High levels of
linolenic acid make vegetable oils more likely to oxidize.
Hydrogenation increases resistance to oxidation. Oils with
high levels of linolenic acid may require hydrogenation to
improve stability. Scientists have bred new varieties of
soybeans that yield oil with improved characteristics, such as
lower levels of linolenic acid.71
Flavor. In general, it is desirable for vegetable oils
to have little or no flavor, no odor, and no aftertaste.
Flavors and odors are removed during the refining, bleaching,
and deodorizing processes described in Section 2.72
3.1.2 Perceptions About Health Effects
Since the 1960s, dietary fat has been implicated as a
cause of heart disease. As scientists continue to learn about
the effects of various types of fats, specific dietary
3-4
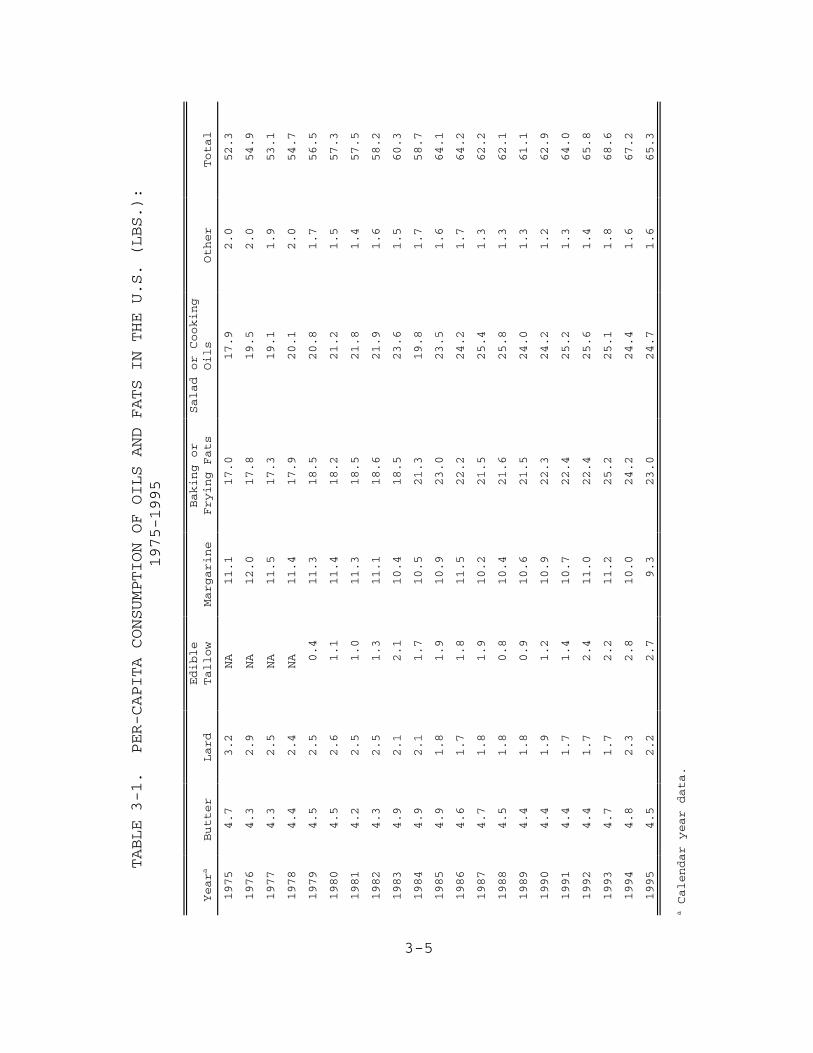
recommendations change. The following is a summary of current
beliefs about the health affects of various fats and oils and
how these beliefs affect consumption of vegetable oils.
Reduce Total Dietary Intake of All Fats and Oils.
Scientists agree on this point, but consumers do not appear to
be modifying their behavior significantly as a result.
Table 3-1 presents the per-capita consumption of fats and oils
in the United States from 1975 to 1995.73 Per-capita
3-5
TABLE 3-1. PER-CAPITA CONSUMPTION OF OILS AND FATS IN THE U.S. (LBS.):
1975-1995
Yeara
Butter
Lard
Edible
Tallow
Margarine
Baking or
Frying Fats
Salad or Cooking
Oils
Other
Total
1975
4.7
3.2
NA
11.1
17.0
17.9
2.0
52.3
1976
4.3
2.9
NA
12.0
17.8
19.5
2.0
54.9
1977
4.3
2.5
NA
11.5
17.3
19.1
1.9
53.1
1978
4.4
2.4
NA
11.4
17.9
20.1
2.0
54.7
1979
4.5
2.5
0.4
11.3
18.5
20.8
1.7
56.5
1980
4.5
2.6
1.1
11.4
18.2
21.2
1.5
57.3
1981
4.2
2.5
1.0
11.3
18.5
21.8
1.4
57.5
1982
4.3
2.5
1.3
11.1
18.6
21.9
1.6
58.2
1983
4.9
2.1
2.1
10.4
18.5
23.6
1.5
60.3
1984
4.9
2.1
1.7
10.5
21.3
19.8
1.7
58.7
1985
4.9
1.8
1.9
10.9
23.0
23.5
1.6
64.1
1986
4.6
1.7
1.8
11.5
22.2
24.2
1.7
64.2
1987
4.7
1.8
1.9
10.2
21.5
25.4
1.3
62.2
1988
4.5
1.8
0.8
10.4
21.6
25.8
1.3
62.1
1989
4.4
1.8
0.9
10.6
21.5
24.0
1.3
61.1
1990
4.4
1.9
1.2
10.9
22.3
24.2
1.2
62.9
1991
4.4
1.7
1.4
10.7
22.4
25.2
1.3
64.0
1992
4.4
1.7
2.4
11.0
22.4
25.6
1.4
65.8
1993
4.7
1.7
2.2
11.2
25.2
25.1
1.8
68.6
1994
4.8
2.3
2.8
10.0
24.2
24.4
1.6
67.2
1995
4.5
2.2
2.7
9.3
23.0
24.7
1.6
65.3
a Calendar year data.
3-6
consumption increased nearly 25 percent during that time, from
52.3 pounds to 65.3 pounds. The increase can be attributed
entirely to increased consumption of vegetable oils in the
form of baking or frying fats and salad or cooking oils.
However, Americans decreased their total consumption of fats
and oils slightly (about 5 percent) between 1993 and 1995.74
Reduce Consumption of Saturated Fats. Researchers
recommend that Americans should reduce the amount of saturated
fat consumed. Research has shown that saturated fat, not
dietary cholesterol, is the major contributor to elevated
blood cholesterol levels.75 Since domestically produced
vegetable oils contain relatively less saturated fat, this
information may explain why Americans have increased their
consumption of vegetable oils relative to animal fats.
Substitute Monounsaturated Fats for Saturated Fats.
While there is currently no consensus, many researchers
believe that substituting monounsaturated fats for saturated
fats is beneficial. Studies suggest that monounsaturated fats
can lower blood cholesterol, especially the harmful or LDL
type (low-density lipoproteins) while protecting the good or
HDL type (high-density lipoproteins).
The relative amounts of monounsaturated, polyunsaturated,
and saturated fats vary by the type of fat or oil. Coconut oil
has the highest percentage of saturated fat (92 percent),
followed by palm kernel oil (86 percent), and butter
(66 percent). Of the domestically produced vegetable oils,
3-7
cottonseed oil has the highest percentage of saturated fat
(26 percent), followed by peanut oil (18 percent), soybean oil
(15 percent), and corn oil (13 percent). Canola oil, at
6 percent, has the lowest percentage of saturated fat. Olive
oil has the highest percentage of monounsaturated fat
(77 percent), followed by canola (62 percent) and peanut oil
(49 percent).76,77 Consumers have responded to this information
with extremely strong demand for “healthy” oils. Consumption
of canola oil has been increasing steadily.78 Demand for olive
oil has remained strong in spite of very high prices, while
consumption of palm oil has declined.79
Avoid Trans Fatty Acids. Trans fatty acids are created
during the process of hydrogenation and are present in
hydrogenated vegetable oils. Scientists believe that they may
increase the risk of cardiovascular disease.80 When listed on
a food label, the term “hydrogenated” has a negative
connotation for many consumers.
3.2 USES AND CONSUMERS
Most vegetable oils are consumed in edible products,
including salad and cooking oil, baking and frying fats, and
margarine. Some vegetable oil is used in animal feed, and
small quantities are also used in the production of inedible
products such as inks, diesel fuel, organic chemicals, paints,
coatings and varnishes, plasticizers, lubricants, and soap.
The following section describes these products and presents
3-8
the percentages of soybean, corn, and cottonseed oils used in
each category.
3.2.1 Edible Uses of Vegetable Oils
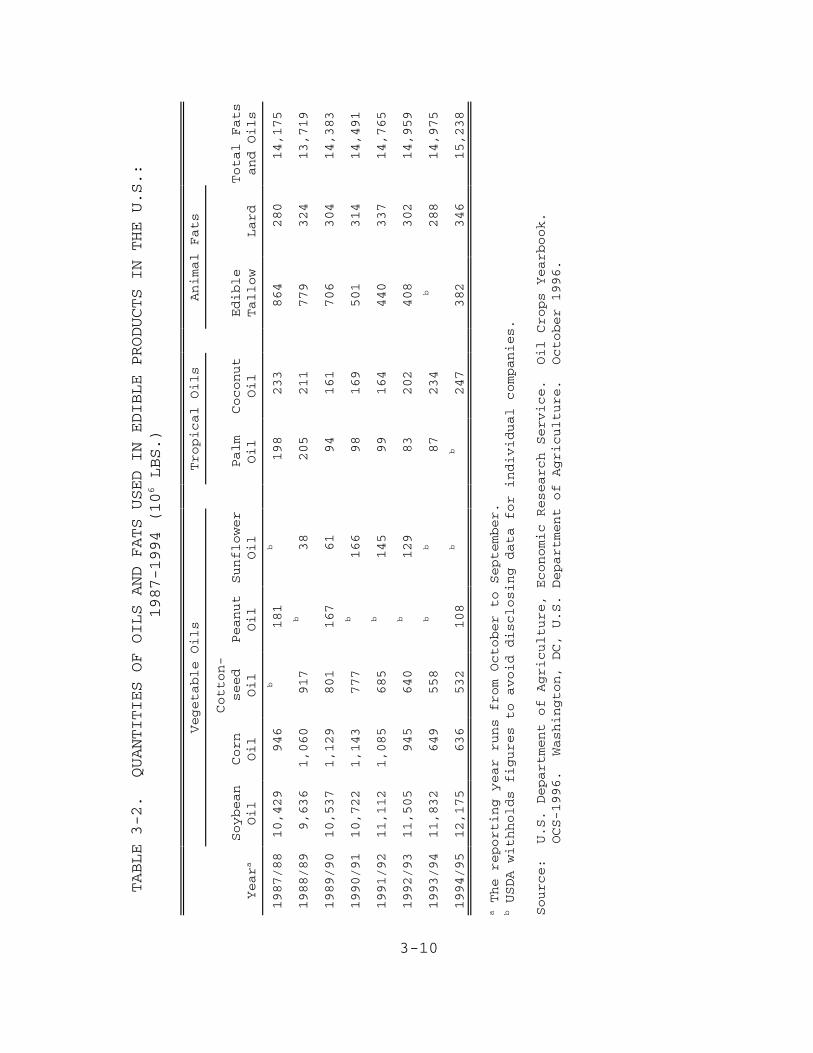
Table 3-2 contains data on the quantities of fats and
oils used in edible products in the United States from 1987
through 1994.81 Soybean oil comprises about three-quarters of
all fats and oils used in edible products.
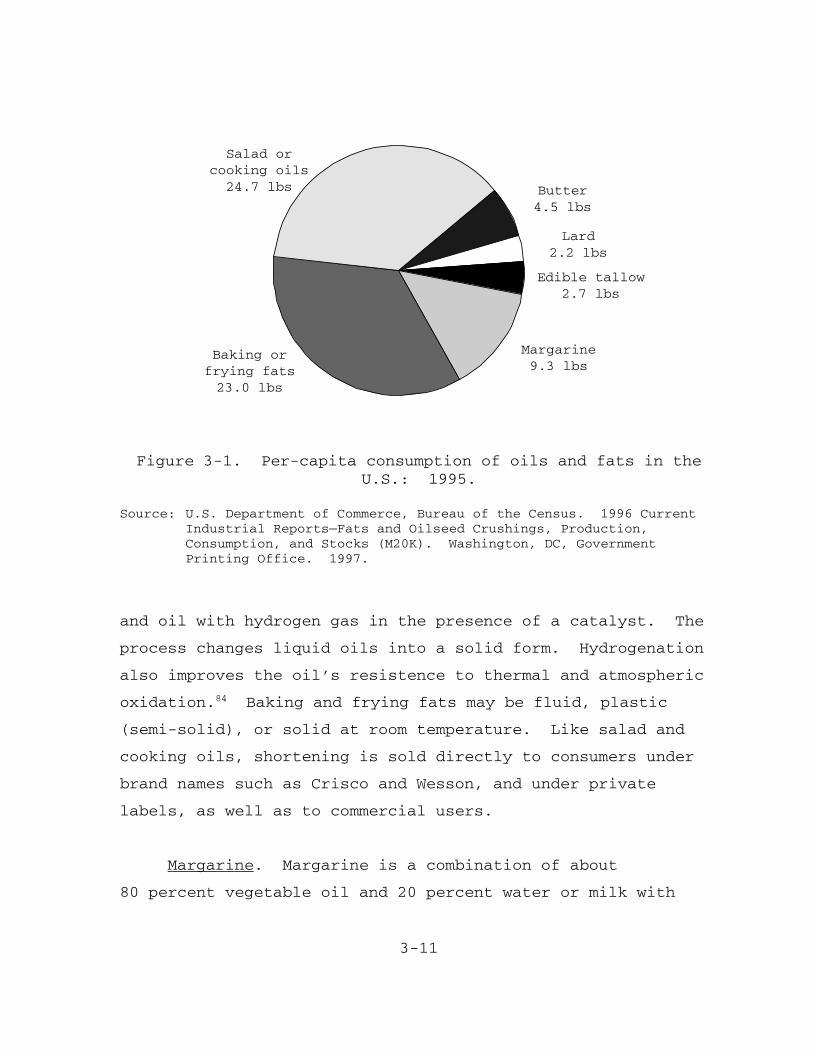
Figure 3-1 illustrates the total per capita consumption
of fats and oils in the United States in 1995.82 Vegetable
oils in the form of salad and cooking oils, baking or frying
fat, and margarine constituted more than 85 percent of the
total. This section describes these edible uses for vegetable
oils in more detail.
Salad or Cooking Oils. Salad or cooking oils are
vegetable oils that are completely liquid at room temperature.
They are alkali-refined, bleached, and deodorized. Salad or
cooking oils are sold directly to consumers under brand names
such as CPC International’s Mazola, Procter & Gamble’s Crisco
and Puritan, and ConAgra’s Wesson, as well as private label or
store brands.83 Soybean oil is sold in supermarkets with the
general label “vegetable oil,” while other vegetable oils such
as corn oil or canola oil are labeled specifically. Salad and
cooking oils are also used in the production of mayonnaise,
salad dressings, and other prepared foods.
3-9
Baking and Frying Fats. Baking and frying fats, also
called shortening, may be hydrogenated or partially
hydrogenated. Hydrogenation is the process of treating fats
3-10
TABLE 3-2. QUANTITIES OF OILS AND FATS USED IN EDIBLE PRODUCTS IN THE U.S.:
1987-1994 (106 LBS.)
Vegetable Oils
Tropical Oils
Animal Fats
Yeara
Soybean
Oil
Corn
Oil
Cotton-
seed
Oil
Peanut
Oil
Sunflower
Oil
Palm
Oil
Coconut
Oil
Edible
Tallow
Lard
Total Fats
and Oils
1987/88
10,429
946
b181
b198
233
864
280
14,175
1988/89
9,636
1,060
917
b38
205
211
779
324
13,719
1989/90
10,537
1,129
801
167
61
94
161
706
304
14,383
1990/91
10,722
1,143
777
b166
98
169
501
314
14,491
1991/92
11,112
1,085
685
b145
99
164
440
337
14,765
1992/93
11,505
945
640
b129
83
202
408
302
14,959
1993/94
11,832
649
558
bb
87
234
b288
14,975
1994/95
12,175
636
532
108
bb
247
382
346
15,238
a The reporting year runs from October to September.
b USDA withholds figures to avoid disclosing data for individual companies.
Source:
U.S. Department of Agriculture, Economic Research Service. Oil Crops Yearbook.
OCS-1996. Washington, DC, U.S. Department of Agriculture. October 1996.
3-11
Edible tallow2.7 lbs
Salad orcooking oils
24.7 lbs
Lard2.2 lbs
Butter4.5 lbs
Margarine9.3 lbs
Baking orfrying fats23.0 lbs
Figure 3-1. Per-capita consumption of oils and fats in theU.S.: 1995.
Source: U.S. Department of Commerce, Bureau of the Census. 1996 CurrentIndustrial Reports—Fats and Oilseed Crushings, Production,Consumption, and Stocks (M20K). Washington, DC, GovernmentPrinting Office. 1997.
and oil with hydrogen gas in the presence of a catalyst. The
process changes liquid oils into a solid form. Hydrogenation
also improves the oil’s resistence to thermal and atmospheric
oxidation.84 Baking and frying fats may be fluid, plastic
(semi-solid), or solid at room temperature. Like salad and
cooking oils, shortening is sold directly to consumers under
brand names such as Crisco and Wesson, and under private
labels, as well as to commercial users.
Margarine. Margarine is a combination of about
80 percent vegetable oil and 20 percent water or milk with
3-12
other ingredients such as emulsifiers, vitamins, milk solids,
and flavors.85 Lower-fat margarine spreads contain less oil
and more water. Margarine is also sold to food processors and
directly to consumers under brand names such as Land O Lakes,
Fleishman’s, Mazola, and Promise as well as private labels.
3.2.2 Inedible Uses of Vegetable Oils
Ink. Soybean oil-based ink has gained popularity because
of its ecological advantages and superior printing quality.
Soy ink biodegrades more quickly, is easier to remove from
paper for recycling, and has a lower VOC content than
petroleum-based inks. Because soy oil is clear, it produces
brighter colored inks. It costs about 50 percent more than
petroleum-based ink, however. Other types of vegetable oils
can be used in inks as well, but soybean producers have
aggressively marketed soybean oil to the ink industry.86 In
1992 the ink industry consumed 27.5 million pounds of soybean
oil. This amount was projected to increase to 89 million
pounds by 1997.87
Although scientists have developed inks that are totally
derived from vegetable oils, most of the soy ink currently
used is actually a soybean oil-petroleum hybrid. The American
Soybean Association licenses printers to use their soy ink
logo, which indicates at least a 30 percent soybean oil
content for colored ink and a 40 percent soybean oil content
for black news ink.
3-13
Because of its high quality, soy ink has captured
70 percent of the color newsprint ink market. Because of its
high cost, however, it only makes up about 2 percent of the
black newsprint ink market. The major scientific and
technical obstacles to using vegetable oils in inks have been
overcome. Future environmental regulation related to printing
may help the marketing of vegetable oil-based inks.88
Diesel Fuel. Diesel fuel, or “Biodiesel,” can be made
from vegetable oils. It can be used in pure form or more
typically is mixed with petroleum diesel. Pure biodiesel is
biodegradable, nontoxic, and essentially free of sulfur and
aromatics. It is a renewable resource and is produced
domestically. Biodiesel requires no engine modifications or
changes to fuel handling and delivery systems. It delivers
similar power and miles per gallon.
Although it is not feasible to replace all diesel fuel
with biodiesel (the entire domestic supply of vegetable oil
could replace no more than 10 percent of the domestic market
for diesel fuel), biodiesel would be useful in specific
markets. Biodiesel could be used to replace diesel fuel for
mass transit in cities that must reduce pollution to meet
federal clean air standards. The marine market is also
promising for biodiesel. Because it is biodegradable and
nontoxic, it is well suited for use in environmentally
sensitive areas such as coasts and wetlands. It is currently
being tested for these applications.89
3-14
Organic Chemicals. Vegetable oils can be converted into
many different organic chemicals, including glycerol and fatty
acids. These are used in the production of adhesive tape,
shaving cream, textile water repellents, candles, crayons,
cosmetics, polishes, and mold lubricants. Purified fatty
acids and fractions thereof are used to make many chemicals
such as dimer and trimer acids, alcohols, amines and amides,
and esters.90
Paints, Coatings, and Varnishes. In 1940, over 80
percent of paints, coatings, and varnishes were composed of
vegetable oils. The use of vegetable oils in these products
peaked around 1950. Petroleum-based products began to replace
those made from vegetable oil, and by 1987 the market share
had dropped to about 30 percent. In the future, vegetable
oils may recapture some of this market. Currently, concern
about volatile organic compounds is increasing demand for
water-based paints, varnishes, and coatings. Vegetable oil is
used in the production of alkyd resins, a component of water-
based latex paint. Also, soybean breeders are studying ways
to create soybeans that produce more useful oils for the
production of paints, varnishes, and coatings.91
Plasticizers. Plasticizers are incorporated into
plastics, rubber, and rubberlike materials to increase
flexibility and toughness. About 2 billion pounds of
plasticizers are used annually, and 10 to 15 percent of this
amount is derived from vegetable oils. Soybean oil products
are used extensively to plasticize polyvinyl chloride resins.92
3-15
Lubricants. In the past, vegetable oils were widely used
as industrial lubricants. Petroleum-based mineral oils have
largely replaced vegetable oils, however. Vegetable oils are
still used in some minor applications, such as the lubrication
of irrigation well equipment, where the lubricant may be
discharged into an aquifer. Soybean oil is sometimes used to
spray truck beds before carrying asphalt or to coat forms used
to mold concrete structures. It prevents sticking and makes
handling easier.93
Soap. Bar soaps are made primarily from inedible tallow
and coconut oil. Small quantities of vegetable oils are used
in the production of liquid soaps.94
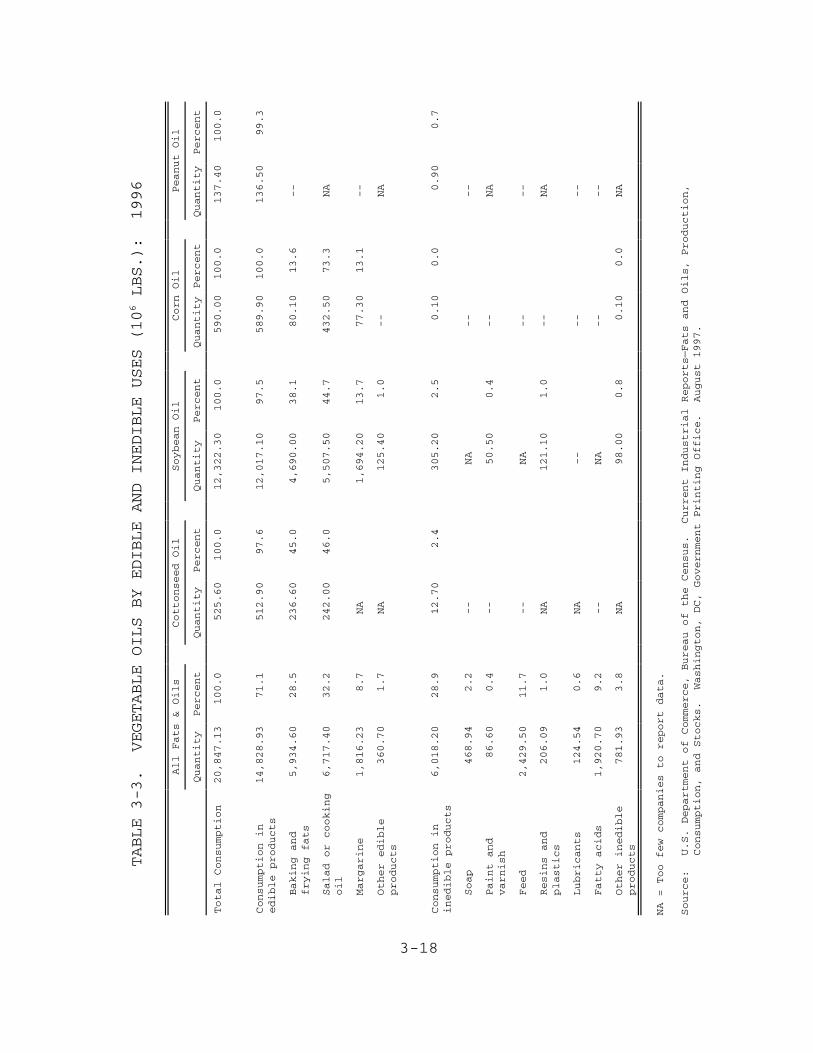
3.2.3 Percentages of Vegetable Oils Used in Various Products
Figure 3-2 illustrates the percentages of soybean, corn,
and cottonseed oils used in various products in the United
States in 1996.95 Quantities and percentages of all fats and
oils are broken out by major edible and inedible uses in
Table 3-3.96 In addition, quantities and percentages are
provided for cottonseed, soybean, corn, and peanut oil where
available. These data are described in more detail below.
� Uses of cottonseed oil: About half of all cottonseedoil was used for baking and frying, and the other halffor salad and cooking oil, with a small portion(2.4 percent) being used in inedible products. Cottonseed oil was not used in margarine production.
� Uses of soybean oil: In 1996, 44.7 percent of allsoybean oil was consumed as salad and cooking oil,

3-16
38.1 percent as baking and frying fat, and 13.7 percentas margarine. The remaining 1 percent of edible useswent into other edible products, and a total of2.5 percent was used in inedible products.
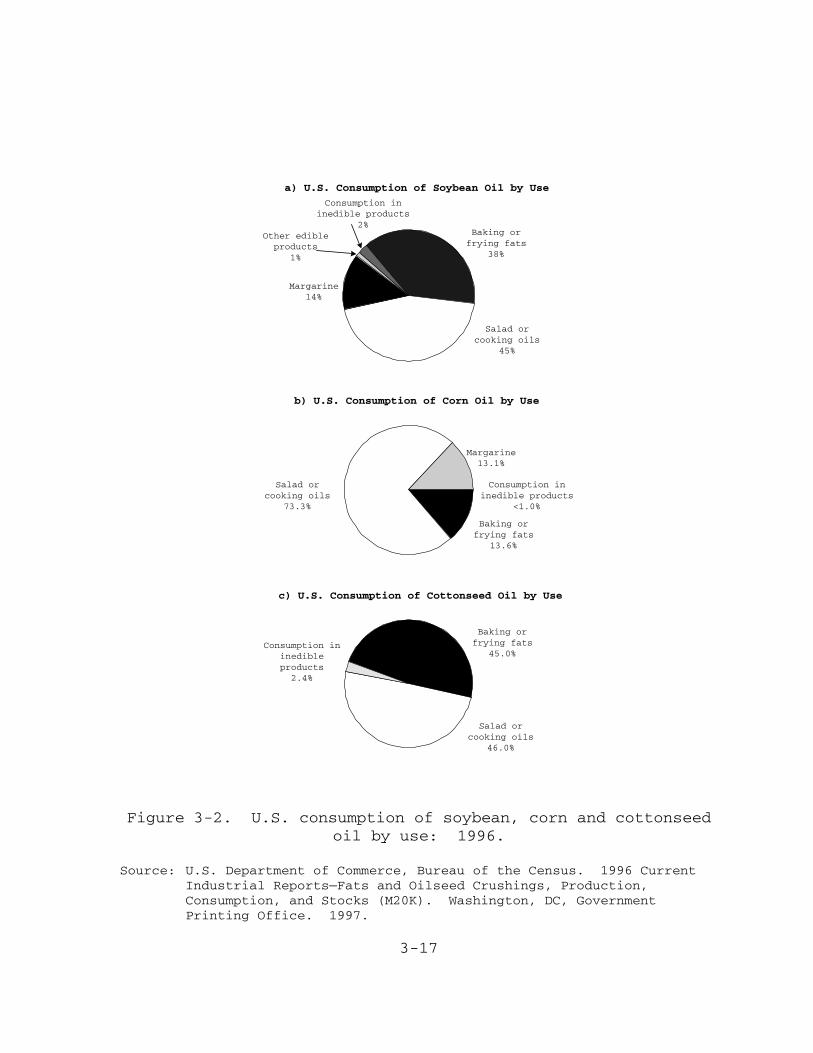
3-17
Salad orcooking oils
73.3%
Margarine13.1%
Consumption ininedible products
<1.0%
Baking orfrying fats
13.6%
Baking orfrying fats
45.0%
Salad orcooking oils
46.0%
Consumption ininedibleproducts
2.4%
Baking orfrying fats
38%
Salad orcooking oils
45%
Margarine14%
Other edibleproducts
1%
Consumption ininedible products
2%
b) U.S. Consumption of Corn Oil by Use
c) U.S. Consumption of Cottonseed Oil by Use
a) U.S. Consumption of Soybean Oil by Use
Figure 3-2. U.S. consumption of soybean, corn and cottonseedoil by use: 1996.
Source: U.S. Department of Commerce, Bureau of the Census. 1996 CurrentIndustrial Reports—Fats and Oilseed Crushings, Production,Consumption, and Stocks (M20K). Washington, DC, GovernmentPrinting Office. 1997.
3-18
TABLE 3-3. VEGETABLE OILS BY EDIBLE AND INEDIBLE USES (106 LBS.): 1996
All Fats & Oils
Cottonseed Oil
Soybean Oil
Corn Oil
Peanut Oil
Quantity
Percent
Quantity
Percent
Quantity
Percent
Quantity
Percent
Quantity
Percent
Total Consumption
20,847.13
100.0
525.60
100.0
12,322.30
100.0
590.00
100.0
137.40
100.0
Consumption in
edible products
14,828.93
71.1
512.90
97.6
12,017.10
97.5
589.90
100.0
136.50
99.3
Baking and
frying fats
5,934.60
28.5
236.60
45.0
4,690.00
38.1
80.10
13.6
--
Salad or cooking
oil
6,717.40
32.2
242.00
46.0
5,507.50
44.7
432.50
73.3
NA
Margarine
1,816.23
8.7
NA
1,694.20
13.7
77.30
13.1
--
Other edible
products
360.70
1.7
NA
125.40
1.0
--
NA
Consumption in
inedible products
6,018.20
28.9
12.70
2.4
305.20
2.5
0.10
0.0
0.90
0.7
Soap
468.94
2.2
--
NA
--
--
Paint and
varnish
86.60
0.4
--
50.50
0.4
--
NA
Feed
2,429.50
11.7
--
NA
--
--
Resins and
plastics
206.09
1.0
NA
121.10
1.0
--
NA
Lubricants
124.54
0.6
NA
--
--
--
Fatty acids
1,920.70
9.2
--
NA
--
--
Other inedible
products
781.93
3.8
NA
98.00
0.8
0.10
0.0
NA
NA = Too few companies to report data.
Source:
U.S. Department of Commerce, Bureau of the Census. Current Industrial Reports—Fats and Oils, Production,
Consumption, and Stocks. Washington, DC, Government Printing Office. August 1997.
3-19
� Uses of corn oil: Almost three-quarters of all cornoil was consumed as salad and cooking oil; the balancewas divided about equally between baking and frying fatand margarine. Less than 1 percent of corn oil wasused for inedible products.
� Uses of peanut oil: Nearly all peanut oil (99.3percent) was used for edible purposes with only 0.7percent used for inedible purposes.
3.2.4 Elasticity of Demand
Table 3-4 shows the own-price elasticities for various
fats and oils that were estimated by Chern et al.97 All of
these elasticities are less than -1.0, which means their
demand is inelastic. (Inelastic demand means that a 1 percent
increase in the price of the good causes less than a 1 percent
decrease in the quantity of the good demanded.) Butter was the
most price elastic at -0.816, and cottonseed oil followed at
-0.646. Corn oil, lard, peanut oil, and soybean oil all had
similar elasticities, ranging from -0.234 to -0.292. In other
words, consumers alter their purchasing behavior in reaction
to price changes more for butter and cottonseed oil than for
corn, peanut, and soybean oils.
3.3 SUBSTITUTION POSSIBILITIES IN CONSUMPTION
Substitutes for domestically produced vegetable oils are
imported tropical oils (coconut and palm oils), animal fats
(butter, edible tallow, and lard) and imported olive oil. This
section discusses each of these groups, plus the synthetic fat
substitute “Olestra.”
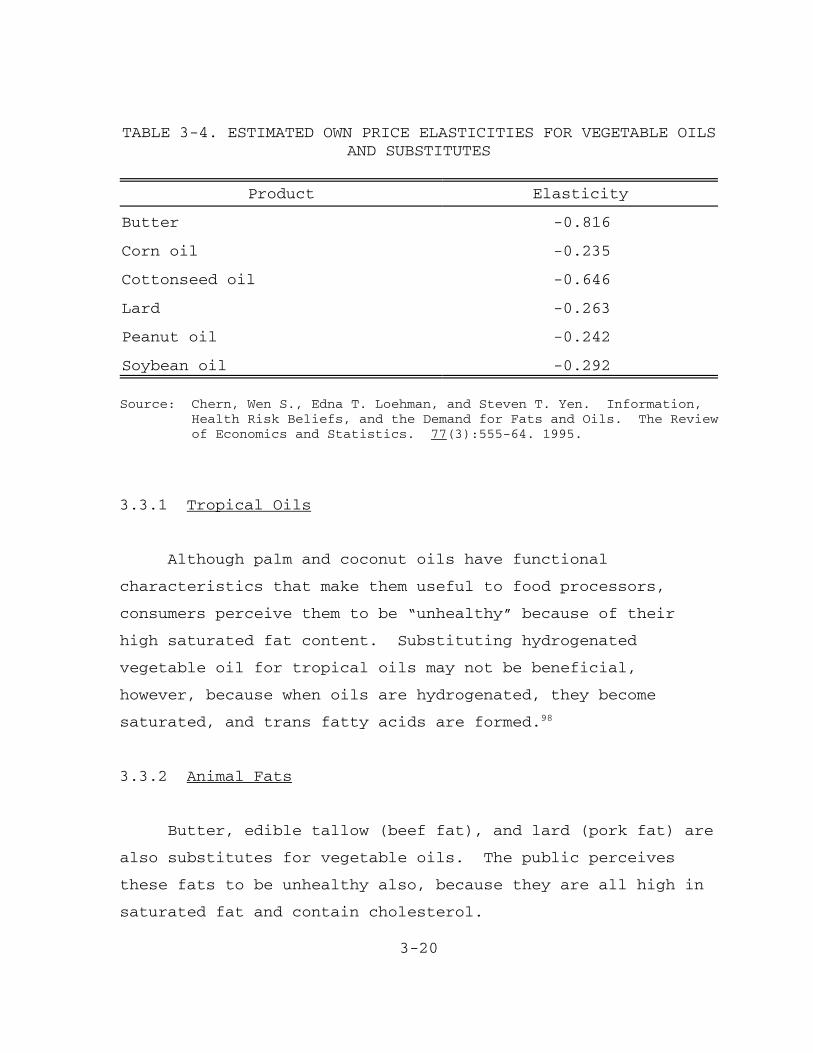
3-20
TABLE 3-4. ESTIMATED OWN PRICE ELASTICITIES FOR VEGETABLE OILSAND SUBSTITUTES
Product Elasticity
Butter -0.816
Corn oil -0.235
Cottonseed oil -0.646
Lard -0.263
Peanut oil -0.242
Soybean oil -0.292
Source: Chern, Wen S., Edna T. Loehman, and Steven T. Yen. Information,Health Risk Beliefs, and the Demand for Fats and Oils. The Reviewof Economics and Statistics. 77(3):555-64. 1995.
3.3.1 Tropical Oils
Although palm and coconut oils have functional
characteristics that make them useful to food processors,
consumers perceive them to be “unhealthy” because of their
high saturated fat content. Substituting hydrogenated
vegetable oil for tropical oils may not be beneficial,
however, because when oils are hydrogenated, they become
saturated, and trans fatty acids are formed.98
3.3.2 Animal Fats
Butter, edible tallow (beef fat), and lard (pork fat) are
also substitutes for vegetable oils. The public perceives
these fats to be unhealthy also, because they are all high in
saturated fat and contain cholesterol.
3-21
Margarine was invented in France 1869 as a substitute for
butter. Until the 1940s, consumption of margarine was limited
in the United States because of legislative restrictions put
in place to protect the dairy industry. After these
restrictions were removed, consumption greatly increased. By
1956, the per-capita consumption of margarine exceeded
butter’s and has remained higher.99
Margarine is cheaper than butter, and consumers generally
believe it is “healthier.” Provisions of the 1996 Farm Bill
may cause the price of butter to fall in the future.100 Lower
butter prices and an increased understanding that consuming
hydrogenated vegetable oils instead of animal fats may offer
no health advantages might lead to increased consumption of
butter relative to margarine.
3.3.3 Olive Oil
Olive oil, which is not produced domestically, is
considered to be a “healthy” oil because of its high level of
monounsaturated fats. The demand for olive oil has increased
dramatically in recent years. Imports of olive oil increased
from 48 million pounds in 1975 to 251 million pounds in
1995.101
3.3.4 Olestra
The Food and Drug Administration approved the use of
3-22
Olestra, a fat substitute, in January 1996. When Proctor &
Gamble began to test market the product, they found that it
caused severe digestive disturbances in many individuals. If
Olestra had proved to be an acceptable fat substitute, it
would have increased demand for vegetable oils, since
vegetable oils are a major ingredient used in its
manufacture.102
4-1
SECTION 4
INDUSTRY ORGANIZATION
This section describes the structure of the markets for
vegetable oils, the characteristics of the facilities that
manufacture vegetable oils, and the characteristics of the
firms that own these manufacturing plants.
4.1 MARKET STRUCTURE
Market structure is of interest because it determines the
behavior of producers and consumers in the industry. If an
industry is perfectly competitive, then individual producers
are not able to influence the price of the output they sell or
the inputs they purchase. This condition is most likely to
hold if the industry has a large number of firms, the products
sold and the inputs purchased are undifferentiated, and entry
and exit of firms is unrestricted. Product differentiation
can occur both from differences in product attributes and
quality and from brand name recognition of products. Entry
and exit of firms are unrestricted for most industries except,
for example, in cases where government regulates who is able
to produce, where one firm holds a patent on a product, where
one firm owns the entire stock of a critical input, or where a
single firm is able to supply the entire market.
*More detail on the number of firms and facilities is provided inSections 4.2 and 4.3.
4-2
For a particular industry, we can evaluate each of the
factors listed above to determine the potential for
imperfectly competitive behavior. In the vegetable oil
market, a fairly large number of firms produce each type of
vegetable oil.* Crude vegetable oil products are
undifferentiated and sold at an unbranded market level. In
addition, entry of firms into the industry is unrestricted.
Thus, all of the factors suggest that the vegetable oil
industry is perfectly competitive. Indeed the National
Oilseed Processors Association maintains that the industry is
highly competitive.103 However, due to large scale economies
of size and scope, firms in the industry have an incentive to
grow large. As they grow larger, market shares increase and
the potential for imperfect competition increases.
In addition to evaluating the factors that affect
competition in an industry, economists also evaluate four-firm
concentration ratios (CR4s), eight-firm concentration ratios
(CR8s), and Herfindahl-Hirschman indexes (HHIs). These values
are reported at the 4-digit SIC level for 1992, the most
recent year available, in Table 4-1.104,105,106 The CR4, which
measures the percentage of sales of the top 4 companies in the
industry, range from 62 percent for cottonseed oil mills
(SIC 2074) to 89 percent for all other vegetable oil mills
(SIC 2076). Note that although mechanical extraction plants
are included in these SICs, they are unlikely to be among the
larger firms in the industry. The CR8, which measures the
4-3
percentage of sales of the top 8 companies in the industry, is
82 percent for cottonseed oil mills (SIC 2074) and above
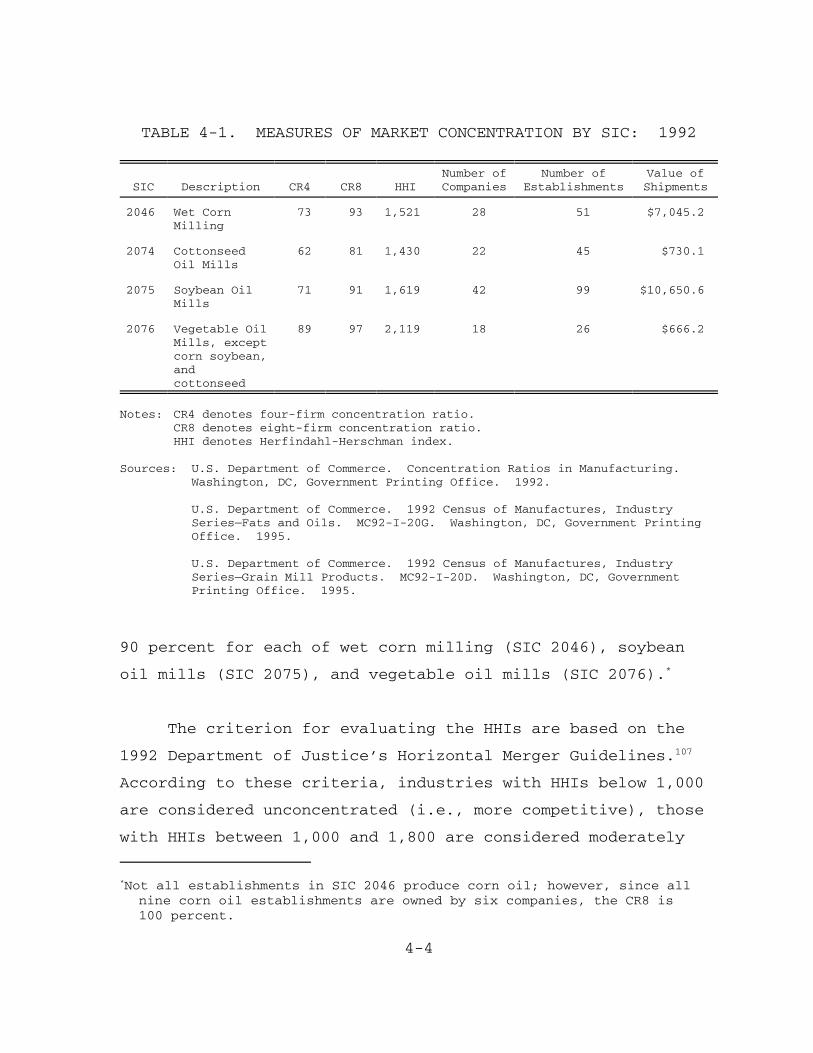
*Not all establishments in SIC 2046 produce corn oil; however, since allnine corn oil establishments are owned by six companies, the CR8 is100 percent.
4-4
TABLE 4-1. MEASURES OF MARKET CONCENTRATION BY SIC: 1992
SIC Description CR4 CR8 HHINumber ofCompanies
Number ofEstablishments
Value ofShipments
2046 Wet CornMilling
73 93 1,521 28 51 $7,045.2
2074 CottonseedOil Mills
62 81 1,430 22 45 $730.1
2075 Soybean OilMills
71 91 1,619 42 99 $10,650.6
2076 Vegetable OilMills, exceptcorn soybean,and cottonseed
89 97 2,119 18 26 $666.2
Notes: CR4 denotes four-firm concentration ratio.CR8 denotes eight-firm concentration ratio.HHI denotes Herfindahl-Herschman index.
Sources: U.S. Department of Commerce. Concentration Ratios in Manufacturing. Washington, DC, Government Printing Office. 1992.
U.S. Department of Commerce. 1992 Census of Manufactures, IndustrySeries—Fats and Oils. MC92-I-20G. Washington, DC, Government PrintingOffice. 1995.
U.S. Department of Commerce. 1992 Census of Manufactures, IndustrySeries—Grain Mill Products. MC92-I-20D. Washington, DC, GovernmentPrinting Office. 1995.
90 percent for each of wet corn milling (SIC 2046), soybean
oil mills (SIC 2075), and vegetable oil mills (SIC 2076).*
The criterion for evaluating the HHIs are based on the
1992 Department of Justice’s Horizontal Merger Guidelines.107
According to these criteria, industries with HHIs below 1,000
are considered unconcentrated (i.e., more competitive), those
with HHIs between 1,000 and 1,800 are considered moderately
4-5
concentrated (i.e., moderately competitive), and those with
HHIs above 1,800 are considered highly concentrated (i.e.,
less competitive). In general, firms in less-concentrated
industries are more likely to be price takers, while firms in
more-concentrated industries are more likely to be able to
influence market prices. Based on these criteria, wet corn
milling (SIC 2046), cottonseed oil mills (SIC 2074), and
soybean oil mills (SIC 2075) are moderately concentrated and
vegetable oil mills (SIC 2076) are highly concentrated.
While the CR4s, CR8s, and HHIs are suggestive of
imperfect competition, they tell us nothing about the
interactions of firms in the industry. Because of the
homogeneity of the products produced, and because economies of
size and scope provide firms with an incentive to grow large
(resulting in high measures of concentration) the assumption
of perfect competition is justifiable.
In addition to the measures of concentration, the numbers
of companies and facilities as well as value of shipments are
provided in Table 4-1. Because these values include
mechanical extraction plants and are reported for 1992, they
are larger than those reported in the following sections on
solvent extraction plants.
4.2 FACILITY CHARACTERISTICS
Facilities comprise a site of land with a plant and
equipment that combine inputs (raw materials, fuel, energy,
*According to the Census of Manufactures, the total number of vegetable oilproduction facilities is much greater than 109. However, it groups bothmechanical and solvent extraction plants. The data reported here applyonly to solvent extraction plants.
4-6
and labor) to produce outputs (vegetable oils). The terms
facility, establishment, and plant are synonymous in this
report and refer to the physical location where products are
manufactured. As of 1997, there were 109 operating vegetable
oil production facilities that rely on hexane solvents to
extract vegetable oil.*,108 In addition, three facilities are
planned for construction. Sales and employment estimates for
these facilities were obtained from American Business
Information Corporation.109 Table 4-2 presents facility-level
sales and employment data organized by the following Standard
Industrial Classification (SIC) codes:110,111
� SIC 2046 Wet Corn Milling,
� SIC 2074 Cottonseed Oil Mills,
� SIC 2075 Soybean Oil Mills, and
� SIC 2076 Vegetable Oil Mills, except corn, cottonseed,and soybean.
Table 4-3 lists the distribution of these facilities by
state.112,113 As shown, Illinois (14 facilities), Iowa
(13 facilities), Texas (9 facilities), and Arkansas
(8 facilities) contain the highest number of vegetable oil
production facilities using the solvent extraction method.

4-7
Data on manufacturing plants for each SIC code is
described in more detail below followed by a discussion of
current trends in manufacturing plants.
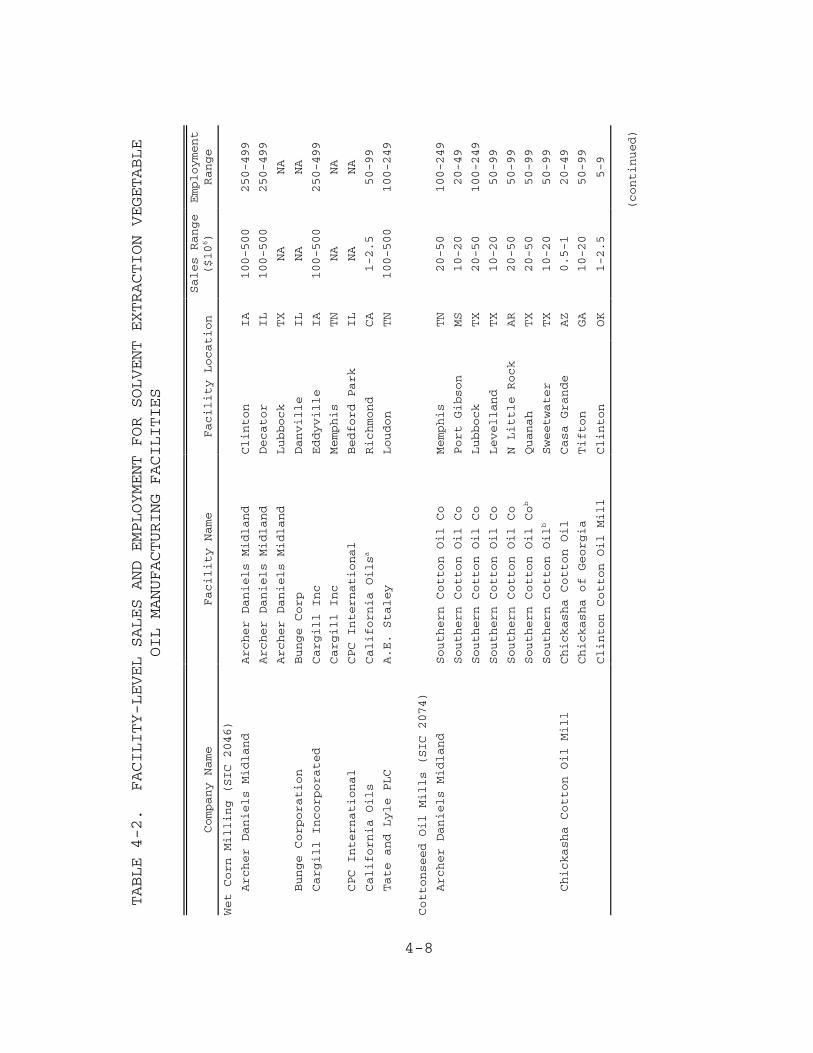
4-8
TABLE 4-2. FACILITY-LEVEL SALES AND EMPLOYMENT FOR SOLVENT EXTRACTION VEGETABLE
OIL MANUFACTURING FACILITIES
Company Name
Facility Name
Facility Location
Sales Range
($106)
Employment
Range
Wet Corn Milling (SIC 2046)
Archer Daniels Midland
Archer Daniels Midland
Clinton
IA
100-500
250-499
Archer Daniels Midland
Decator
IL
100-500
250-499
Archer Daniels Midland
Lubbock
TX
NA
NA
Bunge Corporation
Bunge Corp
Danville
IL
NA
NA
Cargill Incorporated
Cargill Inc
Eddyville
IA
100-500
250-499
Cargill Inc
Memphis
TN
NA
NA
CPC International
CPC International
Bedford Park
IL
NA
NA
California Oils
California Oilsa
Richmond
CA
1-2.5
50-99
Tate and Lyle PLC
A.E. Staley
Loudon
TN
100-500
100-249
Cottonseed Oil Mills (SIC 2074)
Archer Daniels Midland
Southern Cotton Oil Co
Memphis
TN
20-50
100-249
Southern Cotton Oil Co
Port Gibson
MS
10-20
20-49
Southern Cotton Oil Co
Lubbock
TX
20-50
100-249
Southern Cotton Oil Co
Levelland
TX
10-20
50-99
Southern Cotton Oil Co
N Little Rock
AR
20-50
50-99
Southern Cotton Oil Cob
Quanah
TX
20-50
50-99
Southern Cotton Oilb
Sweetwater
TX
10-20
50-99
Chickasha Cotton Oil Mill
Chickasha Cotton Oil
Casa Grande
AZ
0.5-1
20-49
Chickasha of Georgia
Tifton
GA
10-20
50-99
Clinton Cotton Oil Mill
Clinton
OK
1-2.5
5-9
(continued)
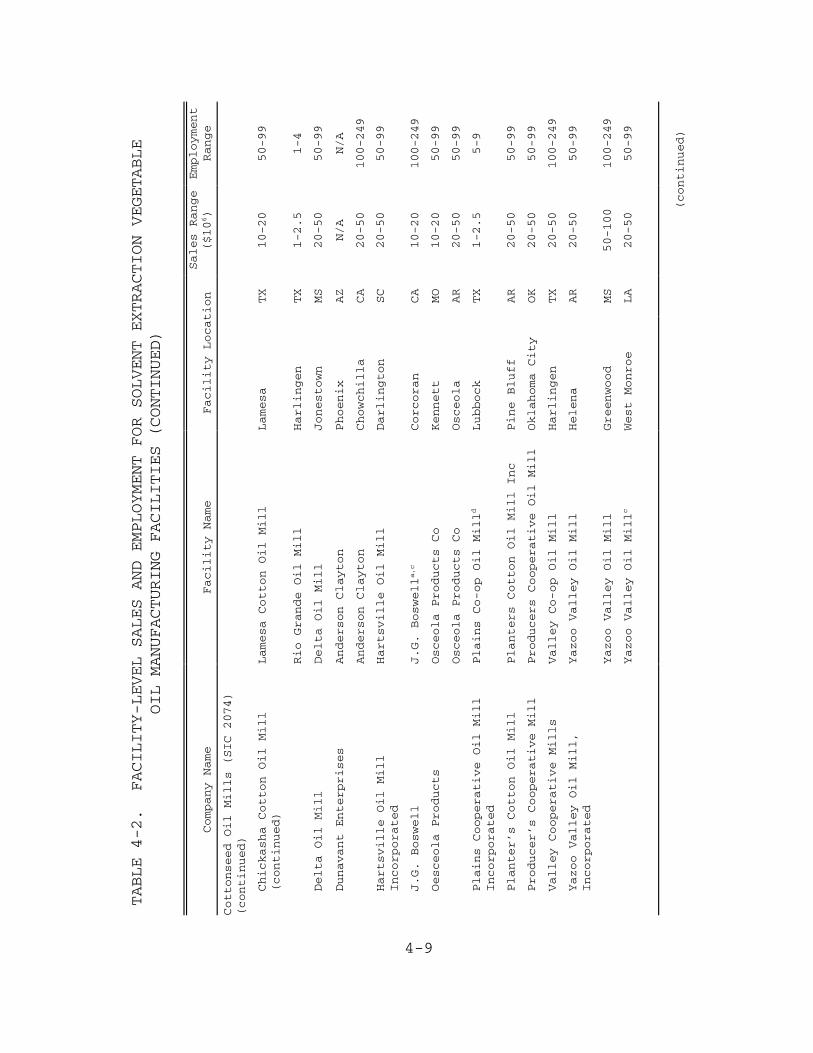
4-9
TABLE 4-2. FACILITY-LEVEL SALES AND EMPLOYMENT FOR SOLVENT EXTRACTION VEGETABLE
OIL MANUFACTURING FACILITIES (CONTINUED)
Company Name
Facility Name
Facility Location
Sales Range
($106)
Employment
Range
Cottonseed Oil Mills (SIC 2074)
(continued)
Chickasha Cotton Oil Mill
(continued)
Lamesa Cotton Oil Mill
Lamesa
TX
10-20
50-99
Rio Grande Oil Mill
Harlingen
TX
1-2.5
1-4
Delta Oil Mill
Delta Oil Mill
Jonestown
MS
20-50
50-99
Dunavant Enterprises
Anderson Clayton
Phoenix
AZ
N/A
N/A
Anderson Clayton
Chowchilla
CA
20-50
100-249
Hartsville Oil Mill
Incorporated
Hartsville Oil Mill
Darlington
SC
20-50
50-99
J.G. Boswell
J.G. Boswella,c
Corcoran
CA
10-20
100-249
Oesceola Products
Osceola Products Co
Kennett
MO
10-20
50-99
Osceola Products Co
Osceola
AR
20-50
50-99
Plains Cooperative Oil Mill
Incorporated
Plains Co-op Oil Milld
Lubbock
TX
1-2.5
5-9
Planter’s Cotton Oil Mill
Planters Cotton Oil Mill Inc
Pine Bluff
AR
20-50
50-99
Producer’s Cooperative Mill
Producers Cooperative Oil Mill
Oklahoma City
OK
20-50
50-99
Valley Cooperative Mills
Valley Co-op Oil Mill
Harlingen
TX
20-50
100-249
Yazoo Valley Oil Mill,
Incorporated
Yazoo Valley Oil Mill
Helena
AR
20-50
50-99
Yazoo Valley Oil Mill
Greenwood
MS
50-100
100-249
Yazoo Valley Oil Millc
West Monroe
LA
20-50
50-99
(continued)
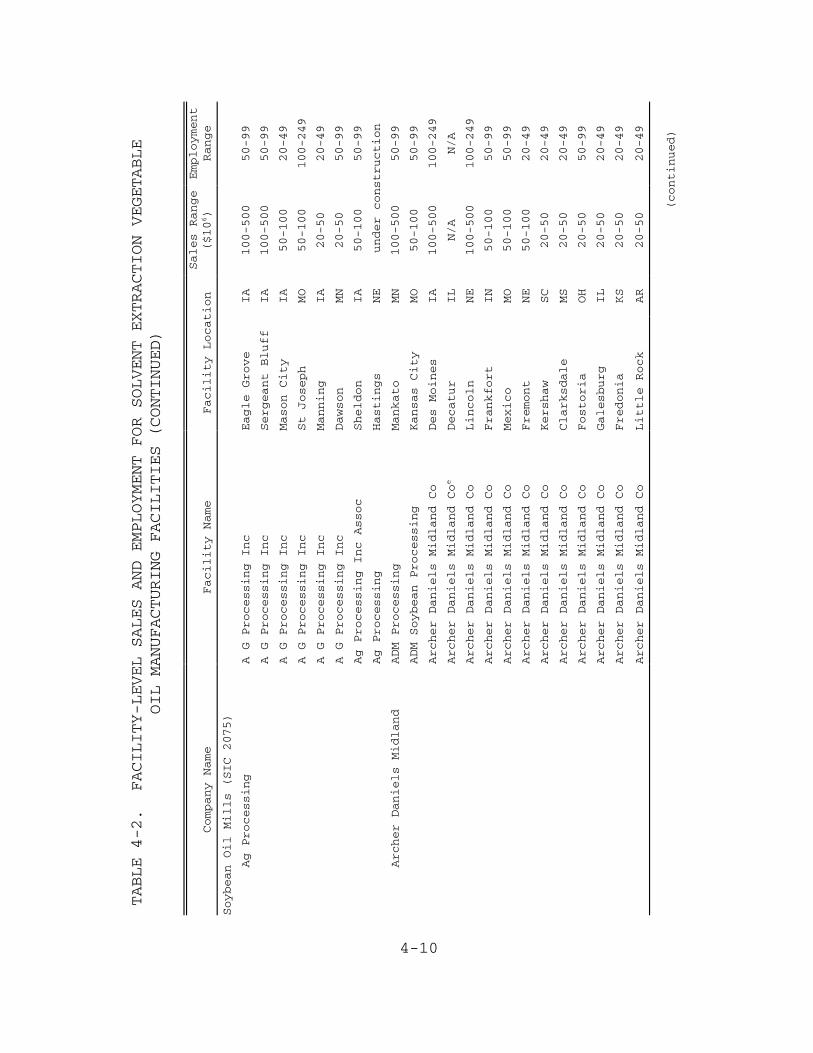
4-10
TABLE 4-2. FACILITY-LEVEL SALES AND EMPLOYMENT FOR SOLVENT EXTRACTION VEGETABLE
OIL MANUFACTURING FACILITIES (CONTINUED)
Company Name
Facility Name
Facility Location
Sales Range
($106)
Employment
Range
Soybean Oil Mills (SIC 2075)
Ag Processing
A G Processing Inc
Eagle Grove
IA
100-500
50-99
A G Processing Inc
Sergeant Bluff
IA
100-500
50-99
A G Processing Inc
Mason City
IA
50-100
20-49
A G Processing Inc
St Joseph
MO
50-100
100-249
A G Processing Inc
Manning
IA
20-50
20-49
A G Processing Inc
Dawson
MN
20-50
50-99
Ag Processing Inc Assoc
Sheldon
IA
50-100
50-99
Ag Processing
Hastings
NE
under construction
Archer Daniels Midland
ADM Processing
Mankato
MN
100-500
50-99
ADM Soybean Processing
Kansas City
MO
50-100
50-99
Archer Daniels Midland Co
Des Moines
IA
100-500
100-249
Archer Daniels Midland Coe
Decatur
IL
N/A
N/A
Archer Daniels Midland Co
Lincoln
NE
100-500
100-249
Archer Daniels Midland Co
Frankfort
IN
50-100
50-99
Archer Daniels Midland Co
Mexico
MO
50-100
50-99
Archer Daniels Midland Co
Fremont
NE
50-100
20-49
Archer Daniels Midland Co
Kershaw
SC
20-50
20-49
Archer Daniels Midland Co
Clarksdale
MS
20-50
20-49
Archer Daniels Midland Co
Fostoria
OH
20-50
50-99
Archer Daniels Midland Co
Galesburg
IL
20-50
20-49
Archer Daniels Midland Co
Fredonia
KS
20-50
20-49
Archer Daniels Midland Co
Little Rock
AR
20-50
20-49
(continued)
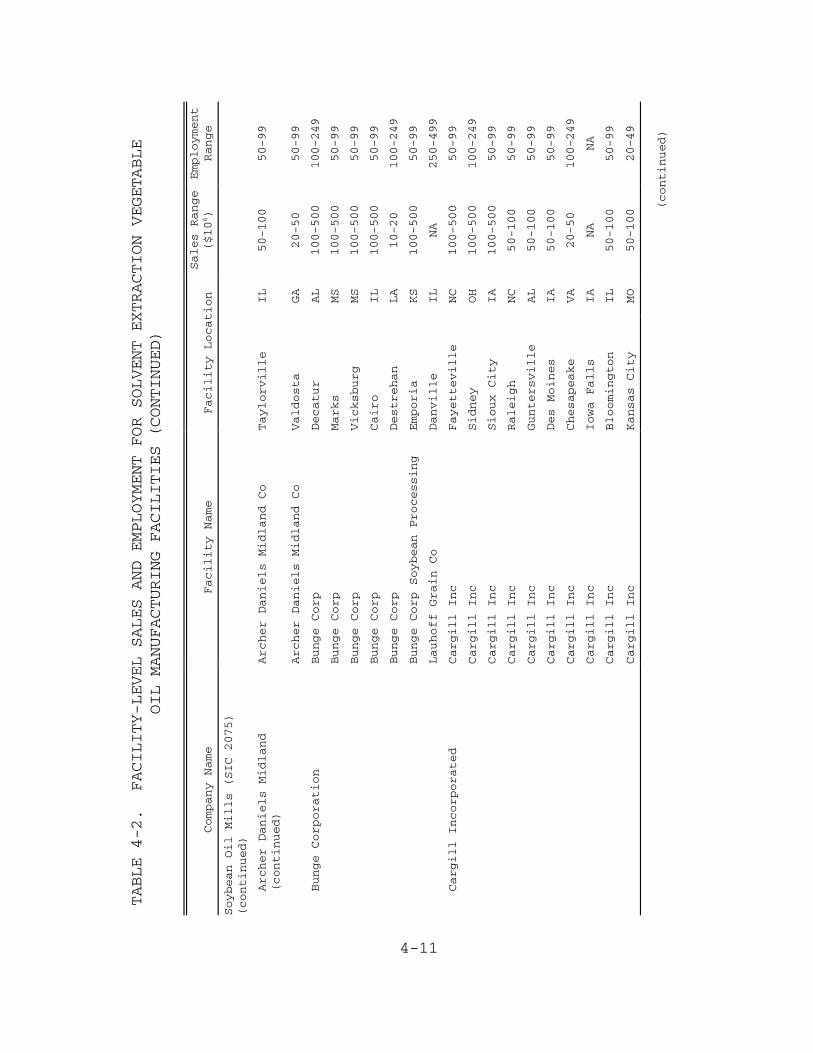
4-11
TABLE 4-2. FACILITY-LEVEL SALES AND EMPLOYMENT FOR SOLVENT EXTRACTION VEGETABLE
OIL MANUFACTURING FACILITIES (CONTINUED)
Company Name
Facility Name
Facility Location
Sales Range
($106)
Employment
Range
Soybean Oil Mills (SIC 2075)
(continued)
Archer Daniels Midland
(continued)
Archer Daniels Midland Co
Taylorville
IL
50-100
50-99
Archer Daniels Midland Co
Valdosta
GA
20-50
50-99
Bunge Corporation
Bunge Corp
Decatur
AL
100-500
100-249
Bunge Corp
Marks
MS
100-500
50-99
Bunge Corp
Vicksburg
MS
100-500
50-99
Bunge Corp
Cairo
IL
100-500
50-99
Bunge Corp
Destrehan
LA
10-20
100-249
Bunge Corp Soybean Processing
Emporia
KS
100-500
50-99
Lauhoff Grain Co
Danville
IL
NA
250-499
Cargill Incorporated
Cargill Inc
Fayetteville
NC
100-500
50-99
Cargill Inc
Sidney
OH
100-500
100-249
Cargill Inc
Sioux City
IA
100-500
50-99
Cargill Inc
Raleigh
NC
50-100
50-99
Cargill Inc
Guntersville
AL
50-100
50-99
Cargill Inc
Des Moines
IA
50-100
50-99
Cargill Inc
Chesapeake
VA
20-50
100-249
Cargill Inc
Iowa Falls
IA
NA
NA
Cargill Inc
Bloomington
IL
50-100
50-99
Cargill Inc
Kansas City
MO
50-100
20-49
(continued)
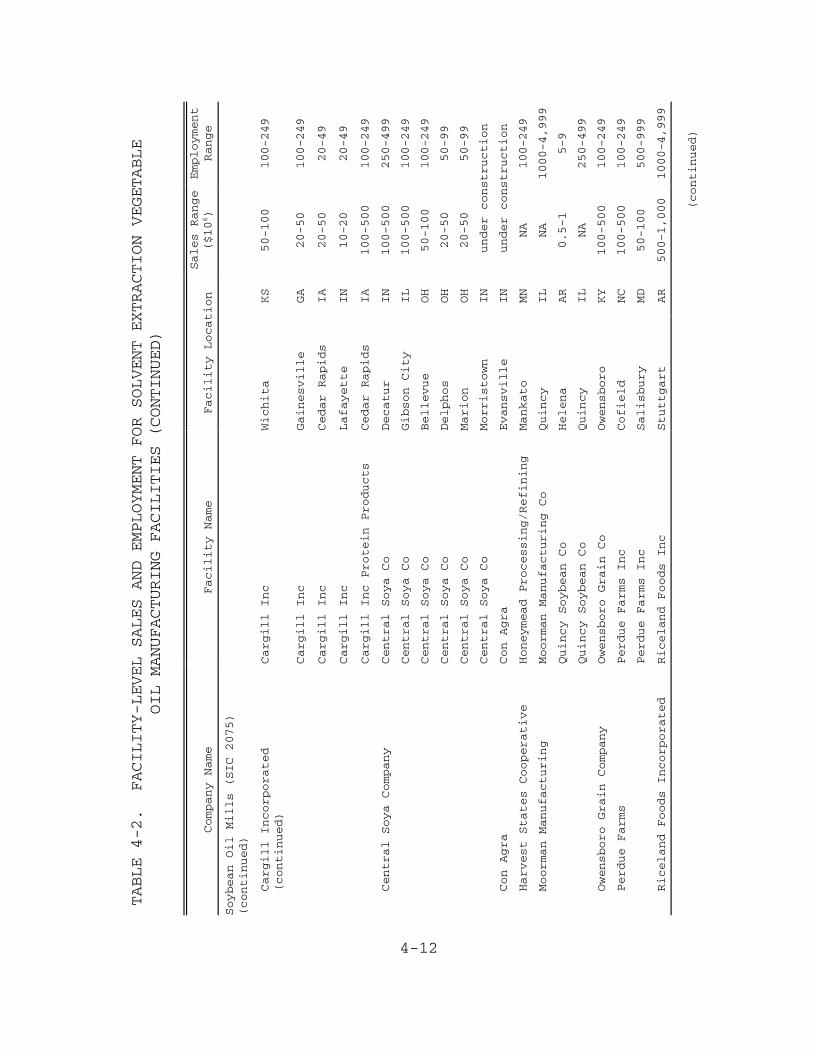
4-12
TABLE 4-2. FACILITY-LEVEL SALES AND EMPLOYMENT FOR SOLVENT EXTRACTION VEGETABLE
OIL MANUFACTURING FACILITIES (CONTINUED)
Company Name
Facility Name
Facility Location
Sales Range
($106)
Employment
Range
Soybean Oil Mills (SIC 2075)
(continued)
Cargill Incorporated
(continued)
Cargill Inc
Wichita
KS
50-100
100-249
Cargill Inc
Gainesville
GA
20-50
100-249
Cargill Inc
Cedar Rapids
IA
20-50
20-49
Cargill Inc
Lafayette
IN
10-20
20-49
Cargill Inc Protein Products
Cedar Rapids
IA
100-500
100-249
Central Soya Company
Central Soya Co
Decatur
IN
100-500
250-499
Central Soya Co
Gibson City
IL
100-500
100-249
Central Soya Co
Bellevue
OH
50-100
100-249
Central Soya Co
Delphos
OH
20-50
50-99
Central Soya Co
Marion
OH
20-50
50-99
Central Soya Co
Morristown
IN
under construction
Con Agra
Con Agra
Evansville
IN
under construction
Harvest States Cooperative
Honeymead Processing/Refining
Mankato
MN
NA
100-249
Moorman Manufacturing
Moorman Manufacturing Co
Quincy
IL
NA
1000-4,999
Quincy Soybean Co
Helena
AR
0.5-1
5-9
Quincy Soybean Co
Quincy
IL
NA
250-499
Owensboro Grain Company
Owensboro Grain Co
Owensboro
KY
100-500
100-249
Perdue Farms
Perdue Farms Inc
Cofield
NC
100-500
100-249
Perdue Farms Inc
Salisbury
MD
50-100
500-999
Riceland Foods Incorporated
Riceland Foods Inc
Stuttgart
AR
500-1,000
1000-4,999
(continued)
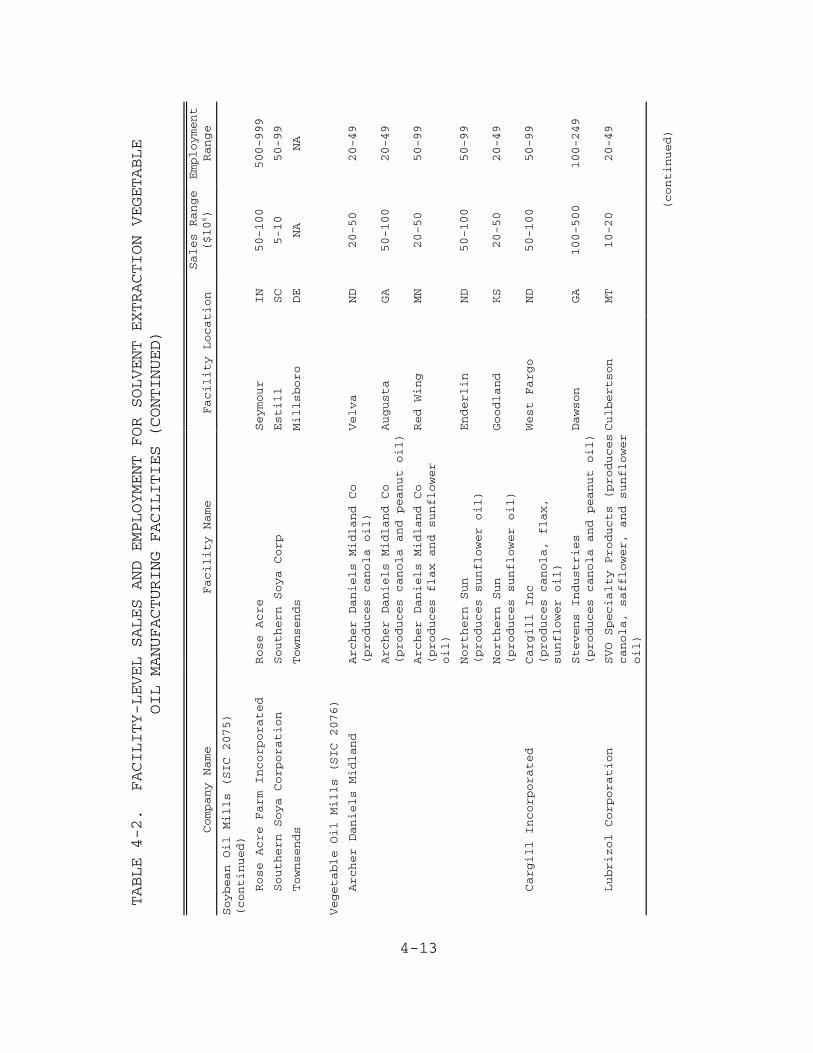
4-13
TABLE 4-2. FACILITY-LEVEL SALES AND EMPLOYMENT FOR SOLVENT EXTRACTION VEGETABLE
OIL MANUFACTURING FACILITIES (CONTINUED)
Company Name
Facility Name
Facility Location
Sales Range
($106)
Employment
Range
Soybean Oil Mills (SIC 2075)
(continued)
Rose Acre Farm Incorporated
Rose Acre
Seymour
IN
50-100
500-999
Southern Soya Corporation
Southern Soya Corp
Estill
SC
5-10
50-99
Townsends
Townsends
Millsboro
DE
NA
NA
Vegetable Oil Mills (SIC 2076)
Archer Daniels Midland
Archer Daniels Midland Co
(produces canola oil)
Velva
ND
20-50
20-49
Archer Daniels Midland Co
(produces canola and peanut oil)Augusta
GA
50-100
20-49
Archer Daniels Midland Co
(produces flax and sunflower
oil)
Red Wing
MN
20-50
50-99
Northern Sun
(produces sunflower oil)
Enderlin
ND
50-100
50-99
Northern Sun
(produces sunflower oil)
Goodland
KS
20-50
20-49
Cargill Incorporated
Cargill Inc
(produces canola, flax,
sunflower oil)
West Fargo
ND
50-100
50-99
Stevens Industries
(produces canola and peanut oil)Dawson
GA
100-500
100-249
Lubrizol Corporation
SVO Specialty Products (produces
canola, safflower, and sunflower
oil)
Culbertson
MT
10-20
20-49
(continued)
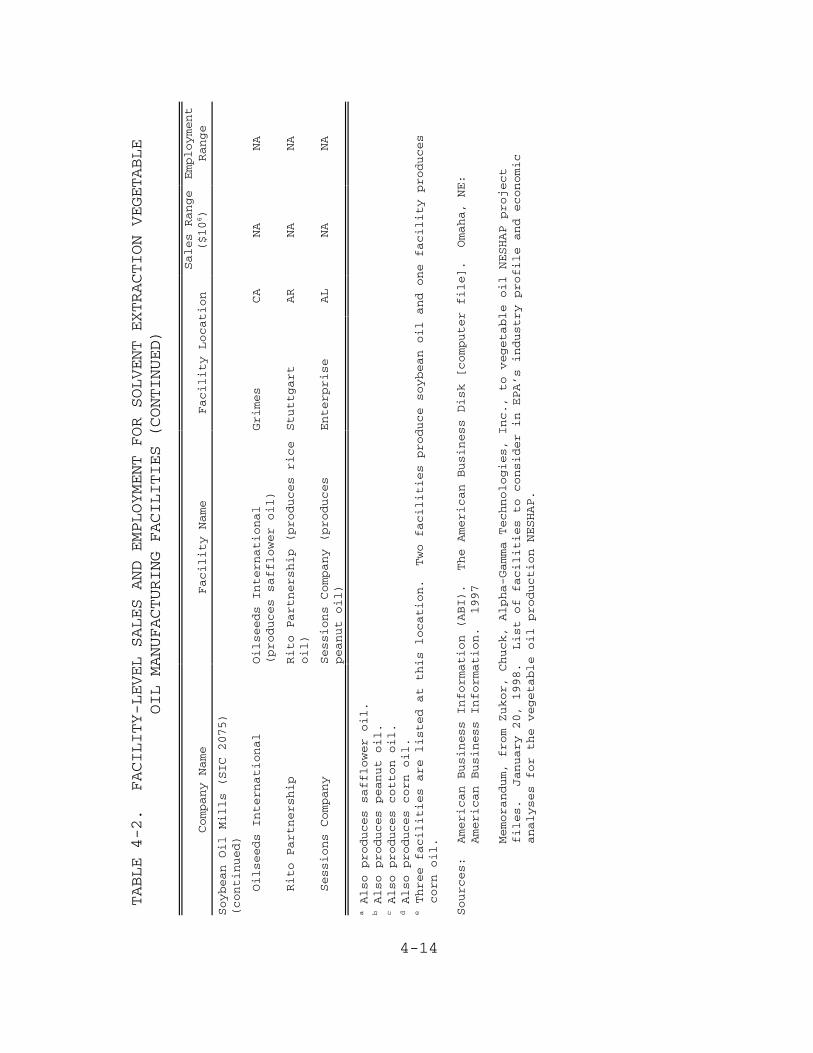
4-14
TABLE 4-2. FACILITY-LEVEL SALES AND EMPLOYMENT FOR SOLVENT EXTRACTION VEGETABLE
OIL MANUFACTURING FACILITIES (CONTINUED)
Company Name
Facility Name
Facility Location
Sales Range
($106)
Employment
Range
Soybean Oil Mills (SIC 2075)
(continued)
Oilseeds International
Oilseeds International
(produces safflower oil)
Grimes
CA
NA
NA
Rito Partnership
Rito Partnership (produces rice
oil)
Stuttgart
AR
NA
NA
Sessions Company
Sessions Company (produces
peanut oil)
Enterprise
AL
NA
NA
a Also produces safflower oil.
b Also produces peanut oil.
c Also produces cotton oil.
d Also produces corn oil.
eThree facilities are listed at this location. Two facilities produce soybean oil and one facility produces
corn oil.
Sources:
American Business Information (ABI). The American Business Disk [computer file]. Omaha, NE:
American Business Information. 1997
Memorandum, from Zukor, Chuck, Alpha-Gamma Technologies, Inc., to vegetable oil NESHAP project
files. January 20, 1998. List of facilities to consider in EPA’s industry profile and economic
analyses for the vegetable oil production NESHAP.
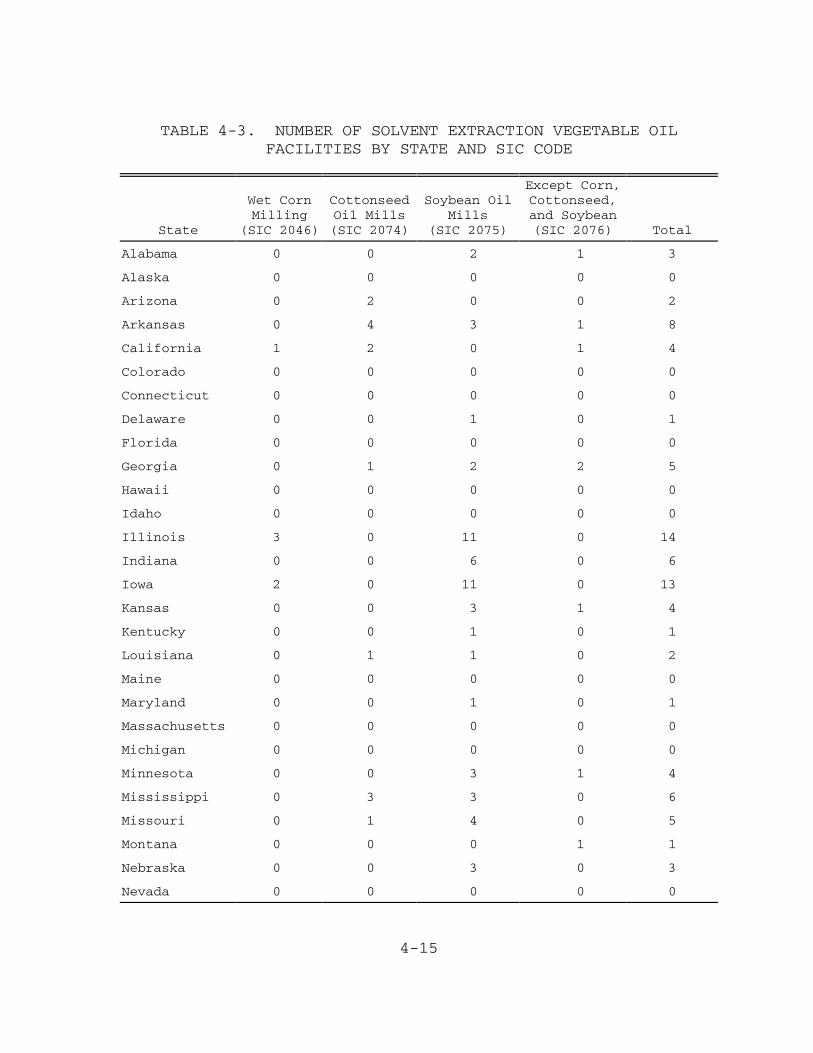
4-15
TABLE 4-3. NUMBER OF SOLVENT EXTRACTION VEGETABLE OILFACILITIES BY STATE AND SIC CODE
State
Wet CornMilling
(SIC 2046)
CottonseedOil Mills(SIC 2074)
Soybean OilMills
(SIC 2075)
Except Corn,Cottonseed,and Soybean(SIC 2076) Total
Alabama 0 0 2 1 3
Alaska 0 0 0 0 0
Arizona 0 2 0 0 2
Arkansas 0 4 3 1 8
California 1 2 0 1 4
Colorado 0 0 0 0 0
Connecticut 0 0 0 0 0
Delaware 0 0 1 0 1
Florida 0 0 0 0 0
Georgia 0 1 2 2 5
Hawaii 0 0 0 0 0
Idaho 0 0 0 0 0
Illinois 3 0 11 0 14
Indiana 0 0 6 0 6
Iowa 2 0 11 0 13
Kansas 0 0 3 1 4
Kentucky 0 0 1 0 1
Louisiana 0 1 1 0 2
Maine 0 0 0 0 0
Maryland 0 0 1 0 1
Massachusetts 0 0 0 0 0
Michigan 0 0 0 0 0
Minnesota 0 0 3 1 4
Mississippi 0 3 3 0 6
Missouri 0 1 4 0 5
Montana 0 0 0 1 1
Nebraska 0 0 3 0 3
Nevada 0 0 0 0 0

4-16
(continued)
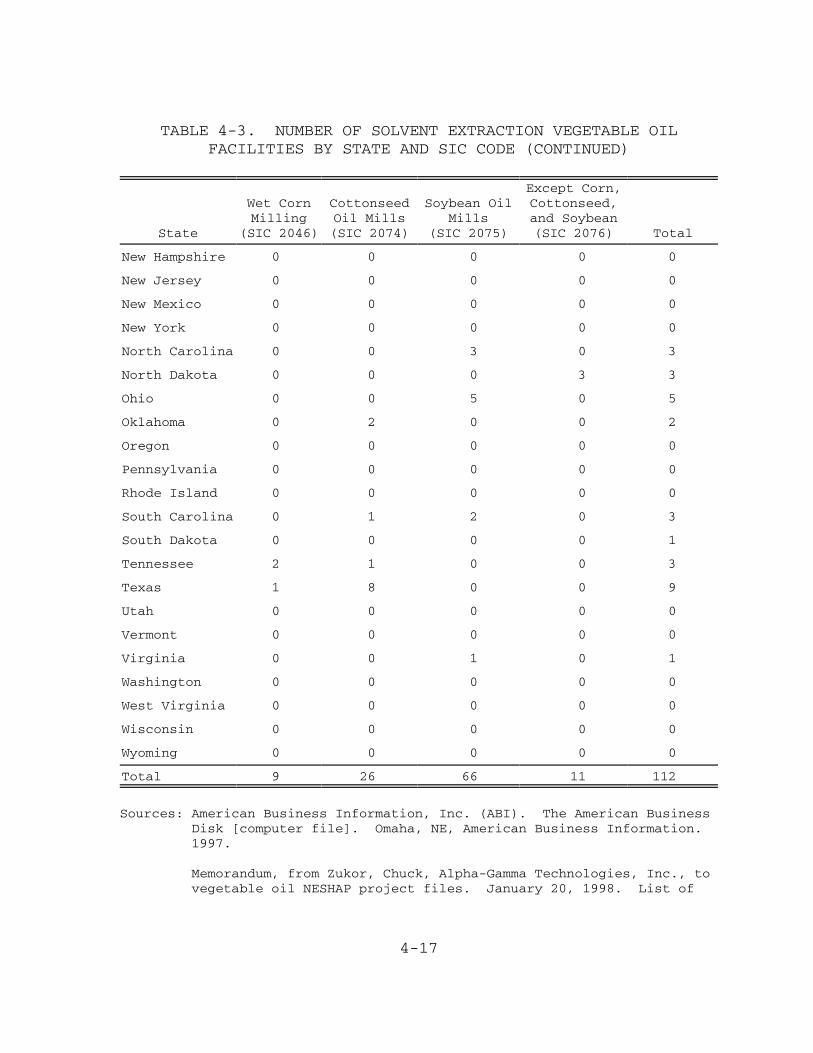
4-17
TABLE 4-3. NUMBER OF SOLVENT EXTRACTION VEGETABLE OILFACILITIES BY STATE AND SIC CODE (CONTINUED)
State
Wet CornMilling
(SIC 2046)
CottonseedOil Mills(SIC 2074)
Soybean OilMills
(SIC 2075)
Except Corn,Cottonseed,and Soybean(SIC 2076) Total
New Hampshire 0 0 0 0 0
New Jersey 0 0 0 0 0
New Mexico 0 0 0 0 0
New York 0 0 0 0 0
North Carolina 0 0 3 0 3
North Dakota 0 0 0 3 3
Ohio 0 0 5 0 5
Oklahoma 0 2 0 0 2
Oregon 0 0 0 0 0
Pennsylvania 0 0 0 0 0
Rhode Island 0 0 0 0 0
South Carolina 0 1 2 0 3
South Dakota 0 0 0 0 1
Tennessee 2 1 0 0 3
Texas 1 8 0 0 9
Utah 0 0 0 0 0
Vermont 0 0 0 0 0
Virginia 0 0 1 0 1
Washington 0 0 0 0 0
West Virginia 0 0 0 0 0
Wisconsin 0 0 0 0 0
Wyoming 0 0 0 0 0
Total 9 26 66 11 112
Sources: American Business Information, Inc. (ABI). The American BusinessDisk [computer file]. Omaha, NE, American Business Information. 1997.
Memorandum, from Zukor, Chuck, Alpha-Gamma Technologies, Inc., tovegetable oil NESHAP project files. January 20, 1998. List of

4-18
facilities to consider in EPA’s industry profile and economicanalyses for the vegetable oil production NESHAP.
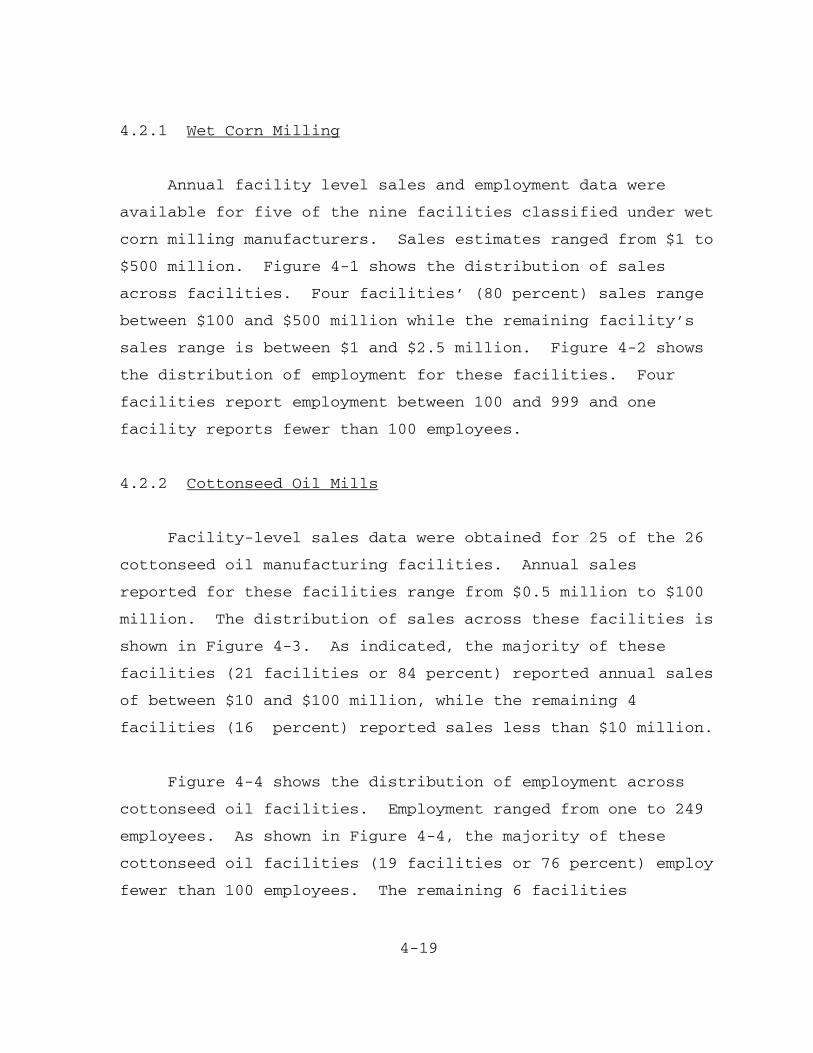
4-19
4.2.1 Wet Corn Milling
Annual facility level sales and employment data were
available for five of the nine facilities classified under wet
corn milling manufacturers. Sales estimates ranged from $1 to
$500 million. Figure 4-1 shows the distribution of sales
across facilities. Four facilities’ (80 percent) sales range
between $100 and $500 million while the remaining facility’s
sales range is between $1 and $2.5 million. Figure 4-2 shows
the distribution of employment for these facilities. Four
facilities report employment between 100 and 999 and one
facility reports fewer than 100 employees.
4.2.2 Cottonseed Oil Mills
Facility-level sales data were obtained for 25 of the 26
cottonseed oil manufacturing facilities. Annual sales
reported for these facilities range from $0.5 million to $100
million. The distribution of sales across these facilities is
shown in Figure 4-3. As indicated, the majority of these
facilities (21 facilities or 84 percent) reported annual sales
of between $10 and $100 million, while the remaining 4
facilities (16 percent) reported sales less than $10 million.
Figure 4-4 shows the distribution of employment across
cottonseed oil facilities. Employment ranged from one to 249
employees. As shown in Figure 4-4, the majority of these
cottonseed oil facilities (19 facilities or 76 percent) employ
fewer than 100 employees. The remaining 6 facilities

4-20
(24 percent) reported employment between 100 and 999
employees.
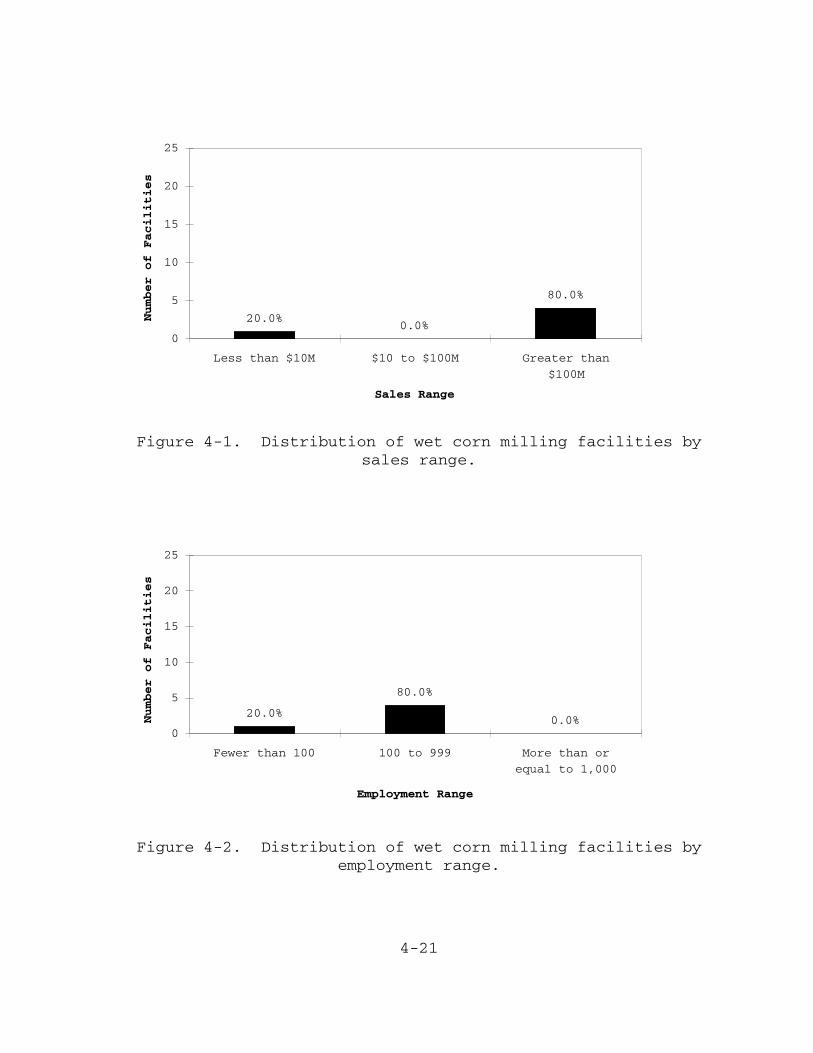
4-21
80.0%
0.0%20.0%
0
5
10
15
20
25
Less than $10M $10 to $100M Greater than
$100M
Sales Range
Number of Facilities
Figure 4-1. Distribution of wet corn milling facilities bysales range.
20.0%
80.0%
0.0%0
5
10
15
20
25
Fewer than 100 100 to 999 More than or
equal to 1,000
Employment Range
Number of Facilities
Figure 4-2. Distribution of wet corn milling facilities byemployment range.

4-22
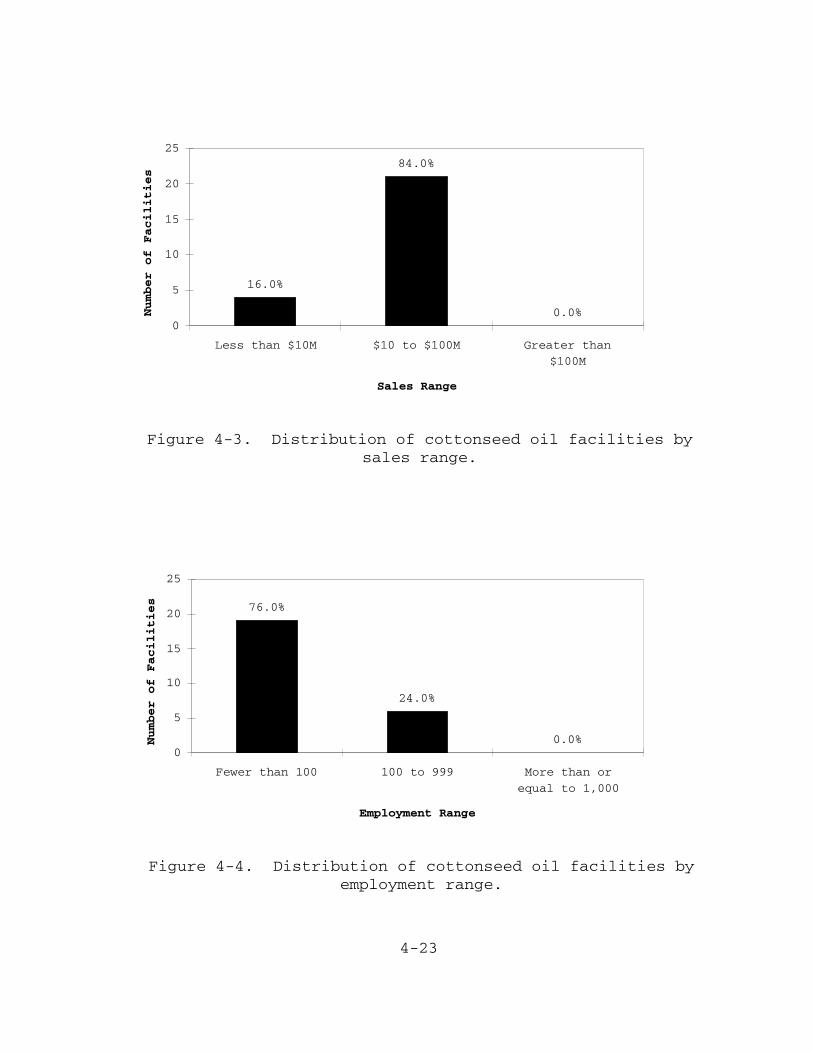
4-23
16.0%
84.0%
0.0%0
5
10
15
20
25
Less than $10M $10 to $100M Greater than
$100M
Sales Range
Number of Facilities
Figure 4-3. Distribution of cottonseed oil facilities bysales range.
76.0%
24.0%
0.0%0
5
10
15
20
25
Fewer than 100 100 to 999 More than or
equal to 1,000
Employment Range
Number of Facilities
Figure 4-4. Distribution of cottonseed oil facilities byemployment range.
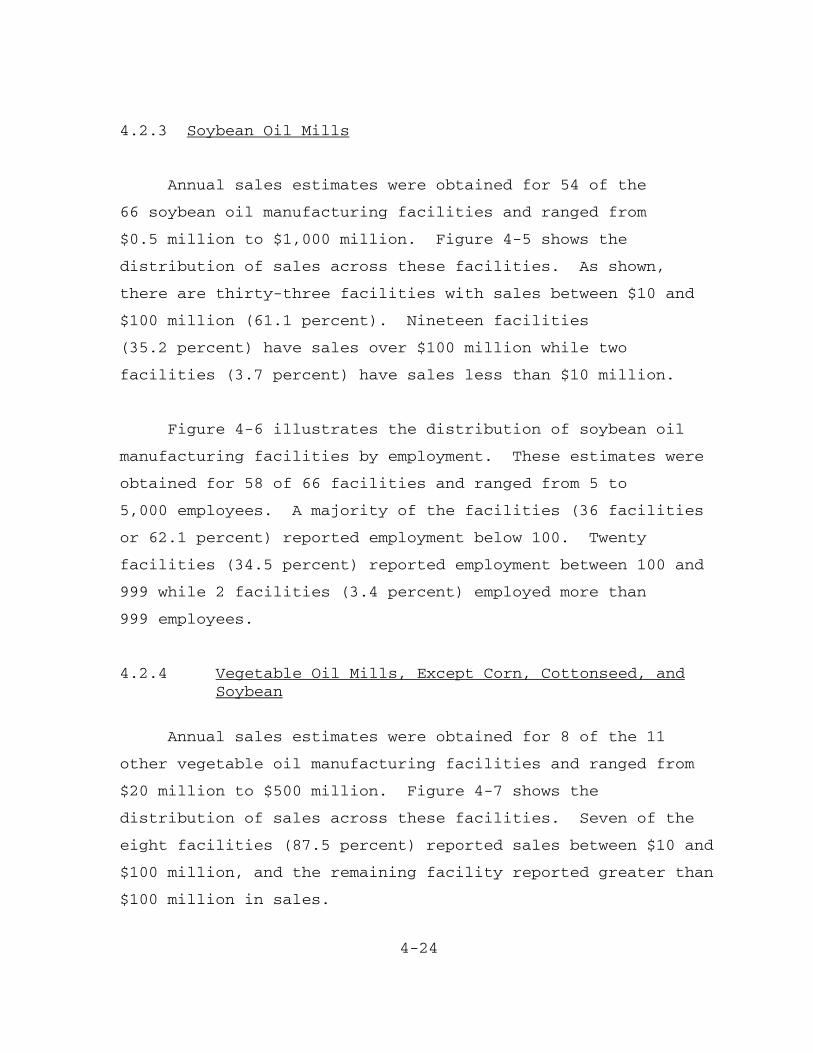
4-24
4.2.3 Soybean Oil Mills
Annual sales estimates were obtained for 54 of the
66 soybean oil manufacturing facilities and ranged from
$0.5 million to $1,000 million. Figure 4-5 shows the
distribution of sales across these facilities. As shown,
there are thirty-three facilities with sales between $10 and
$100 million (61.1 percent). Nineteen facilities
(35.2 percent) have sales over $100 million while two
facilities (3.7 percent) have sales less than $10 million.
Figure 4-6 illustrates the distribution of soybean oil
manufacturing facilities by employment. These estimates were
obtained for 58 of 66 facilities and ranged from 5 to
5,000 employees. A majority of the facilities (36 facilities
or 62.1 percent) reported employment below 100. Twenty
facilities (34.5 percent) reported employment between 100 and
999 while 2 facilities (3.4 percent) employed more than
999 employees.
4.2.4 Vegetable Oil Mills, Except Corn, Cottonseed, andSoybean
Annual sales estimates were obtained for 8 of the 11
other vegetable oil manufacturing facilities and ranged from
$20 million to $500 million. Figure 4-7 shows the
distribution of sales across these facilities. Seven of the
eight facilities (87.5 percent) reported sales between $10 and
$100 million, and the remaining facility reported greater than
$100 million in sales.

4-25
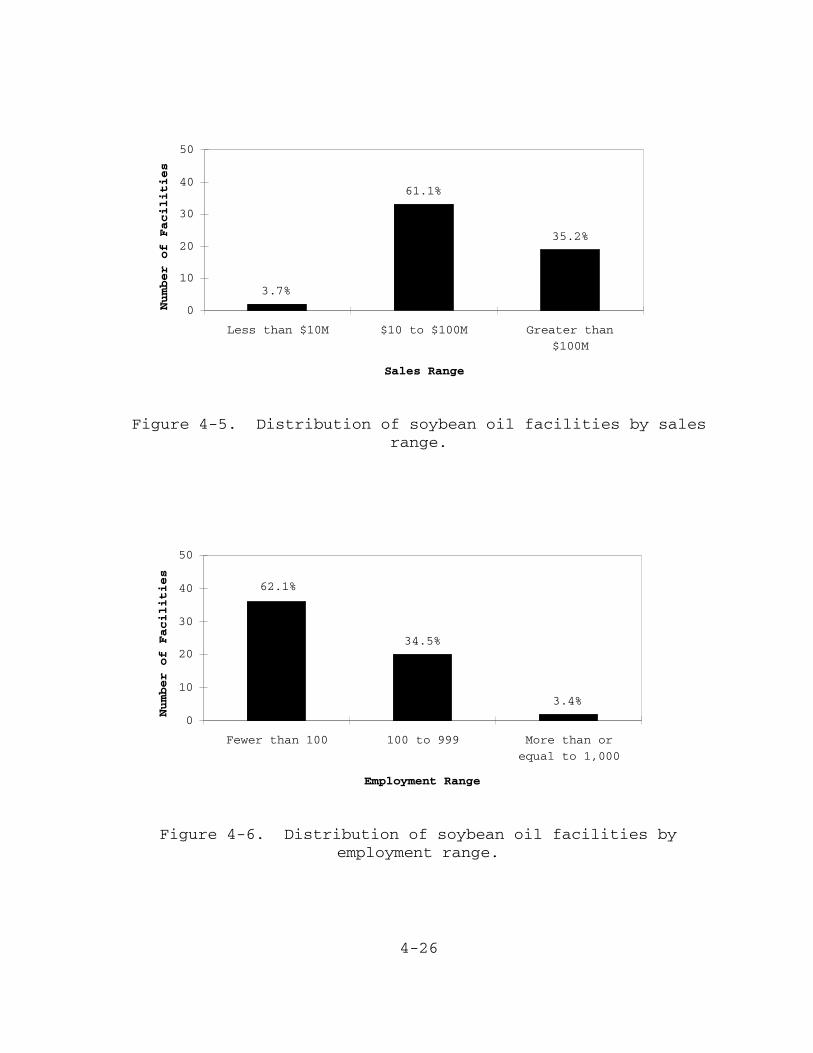
4-26
3.7%
61.1%
35.2%
0
10
20
30
40
50
Less than $10M $10 to $100M Greater than
$100M
Sales Range
Number of Facilities
Figure 4-5. Distribution of soybean oil facilities by salesrange.
3.4%
34.5%
62.1%
0
10
20
30
40
50
Fewer than 100 100 to 999 More than or
equal to 1,000
Employment Range
Number of Facilities
Figure 4-6. Distribution of soybean oil facilities byemployment range.
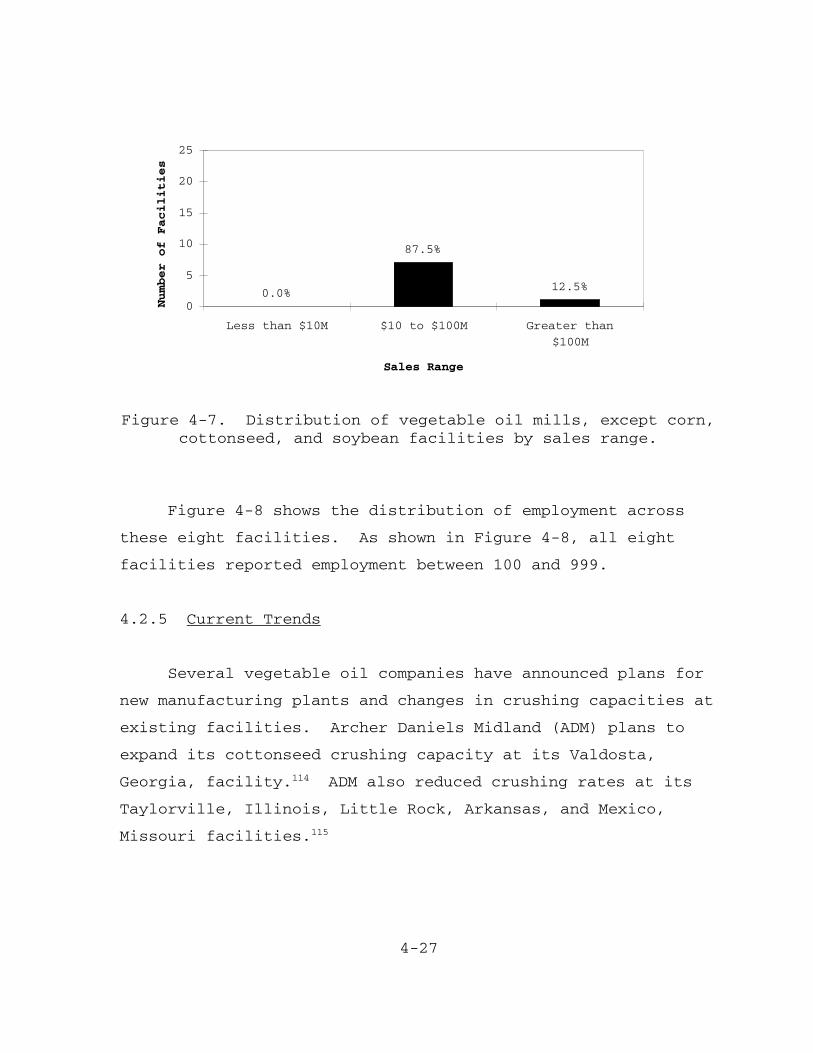
4-27
0.0%
87.5%
12.5%
0
5
10
15
20
25
Less than $10M $10 to $100M Greater than
$100M
Sales Range
Number of Facilities
Figure 4-7. Distribution of vegetable oil mills, except corn,cottonseed, and soybean facilities by sales range.
Figure 4-8 shows the distribution of employment across
these eight facilities. As shown in Figure 4-8, all eight
facilities reported employment between 100 and 999.
4.2.5 Current Trends
Several vegetable oil companies have announced plans for
new manufacturing plants and changes in crushing capacities at
existing facilities. Archer Daniels Midland (ADM) plans to
expand its cottonseed crushing capacity at its Valdosta,
Georgia, facility.114 ADM also reduced crushing rates at its
Taylorville, Illinois, Little Rock, Arkansas, and Mexico,
Missouri facilities.115

4-28
Ag Processing has announced it will build a new soybean
processing facility in Hastings, Nebraska.116 During 1996,
Central Soya corporation opened a new soybean processing plant
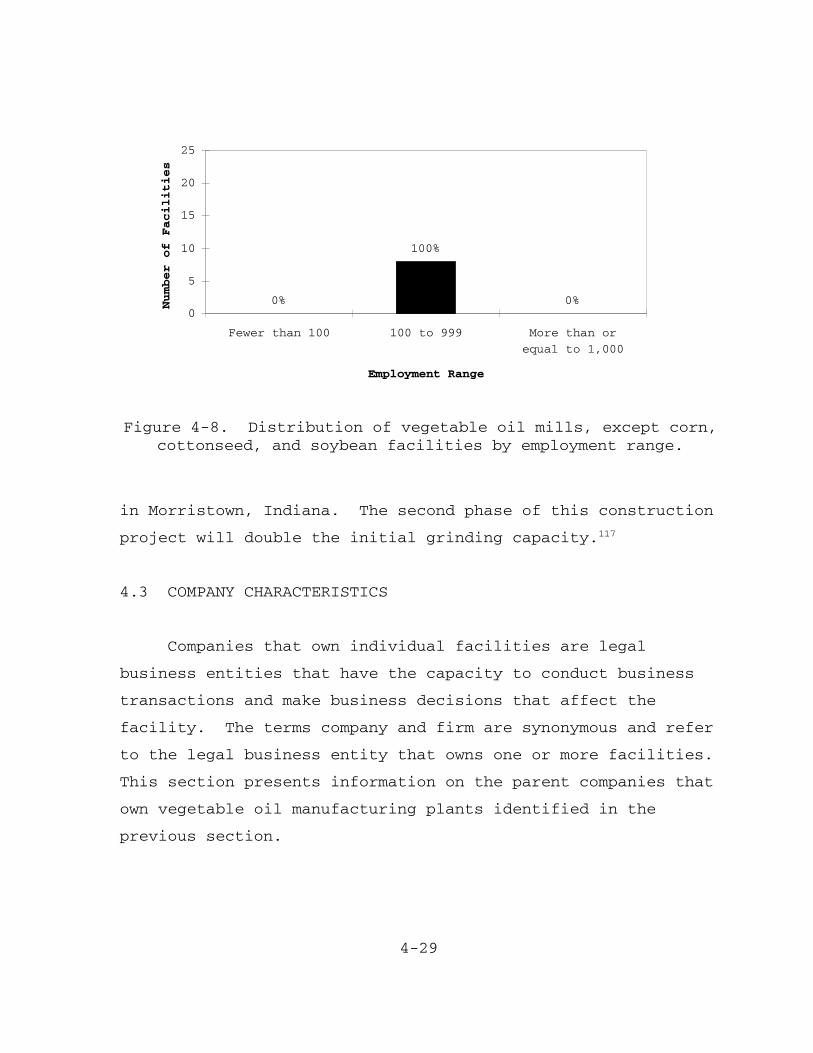
4-29
100%
0% 0%0
5
10
15
20
25
Fewer than 100 100 to 999 More than or
equal to 1,000
Employment Range
Number of Facilities
Figure 4-8. Distribution of vegetable oil mills, except corn,cottonseed, and soybean facilities by employment range.
in Morristown, Indiana. The second phase of this construction
project will double the initial grinding capacity.117
4.3 COMPANY CHARACTERISTICS
Companies that own individual facilities are legal
business entities that have the capacity to conduct business
transactions and make business decisions that affect the
facility. The terms company and firm are synonymous and refer
to the legal business entity that owns one or more facilities.
This section presents information on the parent companies that
own vegetable oil manufacturing plants identified in the
previous section.
*The figures discussed in this section group together data reported fordifferent fiscal years and therefore should be used with caution. However, the ranges reported are fairly broad so that it is unlikelythat companies shifted between ranges over the time periods reported.
4-30
4.3.1 Ownership
Based on facility data presented in Table 4-2,
32 companies have been identified as owners of vegetable oil
manufacturing plants utilizing the solvent extraction method.
Table 4-4 lists the most recently reported organization type,
sales and employment data for 30 of the 32
companies.118,119,120,121,122 In this table, we also identify the
fiscal year for which these data are reported. Data were not
available for Oilseeds International and Rito Partnership.
Cargill Incorporated ($62,570.0 million), Con Agra (24,281.6
million), and Archer Daniels Midland Company ($13,314.0
million) are the largest companies with respect to total
sales. Archer Daniels Midland owns the largest number of
facilities (33 facilities) while Cargill Incorporated owns 17
facilities. Con Agra only owns one facility and it is
currently under construction.
4.3.2 Size Distribution
Figure 4-9 shows the size distribution by sales range of
the 30 companies with data available.* As shown, 11 companies
(36.7 percent) reported sales greater than $1 billion. Seven
companies (23.3 percent) reported sales between $100 and $999
million while ten companies (33.3 percent) reported sales of

4-31
$10 to $99 million. The remaining two companies (6.7 percent)
report sales less than $10 million.
4-32
TABLE 4-4. COMPANY-LEVEL DATA FOR SOLVENT EXTRACTION VEGETABLE OIL MANUFACTURERS
Company
Number of
Facilities
within SIC
Code
Organization
Type
Sales ($106)
Employment
Fiscal Year
Ending
Wet Corn Milling-SIC 2046
Archer Daniels Midland Company
3Public
13,314.0
14,811
June 30, 1996
Bunge Corporation
1Private
2,570.0a
3,000
March 31, 1996
Cargill Incorporated
2Private
62,570.0a
73,000
May 31, 996
CPC International
1Public
9,844.0
55,300
Dec. 31, 1996
California Oils
1NA
<2.5
<150
1996
Tate and Lyle PLCb
1Foreign
7,315.4
17,743
1996
Cottonseed Oil Mills-SIC 2074
Archer Daniels Midland Company
7Public
13,314.0
14,811
June 30, 1996
Chickasha Cotton Oil Company
5Private
93.0
600
March 31, 1995
Delta Oil Mill
1Private
22.5
90
July 31, 1996
Dunavant Enterprisesb
2Private
720.0
2,000
June 30, 1995
Hartsville Oil Mill Incorporated
1Private
>20.0
100
1996
J.G. Boswell
1Private
80.0a
1,000
June 30, 1993
Osceola Products
2Private
50.0
170
July 31, 1996
Plains Cooperative Oil Mill, Inc.
1Private
128.0
108
Sept. 30, 1995
Planter’s Cotton Oil Mill
1Private
35.0a
100
July 31, 1996
Producers Cooperative Mill
1Private
35.0
100
June 30, 1996
(continued)
4-33
TABLE 4-4. COMPANY-LEVEL DATA FOR SOLVENT EXTRACTION VEGETABLE OIL MANUFACTURERS
(CONTINUED)
Company
Number of
Facilities
within SIC
Code
Organization
Type
Sales ($106)
Employment
Fiscal Year
Ending
Cottonseed Oil Mills-SIC 2074
(continued)
Valley Cooperative Mills
1Private
32.0a
100
1992
Yazoo Valley Oil Mill, Inc.
3Private
113.7
300
July 31, 1996
Soybean Oil Mills-SIC 2075
Ag Processing
8Private
1,370.0
3,000
Aug. 31, 1995
Archer Daniels Midland Company
18
Public
13,314.0
14,811
June 30, 1996
Bunge Corporation
7Private
2,570.0
3,000
March 31, 996
Cargill Incorporated
15
Private
62,570.0
73,000
May 31, 1996
Central Soya Company
6Private
1,000.0
1,200
Dec. 31, 1994
ConAgra
1Public
24,821.6
83,123
May 26, 1996
Harvest States Cooperativec
1Private
1,000.0a
2,400
May 31, 1996
Moorman Manufacturingd
3Private
800.0a
3,500
March 31, 1996
Owensboro Grain Company
1Private
39.0a
120
Nov. 30, 1989
Perdue Farms
2Private
2,000.0
19,000
March 31, 1996
Riceland Foods Incorporated
1Private
807.6
2,000
July 31, 1996
Rose Acre Farms Incorporated
1Private
152.0
900
1996
Southern Soya Corporation
1Private
8.0
89
May 31, 1996
Townsends
1Private
270.0a
3,000
May 30, 1993
(continued)
4-34
TABLE 4-4. COMPANY-LEVEL DATA FOR SOLVENT EXTRACTION VEGETABLE OIL MANUFACTURERS
(CONTINUED)
Company
Number of
Facilities
within SIC
Code
Organization
Type
Sales ($106)
Employment
Fiscal Year
Ending
Vegetable Oil Mills, Except Corn and
Cottonseed-SIC 2076
Archer Daniels Midland Company
5Public
13,314.0
14,811
June 30, 1996
Cargill Incorporated
2Private
62,570.0
73,000
May 31, 1996
Lubrizol Corporatione
1Public
1,600.0
4,358
Dec. 31, 1996
Oilseeds International
1NA
NA
NA
NA
Rito Partnership
1NA
NA
NA
NA
Sessions Company
1Private
30.0
100
Dec. 31, 1994
a Estimated by source.
b Owns A.E. Staley.
c Owns Anderson Clayton.
d Owns Honeymead Processing.
e Owns Quincy Soybeans.
f Owns SVO Specialty Products.
Sources:
Information Access Corporation. Business Index [computer file]. Foster City, CA: Information
Access Corporation. 1997.
Dun & Bradstreet. D & B Million Dollar Directory: America’s Leading Public & Private
Companies. Bethlehem, PA, Dun & Bradstreet Corporation. 1997.
1997 Directory of Corporation Affiliations. Vol. 5: International Public and Private
Companies. New Providence, RI, National Register Publishing. 1997.
Standard and Poor’s Corporation. [CD-ROM]. Palo Alto, CA: Dialog Information Services. 1997.
American Business Information (ABI). The American Business Disk [computer file]. Omaha, NE:
American Business Information. 1997.
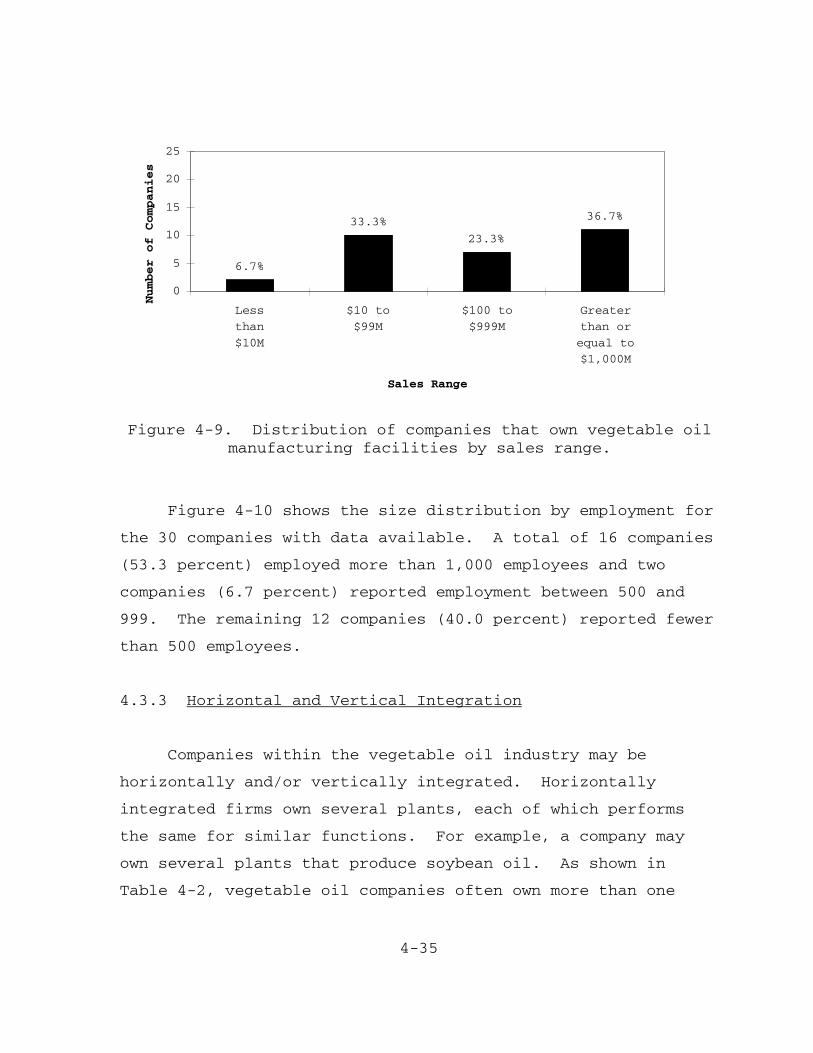
4-35
6.7%
33.3%
23.3%
36.7%
0
5
10
15
20
25
Less
than
$10M
$10 to
$99M
$100 to
$999M
Greater
than or
equal to
$1,000M
Sales Range
Number of Companies
Figure 4-9. Distribution of companies that own vegetable oilmanufacturing facilities by sales range.
Figure 4-10 shows the size distribution by employment for
the 30 companies with data available. A total of 16 companies
(53.3 percent) employed more than 1,000 employees and two
companies (6.7 percent) reported employment between 500 and
999. The remaining 12 companies (40.0 percent) reported fewer
than 500 employees.
4.3.3 Horizontal and Vertical Integration
Companies within the vegetable oil industry may be
horizontally and/or vertically integrated. Horizontally
integrated firms own several plants, each of which performs
the same for similar functions. For example, a company may
own several plants that produce soybean oil. As shown in
Table 4-2, vegetable oil companies often own more than one
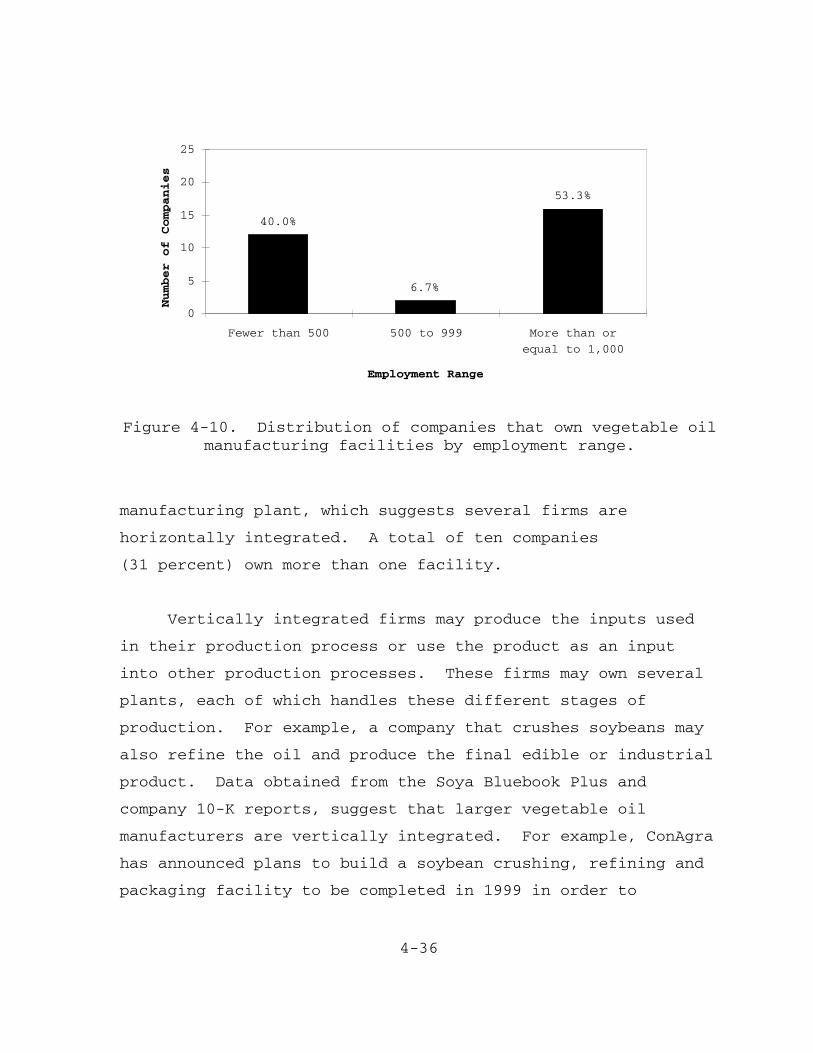
4-36
40.0%
6.7%
53.3%
0
5
10
15
20
25
Fewer than 500 500 to 999 More than or
equal to 1,000
Employment Range
Number of Companies
Figure 4-10. Distribution of companies that own vegetable oilmanufacturing facilities by employment range.
manufacturing plant, which suggests several firms are
horizontally integrated. A total of ten companies
(31 percent) own more than one facility.
Vertically integrated firms may produce the inputs used
in their production process or use the product as an input
into other production processes. These firms may own several
plants, each of which handles these different stages of
production. For example, a company that crushes soybeans may
also refine the oil and produce the final edible or industrial
product. Data obtained from the Soya Bluebook Plus and
company 10-K reports, suggest that larger vegetable oil
manufacturers are vertically integrated. For example, ConAgra
has announced plans to build a soybean crushing, refining and
packaging facility to be completed in 1999 in order to
4-37
“complete ConAgra’s vertical integration in the soybean
industry.”123 Other companies such as Archer Daniels Midland
and Cargill Incorporated engage in the processing and
refinement of raw materials as well as the production of the
final vegetable oil products.
4.4 SMALL BUSINESSES IMPACTS
Vegetable oil firms can be grouped into small and large
categories using the Small Business Administration’s (SBA)
general size standard definitions. These standards are
organized by SIC code and are based on either the number of
employees or by annual receipt levels of the firm. According
to SBA size standards, firms falling under SIC codes 2074
Cottonseed Oil Mills and 2075 Soybean Oil Mills are
categorized as small if the total number of employees falls
below 500. Firms under SIC code 2046 Wet Corn Milling are
categorized small if the number of employees is less than 750.
Firm classified under SIC 2076 Vegetable Oils, except corn,
soybean, and cottonseed are considered small if they employ
less than 1,000 employees.
Table 4-5 lists the employment and sales data for small
companies that are owners of vegetable oil manufacturing
facilities using the solvent extraction method.124,125,126 Based
on the SBA definitions outlined above, a total of 14 firms can
be classified as small. Two of these firms, Oilseeds
International and Rito Partnership, do not have employment
data available and are included as potential small businesses.

4-38
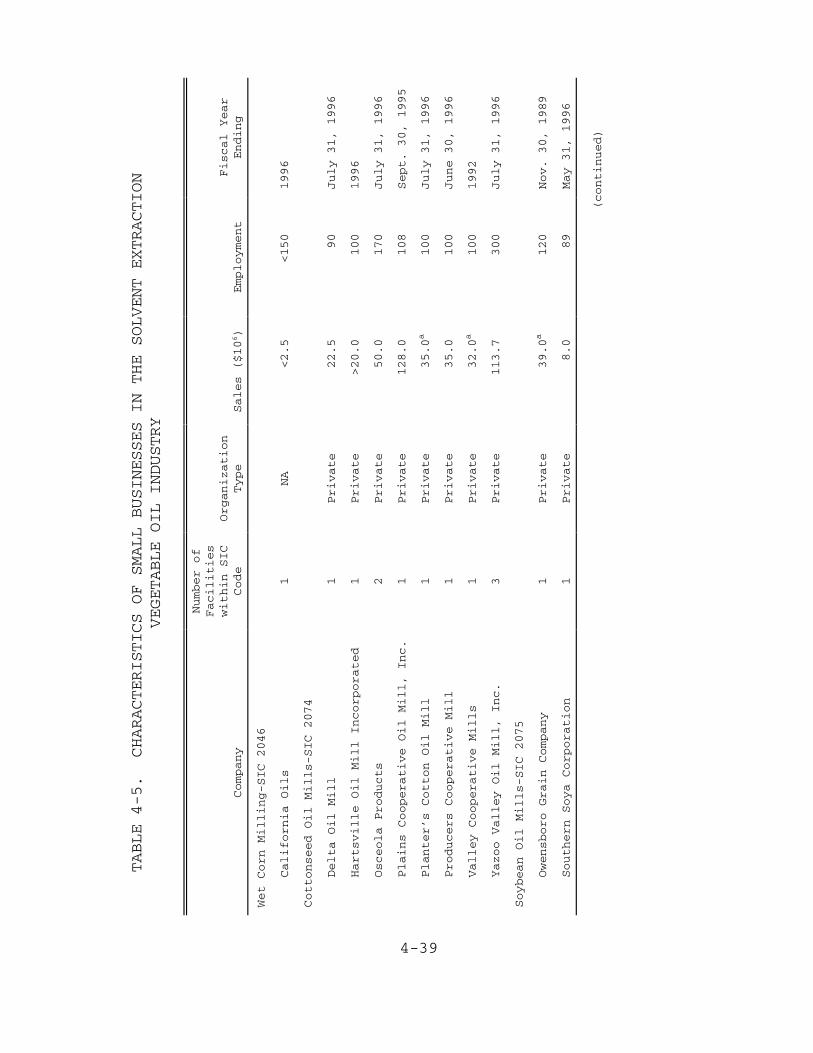
4-39
TABLE 4-5. CHARACTERISTICS OF SMALL BUSINESSES IN THE SOLVENT EXTRACTION
VEGETABLE OIL INDUSTRY
Company
Number of
Facilities
within SIC
Code
Organization
Type
Sales ($106)
Employment
Fiscal Year
Ending
Wet Corn Milling-SIC 2046
California Oils
1NA
<2.5
<150
1996
Cottonseed Oil Mills-SIC 2074
Delta Oil Mill
1Private
22.5
90
July 31, 1996
Hartsville Oil Mill Incorporated
1Private
>20.0
100
1996
Osceola Products
2Private
50.0
170
July 31, 1996
Plains Cooperative Oil Mill, Inc.
1Private
128.0
108
Sept. 30, 1995
Planter’s Cotton Oil Mill
1Private
35.0a
100
July 31, 1996
Producers Cooperative Mill
1Private
35.0
100
June 30, 1996
Valley Cooperative Mills
1Private
32.0a
100
1992
Yazoo Valley Oil Mill, Inc.
3Private
113.7
300
July 31, 1996
Soybean Oil Mills-SIC 2075
Owensboro Grain Company
1Private
39.0a
120
Nov. 30, 1989
Southern Soya Corporation
1Private
8.0
89
May 31, 1996
(continued)
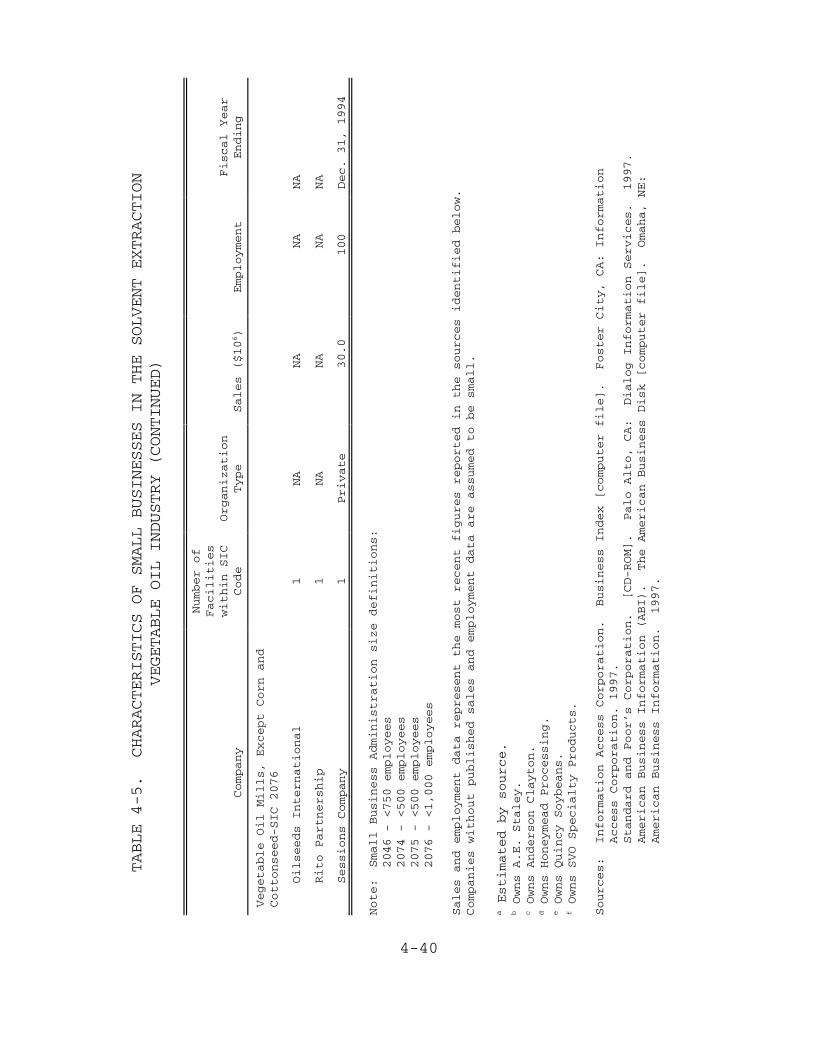
4-40
TABLE 4-5. CHARACTERISTICS OF SMALL BUSINESSES IN THE SOLVENT EXTRACTION
VEGETABLE OIL INDUSTRY (CONTINUED)
Company
Number of
Facilities
within SIC
Code
Organization
Type
Sales ($106)
Employment
Fiscal Year
Ending
Vegetable Oil Mills, Except Corn and
Cottonseed-SIC 2076
Oilseeds International
1NA
NA
NA
NA
Rito Partnership
1NA
NA
NA
NA
Sessions Company
1Private
30.0
100
Dec. 31, 1994
Note:
Small Business Administration size definitions:
2046 - <750 employees
2074 - <500 employees
2075 - <500 employees
2076 - <1,000 employees
Sales and employment data represent the most recent figures reported in the sources identified below.
Companies without published sales and employment data are assumed to be small.
a Estimated by source.
b Owns A.E. Staley.
c Owns Anderson Clayton.
d Owns Honeymead Processing.
e Owns Quincy Soybeans.
f Owns SVO Specialty Products.
Sources:
Information Access Corporation. Business Index [computer file]. Foster City, CA: Information
Access Corporation. 1997.
Standard and Poor’s Corporation. [CD-ROM]. Palo Alto, CA: Dialog Information Services. 1997.
American Business Information (ABI). The American Business Disk [computer file]. Omaha, NE:
American Business Information. 1997.
5-1
SECTION 5
MARKETS
The following section includes historical information on
domestic production and consumption of vegetable oil as well
as a discussion of prices. It also includes information on
imports and exports, and finally, this section presents
information on trends and projections for the vegetable oil
industry.
5.1 HISTORICAL MARKET DATA
The quantities of vegetable oils produced and consumed
annually in the United States, prices of vegetable oils, and
foreign trade are discussed below.
5.1.1 Domestic Production
Table 5-1 presents the U.S. production of various
vegetable oils from 1984 through 1996.127 Production of corn,
cottonseed, soybean, and all other vegetable oils grouped
together, is graphed in Figure 5-1 for these years as well.128
The volume of soybean oil produced dwarfs that of all other
types of vegetable oils.

5-2
The 5-year average annual growth rates (1992-1996) for
domestically produced vegetable oils are presented in
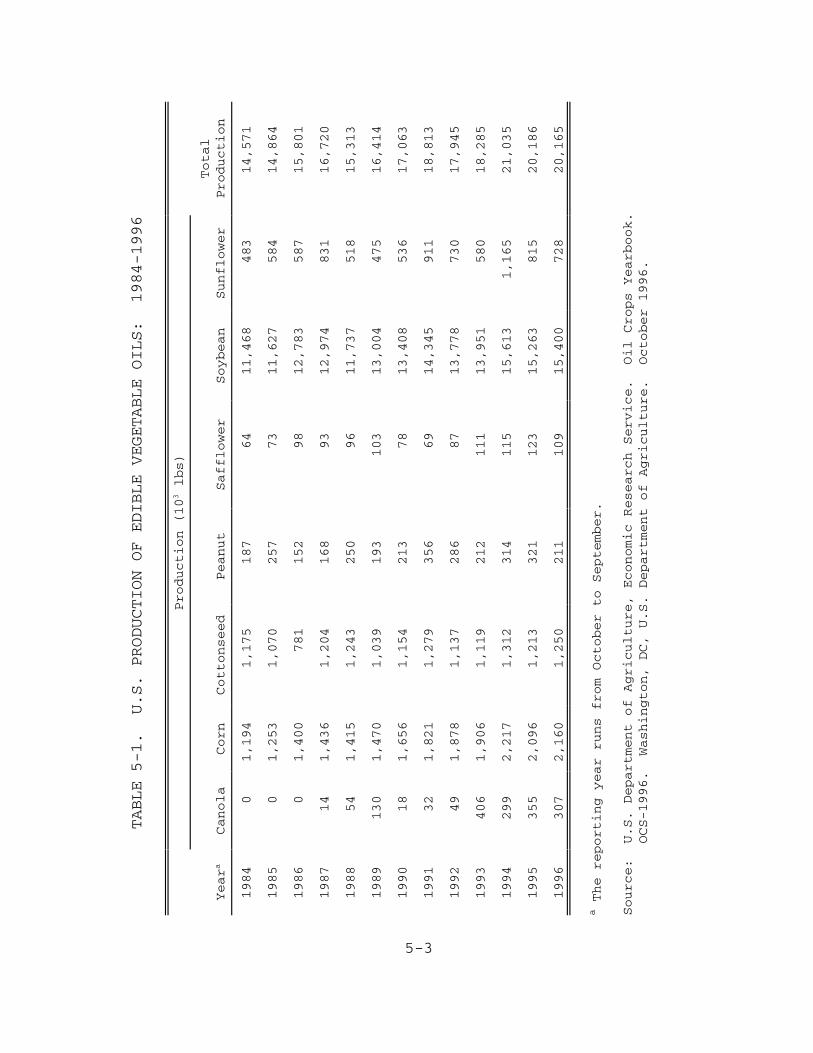
5-3
TABLE 5-1. U.S. PRODUCTION OF EDIBLE VEGETABLE OILS: 1984-1996
Production (103 lbs)
Yeara
Canola
Corn
Cottonseed
Peanut
Safflower
Soybean
Sunflower
Total
Production
1984
01,194
1,175
187
64
11,468
483
14,571
1985
01,253
1,070
257
73
11,627
584
14,864
1986
01,400
781
152
98
12,783
587
15,801
1987
14
1,436
1,204
168
93
12,974
831
16,720
1988
54
1,415
1,243
250
96
11,737
518
15,313
1989
130
1,470
1,039
193
103
13,004
475
16,414
1990
18
1,656
1,154
213
78
13,408
536
17,063
1991
32
1,821
1,279
356
69
14,345
911
18,813
1992
49
1,878
1,137
286
87
13,778
730
17,945
1993
406
1,906
1,119
212
111
13,951
580
18,285
1994
299
2,217
1,312
314
115
15,613
1,165
21,035
1995
355
2,096
1,213
321
123
15,263
815
20,186
1996
307
2,160
1,250
211
109
15,400
728
20,165
a The reporting year runs from October to September.
Source:
U.S. Department of Agriculture, Economic Research Service. Oil Crops Yearbook.
OCS-1996. Washington, DC, U.S. Department of Agriculture. October 1996.
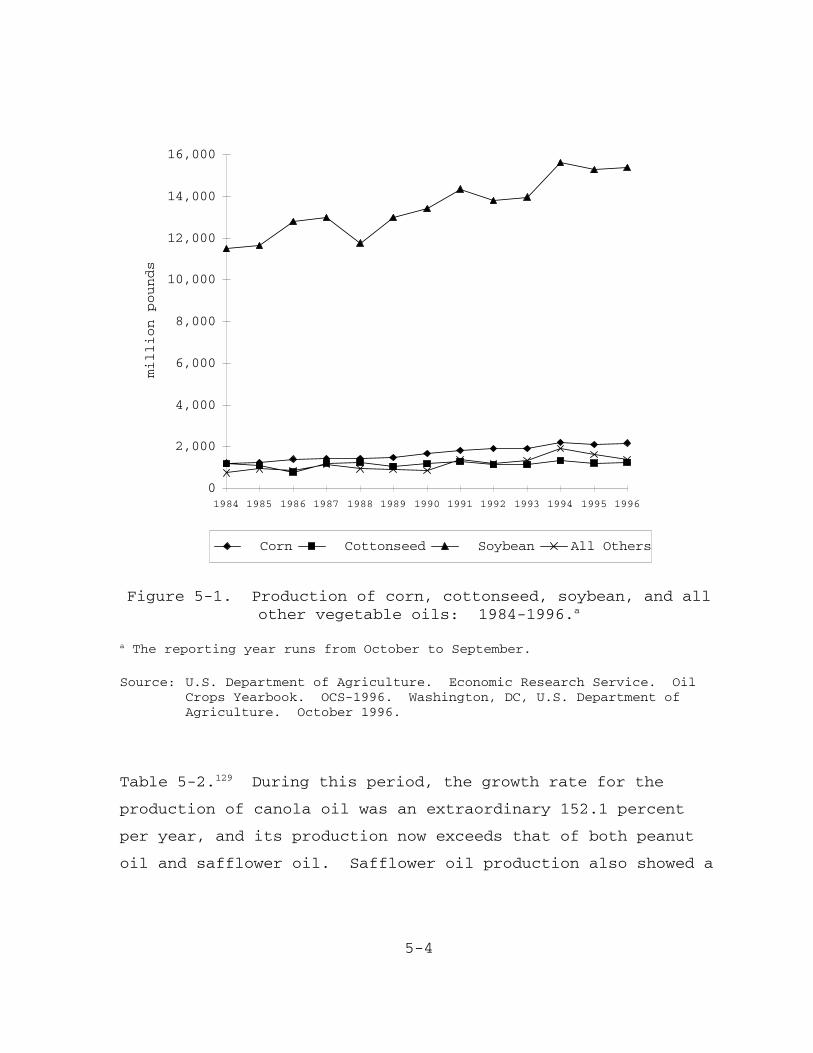
5-4
0
2,000
4,000
6,000
8,000
10,000
12,000
14,000
16,000
1984 1985 1986 1987 1988 1989 1990 1991 1992 1993 1994 1995 1996
million pounds
Corn Cottonseed Soybean All Others
Figure 5-1. Production of corn, cottonseed, soybean, and allother vegetable oils: 1984-1996.a
a The reporting year runs from October to September.
Source: U.S. Department of Agriculture. Economic Research Service. OilCrops Yearbook. OCS-1996. Washington, DC, U.S. Department ofAgriculture. October 1996.
Table 5-2.129 During this period, the growth rate for the
production of canola oil was an extraordinary 152.1 percent
per year, and its production now exceeds that of both peanut
oil and safflower oil. Safflower oil production also showed a
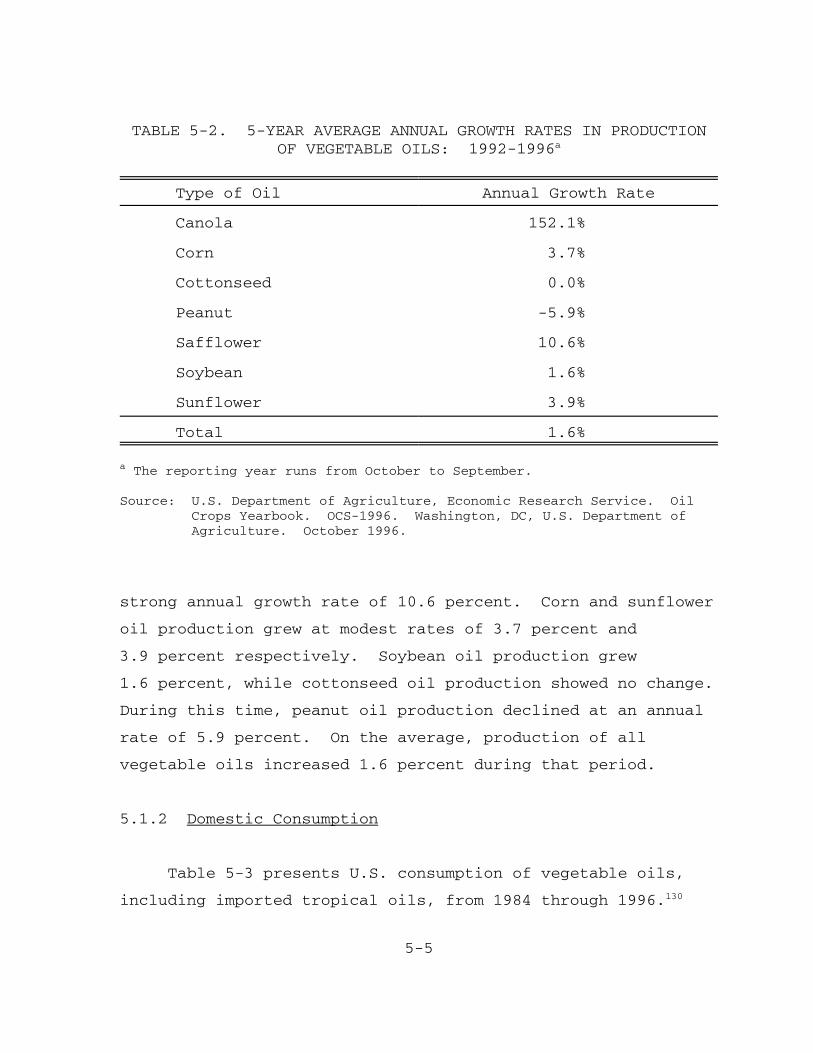
5-5
TABLE 5-2. 5-YEAR AVERAGE ANNUAL GROWTH RATES IN PRODUCTIONOF VEGETABLE OILS: 1992-1996a
Type of Oil Annual Growth Rate
Canola 152.1%
Corn 3.7%
Cottonseed 0.0%
Peanut -5.9%
Safflower 10.6%
Soybean 1.6%
Sunflower 3.9%
Total 1.6%
a The reporting year runs from October to September.
Source: U.S. Department of Agriculture, Economic Research Service. OilCrops Yearbook. OCS-1996. Washington, DC, U.S. Department ofAgriculture. October 1996.
strong annual growth rate of 10.6 percent. Corn and sunflower
oil production grew at modest rates of 3.7 percent and
3.9 percent respectively. Soybean oil production grew
1.6 percent, while cottonseed oil production showed no change.
During this time, peanut oil production declined at an annual
rate of 5.9 percent. On the average, production of all
vegetable oils increased 1.6 percent during that period.
5.1.2 Domestic Consumption
Table 5-3 presents U.S. consumption of vegetable oils,
including imported tropical oils, from 1984 through 1996.130
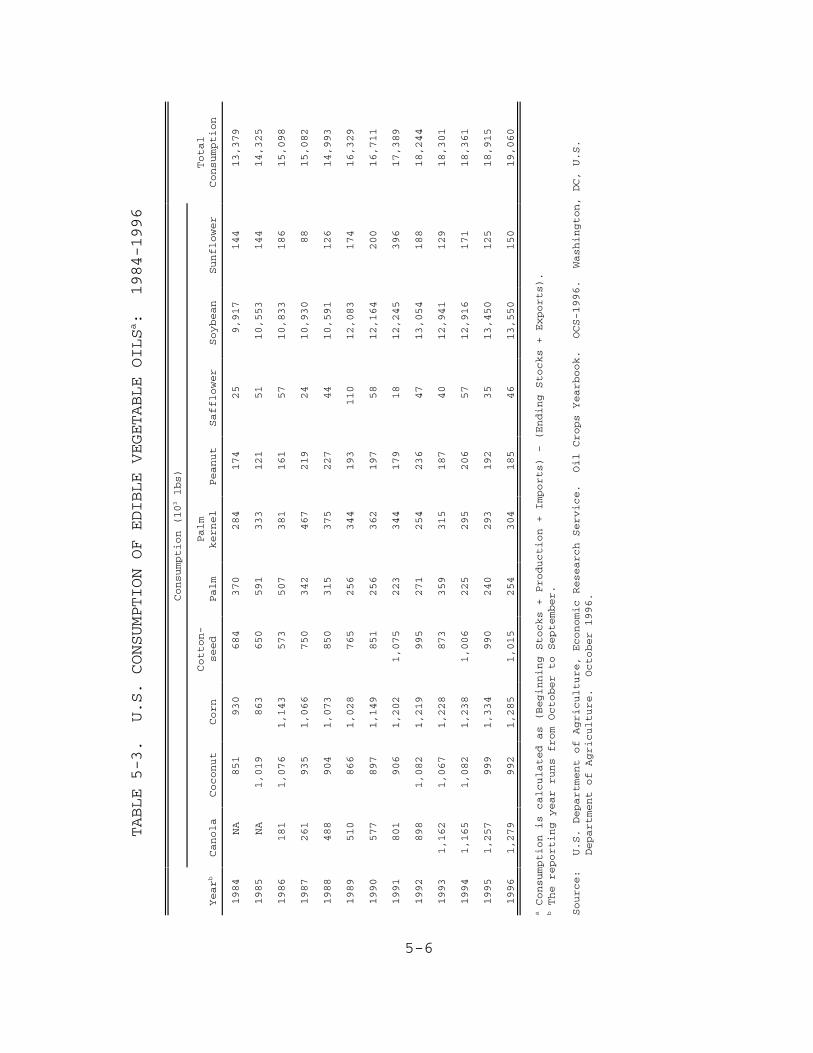
5-6
TABLE 5-3. U.S. CONSUMPTION OF EDIBLE VEGETABLE OILSa: 1984-1996
Consumption (103 lbs)
Yearb
Canola
Coconut
Corn
Cotton-
seed
Palm
Palm
kernel
Peanut
Safflower
Soybean
Sunflower
Total
Consumption
1984
NA
851
930
684
370
284
174
25
9,917
144
13,379
1985
NA
1,019
863
650
591
333
121
51
10,553
144
14,325
1986
181
1,076
1,143
573
507
381
161
57
10,833
186
15,098
1987
261
935
1,066
750
342
467
219
24
10,930
88
15,082
1988
488
904
1,073
850
315
375
227
44
10,591
126
14,993
1989
510
866
1,028
765
256
344
193
110
12,083
174
16,329
1990
577
897
1,149
851
256
362
197
58
12,164
200
16,711
1991
801
906
1,202
1,075
223
344
179
18
12,245
396
17,389
1992
898
1,082
1,219
995
271
254
236
47
13,054
188
18,244
1993
1,162
1,067
1,228
873
359
315
187
40
12,941
129
18,301
1994
1,165
1,082
1,238
1,006
225
295
206
57
12,916
171
18,361
1995
1,257
999
1,334
990
240
293
192
35
13,450
125
18,915
1996
1,279
992
1,285
1,015
254
304
185
46
13,550
150
19,060
a Consumption is calculated as (Beginning Stocks + Production + Imports) – (Ending Stocks + Exports).
b The reporting year runs from October to September.
Source:
U.S. Department of Agriculture, Economic Research Service. Oil Crops Yearbook. OCS-1996. Washington, DC, U.S.
Department of Agriculture. October 1996.
5-7
Total domestic consumption of vegetable oils increased by
42 percent during that time. Consumption increased for all
types of vegetable oils, except for palm oil. Consumption of
canola oil increased dramatically and currently exceeds
domestic production.131
The 5-year average annual growth rates for vegetable oil
consumption are presented in Table 5-4.132 All of the
vegetable oils listed experienced positive annual rates of
growth except for cottonseed oil, which showed an average
annual rate of decline of 0.7 percent, and palm oil, which
declined an average of 1.1 percent per year during that time.
The overall annual average increase in consumption was
1.9 percent.
Per-capita consumption values were previously discussed
in Section 3. Table 3-1 shows the increasing trend in per-
capita consumption of fats and oils in the United States from
1975 to 1995. This upward trend in per capita consumption
continued until reaching a peak in 1993, then declined
slightly in 1995 and 1996.
5.1.3 Vegetable Oil Prices
Table 5-5 presents U.S. prices in current dollars for
domestic crude vegetable oils from 1970 through 1996.133,134
Soybean oil prices are generally lower than prices for other
vegetable oils. For the year beginning October 1, 1995, corn
oil and sunflower sold for 3 percent more than soybean oil.

5-8
Cottonseed oil sold for 7 percent more, and peanut oil sold
for 63 percent more than soybean oil.
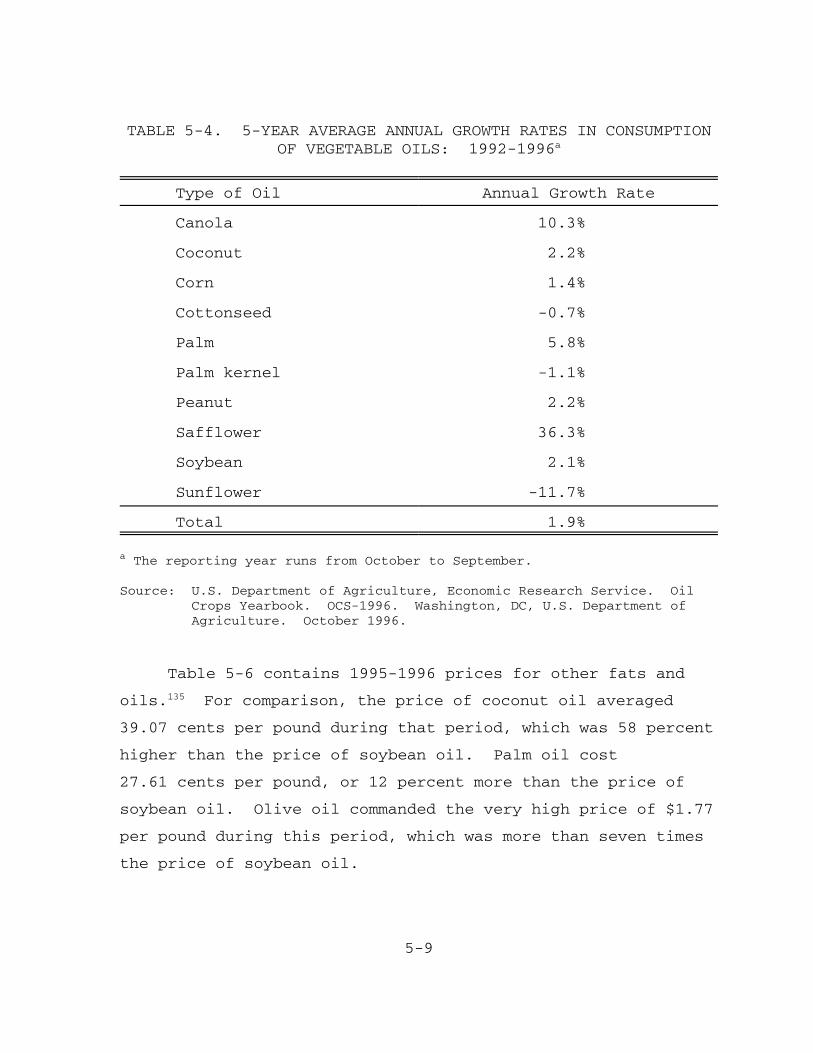
5-9
TABLE 5-4. 5-YEAR AVERAGE ANNUAL GROWTH RATES IN CONSUMPTIONOF VEGETABLE OILS: 1992-1996a
Type of Oil Annual Growth Rate
Canola 10.3%
Coconut 2.2%
Corn 1.4%
Cottonseed -0.7%
Palm 5.8%
Palm kernel -1.1%
Peanut 2.2%
Safflower 36.3%
Soybean 2.1%
Sunflower -11.7%
Total 1.9%
a The reporting year runs from October to September.
Source: U.S. Department of Agriculture, Economic Research Service. OilCrops Yearbook. OCS-1996. Washington, DC, U.S. Department ofAgriculture. October 1996.
Table 5-6 contains 1995-1996 prices for other fats and
oils.135 For comparison, the price of coconut oil averaged
39.07 cents per pound during that period, which was 58 percent
higher than the price of soybean oil. Palm oil cost
27.61 cents per pound, or 12 percent more than the price of
soybean oil. Olive oil commanded the very high price of $1.77
per pound during this period, which was more than seven times
the price of soybean oil.

5-10
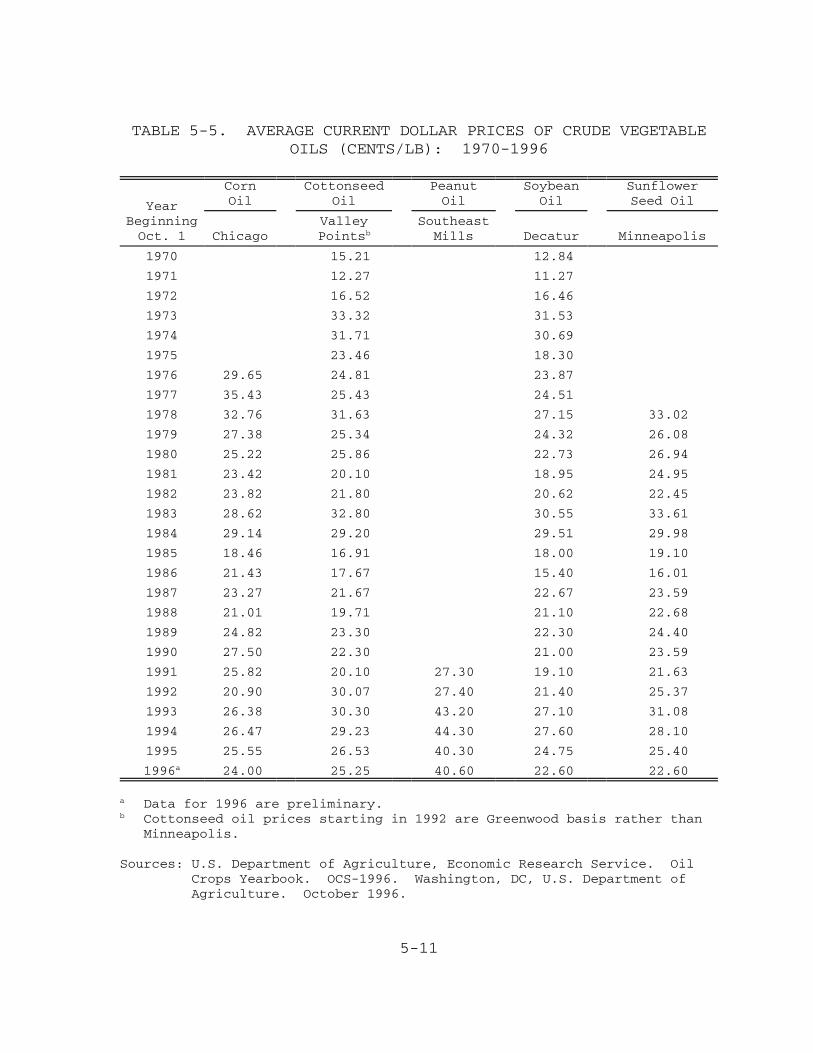
5-11
TABLE 5-5. AVERAGE CURRENT DOLLAR PRICES OF CRUDE VEGETABLEOILS (CENTS/LB): 1970-1996
YearBeginningOct. 1
CornOil
CottonseedOil
PeanutOil
SoybeanOil
SunflowerSeed Oil
ChicagoValleyPointsb
SoutheastMills Decatur Minneapolis
1970 15.21 12.84
1971 12.27 11.27
1972 16.52 16.46
1973 33.32 31.53
1974 31.71 30.69
1975 23.46 18.30
1976 29.65 24.81 23.87
1977 35.43 25.43 24.51
1978 32.76 31.63 27.15 33.02
1979 27.38 25.34 24.32 26.08
1980 25.22 25.86 22.73 26.94
1981 23.42 20.10 18.95 24.95
1982 23.82 21.80 20.62 22.45
1983 28.62 32.80 30.55 33.61
1984 29.14 29.20 29.51 29.98
1985 18.46 16.91 18.00 19.10
1986 21.43 17.67 15.40 16.01
1987 23.27 21.67 22.67 23.59
1988 21.01 19.71 21.10 22.68
1989 24.82 23.30 22.30 24.40
1990 27.50 22.30 21.00 23.59
1991 25.82 20.10 27.30 19.10 21.63
1992 20.90 30.07 27.40 21.40 25.37
1993 26.38 30.30 43.20 27.10 31.08
1994 26.47 29.23 44.30 27.60 28.10
1995 25.55 26.53 40.30 24.75 25.40
1996a 24.00 25.25 40.60 22.60 22.60
a Data for 1996 are preliminary.b Cottonseed oil prices starting in 1992 are Greenwood basis rather than
Minneapolis.
Sources: U.S. Department of Agriculture, Economic Research Service. OilCrops Yearbook. OCS-1996. Washington, DC, U.S. Department ofAgriculture. October 1996.

5-12
U.S. Department of Agriculture, Economic Research Service. OilCrops Outlook. OCS-0897. Washington, DC, U.S. Department ofAgriculture. August 13, 1997.
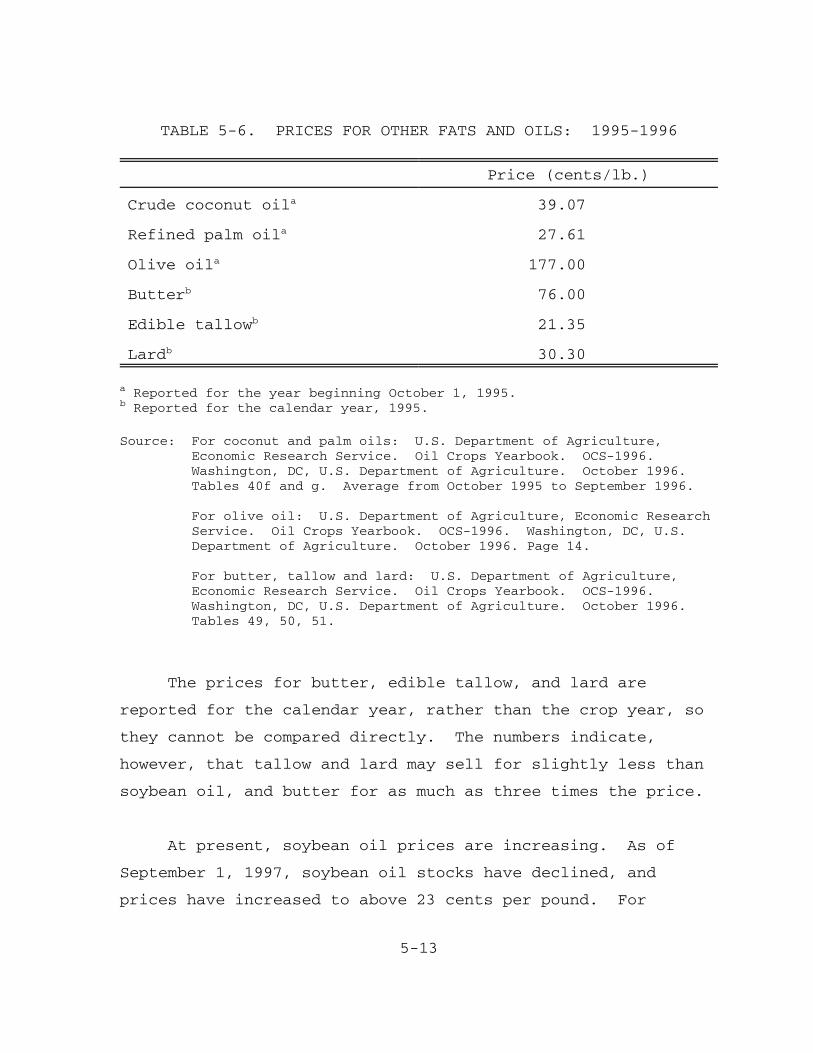
5-13
TABLE 5-6. PRICES FOR OTHER FATS AND OILS: 1995-1996
Price (cents/lb.)
Crude coconut oila 39.07
Refined palm oila 27.61
Olive oila 177.00
Butterb 76.00
Edible tallowb 21.35
Lardb 30.30
a Reported for the year beginning October 1, 1995.b Reported for the calendar year, 1995.
Source: For coconut and palm oils: U.S. Department of Agriculture,Economic Research Service. Oil Crops Yearbook. OCS-1996. Washington, DC, U.S. Department of Agriculture. October 1996. Tables 40f and g. Average from October 1995 to September 1996.
For olive oil: U.S. Department of Agriculture, Economic ResearchService. Oil Crops Yearbook. OCS-1996. Washington, DC, U.S.Department of Agriculture. October 1996. Page 14.
For butter, tallow and lard: U.S. Department of Agriculture,Economic Research Service. Oil Crops Yearbook. OCS-1996. Washington, DC, U.S. Department of Agriculture. October 1996. Tables 49, 50, 51.
The prices for butter, edible tallow, and lard are
reported for the calendar year, rather than the crop year, so
they cannot be compared directly. The numbers indicate,
however, that tallow and lard may sell for slightly less than
soybean oil, and butter for as much as three times the price.
At present, soybean oil prices are increasing. As of
September 1, 1997, soybean oil stocks have declined, and
prices have increased to above 23 cents per pound. For
5-14
1997-1998, soybean oil prices are expected to average between
23 cents and 26 cents per pound.136
5.1.4 Imports and Exports
Table 5-7 contains data on the quantities of major
vegetable oils imported to and exported from the United States
from 1985 through 1996.137 Trade volumes for each type of oil
are described in more detail below.
Canola Oil. Since 1985, when the Food and Drug
Administration first approved of canola oil as a food, the
United States has been a net importer of canola oil. Imports
of canola oil come almost entirely from Canada.138 The
quantity of canola oil imported into the United States
increased from 185 million pounds in 1986 to 1071 million
pounds in 1996. The United States also exports small
quantities of canola oil as well (132 million pounds in 1996).
Coconut Oil. The United States is a net importer of
coconut oil, since no coconut oil is produced domestically. A
total of 1,047 million pounds were imported in 1996, and small
quantities of coconut oil are re-exported. The Philippines is
the leading supplier of coconut oil to the United States,
followed by Indonesia.139,140,141
Corn Oil. The United States mostly exports corn oil, but
a small quantity is imported as well. The quantity of corn
oil exported has risen steadily since 1988, with 900 million

5-15
pounds being exported in 1996. The largest share of exported
corn oil goes to Asia, with Turkey being the largest single
importer of U.S. corn oil, followed by Western Europe and
Central America.142,143,144
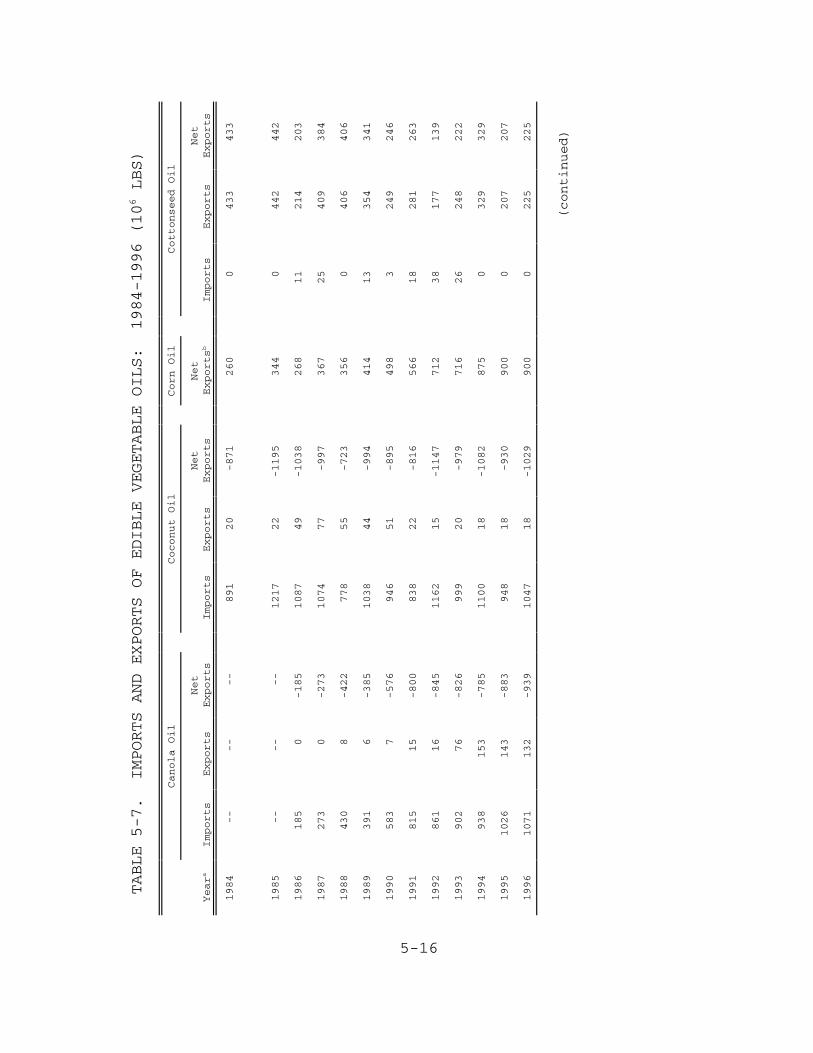
5-16
TABLE 5-7. IMPORTS AND EXPORTS OF EDIBLE VEGETABLE OILS: 1984-1996 (106 LBS)
Canola Oil
Coconut Oil
Corn Oil
Cottonseed Oil
Yeara
Imports
Exports
Net
Exports
Imports
Exports
Net
Exports
Net
Exportsb
Imports
Exports
Net
Exports
1984
--
--
--
891
20
-871
260
0433
433
1985
--
--
--
1217
22
-1195
344
0442
442
1986
185
0-185
1087
49
-1038
268
11
214
203
1987
273
0-273
1074
77
-997
367
25
409
384
1988
430
8-422
778
55
-723
356
0406
406
1989
391
6-385
1038
44
-994
414
13
354
341
1990
583
7-576
946
51
-895
498
3249
246
1991
815
15
-800
838
22
-816
566
18
281
263
1992
861
16
-845
1162
15
-1147
712
38
177
139
1993
902
76
-826
999
20
-979
716
26
248
222
1994
938
153
-785
1100
18
-1082
875
0329
329
1995
1026
143
-883
948
18
-930
900
0207
207
1996
1071
132
-939
1047
18
-1029
900
0225
225
(continued)
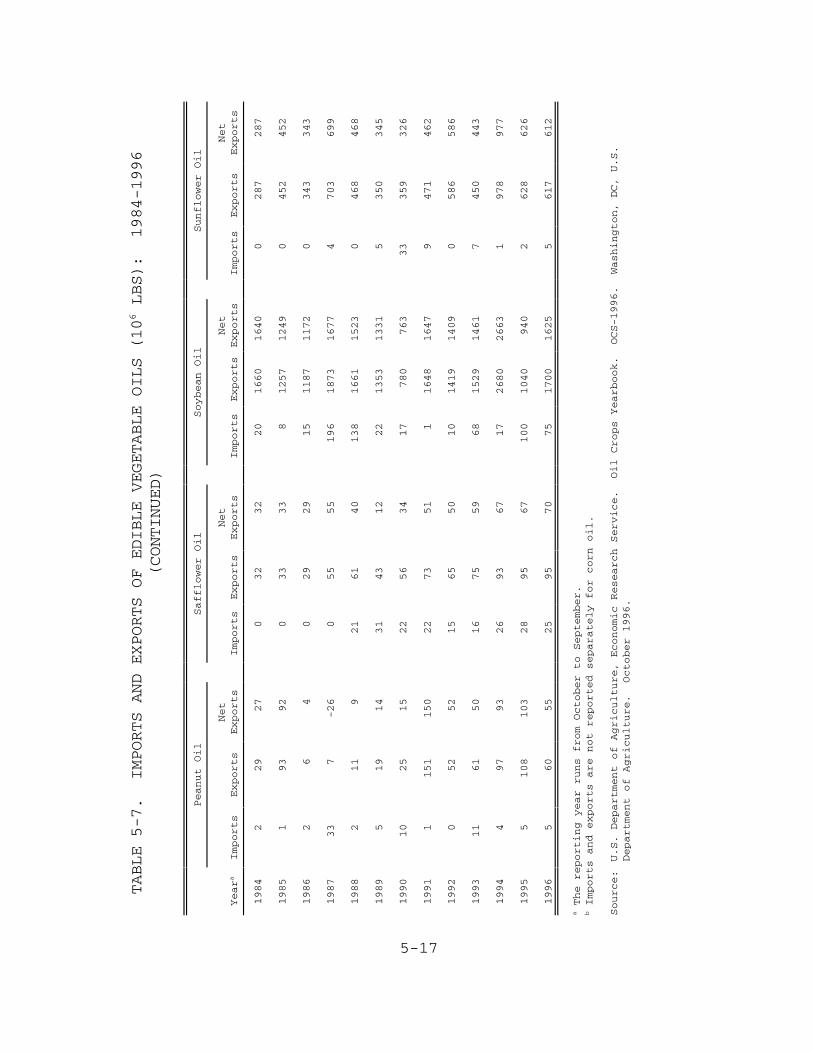
5-17
TABLE 5-7. IMPORTS AND EXPORTS OF EDIBLE VEGETABLE OILS (106 LBS): 1984-1996
(CONTINUED)
Peanut Oil
Safflower Oil
Soybean Oil
Sunflower Oil
Yeara
Imports
Exports
Net
Exports
Imports
Exports
Net
Exports
Imports
Exports
Net
Exports
Imports
Exports
Net
Exports
1984
229
27
032
32
20
1660
1640
0287
287
1985
193
92
033
33
81257
1249
0452
452
1986
26
40
29
29
15
1187
1172
0343
343
1987
33
7-26
055
55
196
1873
1677
4703
699
1988
211
921
61
40
138
1661
1523
0468
468
1989
519
14
31
43
12
22
1353
1331
5350
345
1990
10
25
15
22
56
34
17
780
763
33
359
326
1991
1151
150
22
73
51
11648
1647
9471
462
1992
052
52
15
65
50
10
1419
1409
0586
586
1993
11
61
50
16
75
59
68
1529
1461
7450
443
1994
497
93
26
93
67
17
2680
2663
1978
977
1995
5108
103
28
95
67
100
1040
940
2628
626
1996
560
55
25
95
70
75
1700
1625
5617
612
a The reporting year runs from October to September.
b Imports and exports are not reported separately for corn oil.
Source:
U.S. Department of Agriculture, Economic Research Service. Oil Crops Yearbook. OCS-1996. Washington, DC, U.S.
Department of Agriculture. October 1996.
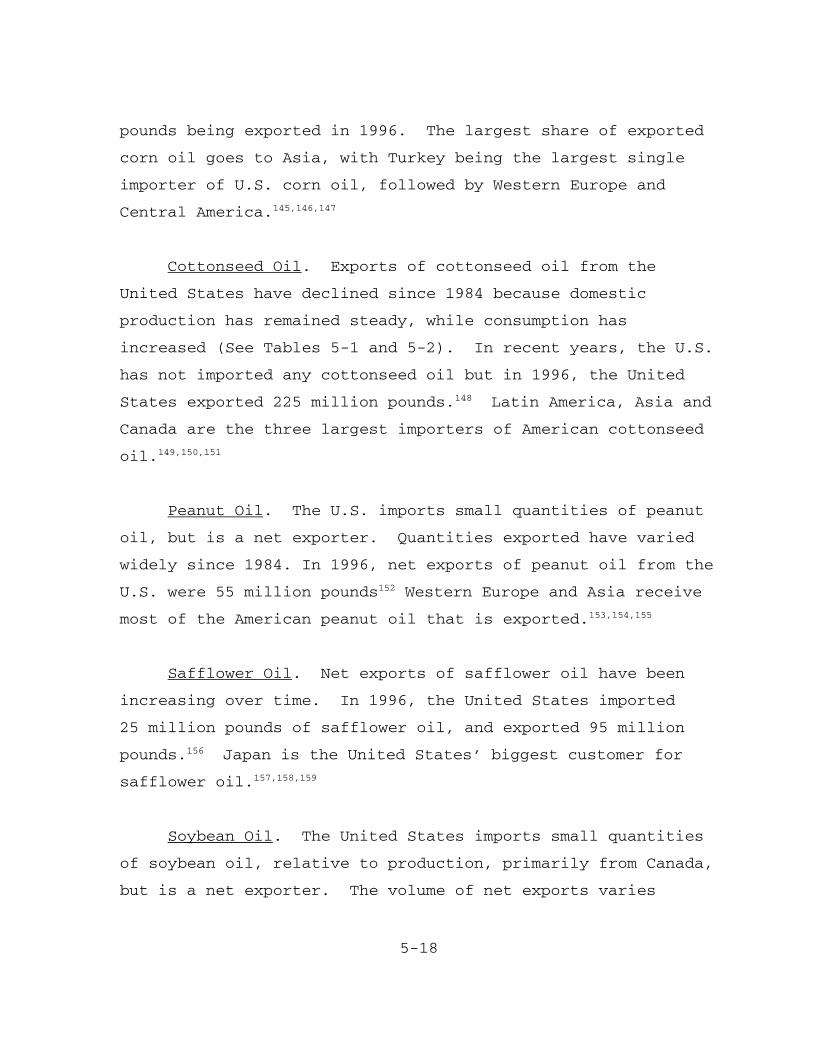
5-18
pounds being exported in 1996. The largest share of exported
corn oil goes to Asia, with Turkey being the largest single
importer of U.S. corn oil, followed by Western Europe and
Central America.145,146,147
Cottonseed Oil. Exports of cottonseed oil from the
United States have declined since 1984 because domestic
production has remained steady, while consumption has
increased (See Tables 5-1 and 5-2). In recent years, the U.S.
has not imported any cottonseed oil but in 1996, the United
States exported 225 million pounds.148 Latin America, Asia and
Canada are the three largest importers of American cottonseed
oil.149,150,151
Peanut Oil. The U.S. imports small quantities of peanut
oil, but is a net exporter. Quantities exported have varied
widely since 1984. In 1996, net exports of peanut oil from the
U.S. were 55 million pounds152 Western Europe and Asia receive
most of the American peanut oil that is exported.153,154,155
Safflower Oil. Net exports of safflower oil have been
increasing over time. In 1996, the United States imported
25 million pounds of safflower oil, and exported 95 million
pounds.156 Japan is the United States’ biggest customer for
safflower oil.157,158,159
Soybean Oil. The United States imports small quantities
of soybean oil, relative to production, primarily from Canada,
but is a net exporter. The volume of net exports varies
5-19
considerably from year to year. Since 1984, the largest
volume of exports occurred in 1994, when exports exceeded
imports by 2,663 pounds. However, net exports fell to
1,625 million pounds in 1996.160 China is the largest single
importer of American soybean oil.161,162,163
Sunflower Oil. In 1996, net exports of sunflower oil
from the United States were 612 million pounds.164 Latin
America and Africa are the two largest consumers of exported
American sunflower oil.165,166,167
Palm Oils. Malaysia and Indonesia produce most of the
palm and palm kernel oil imported to the United States. In
1996, the United States imported about 603 million pounds of
palm oils.168,169,170
Olive Oil. Olive oil is imported to the United States
mainly from Italy and Spain. In 1996, the quantity imported
was about 248 million pound.171,172,173
Dollar Values of Exports and Imports. Table 5-8 presents
the current dollar values of vegetable oils imported to and
exported from the U.S., to and from all other countries, in
1995 and 1996.174 In 1995, the value of vegetable oil exported
from the U.S. was over $1.8 billion. The value of exports
exceeded the value of imports during that year by about
26 percent. In 1996, however, the reverse was true. The
dollar value of imports (about $1.7 billion) was about 21
percent greater than the value of exports.175,176,177

5-20
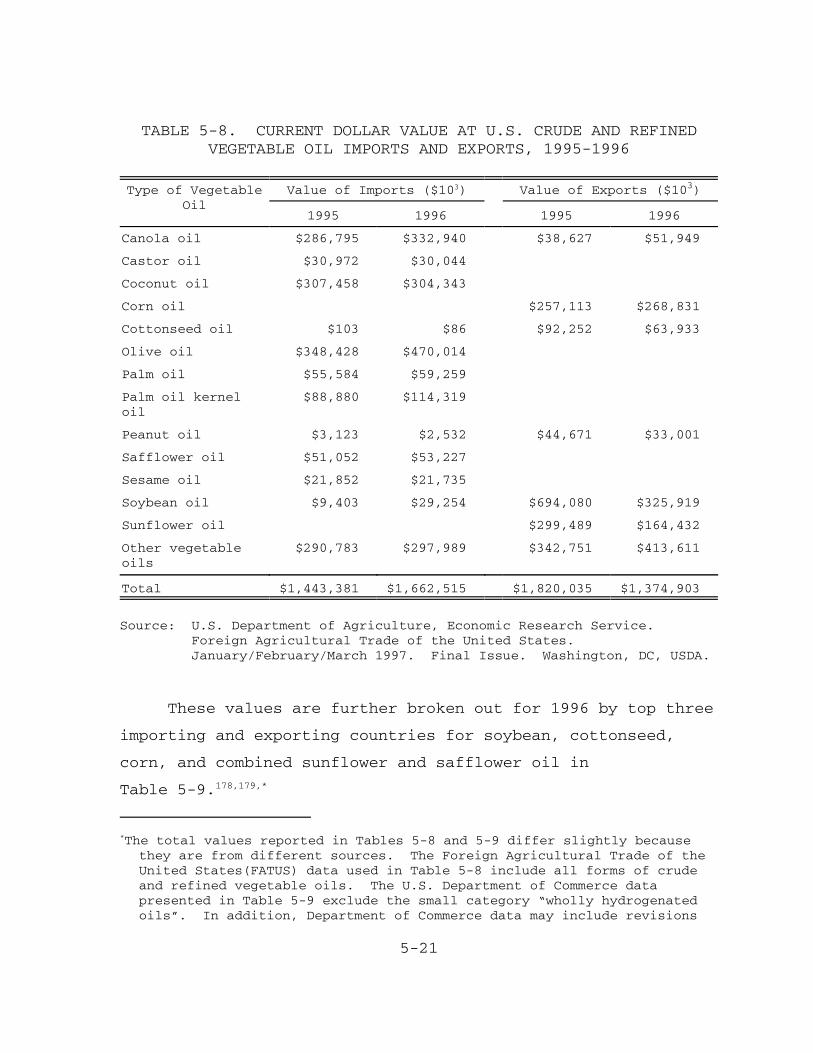
*The total values reported in Tables 5-8 and 5-9 differ slightly becausethey are from different sources. The Foreign Agricultural Trade of theUnited States(FATUS) data used in Table 5-8 include all forms of crudeand refined vegetable oils. The U.S. Department of Commerce datapresented in Table 5-9 exclude the small category “wholly hydrogenatedoils”. In addition, Department of Commerce data may include revisions
5-21
TABLE 5-8. CURRENT DOLLAR VALUE AT U.S. CRUDE AND REFINEDVEGETABLE OIL IMPORTS AND EXPORTS, 1995-1996
Type of VegetableOil
Value of Imports ($103) Value of Exports ($103)
1995 1996 1995 1996
Canola oil $286,795 $332,940 $38,627 $51,949
Castor oil $30,972 $30,044
Coconut oil $307,458 $304,343
Corn oil $257,113 $268,831
Cottonseed oil $103 $86 $92,252 $63,933
Olive oil $348,428 $470,014
Palm oil $55,584 $59,259
Palm oil kerneloil
$88,880 $114,319
Peanut oil $3,123 $2,532 $44,671 $33,001
Safflower oil $51,052 $53,227
Sesame oil $21,852 $21,735
Soybean oil $9,403 $29,254 $694,080 $325,919
Sunflower oil $299,489 $164,432
Other vegetableoils
$290,783 $297,989 $342,751 $413,611
Total $1,443,381 $1,662,515 $1,820,035 $1,374,903
Source: U.S. Department of Agriculture, Economic Research Service. Foreign Agricultural Trade of the United States. January/February/March 1997. Final Issue. Washington, DC, USDA.
These values are further broken out for 1996 by top three
importing and exporting countries for soybean, cottonseed,
corn, and combined sunflower and safflower oil in
Table 5-9.178,179,*
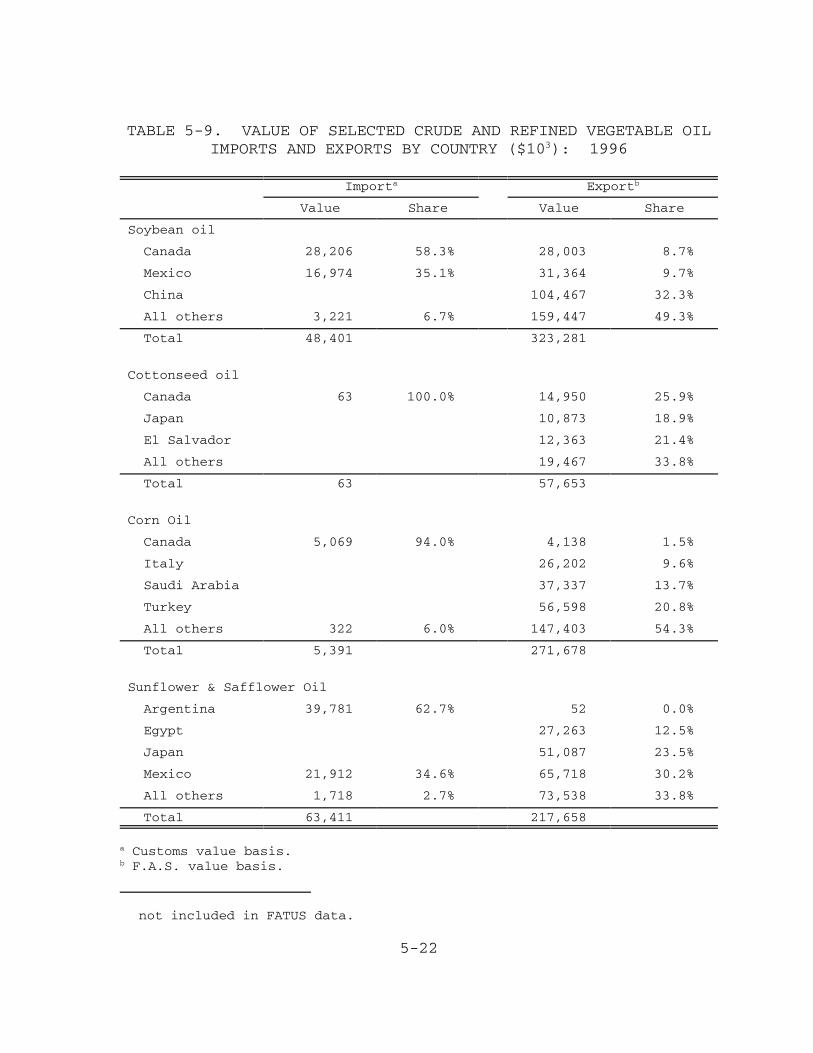
not included in FATUS data.
5-22
TABLE 5-9. VALUE OF SELECTED CRUDE AND REFINED VEGETABLE OILIMPORTS AND EXPORTS BY COUNTRY ($103): 1996
Importa Exportb
Value Share Value Share
Soybean oil
Canada 28,206 58.3% 28,003 8.7%
Mexico 16,974 35.1% 31,364 9.7%
China 104,467 32.3%
All others 3,221 6.7% 159,447 49.3%
Total 48,401 323,281
Cottonseed oil
Canada 63 100.0% 14,950 25.9%
Japan 10,873 18.9%
El Salvador 12,363 21.4%
All others 19,467 33.8%
Total 63 57,653
Corn Oil
Canada 5,069 94.0% 4,138 1.5%
Italy 26,202 9.6%
Saudi Arabia 37,337 13.7%
Turkey 56,598 20.8%
All others 322 6.0% 147,403 54.3%
Total 5,391 271,678
Sunflower & Safflower Oil
Argentina 39,781 62.7% 52 0.0%
Egypt 27,263 12.5%
Japan 51,087 23.5%
Mexico 21,912 34.6% 65,718 30.2%
All others 1,718 2.7% 73,538 33.8%
Total 63,411 217,658
a Customs value basis.b F.A.S. value basis.

5-23
Source: U.S. Department of Commerce, Bureau of the Census. U.S. Exportsand Imports by Harmonized Commodity, 1996 Annual. FT947/96A. Washington, DC, Government Printing Office. July 1997.
5-24
5.2 TRENDS AND PROJECTIONS
This section presents information on futures prices for
vegetable oils, and how recent trends in consumption and
production may be useful in predicting future supply and
demand for vegetable oil.
5.2.1 Futures Prices
Soybean oil and some oilseeds are traded on the futures
market. In the futures market, “futures contracts” are bought
and sold. A futures contract is an agreement to deliver a
specified quantity of a commodity on a specific date in the
future and trading usually begins about a year before the
delivery date for the commodity. Futures prices reflect
trader’s expectations about where prices will be at the time
of delivery.180 The futures prices reported in the Wall Street
Journal on November 3, 1997, indicate that prices for soybean
oil and oilseeds should remain strong through the upcoming
year. Futures prices for soybean oil through December 1998,
range between 25.5 and 26.2 cents per pound. Canola oilseed
futures prices increase through July 1998, and corn grain
prices are expected to increase through 1999.
5.2.2 Trends in Consumption
One analyst predicts that the domestic market for
vegetable oils will decline by 4.4 percent between 1995 and
the year 2000, because of increased consumer awareness about
5-25
the dangers of a high-fat diet.181 The data do not support
this prediction, however. Despite growing knowledge about the
importance of a low-fat diet, total consumption of vegetable
oils in the United States continues to increase.
As was previously mentioned, Table 5-4 shows that the
average annual rate of growth in consumption was 1.9 percent
from 1992 through 1996. For certain types of vegetable oils,
consumption increased at much greater rates. Consumption of
canola and safflower oils have increased at the rates of
10.3 percent and 36.3 percent respectively. Some of the
growth in total consumption can be explained by population
growth. Table 3-2 shows that per-capita consumption declined
slightly in 1994 and 1995, after decades of increases, but it
is too soon to determine whether this may have been an
adjustment after a year of unusually high consumption in 1993,
or an indication of a downward trend.
In addition to an upward trend in domestic consumption,
foreign demand for vegetable oil is expected to grow. For the
1997/98 crop year, exports of soybean oil are expected to
increase to 2,400 million pounds (a 41 percent increase from
last year), largely because of increasing demand from China.182
Even if domestic per-capita consumption of vegetable oils
for edible uses remains flat or declines slightly, demand for
vegetable oils should remain strong for three reasons: 1) The
U.S. population is expected to continue growing;183 2) Foreign
demand is increasing;184 3) Demand for vegetable oil for
5-26
inedible uses such as vegetable-oil based inks, and biodiesel
will continue to grow (see Section 3.2).
5.2.3 Trends in Production
As Table 5-2 shows, all of the major vegetable oils
except for peanut oil, experienced positive rates of growth in
production between 1992 and 1996. The overall average rate of
growth was 1.6 percent. The annual average rates for
safflower and canola in particular were 10.6 percent and
152.1 percent respectively. There is no evidence that these
trends will not continue. For the 1996-1997 crop year
(October-September), production of soybean oil is estimated to
be 15.7 billion pounds, an increase of about 2 percent over
the 1995-1996 year.185
Expected prices for various crops influence a farmer’s
planting decisions from year to year. Future levels of
production of any agricultural commodity in a particular year
can be difficult to predict, because of fluctuations in
growing conditions. Based on recent trends, however, it would
be reasonable to expect slow, steady growth in the production
of major vegetable oils (primarily soybean oil), and rapid
growth in the production of the minor specialty oils, canola
and safflower.
R-1
1. Telecon. Zukor, Chuck, Alpha-Gamma Technologies, withMary Muth, Research Triangle Institute. February 11,1998.
2. U.S. Department of Commerce, Bureau of the Census. 1992Census of Manufactures, Industry Series—Fats and Oils. MC92-1-20D. Washington, DC, Government Printing Office. 1995.
3. U.S. Department of Commerce, Bureau of the Census. 1992Census of Manufactures, Industry Series—Grain MillProducts. MC92-1-20D. Washington, DC, GovernmentPrinting Office. 1995.
4. U.S. Department of Commerce. Bureau of the Census. 1995Annual Survey of Manufactures, Statistics for IndustryGroups and Industries. M95(AS)-1. Washington, DC,Government Printing Office. 1997.
5. Midwest Research Institute. Emission FactorDocumentation for AP-42, Section 9.11.1. Vegetable OilProcessing. Prepared for the U.S. EnvironmentalProtection Agency, Office of Air Quality Planning andStandards, Emission Factor and Inventory Group. Cary,NC, Midwest Research Institute. November 1995.
6. Kirk-Othmer Encyclopedia of Chemical Technology 3rd Edition. Volume 23. New York, John Wiley & Sons. 1989. p. 717.
7. Ref. 6, p. 723.
8. Moore, N.M. Journal of American Oil Chemical Society60:190. 1983.
9. Ref. 5, p. 2-4.
REFERENCES
R-2
10. Ref. 5, p. 2-4.
11. Erickson, David R., ed. Practical Handbook of SoybeanProcessing and Utilization. Champaign, IL, AOCS Pressand St. Louis, MO, United Soybean Board. 1995. p. 69.
12. Ref. 11.
13. Ref. 11.
14. Ref. 11, p. 75.
15. Ref. 5, p. 2-4.
16. Ref. 11.
17. Ref. 11, p. 75.
18. Ref. 11, p. 75.
19. Ref. 11, p. 76.
20. Ref. 5.
21. Ref. 11, p. 78.
22. Ref. 11, p. 78.
23. Ref. 11, p. 82.
24. Ref. 11, p. 86.
25. Ref. 5.
26. Ref. 11, p. 103.
27. Ref. 11, p. 109.
28. Ref. 11, p. 108.
29. Ref. 11, p. 103.
30. Ref. 5, p. 2-7.
31. Ref. 11, p. 176.
R-3
32. Ref. 11, p. 187.
33. Ref. 11, p. 201.
34. Ref. 11, p. 203.
35. Ref. 11, p. 239.
36. Ref. 11, p. 6.
37. Ref. 5, p. 2-12.
38. Marra, Michele C. The 1995 Farm Bill: Highlights andGeneral Provisions. NC State Economist. Raleigh, NC,North Carolina Cooperative Extension Service. May/June1996.
39. Ref. 11, p. 85.
40. U.S. Department of Agriculture, Economic ResearchService. Oil Crops Yearbook. OCS-1996. Washington, DC,U.S. Department of Agriculture. October 1996.
41. Ref. 40.
42. Ref. 11, p. 6.
43. Ref. 11, p. 6.
44. Ref. 11, p. 26.
45. Ref. 11, p. 4.
46. Ref. 11, p. 182.
47. Ref. 11, p. 179.
48. Ref. 11.
49. Ref. 11, p. 310.
50. Ref. 11, p. 312.
51. Ref. 2.
52. Ref. 3.
R-4
53. Ref. 11, p. 519.
54. Ref. 2.
55. Ref. 3.
56. Ref. 2.
57. Ref. 2.
58. Ref. 3.
59. U.S. Department of Commerce. Bureau of the Census. 1994Annual Survey of Manufactures, Statistics for IndustryGroups and Industries. M94(AS)-1. Washington, DC,Government Printing Office. 1996.
60. Ref. 4.
61. U.S. Department of Labor, Bureau of Labor Statistics. BLS LABSTAT database. <http://www.bls.gov>.
62. Ref. 1.
63. Ref. 11, p. 520.
64. Ref. 11.
65. Ref. 11, p. 519.
66. Ref. 11.
67. La Bell, Fran. Cottonseed Oil For Frying and Baking. 166(2):75-76. 1997.
68. Mag, T.K. Food Industry Requirements for Fats and oils:Functional Properties. Developing and Processing ofVegetable Oils in Human Nutrition, Roman Przybylski andBruce E. McDonald (eds.) Champaign, IL, AOCS Press. 1995. p. 36-46.
69. Ref. 68.
70. Ref. 68.
71. Ref. 67.
R-5
72. Ref. 11.
73. Ref. 40.
74. Ref. 40.
75. Doctors’ Guide to Medical and Other News. ExpertsQuestion Population-Wide Limits on Egg Consumption. <www.pslgroup.com/dg/2ce0e.htm>. Obtained October 10,1997.
76. Bertolli Home Page. <http://homearts.com/sites/bertolli/BEHLTH03.HTM>. September 29, 1997.
77. Stuff on Fat. <http://www.voicenet.com/~tjohn/fatstuff.html.> Obtained September 30, 1997.
78. Lordkipanidze, Nazibrola, James E. Epperson, Glenn C.W.Ames. “An Economic Analysis of Import Demand for CanolaOil in the United States.” Working Paper, Dept. Of Agand Applied Econ. College of Ag and EnvironmentalScience, Univ. Of Georgia. February 1996.
79. Ref. 40.
80. Beare-Rogers, Joyce. Food Fats and Fatty Acids in HumanNutrition. Development and Processing of Vegetable Oilsin Human Nutrition. Roman Przybylski and Bruce E.McDonald (eds.). Champaign, IL, AOCS Press. 1995. p. 1-7.
81. Ref. 40.
82. U.S. Department of Commerce, Bureau of the Census. 1996Current Industrial Reports—Fats and Oilseed Crushings,Production, Consumption, and Stocks (M20K). Washington,DC, Government Printing Office. 1997.
83. Business Intelligence Online. U.S. Cooking Oils andFats. Compiled by Euromonitor. Profound Inc. October 5, 1995.
84. Ref. 11.
85. Ref. 11.
R-6
86. Humer, Carolyn. Soyink’s “Green” Reputation HelpsEstablish Growing Role. Chemical Marketing ReporterMay 18, 1992. 241(20):10-12.
87. Ref. 11.
88. Ref. 11.
89. Talking Points on Soybean Oil-Based Biodiesel Fuel. <http://www.ag.uiuc.edu/~il-qssb/talking.html>.
90. Ref. 11.
91. Ref. 11.
92. Ref. 11.
93. Ref. 11.
94. Ref. 11.
95. Ref. 82.
96. U.S. Department of Commerce, Bureau of the Census. Current Industrial Reports—Fats and Oils, Production,Consumption, and Stocks. Washington, DC, U.S. Departmentof Commerce. August 1997.
97. Chern, Wen S., Edna T. Loehman, and Steven T. Yen. Information, Health Risk Beliefs, and the Demand for Fatsand Oils. The Review of Economics and Statistics77(3):555-64. 1995.
98. Blackburn, G.L. Putting Tropical Oils in Their Place. How to Set Your Priorities for a Heart-Healthy Diet. Prevention 41(8):30,32. 1989. <www.thriveonline.com>.
99. Ref. 11.
100. Ref. 40.
101. Ref. 40.
102. Ref. 40.
R-7
103. Letter from Ailor, David C., National Oilseed ProcessorsAssociation, to Durham, James, U.S. EnvironmentalProtection Agency, Office of Air Quality Planning andStandards. January 23, 1996.
104. U.S. Department of Commerce. Concentration Ratios inManufacturing. Washington, DC, Government PrintingOffice. 1992.
105. Ref. 2.
106. Ref. 3.
107. U.S. Department of Justice and the Federal TradeCommission, 1992.
108. Memorandum, from Zukor, Chuck, Alpha-Gamma Technologies,Inc., to vegetable oil NESHAP project files. January 20,1998. List of facilities to consider in EPA’s industryprofile and economic analyses for the vegetable oilproduction NESHAP.
109. American Business Information, Inc. (ABI). The AmericanBusiness Disk [computer file]. Omaha, NE, AmericanBusiness Information. 1997.
110. Ref. 109.
111. Ref. 108.
112. Ref. 109.
113. Ref. 108.
114. Market Briefs: Archer Daniels Midland. ChemicalMarketing Reporter 251(13):8. 1997.
115. Ref. 114.
116. Ag Processing to Build New Nebraska Soybean Plant. Feedstuffs 69(31):33. 1997.
117. Central Soya to Open New Plant; Announces FurtherExpansion. Milling and Baking News 75(29):10. 1996.
R-8
118. Information Access Corporation. Business Index [computerfile]. Foster City, CA: Information Access Corporation. 1997.
119. Dun & Bradstreet. D & B Million Dollar Directory: America’s Leading Public & Private Companies. Bethlehem,PA, Dun & Bradstreet Corporation. 1997.
120. 1997 Directory of Corporate Affiliations. Vol. 5: International Public and Private Companies. NewProvidence, RI, National Register Publishing. 1997.
121. Standard and Poor’s Corporation. [CD-ROM]. Palo Alto,CA: Dialog Information Services. 1997.
122. Ref. 109.
123. ConAgra, Inc. 10-K Report. Filed August 22, 1997. Omaha, NE, ConAgra.
124. Ref. 118.
125. Ref. 121.
126. Ref. 109.
127. Ref. 40.
128. Ref. 40.
129. Ref. 40.
130. Ref. 40.
131. Ref. 78.
132. Ref. 40.
133. Ref. 40.
134. U.S. Department of Agriculture, Economic ResearchService. Oil Crops Outlook. OCS-0897. Washington, DC,U.S. Department of Agriculture. August 13, 1997.
135. Ref. 40.
R-9
136. U.S. Department of Agriculture, Economic ResearchService, Oil Crops Outlook, October 1997, OCS-1097,Washington, DC.
137. Ref. 40.
138. Ref. 78.
139. Ref. 136.
140. Sanford, Scott. U.S. Department of Agriculture, EconomicResearch Service. Washington, DC. Telecon with JeanDomanico, Research Triangle Institute. February 18,1998. Import and export data for vegetable oil.
141. U.S. Department of Agriculture, Economic ResearchService, Foreign Agricultural Trade of the United States. January/February/March 1997. Final issue.
142. Ref. 136.
143. Ref. 140
144. Ref. 141
145. Ref. 136.
146. Ref. 140
147. Ref. 141
148. Ref. 40.
149. Ref. 136.
150. Ref. 140.
151. Ref. 141.
152. Ref. 40.
153. Ref. 136.
154. Ref. 140.
155. Ref. 141.
R-10
156. Ref. 40.
157. Ref. 136.
158. Ref. 140.
159. Ref. 141.
160. Ref. 40.
161. Ref. 136.
162. Ref. 140.
163. Ref. 141.
164. Ref. 40.
165. Ref. 136.
166. Ref. 140.
167. Ref. 141.
168. Ref. 136.
169. Ref. 140.
170. Ref. 141.
171. Ref. 136.
172. Ref. 140.
173. Ref. 141.
174. Ref. 141.
175. Ref. 136.
176. Ref. 140.
177. Ref. 141.
178. U.S. Department of Commerce, Bureau of the Census. U.S.Exports and Imports by Harmonized Commodity, 1996 Annual.
R-11
FT947/96A. Washington, DC, Government Printing Office. July 1997.
179. Ref. 140.
180. Cramer, Gail L. and Clarence W. Jensen. AgriculturalEconomics and Agribusiness. NY, John Wiley & Sons. 1994.
181. Ref. 83.
182. Ref. 136.
183. U.S. Bureau of the Census. Current Population Reports,Series P25-1130, “Population Projections for the UnitedStates by Age, Sex, race and Hispanic Origin: 1995 to2050.” March 1996.
184. Ref. 136.
185. Ref. 136.