Embed Size (px)
Citation preview
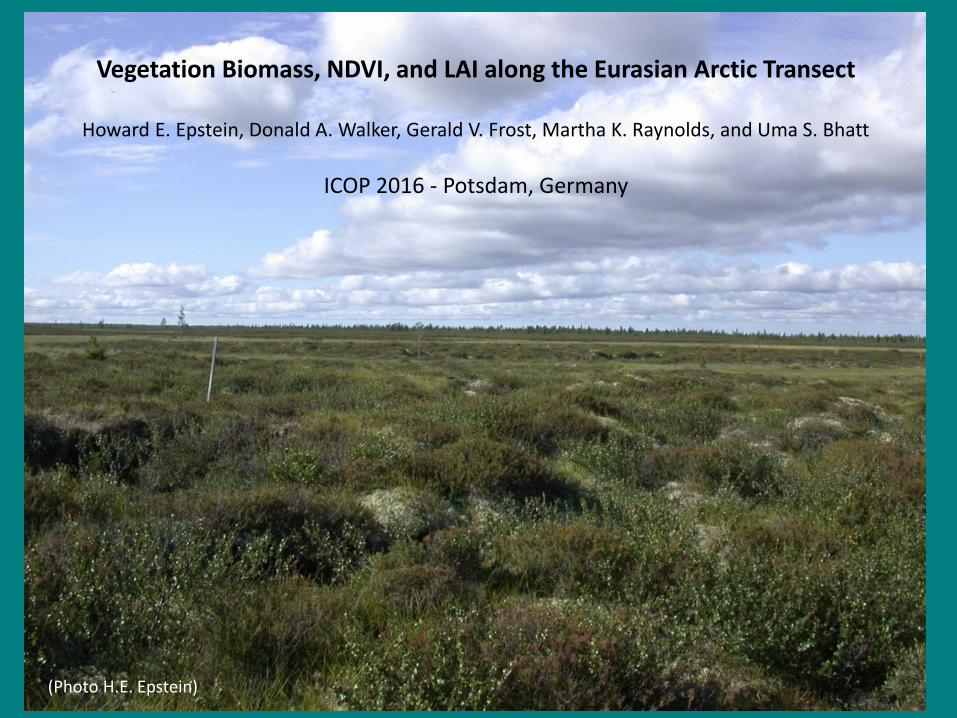
Vegetation Biomass, NDVI, and LAI along the Eurasian Arctic Transect
Howard E. Epstein, Donald A. Walker, Gerald V. Frost, Martha K. Raynolds, and Uma S. Bhatt
ICOP 2016 - Potsdam, Germany
(Photo H.E. Epstein)
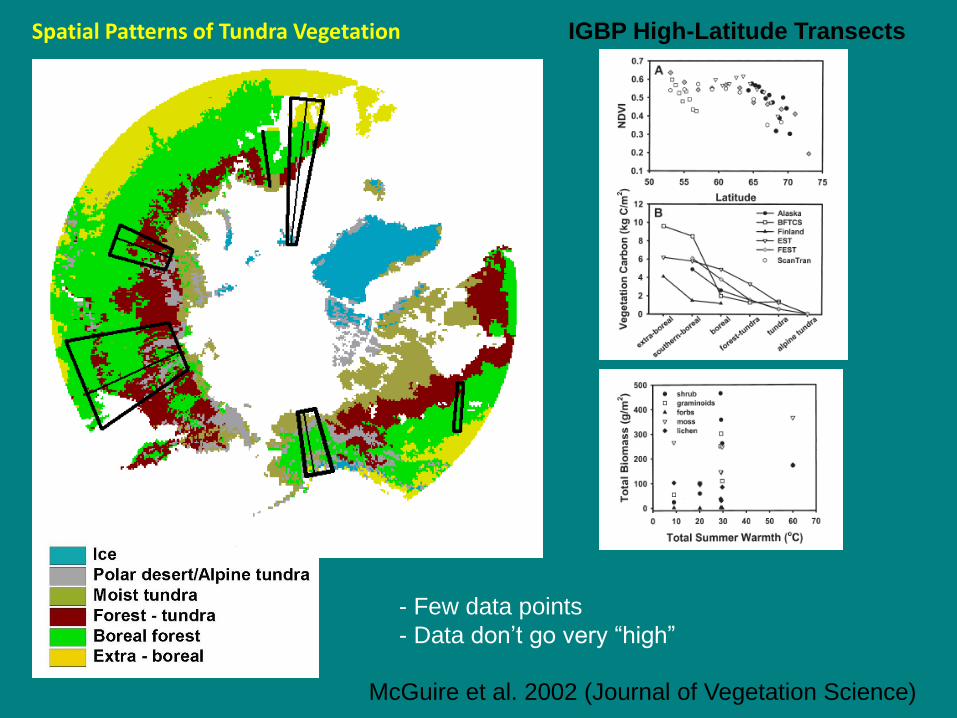
IGBP High-Latitude Transects
McGuire et al. 2002 (Journal of Vegetation Science)
- Few data points
- Data don’t go very “high”
Spatial Patterns of Tundra Vegetation
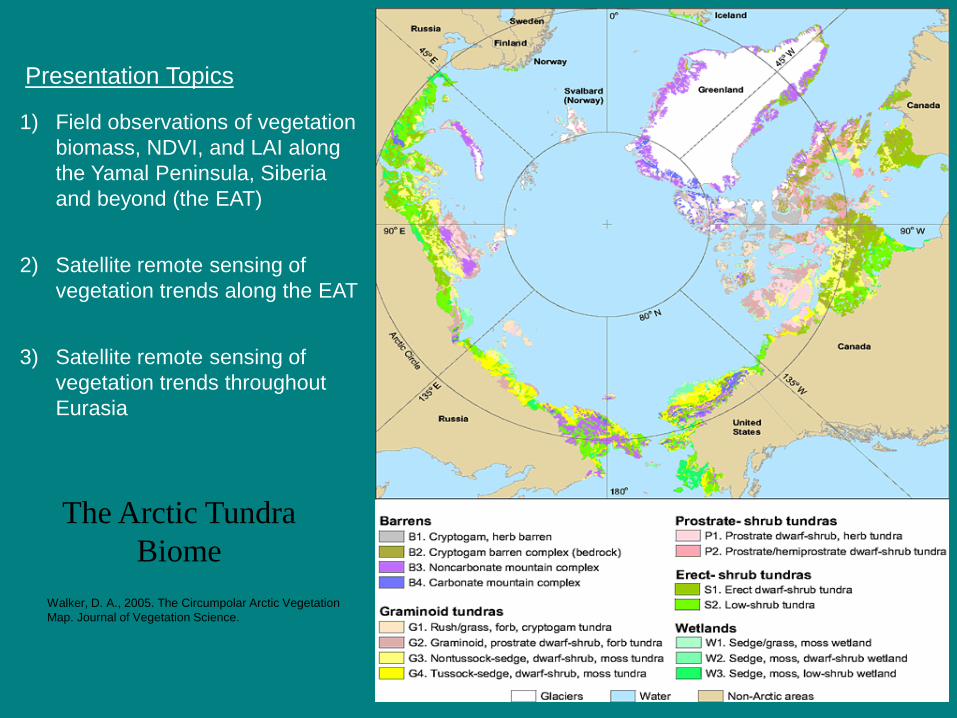
The Arctic Tundra
Biome
Walker, D. A., 2005. The Circumpolar Arctic Vegetation
Map. Journal of Vegetation Science.
1) Field observations of vegetation
biomass, NDVI, and LAI along
the Yamal Peninsula, Siberia
and beyond (the EAT)
2) Satellite remote sensing of
vegetation trends along the EAT
3) Satellite remote sensing of
vegetation trends throughout
Eurasia
Presentation Topics
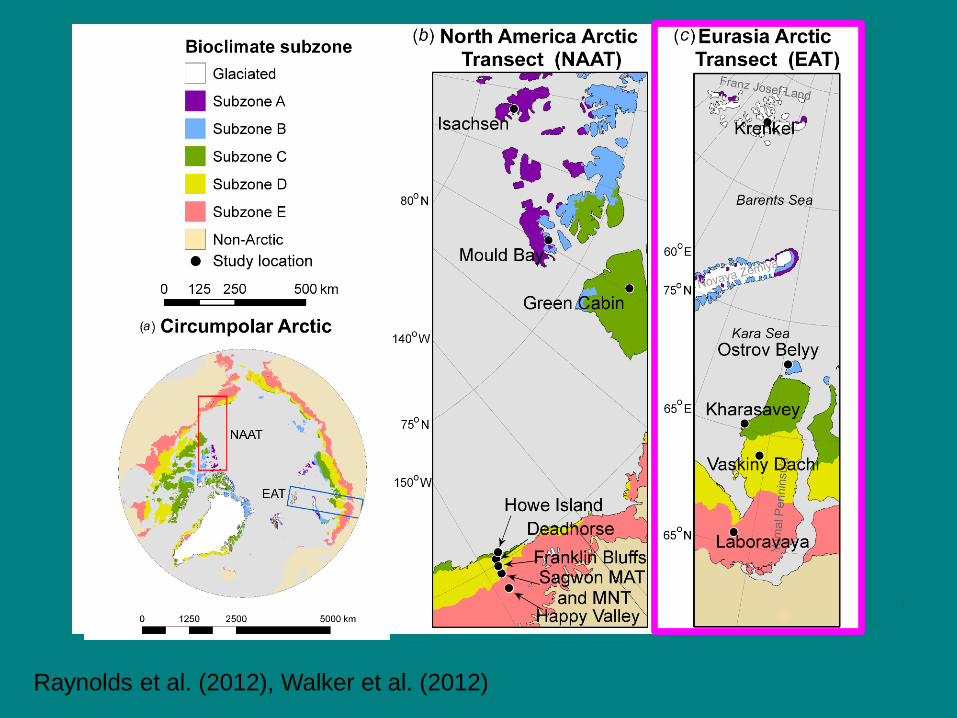
Raynolds et al. (2012), Walker et al. (2012)
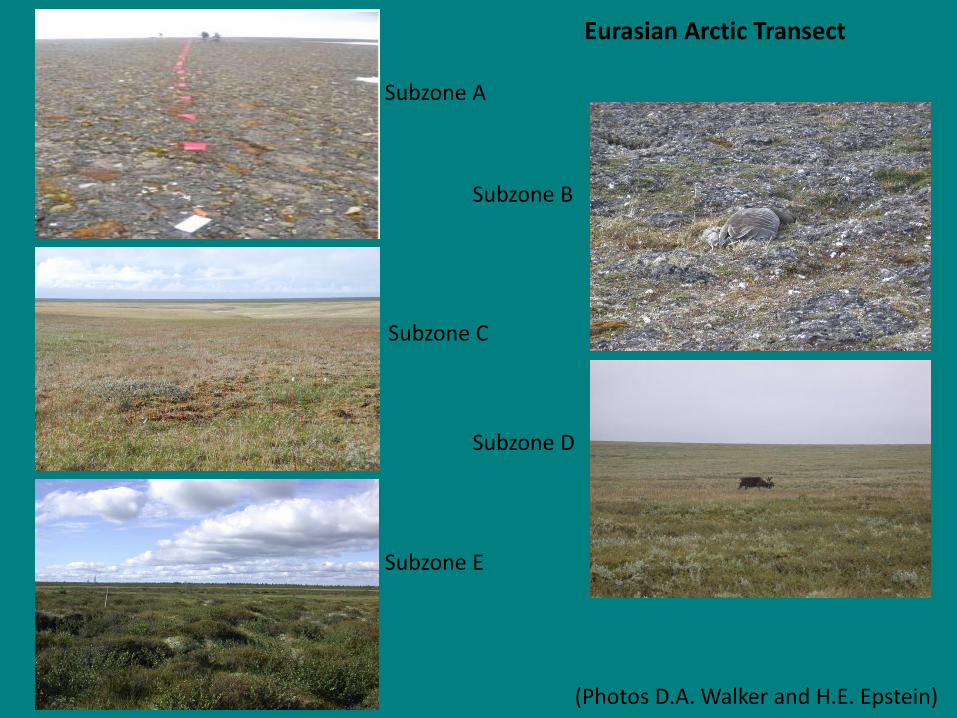
Eurasian Arctic Transect
Subzone E
Subzone D
Subzone C
Subzone B
Subzone A
(Photos D.A. Walker and H.E. Epstein)

Eurasian Arctic Transect Location Data
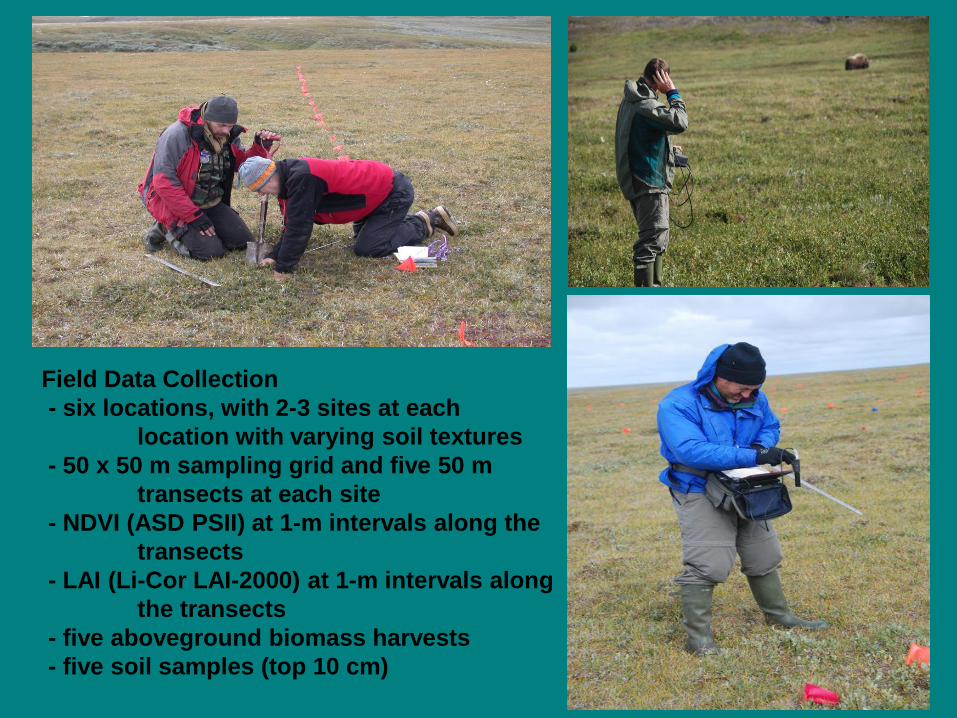
Field Data Collection
- six locations, with 2-3 sites at each
location with varying soil textures
- 50 x 50 m sampling grid and five 50 m
transects at each site
- NDVI (ASD PSII) at 1-m intervals along the
transects
- LAI (Li-Cor LAI-2000) at 1-m intervals along
the transects
- five aboveground biomass harvests
- five soil samples (top 10 cm)
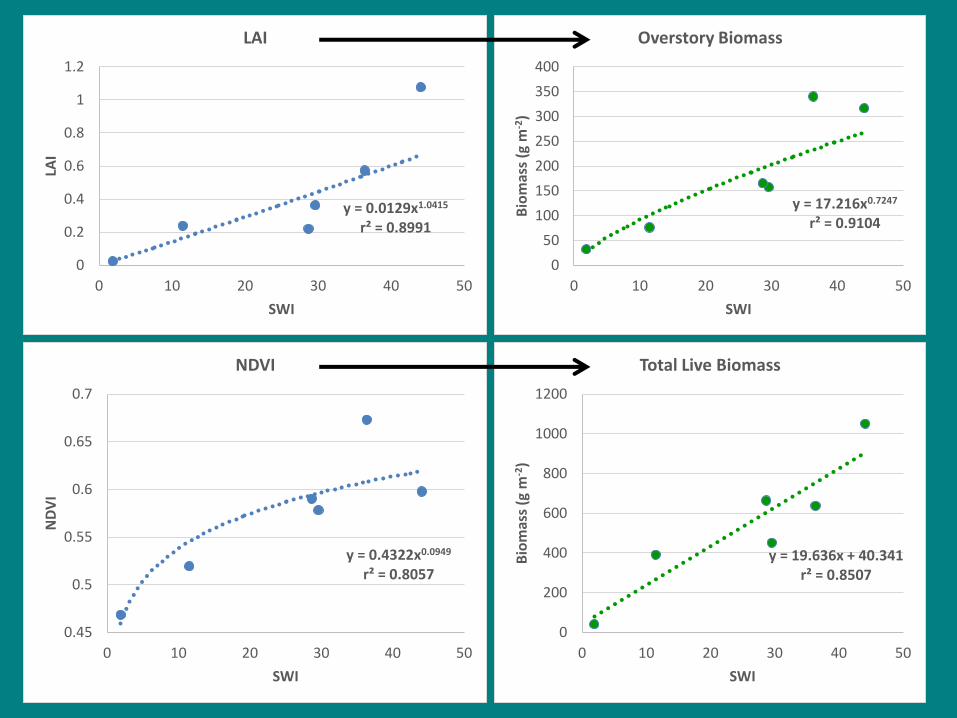
y = 0.0129x1.0415 r² = 0.8991
0
0.2
0.4
0.6
0.8
1
1.2
0 10 20 30 40 50
LAI
SWI
LAI
y = 0.4322x0.0949 r² = 0.8057
0.45
0.5
0.55
0.6
0.65
0.7
0 10 20 30 40 50
ND
VI
SWI
NDVI
y = 17.216x0.7247 r² = 0.9104
0
50
100
150
200
250
300
350
400
0 10 20 30 40 50
Bio
mas
s (g
m-2
)
SWI
Overstory Biomass
y = 19.636x + 40.341 r² = 0.8507
0
200
400
600
800
1000
1200
0 10 20 30 40 50
Bio
mas
s (g
m-2
)
SWI
Total Live Biomass
0
200
400
600
800
1000
1200N
adym
-1
Nad
ym-2
a
Nad
ym-2
b
Lab
oro
vaya
-1
Lab
oro
vaya
-2
Vas
kin
y-…
Vas
kin
y-…
Vas
kin
y-…
Kh
aras
ave
y-1
Kh
aras
ave
y-2
a
Kh
aras
ave
y-…
Ost
rov-
…
Ost
rov-
Be
lyy-
2
Kre
nke
l-1
Kre
nke
l-2
Bio
mas
s g
/m²
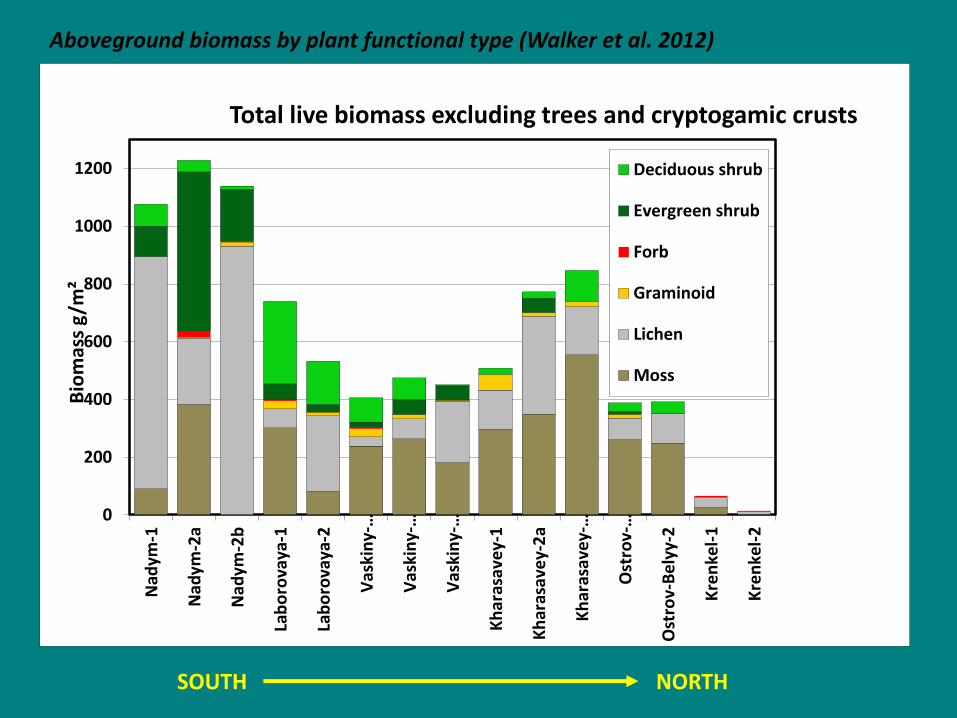
Total live biomass excluding trees and cryptogamic crusts
Deciduous shrub
Evergreen shrub
Forb
Graminoid
Lichen
Moss
Aboveground biomass by plant functional type (Walker et al. 2012)
SOUTH NORTH
0.0
5.0
10.0
15.0
20.0
25.0
30.0
35.0
40.0
45.0
50.0S
WI
(◦C
mo
nth
s)
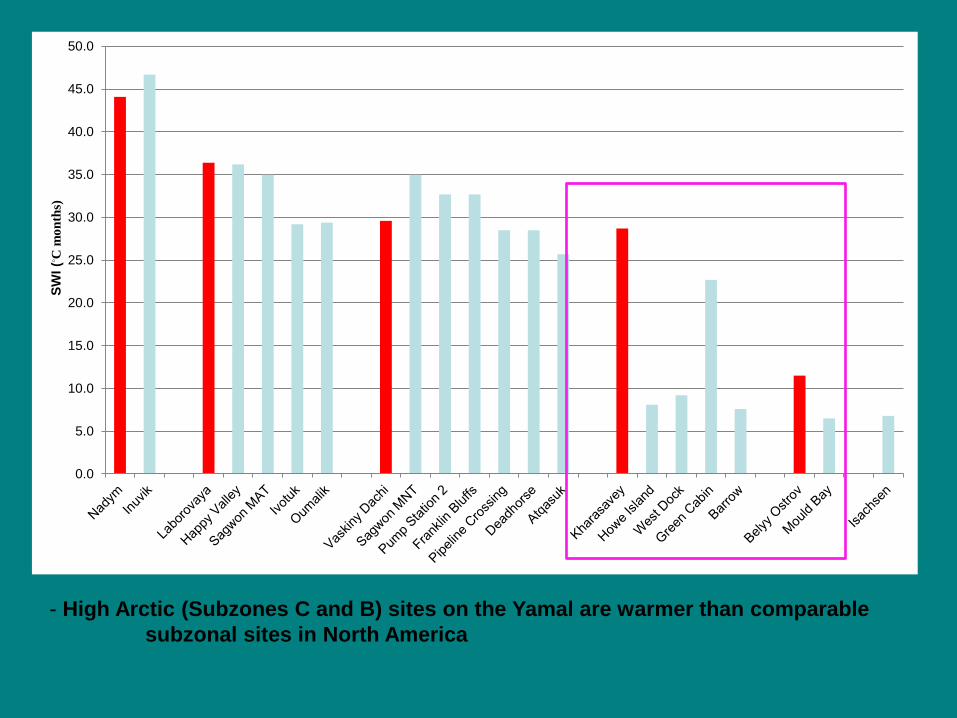
- High Arctic (Subzones C and B) sites on the Yamal are warmer than comparable
subzonal sites in North America
y = -0.6604x2 + 30.822x - 30.676 r² = 0.8616
0
100
200
300
400
500
0 10 20 30 40 50
Bio
mas
s (g
m-2
)
SWI
Moss Biomass
y = 11.144x0.8478 r² = 0.7839
0
200
400
600
800
0 10 20 30 40 50
Bio
mas
s (g
m-2
)
SWI
Lichen Biomass
y = 0.0026x3.177 r² = 0.9386
0
100
200
300
400
500
0 10 20 30 40 50
Bio
mas
s (g
m-2
)
SWI
Shrub Biomass
y = 24.893x0.8586 r² = 0.8826
0
200
400
600
800
0 20 40 60
Bio
mas
s (g
m-2
)
SWI
Non-Vascular Biomass
y = -0.0065x + 2.0615 r² = 0.0428
0
0.5
1
1.5
2
2.5
3
0 10 20 30 40 50
% C
arb
on
SWI
%C
y = 0.199x r² = 0.6026
02468
10121416
0 10 20 30 40 50
Dep
th (
cm)
SWI
Organic Layer Depth
y = 24.339x0.3857 r² = 0.8043
0
20
40
60
80
100
120
140
160
0 10 20 30 40 50
Dep
th (
cm)
SWI
Active Layer Depth
SOILS
y = 0.6389x + 11.586 r² = 0.6977
0
10
20
30
40
50
0 10 20 30 40 50
C:N
SWI
C:N
y = -0.019ln(x) + 0.1392 r² = 0.2082
0
0.02
0.04
0.06
0.08
0.1
0.12
0.14
0.16
0 10 20 30 40 50
%N
itro
gen
SWI
%N
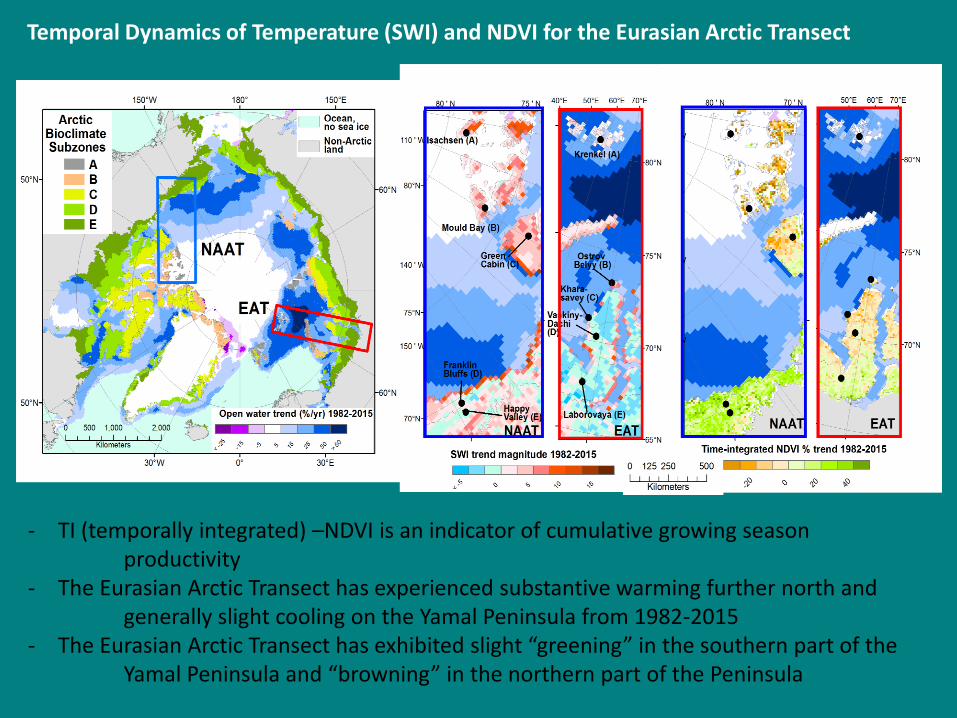
Temporal Dynamics of Temperature (SWI) and NDVI for the Eurasian Arctic Transect
- TI (temporally integrated) –NDVI is an indicator of cumulative growing season productivity
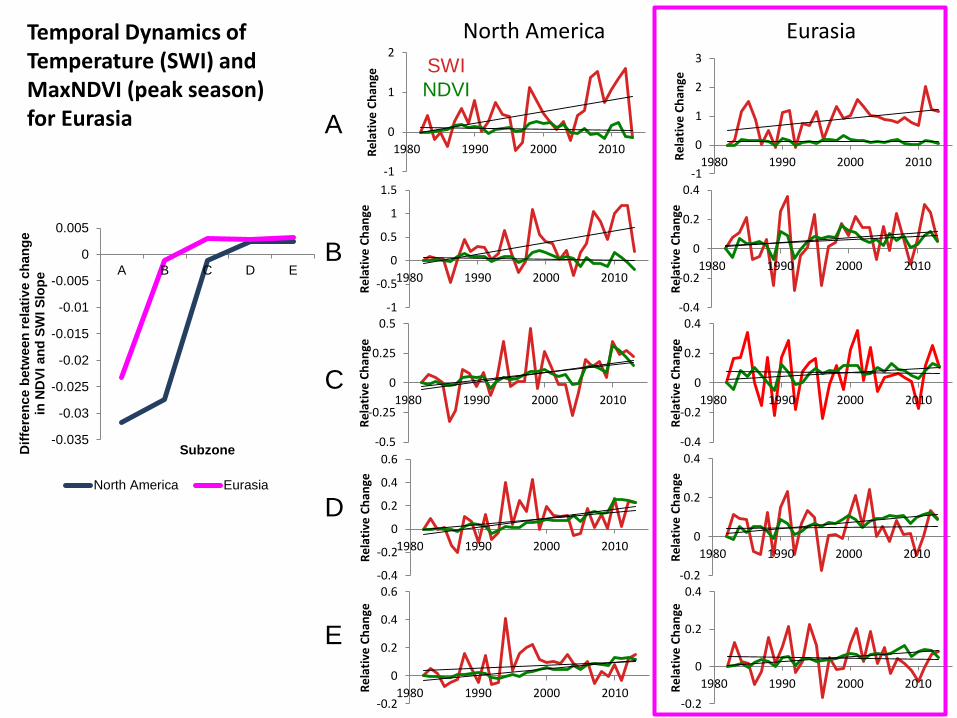
- The Eurasian Arctic Transect has experienced substantive warming further north and generally slight cooling on the Yamal Peninsula from 1982-2015
- The Eurasian Arctic Transect has exhibited slight “greening” in the southern part of the Yamal Peninsula and “browning” in the northern part of the Peninsula
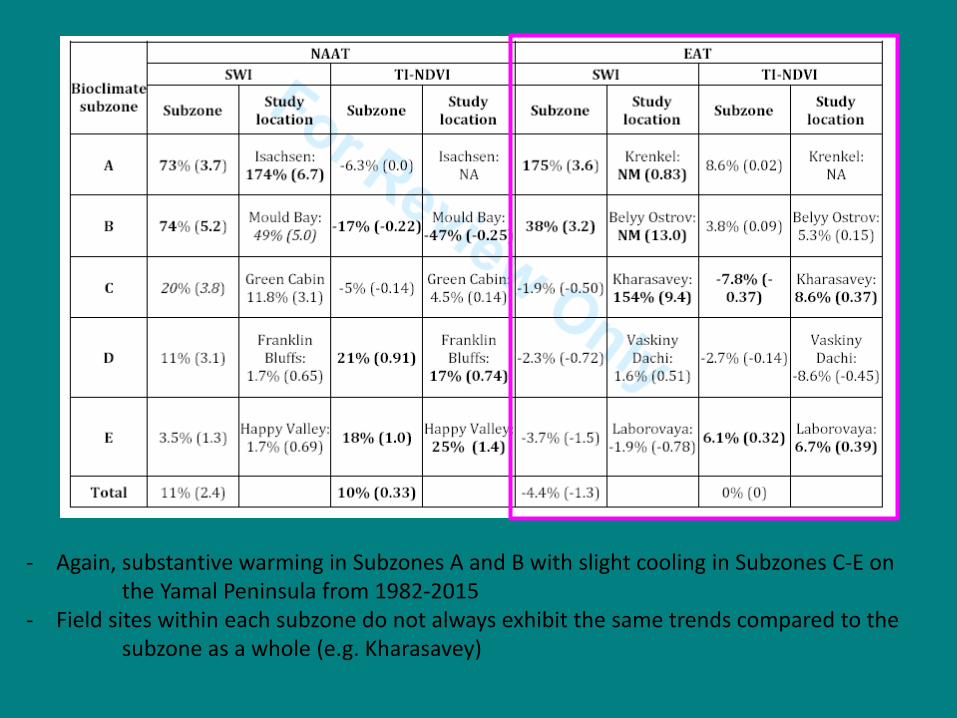
- Again, substantive warming in Subzones A and B with slight cooling in Subzones C-E on the Yamal Peninsula from 1982-2015
- Field sites within each subzone do not always exhibit the same trends compared to the subzone as a whole (e.g. Kharasavey)
-1
0
1
2
1980 1990 2000 2010Re
lati
ve C
han
ge
A
B
C
D
E
North America Eurasia
SWI
NDVI
-1
-0.5
0
0.5
1
1.5
1980 1990 2000 2010
Re
lati
ve C
han
ge
-0.5
-0.25
0
0.25
0.5
1980 1990 2000 2010
Re
lati
ve C
han
ge
-0.4
-0.2
0
0.2
0.4
0.6
1980 1990 2000 2010
Re
lati
ve C
han
ge
-0.2
0
0.2
0.4
0.6
1980 1990 2000 2010Re
lati
ve C
han
ge
-1
0
1
2
3
1980 1990 2000 2010Re
lati
ve C
han
ge
-0.4
-0.2
0
0.2
0.4
1980 1990 2000 2010
Re
lati
ve C
han
ge
-0.4
-0.2
0
0.2
0.4
1980 1990 2000 2010
Re
lati
ve C
han
ge
-0.2
0
0.2
0.4
1980 1990 2000 2010Re
lati
ve C
han
ge
-0.2
0
0.2
0.4
1980 1990 2000 2010Re
lati
ve C
han
ge
-0.035
-0.03
-0.025
-0.02
-0.015
-0.01
-0.005
0
0.005
A B C D E
Dif
fere
nce b
etw
een
rela
tiv
e c
han
ge
in N
DV
I an
d S
WI S
lop
e
Subzone
North America Eurasia
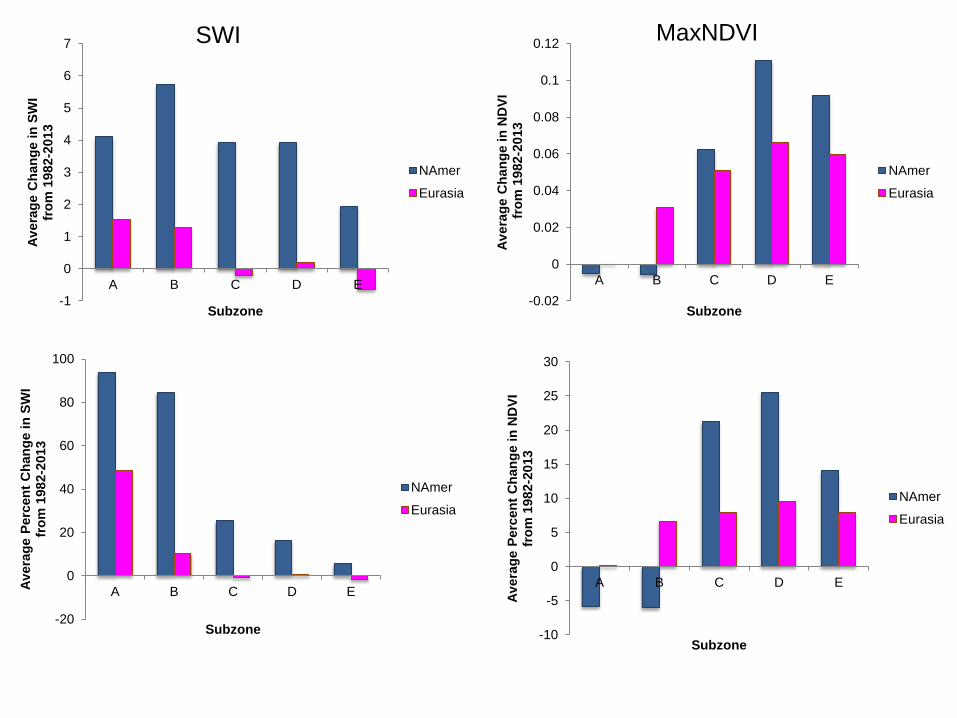
Temporal Dynamics of Temperature (SWI) and MaxNDVI (peak season) for Eurasia
-1
0
1
2
3
4
5
6
7
A B C D E
Av
era
ge C
han
ge i
n S
WI
fr
om
1982-2
013
Subzone
NAmer
Eurasia
-0.02
0
0.02
0.04
0.06
0.08
0.1
0.12
A B C D E
Av
era
ge C
han
ge i
n N
DV
I f
rom
1982
-2013
Subzone
NAmer
Eurasia
-20
0
20
40
60
80
100
A B C D EAv
era
ge P
erc
en
t C
han
ge i
n S
WI
fr
om
1982-2
013
Subzone
NAmer
Eurasia
-10
-5
0
5
10
15
20
25
30
A B C D E
Av
era
ge P
erc
en
t C
han
ge i
n N
DV
I
fro
m 1
982-2
013
Subzone
NAmer
Eurasia
MaxNDVI SWI
A
B
C
D
E
North America Eurasia
-0.03
-0.01
0.01
0.03
-8 -6 -4 -2 0 2 4 6
ND
VI
ch
an
ge
SWI change
-0.02
0.00
0.02
-8 -6 -4 -2 0 2 4 6 8
ND
VI
ch
an
ge
SWI change
-0.04
0.01
0.06
-9 -7 -5 -3 -1 1 3 5 7ND
VI
ch
an
ge
SWI change
-0.04
-0.02
0.00
0.02
0.04
0.06
-11 -9 -7 -5 -3 -1 1 3 5 7 9 11
ND
VI
ch
an
ge
SWI change
-0.03
-0.01
0.01
0.03
-13-11 -9 -7 -5 -3 -1 1 3 5 7 9 11 13 15
ND
VI
ch
an
ge
SWI change
-0.03
-0.01
0.01
0.03
-3 -2 -1 0 1 2 3
ND
VI
ch
an
ge
SWI change
-0.09
-0.05
-0.01
0.03
0.07
-8 -7 -6 -5 -4 -3 -2 -1 0 1 2 3 4 5 6 7
ND
VI
ch
an
ge
SWI change
-0.09
-0.05
-0.01
0.03
0.07
0.11
-10 -8 -6 -4 -2 0 2 4 6 8
ND
VI
ch
an
ge
SWI change
-0.05
-0.02
0.01
0.04
0.07
-10 -8 -6 -4 -2 0 2 4 6 8
ND
VI
ch
an
ge
SWI change
-0.05
-0.03
-0.01
0.01
0.03
-10 -8 -6 -4 -2 0 2 4 6 8N
DV
I c
ha
ng
e
SWI change
0
0.001
0.002
0.003
0.004
0.005
0.006
0.007
A B C D E
Reg
ressio
n s
lop
e o
f S
WI
an
d N
DV
I ch
an
ge f
rom
pre
vio
us y
ear
Subzone
North America Eurasia
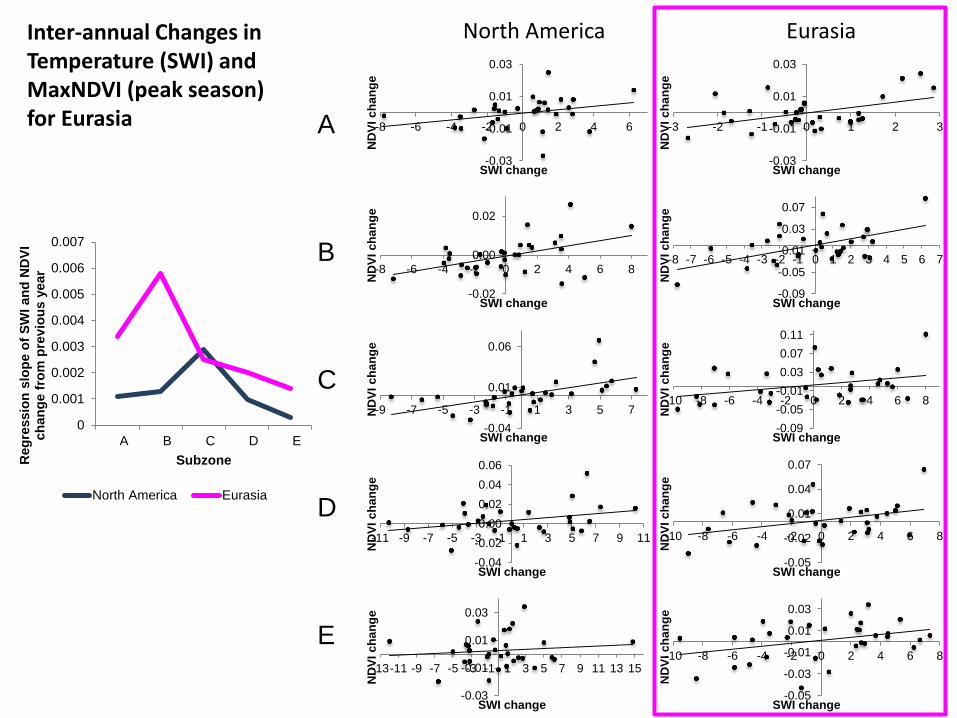
Inter-annual Changes in Temperature (SWI) and MaxNDVI (peak season) for Eurasia
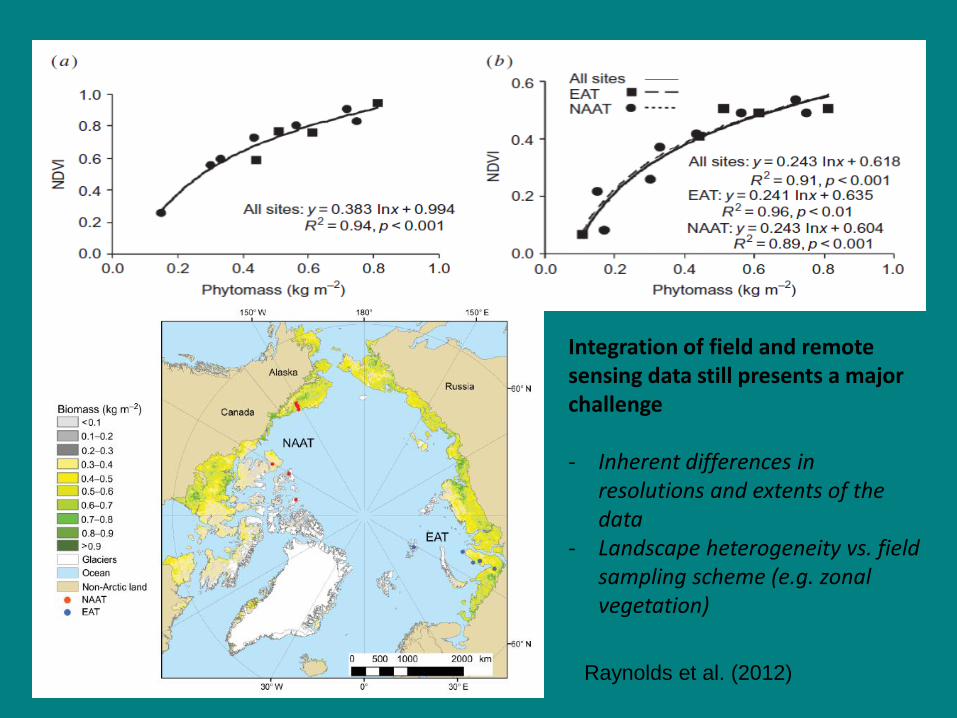
Raynolds et al. (2012)
Integration of field and remote sensing data still presents a major challenge - Inherent differences in
resolutions and extents of the data
- Landscape heterogeneity vs. field sampling scheme (e.g. zonal vegetation)
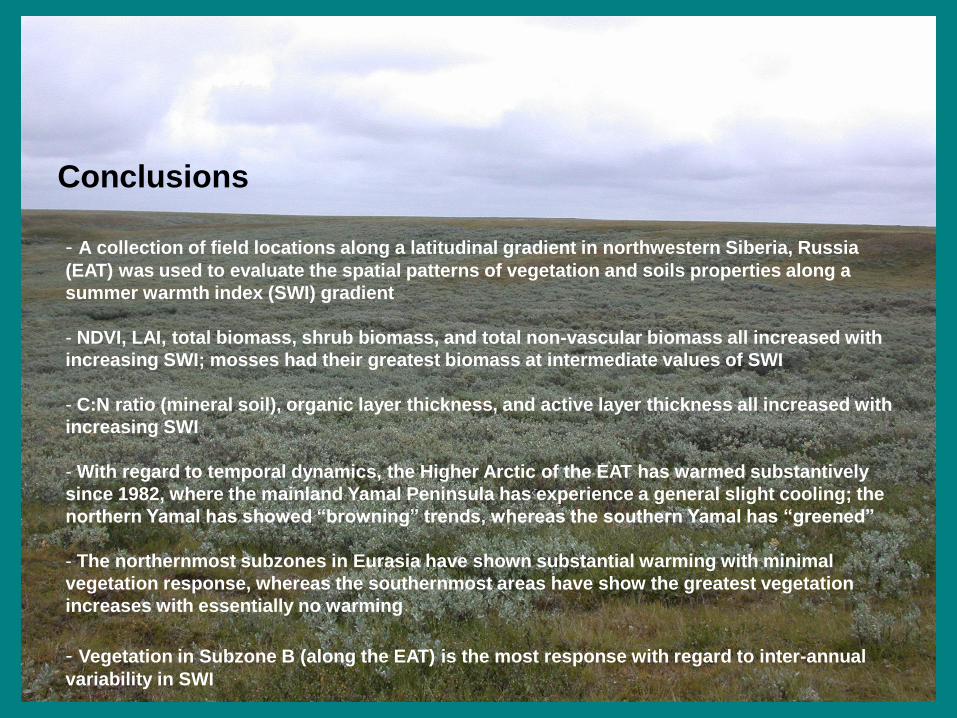
Conclusions
- A collection of field locations along a latitudinal gradient in northwestern Siberia, Russia
(EAT) was used to evaluate the spatial patterns of vegetation and soils properties along a
summer warmth index (SWI) gradient
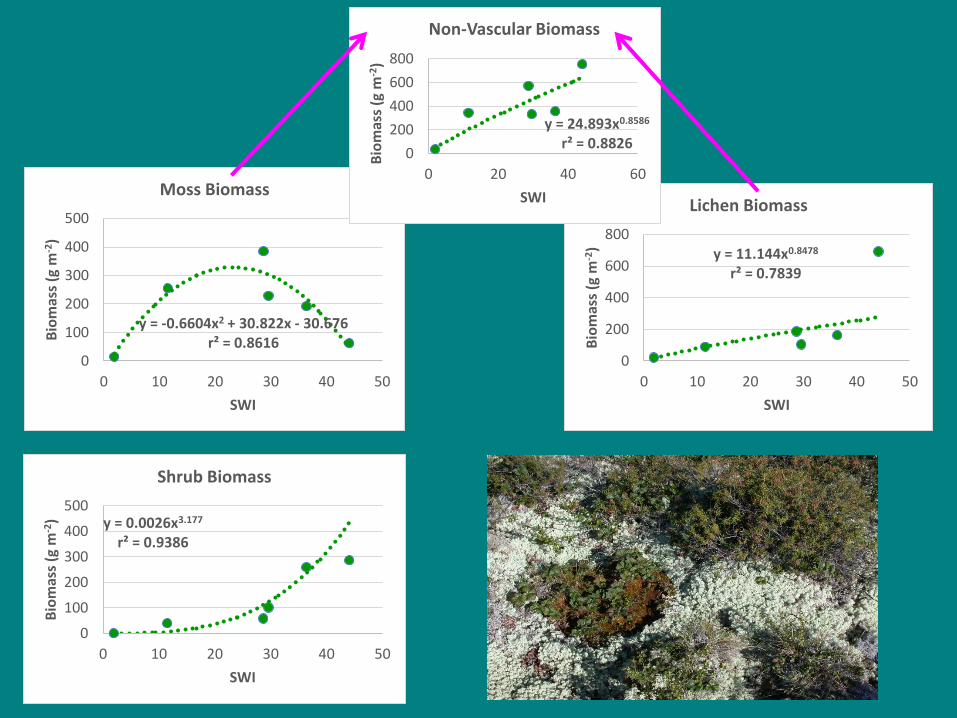
- NDVI, LAI, total biomass, shrub biomass, and total non-vascular biomass all increased with
increasing SWI; mosses had their greatest biomass at intermediate values of SWI
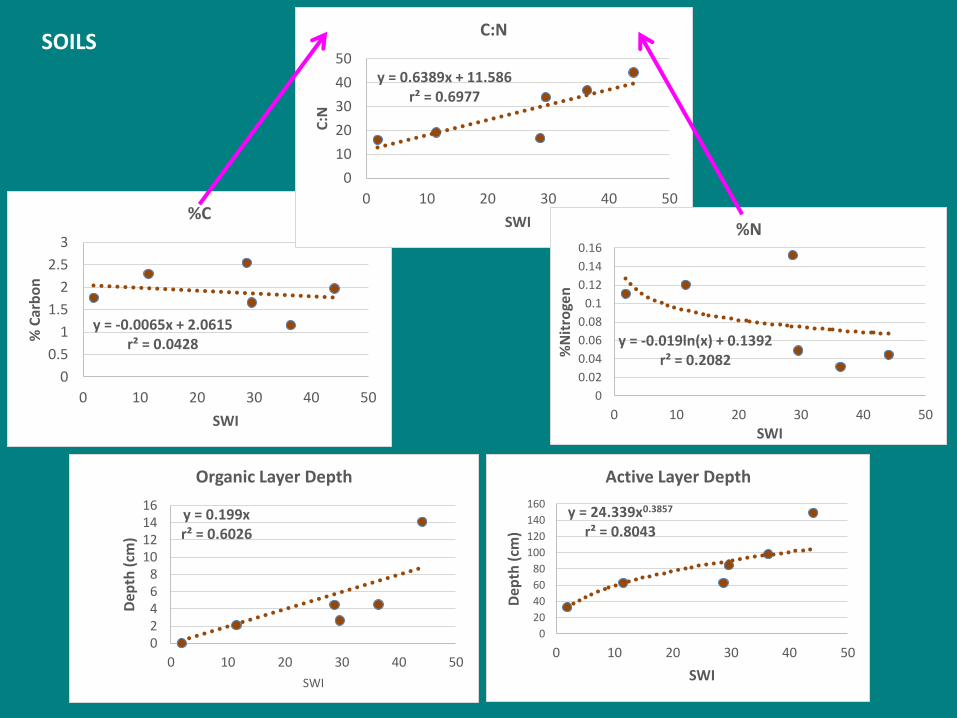
- C:N ratio (mineral soil), organic layer thickness, and active layer thickness all increased with
increasing SWI
- With regard to temporal dynamics, the Higher Arctic of the EAT has warmed substantively
since 1982, where the mainland Yamal Peninsula has experience a general slight cooling; the
northern Yamal has showed “browning” trends, whereas the southern Yamal has “greened”
- The northernmost subzones in Eurasia have shown substantial warming with minimal
vegetation response, whereas the southernmost areas have show the greatest vegetation
increases with essentially no warming
- Vegetation in Subzone B (along the EAT) is the most response with regard to inter-annual
variability in SWI
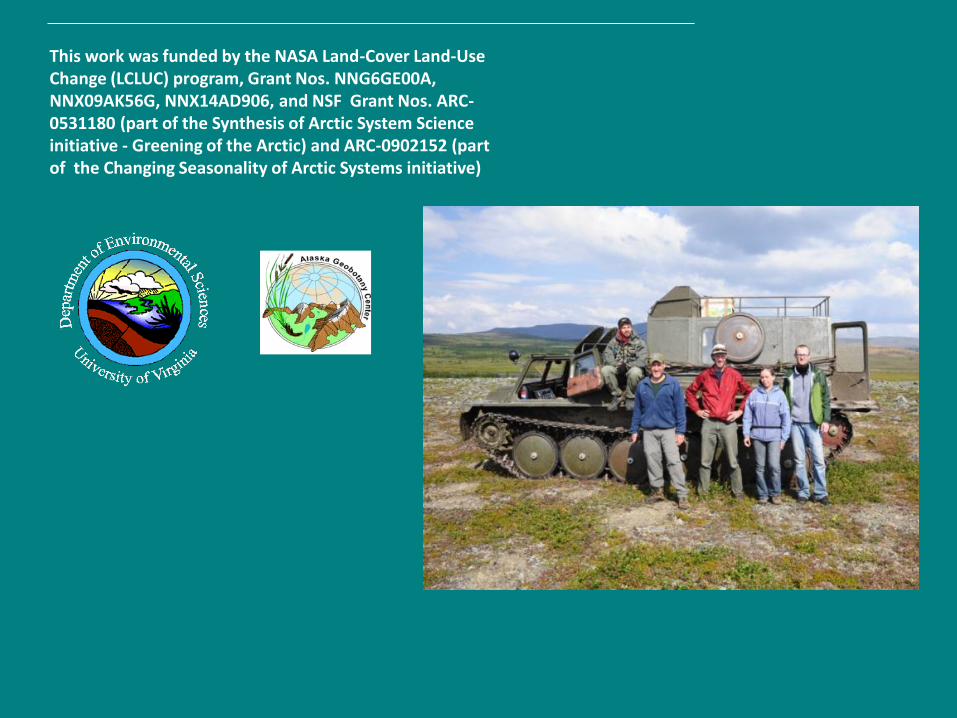
This work was funded by the NASA Land-Cover Land-Use Change (LCLUC) program, Grant Nos. NNG6GE00A, NNX09AK56G, NNX14AD906, and NSF Grant Nos. ARC-0531180 (part of the Synthesis of Arctic System Science initiative - Greening of the Arctic) and ARC-0902152 (part of the Changing Seasonality of Arctic Systems initiative)


![March 2017 Blue Notes - Attleboroahs.attleboroschools.com/UserFiles/Servers/Server... · 22 NHS and NTHS Induction Ceremonies [Bray] 7 PM 24 Report Cards Distributed APRIL 2017 1](https://img.pdfslide.net/doc/110x75/5f6bde19f330f977db1924d9/march-2017-blue-notes-22-nhs-and-nths-induction-ceremonies-bray-7-pm-24-report.jpg)