Embed Size (px)
Citation preview
Vegetation of Michigan circa 1800
An Interpretion of the General Land Office Surveys 1816-1856
MNFI Report 1995-006 Project Coordinator Patrick J. Comer Map Interpretation Digital Map Production Dennis A. Albert Michael B. Austin Patrick J. Comer Cathy J. DeLain Richard A. Corner Kraig M. Korroch Barbara L. Hart Teresa R. Leibfried Daniel M. Kashian Laurie Prange-Gregory David L. Price Lyn J. Scrimger Jodi B. Raab John G. Spitzley David W. Schuen MIRIS Staff Heather A. Wells With support from: U.S. Environmental Protection Agency, Water Division Wildlife Division, Michigan Department of Natural Resources MDNR Saginaw Bay Watershed Initiative Coastal Management Program, MDNR Land and Water Management Division
Hiawatha National Forest Michigan Department of Military Affairs
completed December, 1995 Please cite this digital map as:
Comer, P.J., D.A. Albert, H.A. Wells, B.L. Hart, J.B. Raab, D.L. Price, D.M. Kashian, R.A. Corner & D.W. Schuen (map interpretation); T.R. Leibfreid, M.B. Austin, C.J. DeLain, L. Prange-Gregory, L.J. Scrimger, K.M. Korroch, & JG. Spitzley (digital map production). 1995. Michigan’s Presettlement Vegetation, as In-terpreted from the General Land Office Surveys 1816-1856. Michigan Natural Features Inventory, Lansing, MI. digital map.
Michigan’s Presettlement Vegetation
2
INTRODUCTION The growing awareness of the decline of biodiversity has been one of the driving forces behind changing views on land-use planning and land management. As pressure on land re-sources increases, planners and managers must find new ways to guide economic development while restoring and maintaining the integrity of the natural systems within their jurisdiction. Tools that enhance our understanding of natural patterns and processes across large landscapes often provide insights for land-use planning and land management. Knowledge of the type, location, and eco-logical context of Michigan's native vegetation, as it appeared prior to widespread European set-tlement in the 1800s, provides an important building block for ecologically meaningful man-agement strategies. By comparing historical data with more recent data, spatial changes of vegetation types for a given land unit may be analyzed and more easily assessed. A historical database provides an important reference point for understanding cumulative impacts to natural systems caused by fragmentation, degradation, and conversion. Patterns we see today in species distributions, wetland hydrology, and ecosystem function become more meaningful when placed in a historical context. Natural disturbances such as wildfire, wind-throws, and beaver floodings played an impor-tant role in the development of vegetative pat-tern across Michigan's landscape. Clarifying the type, location, and ecological context of natural disturbances provides useful insights for devel-oping ecological models. These models can lead to management strategies that more efficiently mimic natural processes. Native Americans also used fire as a land management tool and played a role in the devel-opment and maintenance of Michigan's native vegetation (Jones & Kapp 1970, Whitney 1994). It is helpful to know where their activities were most concentrated so that vegetative patterns can be viewed in the most accurate context. Of course natural ecosystems are quite dy-namic, and the pattern of Michigan's native vegetation, natural disturbances, and Native
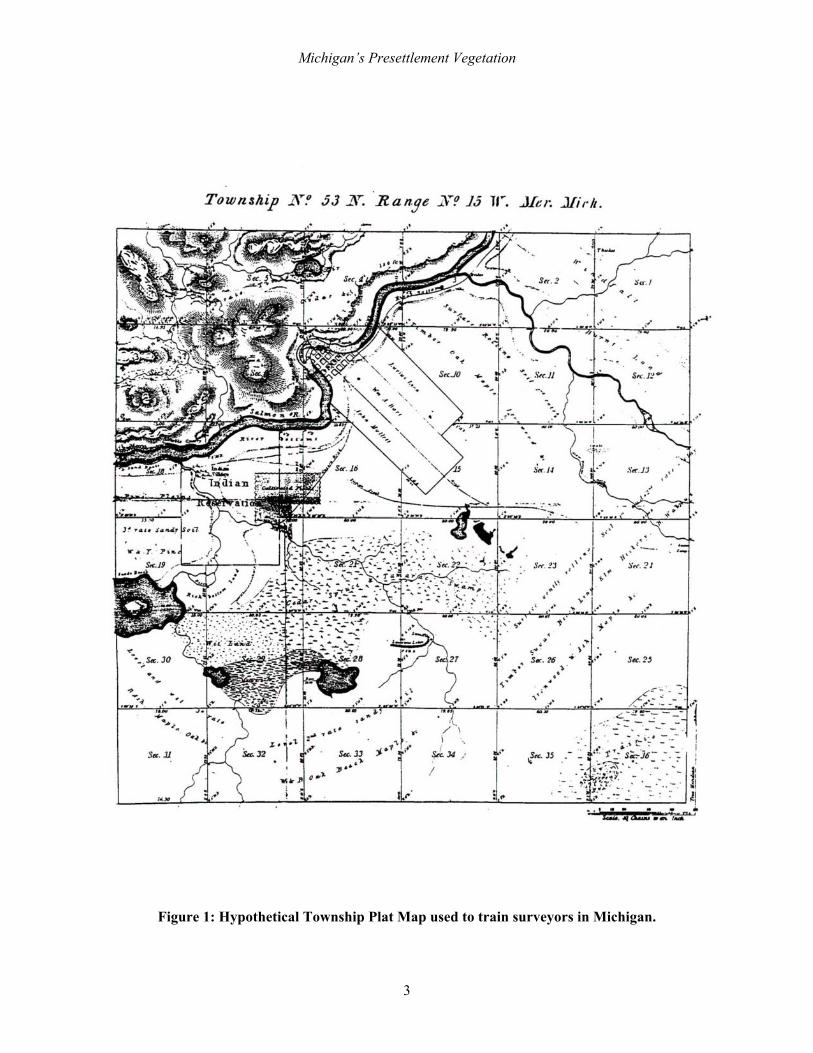
American activities changed continually over the past 16,000 years since the last glaciation (Del-court & Delcourt 1981). However, a clear pic-ture of the patterns and processes as they ap-peared just two hundred years ago, immediately prior to the logging era and intensive agricul-tural development of the nineteenth century, has many applications for our understanding of cur-rent conditions. General Land Office Surveys The township plat maps and transcribed field notes of the initial land surveys provide the best available record on Michigan’s presettle-ment vegetation (Bourdo 1956). The General Land Office (GLO) was established by the fed-eral government in 1785 to survey the nation’s western territorial lands. Lands of what was then the Michigan Territory (until statehood in 1837), had to be surveyed prior to their sale to private individuals. The surveys were conducted in Michigan by Deputy Surveyors of the General Land Office between 1816 and 1856, prior to widespread European settlement (Base and Me-ridian lines were established several years ear-lier). The survey was, therefore, conducted just before the logging-era, which saw the most dra-matic transformation in Michigan’s natural land-scape since the last glaciation. Survey methods are described in detail by White (1984) and the communications between the Surveyor General and Michigan’s Deputy Land Surveyors are found in Caldwell (1990). Surveys were organized around a 36 square mile grid (Figure 1). Each grid would form a town-ship. Townships were organized in association with previously established Meridian and Base lines, forming the familiar layout known as “Township and Range.” The Base line was an east-west line from what is now the Van Buren-Allegan County line, east to Lake St. Clair. The Meridian line extended north-south, from Sault Ste. Marie to the Hillsdale-Lenawee County line. As an example, Township 32 North, Range 15 West, locates an area 32 townships north of the Base Line and 15 townships west of
Michigan’s Presettlement Vegetation
3
Figure 1: Hypothetical Township Plat Map used to train surveyors in Michigan.
Michigan’s Presettlement Vegetation
4
the Meridian line. In most of Michigan, outside township boundaries were established several years before the individual square-mile sections were subdivided. Surveyors were attempting to create an ac-curate picture of the land resources of the terri-tory and leave markers to indicate township and section boundaries for future settlers. They needed to include enough land resource informa-tion for settlers to make a sight-unseen land pur-chase, and mark the lands well enough for the settler to be able to later find the parcel on their own. In order to complete this task, they used a compass and "chain" to make accurate meas-urements. Chains were made up of 100 “links” that totaled 66 feet in length (80 chains per mile). As they measured out the boundaries of townships and sections, surveyors made notes on the topography, soils, and vegetation they encountered along each one mile section line. At each section corner and half-mile point, they pounded a wooden post into the ground. That post would later be used to establish legal prop-erty boundaries. In two to four quadrants around the post they marked “witness trees.” The wit-ness trees were to aid the settler in locating the survey post that had been pounded into the ground. As with the information noted along each section line, information on witness trees was entered into the surveyor’s field notebook. When they had completed the survey of a 36 square mile township, surveyors drew a plat map, depicting in general terms, the types of land resources they encountered within that township. This square mile grid of the state, surveyed during the establishment of counties and 36 square mile townships, formed the framework for surveyor’s maps and field notes, which pro-vided the core of historical data for this project. The township plat maps in Michigan vary considerably in their quality. They were pro-duced at the time of the surveys without the benefit of a topographic map. Maps produced in early years of the surveys (southern, Lower Michigan) contain little information, often lim-ited to the locations of lakes and streams. As the surveys progressed to the north, more informa-
tion was included on the plat maps. Those pro-duced in Northern Michigan include much in-formation on natural and cultural features. Fig-ure 1 illustrates a hypothetical township plat map that was used to train surveyors on the types of features they needed to include in their reports. They included abrupt topographic fea-tures, rivers and streams, lakes, wetlands, exist-ing settlements, trails, and roads. There were also general comments on bedrock outcrops, soils, and vegetation written across the sections where those features were found. Although survey methods saw minor modi-fications during the course of the Michigan sur-veys, the transcribed surveyor's notes are much more consistent in quality throughout the state than the township plat maps. Surveyors were instructed to note the exact location of wetlands, lakes and streams, comment on the agricultural potential of soils, and note the quantity and qual-ity of timber resources as they were encountered along each section line (White 1984, Caldwell 1990). Wherever they marked trees, surveyors noted their species and diameter at breast height. Tree species and diameter was also noted when they occurred along the section lines. At section corner and half-mile points, witness trees were selected from nearby trees in the northeast, northwest, southeast, and southwest quadrants. Often just two trees were marked and noted around each corner post. The exact bearing and distance of each witness tree in relation to the associated corner post was also measured and recorded. Recently burned areas, windthrows, and beaver floodings were recorded along the section lines, as were various cultural features, of either Native American or early-European settler origin. These detailed records formed the basis for the development of our presettlement vegetation map. Our maps were compiled by plant ecolo-gists familiar with Michigan's tree species, sur-face geology, and soils. This document will dis-cuss the methods used in map production and provide some general considerations for using the maps. It is intended as a guide to be used along with Michigan’s presettlement vegetation map.
Michigan’s Presettlement Vegetation
5
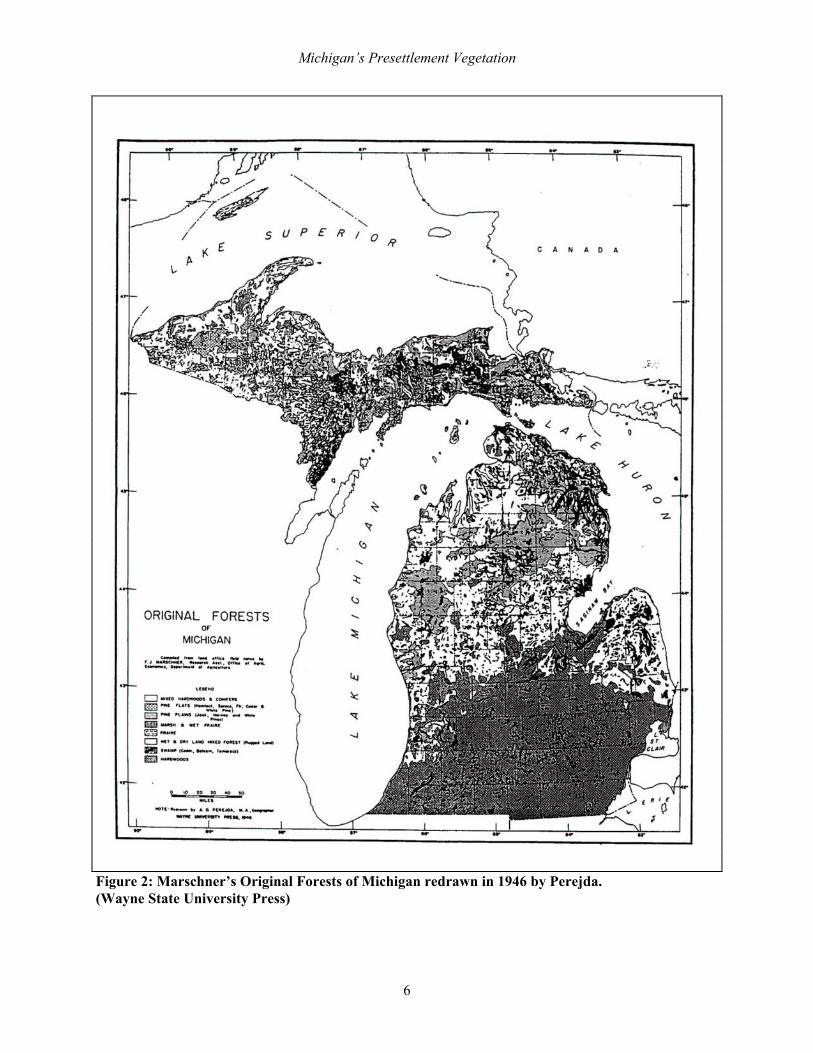
Previous efforts Previous state-wide attempts at mapping Michigan's presettlement vegetation were com-pleted by Marschner (1940) and Veatch (1959). Marschner utilized maps and field notes from the original land surveys to complete a map of Michigan, Wisconsin, and Minnesota. The Marschner map (scale 1:2,500,000), as re-drawn by Perejda (1946), depicted the loca-tion of eight different categories of vegetation including swamp, hardwood forest, hardwood-conifer forest, pine flats (hemlock, white pine, cedar, fir, and spruce), pine plains (jack pine, “Norway” pine, and white pine), wet and dry mixed forest, marsh and wet prairie, and prairie (Figure 2). Veatch (1959) relied to a large extent on soil association maps, but also utilized surveyor's data and local histories. He produced one map for each Michigan peninsula (scale 1:500,000). Trygg (1964) produced composite maps for the Upper Midwest using the surveyor’s town-ship plat maps. His intent was to display cultural features. The Trygg maps differentiate between prairie, marsh, bottom lands, and swamp. They do not indicate the dominant tree species of the swamps. Information on upland forest was lim-ited to the locations of historical pineries. Trygg completed no maps for southern Lower Michi-gan, due to the above mentioned lack of infor-mation on the township plat maps. Although not a statewide treatment, Brewer et al. (1984) produced a detailed presettlement vegetation map for southwest Lower Michigan using GLO survey data combined with informa-tion on historic prairies. Their interpretations differ from ours primarily in the methodology used for delineating savannas. Our presettlement vegetation map of Michi-gan is the first attempt to create a detailed view of the entire state’s presettlement vegetative pat-tern and natural disturbances within a digital environment. The utility of this spatial database is greatly enhanced by the ability to conduct spa-tial analyses within the electronic environment of a computerized Geographic Information Sys-tem (GIS).
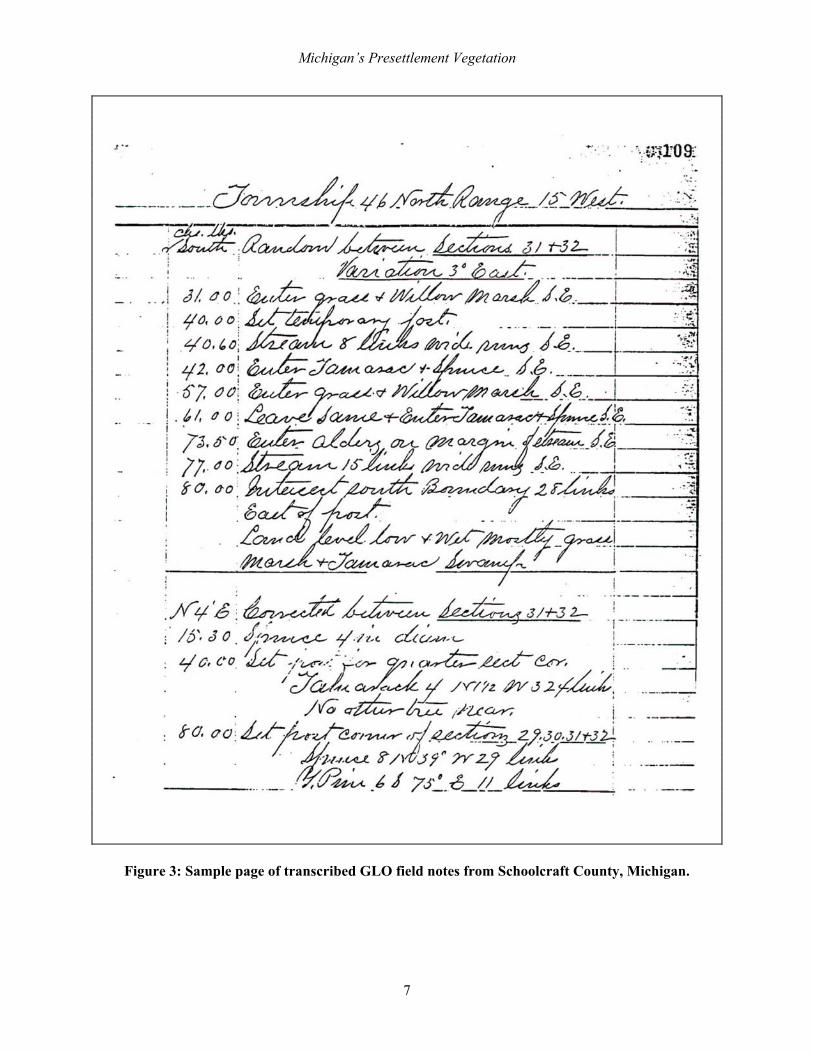
METHODS Map Production We used the transcribed General Land Of-fice survey notes (1890), which were made available to our mapping team by the State Ar-chives of Michigan. Township plat maps pro-duced by surveyors were copied from microfilm available from the Real Estate Division of the Michigan Department of Natural Resources and State Archives of Michigan. We attached matte mylar to the most recent 7.5 minute, U.S. Geo-logical Survey topographic maps, which for Michigan, are available in 1:24,000 and 1:25,000 scales and include topographic contour intervals of five, 10, and 20 feet depending both on the date of map publication and local topog-raphic relief. A scale indicating chains (at 1:24,000 and 1:25,000 scales) was used for pre-cise measurements along each section line. We plotted all information extracted from the GLO survey notes and maps onto the mylar overlays and map margins. Information in the transcribed surveyor’s notes is organized in a systematic pattern, reflecting the measurement of each section line in the township (Figure 3). We abbreviated common names of tree species in 3-5 letter combinations to speed the plotting of data (Table 1). Surveyors noted some tree species more generically than others. For exam-ple "elm", "ash", and "maple" were commonly used without distinguishing among the several native species that could have been encountered. We consulted published floras and other sources (Hutchinson 1988) to determine which old common names referred to which tree species; (e.g. "spruce pine" = jack pine, "yellow pine" = red pine). Tree abbreviations reflect the common name used by the surveyors. We plotted tree species and diameter along each section line at the approximate distance (in chains) where they were mentioned in the notes. At each section corner, we plotted tree species, diameter, bear-ing, and distance information. Although dis-tance information exists for witness trees at all half-mile posts, we recorded that information only in open savannas. Surveyors often included a list of tree species (generally ranked by relative abundance, but sometimes biased by surveyor's view of their
Michigan’s Presettlement Vegetation
6
Figure 2: Marschner’s Original Forests of Michigan redrawn in 1946 by Perejda. (Wayne State University Press)
Michigan’s Presettlement Vegetation
7
Figure 3: Sample page of transcribed GLO field notes from Schoolcraft County, Michigan.
Michigan’s Presettlement Vegetation
8
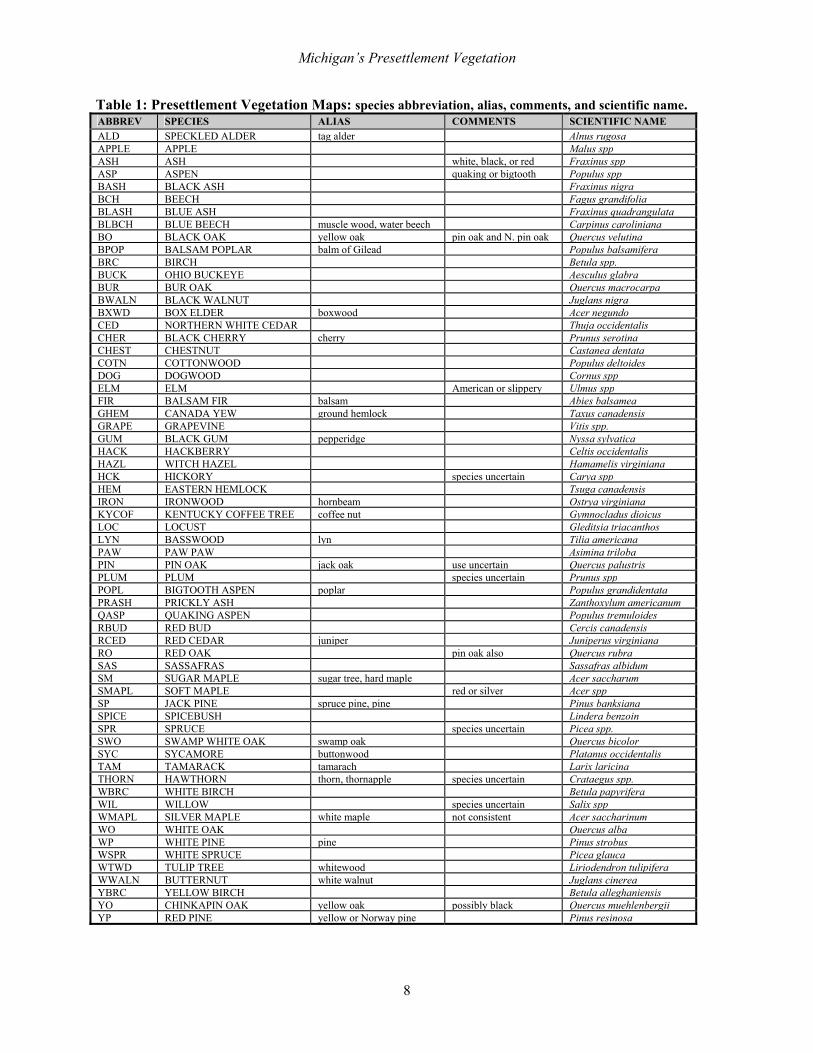
Table 1: Presettlement Vegetation Maps: species abbreviation, alias, comments, and scientific name. ABBREV SPECIES ALIAS COMMENTS SCIENTIFIC NAME ALD SPECKLED ALDER tag alder Alnus rugosa APPLE APPLE Malus spp ASH ASH white, black, or red Fraxinus spp ASP ASPEN quaking or bigtooth Populus spp BASH BLACK ASH Fraxinus nigra BCH BEECH Fagus grandifolia BLASH BLUE ASH Fraxinus quadrangulataBLBCH BLUE BEECH muscle wood, water beech Carpinus carolinianaBO BLACK OAK yellow oak pin oak and N. pin oak Quercus velutina BPOP BALSAM POPLAR balm of Gilead Populus balsamiferaBRC BIRCH Betula spp. BUCK OHIO BUCKEYE Aesculus glabra BUR BUR OAK Quercus macrocarpaBWALN BLACK WALNUT Juglans nigra BXWD BOX ELDER boxwood Acer negundo CED NORTHERN WHITE CEDAR Thuja occidentalis CHER BLACK CHERRY cherry Prunus serotina CHEST CHESTNUT Castanea dentata COTN COTTONWOOD Populus deltoides DOG DOGWOOD Cornus spp ELM ELM American or slippery Ulmus spp FIR BALSAM FIR balsam Abies balsamea GHEM CANADA YEW ground hemlock Taxus canadensis GRAPE GRAPEVINE Vitis spp. GUM BLACK GUM pepperidge Nyssa sylvatica HACK HACKBERRY Celtis occidentalis HAZL WITCH HAZEL Hamamelis virginianaHCK HICKORY species uncertain Carya spp HEM EASTERN HEMLOCK Tsuga canadensis IRON IRONWOOD hornbeam Ostrya virginiana KYCOF KENTUCKY COFFEE TREE coffee nut Gymnocladus dioicusLOC LOCUST Gleditsia triacanthosLYN BASSWOOD lyn Tilia americana PAW PAW PAW Asimina triloba PIN PIN OAK jack oak use uncertain Quercus palustris PLUM PLUM species uncertain Prunus spp POPL BIGTOOTH ASPEN poplar Populus grandidentataPRASH PRICKLY ASH Zanthoxylum americanumQASP QUAKING ASPEN Populus tremuloidesRBUD RED BUD Cercis canadensis RCED RED CEDAR juniper Juniperus virginianaRO RED OAK pin oak also Quercus rubra SAS SASSAFRAS Sassafras albidum SM SUGAR MAPLE sugar tree, hard maple Acer saccharum SMAPL SOFT MAPLE red or silver Acer spp SP JACK PINE spruce pine, pine Pinus banksiana SPICE SPICEBUSH Lindera benzoin SPR SPRUCE species uncertain Picea spp. SWO SWAMP WHITE OAK swamp oak Quercus bicolor SYC SYCAMORE buttonwood Platanus occidentalisTAM TAMARACK tamarach Larix laricina THORN HAWTHORN thorn, thornapple species uncertain Crataegus spp. WBRC WHITE BIRCH Betula papyrifera WIL WILLOW species uncertain Salix spp WMAPL SILVER MAPLE white maple not consistent Acer saccharinum WO WHITE OAK Quercus alba WP WHITE PINE pine Pinus strobus WSPR WHITE SPRUCE Picea glauca WTWD TULIP TREE whitewood Liriodendron tulipiferaWWALN BUTTERNUT white walnut Juglans cinerea YBRC YELLOW BIRCH Betula alleghaniensisYO CHINKAPIN OAK yellow oak possibly black Quercus muehlenbergiiYP RED PINE yellow or Norway pine Pinus resinosa

Michigan’s Presettlement Vegetation
9
relative importance), impressions of soil charac-ter, and drainage characteristics along each sur-veyed mile. These comments, where they added significant ecological information, were copied to the mylar overlays in quotes along the section line. We located wetland boundaries along each section line at the chain distances mentioned in the field notes. Surveyor's comments on the character of rivers and streams were also copied to the mylar overlays. We found that the town-ship plat maps accurately represent the chain distances described in the notes. The same was true for the locations of natural disturbances such as windthrows and recent fires. In North-ern Michigan, surveyors often provided several paragraphs of description for each township. We copied this information on the margins of each topographic map to aid in later interpreta-tion With this information plotted over topogra-phy, we interpreted cover type boundaries pri-marily using the locations of dominant tree spe-cies and associated landforms. Wetland bounda-ries were interpolated between section lines by using associated elevation lines as they were depicted on the topographic maps. There were a few cases where surveyors did not note their entrance and exit points for wetlands along the section line, but instead used comments such as "...last mile, wet and swampy.” These situations were most common on flat topography where the land was a complex mosaic of uplands and wetlands. When this occurred, the wetland boundary was determined using the comments and tree species that were encountered along the section line. We depicted wetlands falling en-tirely within interior sections as they were indi-cated on the topographic map. Typically, the smallest wetlands we included were 15-20 acres in size. We consulted surface geology maps, soils maps, and earlier vegetation maps throughout the process of interpretation. Michigan Natural Features Inventory (MNFI) maps from field sur-veys of Great Lakes marshes (MNFI 1987-1989) and wooded dune and swale complexes (Comer & Albert 1993) were used to clarify wetland boundaries in areas that had been sampled on the ground along the Great Lakes shoreline. Great
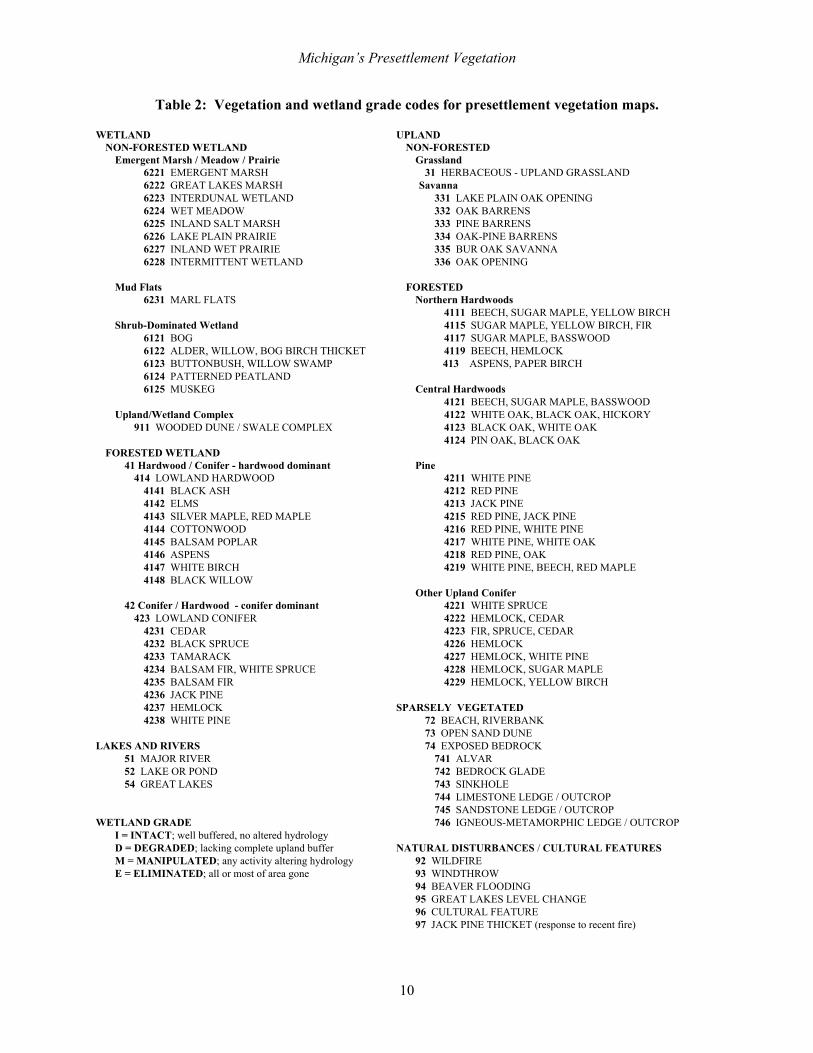
Lakes shoreline boundaries were interpreted from points of intersection with section lines and the prevailing orientation of current shorelines (where not obviously manipulated artificially). Surveyor's notes on meanders along the shore-line were not used, since normal water level fluctuations resulted in inconsistencies along the shoreline, depending on the year of the survey. We interpolated boundaries for natural dis-turbances such as wildfires and large wind-throws between section lines taking the direc-tions noted by surveyors (e.g."entered land burnt from southwest to northeast..."), topography, and likely fire breaks into account. Cultural fea-tures, both Native American and early European, were placed on the mylar overlays as they were mentioned in the notes. We developed cover type codes to identify all vegetation types, natural disturbances, and cultural features. The code system was designed to capture the complexity of plant communities that were distinguishable in the survey notes (Table 2). The code system for vegetation is based on the natural community classification currently in use by MNFI (1990). The classifica-tion reflects existing scientific literature and ex-perience of MNFI staff. Additional codes were created throughout the course of this project to reflect previously unrecognized associations of dominant tree species that were repeatedly en-countered and described by surveyors. The code system is structured to distinguish uplands from wetlands, and describes forested, unforested, sparsely vegetated, and aquatic systems. It is important to note that, while the four-digit code system mirrors the land cover code system used by the Michigan Resource Information System (MIRIS), the codes themselves represent differ-ing assemblages of vegetation. As with all dif-ferent vegetation classifications, they need to be carefully cross-walked before map comparisons are made. Upland forest codes reflect the two to three most abundant species, as determined by the map interpreter. While a quantitative analysis and characterization of species composition within each cover type was not completed for this project, typically, the dominant tree species were encountered among at least 60% of the
Michigan’s Presettlement Vegetation
10
Table 2: Vegetation and wetland grade codes for presettlement vegetation maps. WETLAND UPLAND
NON-FORESTED WETLAND NON-FORESTED Emergent Marsh / Meadow / Prairie Grassland
6221 EMERGENT MARSH 31 HERBACEOUS - UPLAND GRASSLAND 6222 GREAT LAKES MARSH Savanna 6223 INTERDUNAL WETLAND 331 LAKE PLAIN OAK OPENING 6224 WET MEADOW 332 OAK BARRENS 6225 INLAND SALT MARSH 333 PINE BARRENS 6226 LAKE PLAIN PRAIRIE 334 OAK-PINE BARRENS 6227 INLAND WET PRAIRIE 335 BUR OAK SAVANNA 6228 INTERMITTENT WETLAND 336 OAK OPENING
Mud Flats FORESTED
6231 MARL FLATS Northern Hardwoods 4111 BEECH, SUGAR MAPLE, YELLOW BIRCH Shrub-Dominated Wetland 4115 SUGAR MAPLE, YELLOW BIRCH, FIR
6121 BOG 4117 SUGAR MAPLE, BASSWOOD 6122 ALDER, WILLOW, BOG BIRCH THICKET 4119 BEECH, HEMLOCK 6123 BUTTONBUSH, WILLOW SWAMP 413 ASPENS, PAPER BIRCH 6124 PATTERNED PEATLAND 6125 MUSKEG Central Hardwoods
4121 BEECH, SUGAR MAPLE, BASSWOOD Upland/Wetland Complex 4122 WHITE OAK, BLACK OAK, HICKORY
911 WOODED DUNE / SWALE COMPLEX 4123 BLACK OAK, WHITE OAK 4124 PIN OAK, BLACK OAK
FORESTED WETLAND 41 Hardwood / Conifer - hardwood dominant Pine
414 LOWLAND HARDWOOD 4211 WHITE PINE 4141 BLACK ASH 4212 RED PINE 4142 ELMS 4213 JACK PINE 4143 SILVER MAPLE, RED MAPLE 4215 RED PINE, JACK PINE 4144 COTTONWOOD 4216 RED PINE, WHITE PINE 4145 BALSAM POPLAR 4217 WHITE PINE, WHITE OAK 4146 ASPENS 4218 RED PINE, OAK 4147 WHITE BIRCH 4219 WHITE PINE, BEECH, RED MAPLE 4148 BLACK WILLOW
Other Upland Conifer 42 Conifer / Hardwood - conifer dominant 4221 WHITE SPRUCE
423 LOWLAND CONIFER 4222 HEMLOCK, CEDAR 4231 CEDAR 4223 FIR, SPRUCE, CEDAR 4232 BLACK SPRUCE 4226 HEMLOCK 4233 TAMARACK 4227 HEMLOCK, WHITE PINE 4234 BALSAM FIR, WHITE SPRUCE 4228 HEMLOCK, SUGAR MAPLE 4235 BALSAM FIR 4229 HEMLOCK, YELLOW BIRCH 4236 JACK PINE 4237 HEMLOCK SPARSELY VEGETATED 4238 WHITE PINE 72 BEACH, RIVERBANK
73 OPEN SAND DUNE LAKES AND RIVERS 74 EXPOSED BEDROCK
51 MAJOR RIVER 741 ALVAR 52 LAKE OR POND 742 BEDROCK GLADE 54 GREAT LAKES 743 SINKHOLE 744 LIMESTONE LEDGE / OUTCROP
745 SANDSTONE LEDGE / OUTCROP WETLAND GRADE 746 IGNEOUS-METAMORPHIC LEDGE / OUTCROP
I = INTACT; well buffered, no altered hydrology D = DEGRADED; lacking complete upland buffer NATURAL DISTURBANCES / CULTURAL FEATURES M = MANIPULATED; any activity altering hydrology 92 WILDFIRE E = ELIMINATED; all or most of area gone 93 WINDTHROW
94 BEAVER FLOODING 95 GREAT LAKES LEVEL CHANGE 96 CULTURAL FEATURE 97 JACK PINE THICKET (response to recent fire)
Michigan’s Presettlement Vegetation
11
witness trees within the mapped area. Individual species named with each code (e.g. beech and hemlock) were each found among at least 30% of the corner and section line trees. The deter-mination of the relative percentages of individ-ual species was a subjective determination of the map interpreter. We made the distinction between forest and savanna primarily by using the distance informa-tion from individual witness trees. Because sur-veyors needed to use trees close to the section corner post, the distance from those trees to the post can be used to indicate the typical distance between trees (Anderson and Anderson 1975). Typically, when distance measures increased beyond 75 links (about 50 ft.) for both trees from opposing quadrants, there was an open for-est canopy. When two or more adjacent section corners or half mile points included distances greater than 75 links, the area was coded as sa-vanna and boundaries were established. Survey-ors used a variety of names for savannas, some of which were misleading and used inconsis-tently. Terms included “opening,” “barrens,” and “plains.” Because the distance information from section corners provided the most objective information, it was used to over-rule more sub-jective surveyor’s descriptions, when the two were in contradiction. We coded wetlands according to the same method as uplands where they were large enough to include several section corners. Smaller wetlands were often called “cedar swamp,” “tamarack swamp,” or “wet prairie,” by surveyors, and we coded them as such. Small wetlands falling entirely within sections were coded based on an interpretation of sur-rounding wetlands and the basins where they occurred. Mapped wetlands were also graded accord-ing to the type of changes that were apparent from the topographic maps (Table 2). A grade code was assigned to each wetland. The wetland grade codes include: • I for intact; signifying a well buffered
(>300 feet of relatively intact vegetation on all sides), undisturbed wetland;
• D for degraded; signifying an incomplete upland buffer;
• M for manipulated; signifying some man-made alteration that could affect the hydrol-ogy of the wetland, e.g. roads, drains, up-stream impoundment;
• E for eliminated; signifying the apparent complete (or nearly complete) destruction of the wetland, also applied to drained marshes that are now apparently upland.
The only exception to this practice was where surveyors noted in more general terms where the wetland occurred (“last mile, wet and swampy...”), typically limited to areas of flat glacial lake plain. We felt that it was important to distinguish wetlands where our interpretation of wetland boundaries was based on this much more general information. These areas are coded as wetlands (414 or 423 typically) and can be distinguished on the map by their lack of a wet-land grade. Digital Map Production Once cover type boundaries were interpreted and assigned codes, the maps were proofed and then digitized using Intergraph MicroStation software. Both cover type boundaries and asso-ciated codes were digitized. To avoid cluttering the final digitized maps, surveyors comments were included (in quotes) only where they added significant information. For many upland cover types, a tree species list, ranked in order of rela-tive abundance, was included in one or two loca-tions within each township to reflect the relative composition of tree species. A similar approach was utilized for large wetlands. An example in this case would be a large swamp dominated by three conifer species. This area would be given a three digit code 423 (indicating mixed lowland conifer), and a ranked list of those species would appear as text. During the digitizing process, current cover type maps from the Michigan Resource Informa-tion System (MIRIS) were occasionally utilized for direct comparisons with the historical inter-pretations. We did this primarily in coastal wet-lands of the Lower Peninsula where small wet-lands fell mostly within section lines. If there was a difference between historical interpreta-tion and current cover type for those wetlands that were traversed by surveyors (those inter-
Michigan’s Presettlement Vegetation
12
secting section lines), the historical interpreta-tion was maintained. For apparently intact wet-lands occurring entirely within the interior por-tions of a section, the MIRIS interpretation was sometimes used to code the map. In these cases, adjacent to the wetland code, the (MIRIS) nota-tion was added to indicate the source of that in-formation. The same procedure was used to in-dicate where other information sources, such as the National Wetlands Inventory (NWI) maps, were utilized. Several other historical maps were utilized in southeast Michigan. The au-thors and dates of those maps are indicated in those cases.
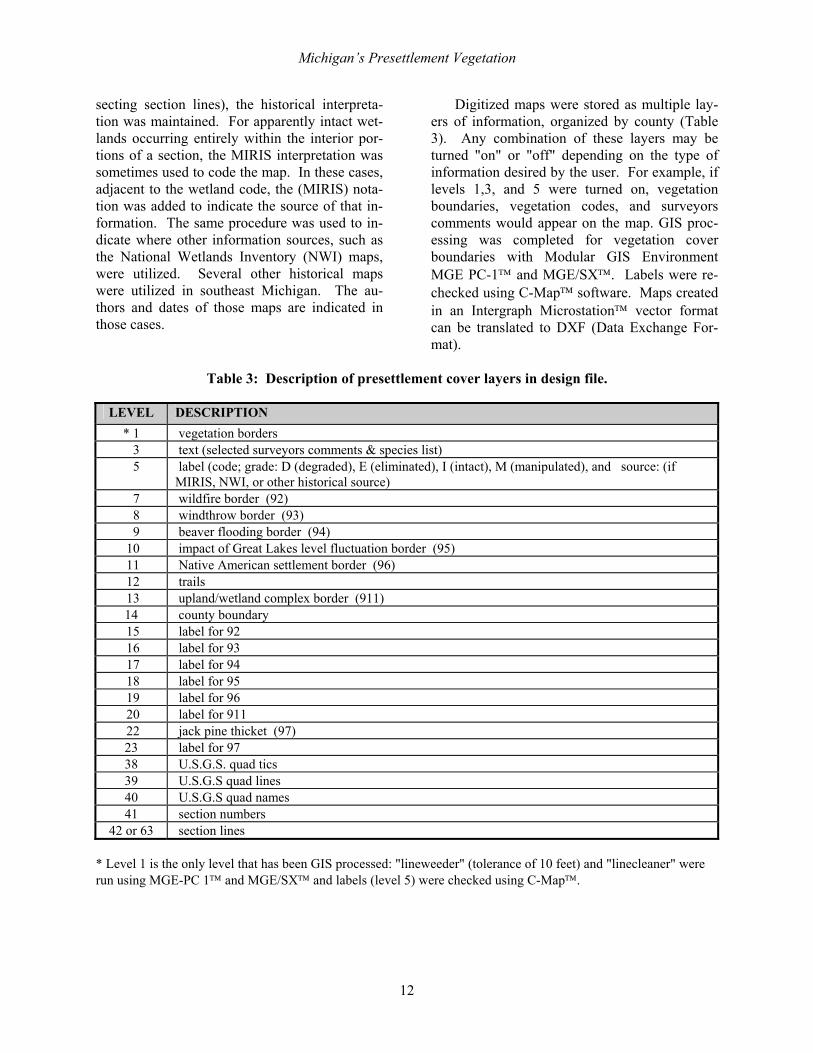
Digitized maps were stored as multiple lay-ers of information, organized by county (Table 3). Any combination of these layers may be turned "on" or "off" depending on the type of information desired by the user. For example, if levels 1,3, and 5 were turned on, vegetation boundaries, vegetation codes, and surveyors comments would appear on the map. GIS proc-essing was completed for vegetation cover boundaries with Modular GIS Environment MGE PC-1 and MGE/SX. Labels were re-checked using C-Map software. Maps created in an Intergraph Microstation vector format can be translated to DXF (Data Exchange For-mat).
Table 3: Description of presettlement cover layers in design file.
LEVEL DESCRIPTION
* 1 vegetation borders 3 text (selected surveyors comments & species list) 5 label (code; grade: D (degraded), E (eliminated), I (intact), M (manipulated), and source: (if
MIRIS, NWI, or other historical source) 7 wildfire border (92) 8 windthrow border (93) 9 beaver flooding border (94) 10 impact of Great Lakes level fluctuation border (95) 11 Native American settlement border (96) 12 trails 13 upland/wetland complex border (911) 14 county boundary 15 label for 92 16 label for 93 17 label for 94 18 label for 95 19 label for 96 20 label for 911 22 jack pine thicket (97) 23 label for 97 38 U.S.G.S. quad tics 39 U.S.G.S quad lines 40 U.S.G.S quad names 41 section numbers
42 or 63 section lines * Level 1 is the only level that has been GIS processed: "lineweeder" (tolerance of 10 feet) and "linecleaner" were run using MGE-PC 1 and MGE/SX and labels (level 5) were checked using C-Map.
Michigan’s Presettlement Vegetation
13
DISCUSSION Surveys as a Data Source: There are limitations associated with the use of the General Land Office surveys that should be clear to all users of presettlement vegetation maps. Given that these surveys were not under-taken as a scientific sample of vegetation, they should not be considered as such. However, they do provide a wealth of detailed information available nowhere else. There have been a number of discussions of surveyor’s bias in their selection of witness trees (Delcourt & Delcourt 1974, Delcourt & Delcourt 1977, Grimm 1984). The selection of witness trees was undoubtedly “biased” to some degree for practical reasons. Surveyors needed to find easily marked trees that aided the later relocation of the section cor-ner post that they had pounded into the ground. Their instructions indicated that they should choose long-lived trees greater than four inches in diameter for marking. However, this obvious source of “bias” was severely limited by the number of trees that were also immediately ad-jacent to the corner post. Surveyors could not, for very practical reasons, travel very far to mark a more preferred tree, because they would defeat the purpose of marking a “witness.” One should assume that easily marked, long-lived species such as American beech, northern-white cedar, and white oak were used more often than their actual frequency on the landscape. Shorter-lived species, such as aspens and paper birch, or typically small diameter species, such as speck-led alder, sassafras, and hop hornbeam, were used less often than their actual frequency. We used records from the original surveys where they had been found to be adequate by the Surveyor General. There was a number of townships re-surveyed because the original sur-veys were found to be either very inaccurate or completely fraudulent. In these cases, we used the records from the re-surveys completed dur-ing the 1840s and 1850s. These survey records were found to be quite reliable, since their stated measurements corresponded quite well with fea-tures on current topographic maps.
Historical Context Given that the presettlement vegetation map depicts a “snapshot in time” taken at the time of the surveys, it is important to place the map within the context of the times when the surveys were conducted. Aspects of long-term climatic cycles, Native American activities, and the European fur trade, all had the potential to influ-ence natural patterns on the landscape traversed by surveyors in the nineteenth century. Climate: There are numerous studies of the changes in climate and its influence on vegeta-tion that have occurred in the Great Lakes region since the last glaciation (Webb et al. 1993). The mosaic of vegetation described by surveyors was one that had been influenced by multiple cli-matic cycles, ranging from tens to thousands of years. While long-term climate changes were obviously important to the migration of species, shorter-term cycles in temperature, humidity, and precipitation probably had significant ef-fects at the local level by varying the frequency of natural disturbance processes such as wildfire and flooding. These factors also influenced the rate of vegetative succession following natural disturbances. Generally, temperatures increased steadily during the first 9,000 years following the last glacial maximum. Maximum warmth and dry-ness was reached 6,000 years ago in the Mid-west, with July temperatures 1-2° F greater than today (Webb et al. 1993). It is likely that many plant communities most associated with wild-fires, such as dry prairies, pine barrens, and oak savannas, reached their maximum extent in Michigan at that time. Since then, there has been a slight decrease in average temperature and increase in humidity (Webb et al. 1993). The “Little Ice Age,” from roughly 800-600 years before present, was a shorter-term interval of cool and arid climate. It was characterized as having reduced summer precipitation and en-hanced westerly winds in winter. It is possible that it affected fire regimes, by increasing the probability of “dry lightning” during the cool, dry summers. While, as a general rule, the dis-tribution of vegetation lags behind climatic trends, the pattern of vegetation described by surveyors in the nineteenth century reflected, in
Michigan’s Presettlement Vegetation
14
large part, the climatic regime of the previous 2-4,000 years (Webb et al. 1993). Native American Activities: Native Americans certainly played a role in shaping the mosaic of vegetation that surrounded their principle cen-ters of activity. However, it is important to con-sider both the various ways their activities influ-enced vegetation, and how that influence varied in location and intensity over time. An excellent overview of existing knowledge on Native Americans in the Great Lakes region is found in Tanner (1987). Much of the following discus-sion is derived from that source. Archeological evidence indicates that early human inhabitants of Michigan fall into the Woodland Culture, which apparently entered the state as glaciers receded. Their numbers and character changed over time with the influx of immigrants from the Atlantic coast and with al-liances with cultures further west and south. Subsistence activities among Native Americans in the Michigan fell into four general categories: tending domesticated plants, fishing, hunting, and collecting wild rice. Fishing and collecting wild rice was most common in the marshes and waters off of the Upper Peninsula, and probably had minimal influence on vegetation. Clearing fields for domesticated crops was most concen-trated in the southern half of the Lower Penin-sula, but took place wherever the growing sea-son reached about 120 days. Hunting took place throughout the state, sometimes involving fires set to herd animals toward a harvesting zone (Whitney 1994). Fire was apparently also used to maintain trails and forest openings to ease travel, encourage wild food plants, fertilize cropped land, and remove cover for potential enemies (Driver and Massey 1957, Chapman 1984, Albert and Minc 1987). The relative in-fluence these practices had on Michigan’s land-scape was most likely in proportion to the con-centration of native populations that used them. Tanner (1987) estimated approximately 14,000 Native Americans resided in Lower Michigan in 1830. They were found in 131 villages mostly concentrated along the St. Joseph, Kalamazoo, Grand, Shiawassee, Saginaw, and St. Clair riv-ers. Ottawa tribes were most common on the west side of the peninsula, from the Kalamazoo
River north to the straits area. Ojibwa tribes were dominant near Lake St. Clair, Saginaw Bay, and along Lake Huron extending into the Upper Peninsula. Potawatomi were mostly found in southwest Lower Michigan, extending into the Chicago region. We can assume that Native American’s in-fluence on vegetation varied as populations and land management practices varied over time. Disruptions in Native American populations within a century prior to the surveys could have affected what surveyors saw and described. Tribal disruption during the Iroquois Wars of the seventeenth century was stimulated in part by friction over the fur trade, and is said to have reduced much of the Great Lakes region to a “No Man's Land” (Mason 1981), but this is dif-ficult to verify. Although most of the fighting took place outside of Michigan, tribal disloca-tions did occur around Detroit, Niles, Michili-mackinac, and Sault Ste. Marie (Tanner 1987). Epidemics brought by Europeans also had a dis-astrous impact on native populations. Smallpox, whooping cough, and typhoid were among some of the diseases that wiped out villages around Detroit, Lake St. Clair, Saginaw Bay, and Mi-chilimackinac during the seventeenth and eight-eenth centuries. The decade of the 1830s was particularly notable for the sudden rise in Euro-pean population and a rapid series of treaties involving land cessation and movement of Na-tive American populations (Tanner 1987). Because Native American population den-sity, farming, and hunting were most concen-trated in the southern Lower Peninsula, it can be assumed that Native American influences were greatest in that area. It is at least possible that some of the burned areas that surveyors recorded in northern portions of the state had their origin in Native American hunting activities. Fur Trade: Fur-bearing animals play a variety of roles in Michigan’s ecosystems, so we should assume that the impact on fur-bearer populations brought about by the early European fur trade may have had some effect on the landscape be-ing described by surveyors in the nineteenth century. Unfortunately, any realistic estimate of the actual impact of the fur trade is all but im-possible to establish. But, it is helpful to keep
Michigan’s Presettlement Vegetation
15
the relative impact of the fur trade in mind while using presettlement vegetation maps. It could be said that the European fur trade began in Michigan in 1635 with the first visit to the Straits of Mackinac by Nicolet. In 1660, Radisson and Groseiliers returned to Montreal from Michigan with 60 canoes full of fur (Bradt 1947). Over the years, intense competition de-veloped involving the French “coureurs de bois,” English, American, and Native American tribes, often causing violent conflicts, and result-ing in a severe depletion in fur-bearer popula-tions. The fur trade involved a variety species. A 1796 ledger from Michilimackinac gives some idea of the variety of furs being traded at the time: “...sold 99 packs composed of 5 bears, 5 pound beaver, 10 fishers, 58 cats, 74 doe, 78 foxes, 108 wolves, 117 otters, 183 minks, 557 bucks, 1,231 deer, 1,340 muskrats, and 5,587 racoons” (Johnson 1971). From the standpoint of impact on the land-scape, the beaver population should have been by far the most significant, so this would be the species for which the depletion in populations most likely altered the landscapes later described by surveyors. We will never know just how many beaver lived within Michigan prior to the fur trade, but estimates of fur traders catch gives us some notion. In 1767, for example, 50,938 beaver skins were shipped through Michili-mackinac (Lart 1922). The trade in beaver pelts was still on the rise at that time, so considerably more were likely taken in later years. Principle fur trading posts in Michigan were at Michili-mackinac, Sault Ste. Marie, Detroit, Grand Rap-ids, and Niles. Since Michilimackinac was the principle trading post for the entire Upper Great Lakes region, we must assume that many pelts passing through there were actually taken from Wisconsin and beyond. The range-wide decline in beaver populations occurred throughout the nineteenth century, causing the prices of pelts to increase. In 1920, Michigan’s beaver trapping season had to be closed to allow populations to recover (Bradt 1947). As for the actual influence beavers had on Michigan’s native vegetation, we can only speculate. Bela Hubbard considered beaver to be the principle cause for the development of
wet prairies in the Detroit area (Hubbard 1887). We now know this to be an overstatement, given the importance of the hydrology on the sand lake plain, and the fragments of prairie on the lake plain today (Comer et al. 1995b). However, they may have played some role in creating what surveyors described as “wet prairie” and “marsh” throughout the southern Lower Penin-sula. Further north, it is possible that the decline of beaver populations impacted the relative abundance of aspen-dominated wetlands in the years leading up to the surveys. Technical Aspects of Digital Maps Cover type boundaries should be assumed to be most reliable where they intersect section lines. The interpolated boundary line between each section line should be considered an ap-proximation that could differ on the ground de-pending on local variation not apparent on to-pographic maps. Upland and wetland boundaries in interior sections should be most accurate where topography is abrupt. Given the scale of survey data, we were unable to represent much of the small-scale variation one normally en-counters in natural environments. One should assume that wetlands which naturally occur as relatively small, complex shapes, totaling less than 50 acres in area, are under-represented in these maps. The accuracy of aerial coverage should be assumed to increase with the typical natural size of the unit. The aerial coverage of smaller vegetation units, such as alder-willow swamp, emergent marsh, and beaver floodings are most likely underestimated. Because aspen-birch forest often resulted from windthrows smaller than 50 acres, they too are probably slightly under-represented in the map. The cover type codes, when taken to the fourth digit, should be interpreted by the user to indicate the most abundant tree species of the area, not the only tree species present. Users should consult with published materials and local experts for expanded plant and animal species lists which would likely be associated with the specific vegetation type.
Michigan’s Presettlement Vegetation
16
Acknowledgements
We would like to express our thanks to the Water Division of the U.S. Environmental Protection Agency, the Wildlife Division, the Coastal Management Program, Land and Water Management Division, and the Saginaw Bay Watershed Initiative of the Michigan Department of Natural Resources, the Michigan Department of Military Af-fairs, and the Hiawatha National Forest, all of which provided funding for this project. We also thank the Michigan Resource Information System for their efforts in digitizing coastal maps, and for access to their current land cover data. A sincere thanks also goes to Dr. Leroy Barnett, Dave Johnson, and staff of the State Archives of Michigan for their good humor and devotion to service while making historical records available to us in a most accommodat-ing fashion. Thanks also to Larry Brewer, who donated working maps from his earlier work in western Lower Michigan, and Historical Consultant, Dennis Au for his helpful comments on Monroe County historical records. A special thanks must also go posthumously to Deputy Land Surveyors and their crews, whose pioneering labors, and detailed records, from the Michigan wilderness made this reconstruction possible.
References Albert, D.A. & L. D. Minc. 1987. The Natural Ecology and Cultural History of the Colonial Point Red Oak Stands. Tech. Report No. 14. University of Michigan Biological Station. 80 pp. Anderson, R.C. & M.R. Anderson. 1975. The presettlement vegetation of Williamson County, Illinois. Castanea 40: 345-363. Bourdo, E. A., Jr. 1956. A Review of the General Land Office Survey and of its Use in Quantitiative Studies of Former Forests. Ecology 37(4) pp.754-768. Bradt, G.W. 1947. Michigan Beaver Management. Michigan Department of Conservation, Game Division. 56 pp. Brewer, L.G., T.W. Hodler, and H.A. Raup. 1984. Presettlement Vegetation of Southwestern Michigan. Western Michigan University. Kalamazoo, MI. 1 map. Caldwell, N.C. (Ed.) 1990. Special Instructions to Deputy Surveyors in Michigan. 1808-1854. Michigan Museum of Surveying, Lansing, MI. Chapman, K.A. 1984. An Ecological Investigation of Native Grassland in Southern Lower Michigan. M.S. thesis, Western Michigan Univerisity, Kalamazoo, MI. 235 pp. Comer, P.J., W A. MacKinnon, M.R. Penskar, & M.L. Rabe. 1995. A Survey of Lakeplain Prairie in Michigan. Final report to the Coastal Management Program, Michigan Department of Natural Resources. Michigan Natural Features Inventory. Lansing MI 48909. 232 pp. Comer, P.J. & D.A. Albert. 1993. A Survey of Wooded Dune and Swale Complexes in Michigan. Final report to the MDNR Coastal Management Program. Michigan Natural Features Inventory. Lansing MI 48909. 159 pp. Delcourt, P.A., & H.R. Delcourt. 1981. Vegetation Maps of Eastern North America: 40,000 yrs. B.P. to the present. In: R. Romans (Ed.), Proc. 1980 Geobotany Conference, Plenum, New York, pp.123-166. __________. 1977. Presettlement Magnolia-Beech Climax of the Gulf Coastal Plain: Quantitative Evidence From The Apala chicola River Bluffs, North -Central Florida. Ecology. 58 pp.1085-1093. __________. 1974. Primeval Magnolia-Holly-Beech Climax in Louisiana. Ecology. 55 (3) pp. 638-644. Driver, H.E. & W.C. Massey. 1957. Comparitive Studies of North American Indians. Transactions of the American Philoso-phical Society. 47:(2):165-449. (In Whitney, G.G. 1994. From Coastal Wilderness to Fruited Plain: A History of Environmental Change in North America 1500 to Present. Cambridge University Press. 451 pp.) General Land Office. 1816-1856. 1890 Transcriptions of Surveyors Field Notes for Michigan. State Archives of Michigan. Grimm, E.C. 1984. Fire and other factors controlling the Big Woods vegetation of Minnesota in the mid-nineteenth century. Ecological Monographs. 54(3): 291-311.

Michigan’s Presettlement Vegetation
17
Hubbard, B. 1887. Memorial of a Half-Century. New York: G.P. Putnam's Sons. Hutchison, M. 1988. A Guide to Understanding, Interpreting, and Using the Public Land Survey Field Notes in Illinois. Natu-ral Areas Journal. Vol.8(4). pp. 245-255. Johnson, I.A. 1971. The Michigan Fur Trade. Grand Rapids. The Black Letter Press. Jones, C.L. & R.O. Kapp. 1972. Relationship of Bay County Michigan Presettlement Forest Patterns to Indian Cultures. The Michigan Academician, Summer, 1972. pp.17-28. Lart, C.E. Fur-trade returns. Canadian Historical Review 3:351-358 (In Whitney, G.G. 1994. From Coastal Wilderness to Fruited Plain: A History of Environmental Change in North America 1500 to Present. Cambridge University Press. 451 pp.). Mason, R.J. 1981. Great Lakes Archeology. Academic Press. New York. 224 pp. Michigan Natural Features Inventory. 1990 Draft Descriptions of Michigan Natural Community Types. Lansing, MI 48909. 29 pp. ________. 1989. A survey of Great Lakes marshes in the northern half of Michigan's Lower Peninsula. Report to the MDNR Coastal Management Program. 124 pp. ________. 1988. A survey of Great Lakes marshes in the southern half of Michigan's Lower Peninsula. Report to the MDNR Coastal Management Program. 116 pp. ________. 1987. A survey of Great Lakes marshes in Michigan's Upper Peninsula. Report to the MDNR Coastal Management Program. 73 pp. Tanner, H.H. (ed.) 1987. Atlas of Great Lakes Indian History. Univ. Oklahoma Press. 224 pp. Trygg, J. W. 1964. Composite Map of the United States Land Surveyor's Original Plats and Field Notes. 10 maps (scale 1:500,000). Veatch, J. O. 1959. Presettlement Forest in Michigan. Department of Resource Development, Michigan State University, East Lansing, MI. 2 maps (scale 1:500,000). Webb III, T., P.J. Bartlein, S.P. Harrison, & K.H. Anderson. 1993. Vegetation, Lake Levels, and Climate in Eastern North America for the Past 18,000 Years. In: (ed) H.E. Wright Jr., J.E. Kutzbach, T. Webb III, W.F. Ruddiman, F.A. Street- Per-rott, & P.J. Bertlein. Global Climates since the Last Glacial Maximum. University of Minnesota Press. pp. 415-467. White, C. A. 1984. A History of the Rectangular Survey System. Bureau of Land Management, U.S. Department of Interior, Washington D.C. Whitney, G.G. 1994. From Coastal Wilderness to Fruited Plain: A History of Environmental Change in North America 1500 to Present. Cambridge University Press. 451 pp.


![[Vegetation and Remote Sensing] Vegetation](https://img.pdfslide.net/doc/110x75/577cdfd71a28ab9e78b21a32/vegetation-and-remote-sensing-vegetation.jpg)