Embed Size (px)
Citation preview

VEHICLE ATTRIBUTE FORECASTS
K.G. DuleepPresident, H-D SystemsAn ICF International AffiliateSeptember 9, 2011 CEC Workshop

CEC Light Duty Vehicle Fuel Demand Forecasting
CEC uses a consumer choice model that utilizes vehicle attributes as inputs. The choice model selects among available vehicle types in a given forecast year based on consumer preference for the attributes.Vehicle attributes for the forecast period must be provided to the model at the vehicle size class and fuel type level.Currently inputs are required for 15 different car/ light truck classes and 4 fuel types, plus hybrid and plug-in hybrid.
Vehicle Supply ModelModel developed by EEA in late 1980s to forecast vehicle attributes in response to changing economic scenarios and regulatory requirements. Similar model is used by the National Energy Modeling System.Model simulates manufacturer decision making on what new products to offer under a given scenario of fuel price, income and regulations.At the current time, the supply and demand models communicate only indirectly

Vehicle ClassesEach vehicle size class represents a homogenous group from a consumer perspective.6 car classes include sub-compact, compact, intermediate, large, sport and small tall wagon Three classes of SUV models- compact, midsize and large – further divided by unibody/ BOF.Two classes of vans and pickup trucks, compact and standard. Standard vans and all pickup are primarily cargo vehicles.Fuels include gasoline, diesel, ethanol, CNG and electricity

Vehicle Attributes for ForecastPrimary attributes required by vehicle choice model are vehicle price, fuel economy and performance at size class levelPerformance metrics include 0 - 60 mph acceleration time, gradability (speed over hill climb) and range (mpg x tank size).Maintenance cost and number of vehicle makes and models also required. The latter variable shows diversity of choices available to the consumer within each class.All attributes forecast at vehicle class/fuel type.

Forecasting ApproachOverall approach is based on manufacturers using new technology to upgrade vehicle attributes in the future.Detailed knowledge of future vehicle technology improvements includes technology impact on vehicle cost, performance and fuel economy relative to baseline vehicle.In a competitive industry, retail price is cost driven as no manufacturer can extract rents.Hence, forecasting depends on our knowledge about future technologies and their timing.

Technology Data Collection Methodology
Since technology characteristics are key to the forecast, technology tracking and analysis must be as detailed and current as possible. We monitor technology developments worldwide through the trade press and key international conferences.Preliminary analysis of potential based on research papers and prototype data.Extensive follow up on technology attributes and lead time with manufacturers and Tier I suppliers.All cost data obtained from high level contacts at Tier I suppliers, who are now major technology developers.Data validated against other studies such as those by the National Academy and MIT. Recent studies by EPA and ARB with very different results are also examined.

Technology Adoption AlgorithmAdoption algorithm is based on manufacturers using the lowest cost strategy to meet future requirements.Technology benefits based on NPV of fuel savings to the consumer over 4 years, typical of new car ownership.Additional benefits accrue to the manufacturer from avoiding any penalties associated with not meeting fuel economy and GHG standards.Cost benefit ratio dictates the rate of technology adoption as well as ultimate market penetrationCost of fuel directly impacts technology adoption path, but high CAFE/ GHG standards can over-ride the fuel cost related impacts.Incomes affect choice of engines (HP) within class.

Short Term Engine Technologies
Improvements to conventional engines are generally the most cost effective first steps in improving fuel economy.Short term improvements are well understood but longer term potential is emerging.Technologies in the pipeline now- Variable Valve Lift ( 2-step/ continuous)- Gasoline Direct Injection with CR increased by ~2 points (lean burn longer term for US)- Cylinder cutout ( V6/8 only)- Turbo- GDI- VVT combination- Reduced Engine Friction

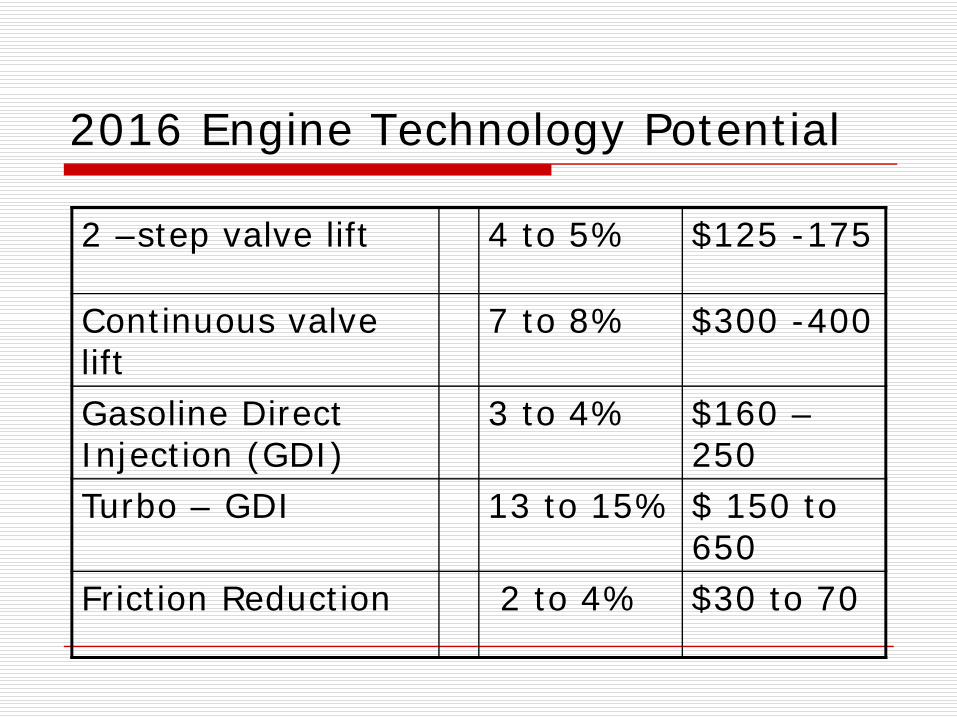
2016 Engine Technology Potential
2 –step valve lift 4 to 5% $125 -175
Continuous valve lift
7 to 8% $300 -400
Gasoline Direct Injection (GDI)
3 to 4% $160 –250
Turbo – GDI 13 to 15% $ 150 to 650
Friction Reduction 2 to 4% $30 to 70

2030 Engine Technology Potential
“Half cam-less” engine
15 – 16% $400 to 600
HCCI with GDI 19 – 22% $1000 to 1500
Advanced friction reduction
4 to 6 % ~$100
GDI lean burn 17 to 19 %
$1000 to 1500
Combination with turbo
~ 25% ? ~ $1500
Transmission TechnologyWhile more gear ratios and wider ratio range allows better matching of engine to load, reduction of internal losses (especially in the torque converter) is also important.Future transmission options seem to be shaping up as follows:- Six/Seven speed automatics for RWD and larger FWD cars- CVT for smaller FWD cars and small trucks- AMT (6-/ 7-speed) for sporty cars.

Reducing Vehicle Energy Demand
Weight reduction is possible but quite expensive. While up to 20% weight reduction is technically possible, only 5 to 10% may be practical at reasonable cost ~ $50 per percentDrag and rolling resistance reductions of 10 to 20% can be achieved by 2020.Driving the accessories electrically is more efficient than belt drive, since accessories can be used ‘on-demand’. Electric Power Steering and Water Pump are the most effective.

Hybrid SystemsBAS systems using existing 14V electrical system can be cheap but it will provide limited FC reduction, ~ 15%The Toyota system can be very efficient with FC reduction approaching 40% but has the disadvantages of high price, ~US$5000One- motor systems of the Honda IMA type could be more cost effective than other types while offering significant FC reduction, ~25%.Our forecast is based on one motor type systems as it is the most cost effective.

Electric VehiclesLi-Ion Battery technology has now advanced to the point where 200+km range is possible, but cost is still high.Costs for both Battery Electric Vehicles and Plug-in hybrid vehicles are driven largely by battery costs. Based on our research for the EU and DOE, battery costs for the future include consideration of cost reduction by learning and scale expansion.Since supply and demand models do not communicate, scale is based on estimated national requirements of the ZEV mandate,- we assume that the mandate overrides the free market choice levels.With the newly proposed CAFÉ standards of 54.5 mpg in 2025, hybrid and EV/PHEV penetration will b driven more by mandated requirements than be market driven

Diesel Costs and BenefitsCurrent diesel engines add $1500 (4 cyl.) to 3000 (V-8) for the engine alone and another $700 to $1200 for emissions after-treatment.FE can be increased by 30 to 35% in combination with other changes.Diesels have only recently shown ability to comply with existing CA tailpipe emission standards, but future standards may impose larger costs of compliance (not in model)Diesel market in the US seems to be fading with rapidly rising diesel fuel prices.

Fuel Cell VehiclesFuel cell vehicles currently not represented in model for two reasons.First, evolution of hydrogen fuel supply infrastructure and refueling infrastructure is difficult to forecast within existing CEC model .Second, cost of fuel cells and hydrogen storage on board the vehicle are still major issues, so forecast that assumes low costs is problematic.Many manufacturers and the current administration are backing away from FCV in the light of focus on battery electric vehicles.

$/Percent FC Reduction: Midsize Car with 25mpg On-road Base
2016 2025
Conventional Tech 35 to 50 30 to 40
Advanced Conventional
NA 50 to 60
IMA Hybrid/ Diesel 100- 110 75 – 80
Full Hybrid 140 – 160 80 – 100
PHEV 200+ ~130
CAFE and GHG StandardsFuel Economy and GHG standards are set to 2016, and standards to 2025 are to be released shortly. Some of the scenarios run so far have only the 2016 standards incorporated.The 2016 standards can be met largely with conventional technology, requiring only a modest increase in hybrid vehicle penetration.2025 standards have been announced (54.5 mpg) but the actual number for compliance may be much lower due to various credits. A large increase in hybrid/EV penetration will likely be required.The ZEV mandate will independently force PHEV and EV penetration, so the supply model posits a large number of new vehicle introductions

Low Carbon Fuels StandardCompliance with LCFS is another issue where there is co-ordination between supply and demand models externally.Staff have modeled compliance largely with ethanol (E85) but not with CNG or other fuels.Supply model therefore continues to estimate CNG vehicle costs based on low volume niche market sales.On the other hand, flex fuel model availability continues to expand in the forecast even with the phase out of CAFE credits after 2016

High Fuel Price, 35 mpg CAFE

Impact of fuel prices with 35 mpg CAFE