Embed Size (px)
Citation preview
Suite 1-6, D72 Building, 72 Dominion Rd Mt Eden, Auckland 1024
+64 9 629 1435 www.emissionimpossible.co.nz
Prepared for
NZ Transport Agency
April 2017
VEPM 5.3
Vehicle Emission Prediction Model update: Technical report
Authors: Jayne Metcalfe, Surekha Sridhar
Organisation: Emission Impossible Ltd
Date: April 2017
Peer reviewer: Shanju Xie, Auckland Council
Recommended Citation:
Metcalfe, J & Sridhar, S (2017). VEPM 5.3 Vehicle Emission Prediction Model update: Technical report. Report for New Zealand Transport Agency prepared by Emission Impossible Ltd, April 2017.
Acknowledgements
Funding for this update of VEPM was provided by NZ Transport Agency, Ministry for the Environment and Auckland Council. The authors would like to thank Stuart Badger (Ministry of Transport) for providing updated fleet and country of origin data, and Shanju Xie (Auckland Council) for his peer review.
Vehicle Emissions Prediction Model technical update Technical report
Page | i
Executive summary
The NZ Transport Agency commissioned an update of key assumptions and emission factors in Vehicle Emission Prediction Model (VEPM), which was last updated in 2012 (EFRU, 2012). These include:
Updating the fleet
Incorporating nitrogen dioxide (NO2) in VEPM
Updating emission standards that are assumed for vehicles entering the fleet
Updating country of origin assumptions
Updating emission factors for Euro 5, 6 and V
Adding EURO VI emission standards
The vehicle fleet was updated based on updated vehicle kilometres travelled (VKT) data from the Vehicle Fleet Emission Model (VFEM) provided by Ministry of Transport. VFEM data up to 2014 is based on analysis of historical fleet and travel data as reported in the Annual Fleet Statistics 2014 (MoT, 2014).
Projected default fleet weighted emission factors in VEPM 5.3 are slightly lower than VEPM 5.1 after 2030 due to:
Changes in Ministry of Transport vehicle fleet projections; and
The incorporation of Euro VI and V emission factors for heavy duty vehicles (HDVs).
However, in general, the fleet weighted emission factors from the updated VEPM 5.3 are similar to VEPM 5.1.
Vehicle Emissions Prediction Model technical update Technical report
Page | ii
Contents
Executive summary ............................................................................................................................. i
1.0 Introduction ............................................................................................................................ 1
1.1 Background and scope 1
1.2 Purpose and scope of this report 1
2.0 Method ................................................................................................................................... 2
2.1 Vehicle fleet 2
2.1.1 Updated vehicle fleet 3
2.1.2 Overall fleet breakdown 3
2.1.3 Detailed fleet breakdown 5
2.2 Incorporating NO2 in VEPM 6
2.3 Emission standards and country of origin 7
2.4 Emission standards date of introduction 8
2.5 Emission factors 10
2.5.1 Heavy vehicle weight categories 12
3.0 VEPM 5.1 versus VEPM 5.3 .................................................................................................... 12
3.1 Effect on fleet weighted emission factors 12
3.1.1 Discussion of the fleet weighted emission factor comparison 15
3.2 Light duty diesel NOx emission factors 16
3.3 NO2 emission factors 17
4.0 Future updates ...................................................................................................................... 18
5.0 Conclusions ........................................................................................................................... 18
References ....................................................................................................................................... 20
Vehicle Emissions Prediction Model technical update Technical report
Page | 1
1.0 Introduction
1.1 Background and scope
The Vehicle Emissions Prediction Model (VEPM) was developed by the NZ Transport Agency (hereafter referred to as the Transport Agency) and Auckland Council to predict emissions from vehicles in the New Zealand fleet under typical road, traffic and operating conditions. The model provides estimates suitable for air quality assessments and regional emissions inventories.
VEPM requires a detailed breakdown of kilometres travelled by the fleet. Fleet weighted emission factors are calculated by multiplying the emissions factors in g/km for each vehicle class by the proportion of kilometres travelled by that class for any given year.
The Transport Agency commissioned Emission Impossible Ltd to update key assumptions and emission factors in VEPM, which was last updated in 2012. 1 These include:
Updating the fleet
Incorporating nitrogen dioxide (NO2) in VEPM
Updating emission standards that are assumed for vehicles entering the fleet
Updating country of origin assumptions
Updating emission factors for Euro 5, 6 and V
Adding Euro VI emission standards
1.2 Purpose and scope of this report
This technical report:
Provides details of the vehicle fleet update
Describes the incorporation of NO2 in VEPM 5.3
Describes the update to emission standards and country of origin assumptions, and
Summarises the differences in fleet weighted emission factors between VEPM 5.1 and VEPM 5.3.
Further information and technical reports relating to development of the Vehicle Emission Prediction Model are available on the Transport Agency’s Highways Information Portal website.2
1 Vehicle emissions prediction model (VEPM) version 5.1, Energy and Fuels Research Unit, Auckland
University (2012)
2 https://www.nzta.govt.nz/roads-and-rail/highways-information-portal/technical-disciplines/air-
quality-climate/planning-and-assessment/vehicle-emissions-prediction-model/
Vehicle Emissions Prediction Model technical update Technical report
Page | 2
2.0 Method
2.1 Vehicle fleet
Fleet weighted emissions are calculated in VEPM by multiplying the emissions factors in g/km for each vehicle category by the proportion of vehicle kilometres travelled (VKT) by that category for a defined year.
The vehicle categories include:
Light duty vehicles (LDVs)
Cars
Petrol cars (<1.4L, 1.4L to 2L, and >2L)
Diesel cars (<2L and > 2L)
Hybrid cars
Plug in hybrid cars
Electric cars (brake and tyre wear emissions only)
Light commercial vehicles (LCVs)
Petrol LCVs
Diesel LCVs
Hybrid, plug in hybrid and electric LCVs are assumed to have equivalent emissions to hybrid, plugin hybrid and electric cars
Heavy duty vehicles (HDVs)
Buses
All buses are assumed to have equivalent emissions to HCVs in VEPM
Heavy commercial vehicles (HCVs)
Diesel HCVs
Broken down by gross vehicle weight
These categories are further broken down by:
year of manufacture
whether the vehicle was sold new in New Zealand or a used import
country of origin
Vehicle kilometres travelled (VKT) and country of origin data is used in VEPM to calculate the proportions of VKT travelled for each vehicle category.
Vehicle Emissions Prediction Model technical update Technical report
Page | 3
2.1.1 Updated vehicle fleet
Updated VKT data from the Vehicle Fleet Emission Model (VFEM) was provided by Ministry of Transport (MoT) for all years from 2001 to 2040 broken down by:
vehicle type,
fuel type,
engine capacity,
year of manufacture,
and whether the vehicle was sold new in New Zealand or was a used import.
VFEM data up to 2015 is based on analysis of historical fleet and travel data as reported in the Annual Fleet Statistics 2014 (MoT, 2014). It should be noted that, the default fleet data (% VKT for each vehicle category) provided for this update (VEPM 5.3) is different to the default fleet data provided for VEPM 5.1 due to changes in the Ministry of Transport’s analysis methodology (MoT, 2016). This includes historical VKT data from 2001 onwards.
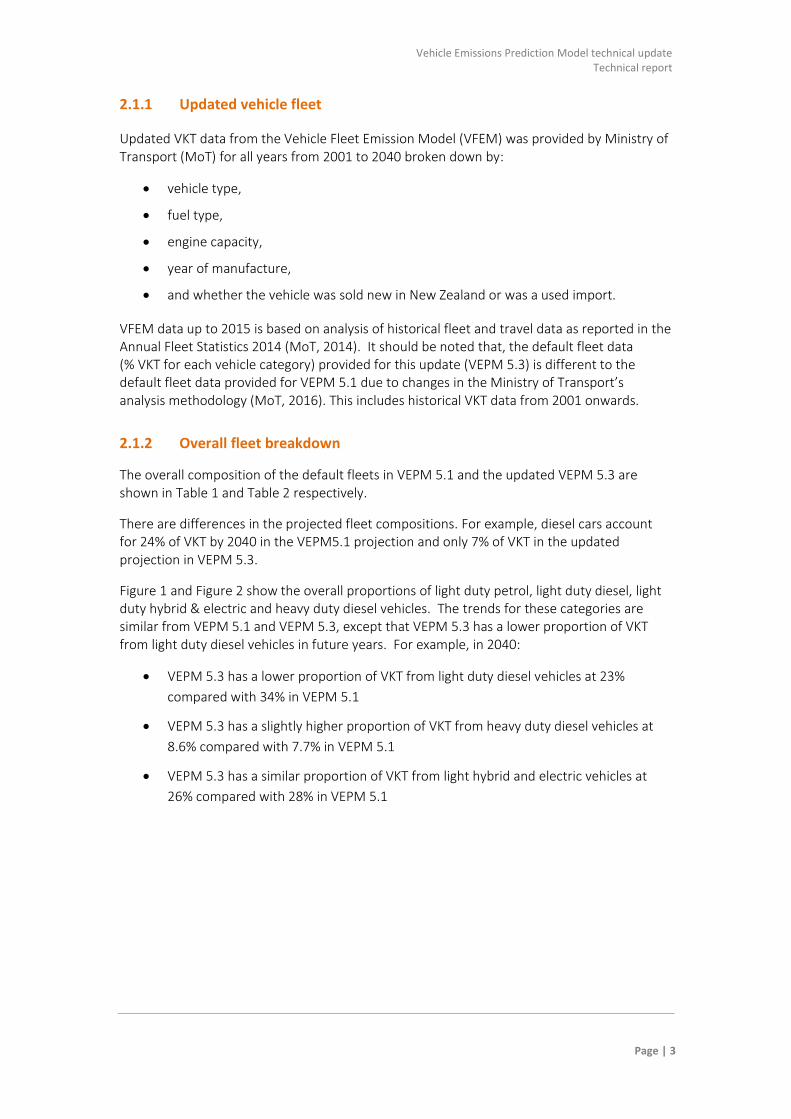
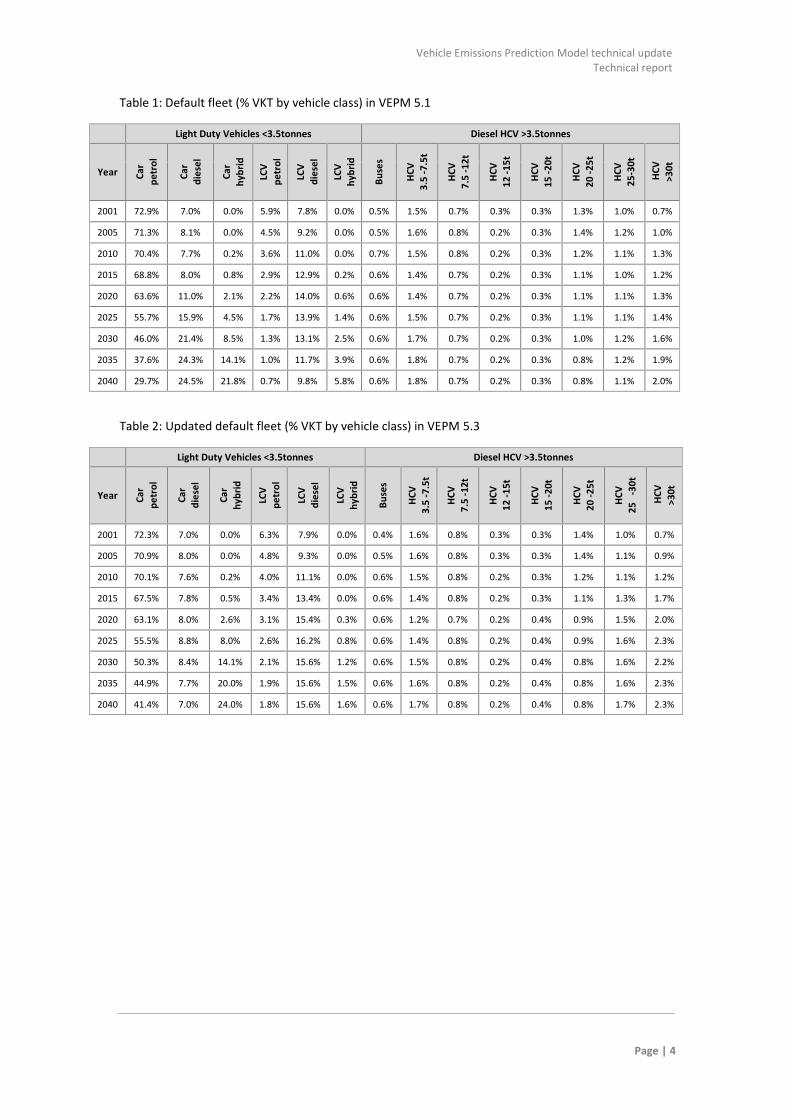
2.1.2 Overall fleet breakdown
The overall composition of the default fleets in VEPM 5.1 and the updated VEPM 5.3 are shown in Table 1 and Table 2 respectively.
There are differences in the projected fleet compositions. For example, diesel cars account for 24% of VKT by 2040 in the VEPM5.1 projection and only 7% of VKT in the updated projection in VEPM 5.3.
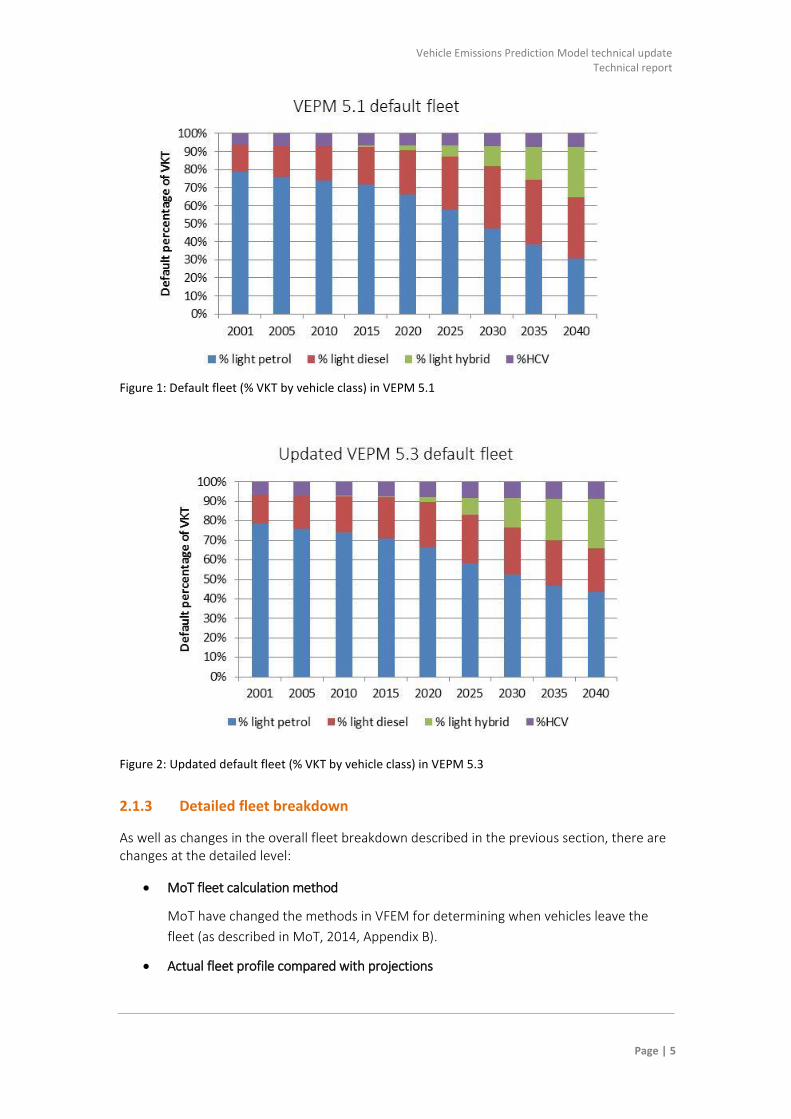
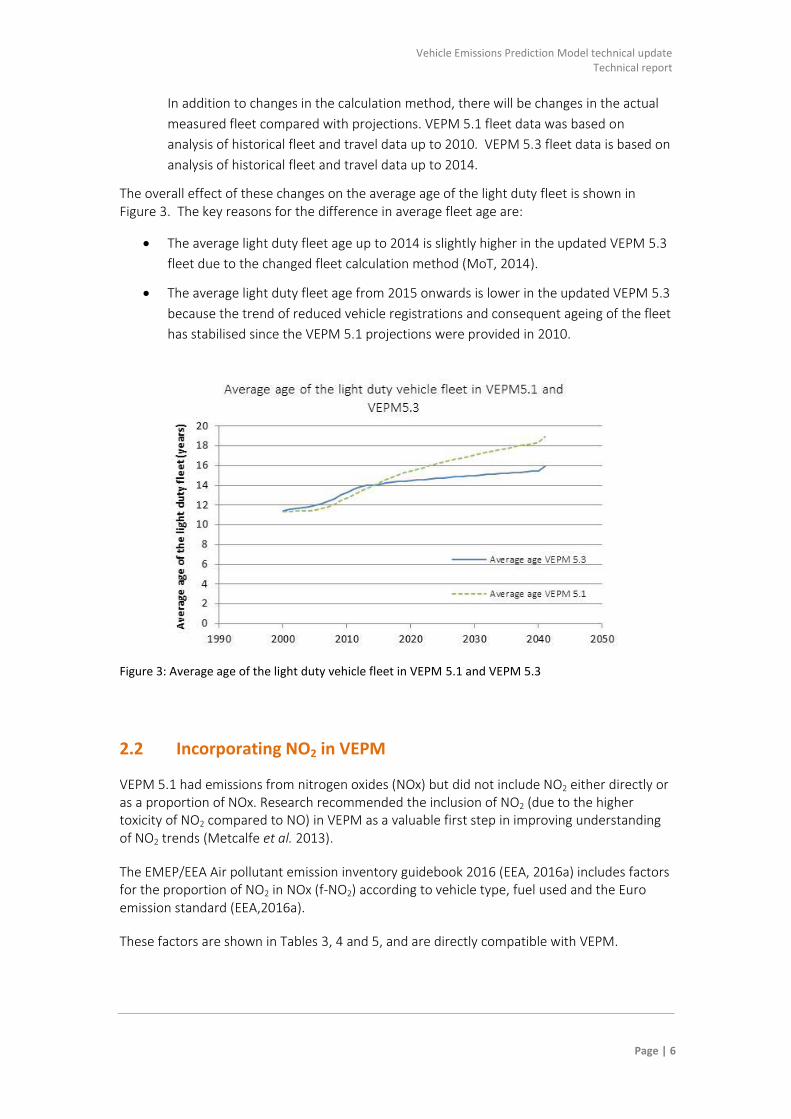
Figure 1 and Figure 2 show the overall proportions of light duty petrol, light duty diesel, light duty hybrid & electric and heavy duty diesel vehicles. The trends for these categories are similar from VEPM 5.1 and VEPM 5.3, except that VEPM 5.3 has a lower proportion of VKT from light duty diesel vehicles in future years. For example, in 2040:
VEPM 5.3 has a lower proportion of VKT from light duty diesel vehicles at 23%
compared with 34% in VEPM 5.1
VEPM 5.3 has a slightly higher proportion of VKT from heavy duty diesel vehicles at
8.6% compared with 7.7% in VEPM 5.1
VEPM 5.3 has a similar proportion of VKT from light hybrid and electric vehicles at
26% compared with 28% in VEPM 5.1
Vehicle Emissions Prediction Model technical update Technical report
Page | 4
Table 1: Default fleet (% VKT by vehicle class) in VEPM 5.1
Light Duty Vehicles <3.5tonnes Diesel HCV >3.5tonnes
Year Car
pe
tro
l
Car
d
iese
l
Car
hyb
rid
LCV
pe
tro
l
LCV
die
sel
LCV
h
ybri
d
Bu
ses
HC
V
3.5
-7.
5t
HC
V
7.5
-12
t
HC
V
12
-1
5t
HC
V
15
-2
0t
HC
V
20
-2
5t
HC
V
25
-30
t
HC
V
>30
t
2001 72.9% 7.0% 0.0% 5.9% 7.8% 0.0% 0.5% 1.5% 0.7% 0.3% 0.3% 1.3% 1.0% 0.7%
2005 71.3% 8.1% 0.0% 4.5% 9.2% 0.0% 0.5% 1.6% 0.8% 0.2% 0.3% 1.4% 1.2% 1.0%
2010 70.4% 7.7% 0.2% 3.6% 11.0% 0.0% 0.7% 1.5% 0.8% 0.2% 0.3% 1.2% 1.1% 1.3%
2015 68.8% 8.0% 0.8% 2.9% 12.9% 0.2% 0.6% 1.4% 0.7% 0.2% 0.3% 1.1% 1.0% 1.2%
2020 63.6% 11.0% 2.1% 2.2% 14.0% 0.6% 0.6% 1.4% 0.7% 0.2% 0.3% 1.1% 1.1% 1.3%
2025 55.7% 15.9% 4.5% 1.7% 13.9% 1.4% 0.6% 1.5% 0.7% 0.2% 0.3% 1.1% 1.1% 1.4%
2030 46.0% 21.4% 8.5% 1.3% 13.1% 2.5% 0.6% 1.7% 0.7% 0.2% 0.3% 1.0% 1.2% 1.6%
2035 37.6% 24.3% 14.1% 1.0% 11.7% 3.9% 0.6% 1.8% 0.7% 0.2% 0.3% 0.8% 1.2% 1.9%
2040 29.7% 24.5% 21.8% 0.7% 9.8% 5.8% 0.6% 1.8% 0.7% 0.2% 0.3% 0.8% 1.1% 2.0%
Table 2: Updated default fleet (% VKT by vehicle class) in VEPM 5.3
Light Duty Vehicles <3.5tonnes Diesel HCV >3.5tonnes
Year Car
pe
tro
l
Car
d
iese
l
Car
hyb
rid
LCV
p
etr
ol
LCV
d
iese
l
LCV
hyb
rid
Bu
ses
HC
V
3.5
-7.
5t
HC
V
7.5
-12
t
HC
V
12
-1
5t
HC
V
15
-2
0t
HC
V
20
-2
5t
HC
V
25
-3
0t
HC
V
>30
t
2001 72.3% 7.0% 0.0% 6.3% 7.9% 0.0% 0.4% 1.6% 0.8% 0.3% 0.3% 1.4% 1.0% 0.7%
2005 70.9% 8.0% 0.0% 4.8% 9.3% 0.0% 0.5% 1.6% 0.8% 0.3% 0.3% 1.4% 1.1% 0.9%
2010 70.1% 7.6% 0.2% 4.0% 11.1% 0.0% 0.6% 1.5% 0.8% 0.2% 0.3% 1.2% 1.1% 1.2%
2015 67.5% 7.8% 0.5% 3.4% 13.4% 0.0% 0.6% 1.4% 0.8% 0.2% 0.3% 1.1% 1.3% 1.7%
2020 63.1% 8.0% 2.6% 3.1% 15.4% 0.3% 0.6% 1.2% 0.7% 0.2% 0.4% 0.9% 1.5% 2.0%
2025 55.5% 8.8% 8.0% 2.6% 16.2% 0.8% 0.6% 1.4% 0.8% 0.2% 0.4% 0.9% 1.6% 2.3%
2030 50.3% 8.4% 14.1% 2.1% 15.6% 1.2% 0.6% 1.5% 0.8% 0.2% 0.4% 0.8% 1.6% 2.2%
2035 44.9% 7.7% 20.0% 1.9% 15.6% 1.5% 0.6% 1.6% 0.8% 0.2% 0.4% 0.8% 1.6% 2.3%
2040 41.4% 7.0% 24.0% 1.8% 15.6% 1.6% 0.6% 1.7% 0.8% 0.2% 0.4% 0.8% 1.7% 2.3%
Vehicle Emissions Prediction Model technical update Technical report
Page | 5
Figure 1: Default fleet (% VKT by vehicle class) in VEPM 5.1
Figure 2: Updated default fleet (% VKT by vehicle class) in VEPM 5.3
2.1.3 Detailed fleet breakdown
As well as changes in the overall fleet breakdown described in the previous section, there are changes at the detailed level:
MoT fleet calculation method
MoT have changed the methods in VFEM for determining when vehicles leave the
fleet (as described in MoT, 2014, Appendix B).
Actual fleet profile compared with projections
Vehicle Emissions Prediction Model technical update Technical report
Page | 6
In addition to changes in the calculation method, there will be changes in the actual
measured fleet compared with projections. VEPM 5.1 fleet data was based on
analysis of historical fleet and travel data up to 2010. VEPM 5.3 fleet data is based on
analysis of historical fleet and travel data up to 2014.
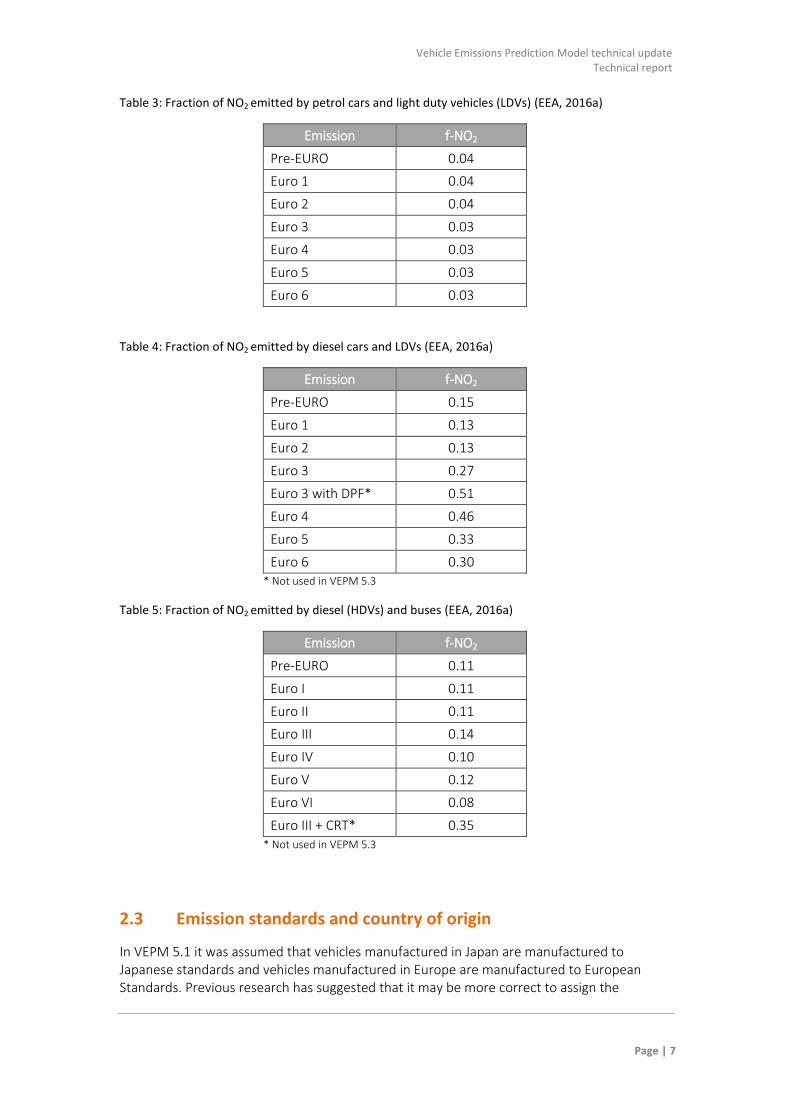
The overall effect of these changes on the average age of the light duty fleet is shown in Figure 3. The key reasons for the difference in average fleet age are:
The average light duty fleet age up to 2014 is slightly higher in the updated VEPM 5.3
fleet due to the changed fleet calculation method (MoT, 2014).
The average light duty fleet age from 2015 onwards is lower in the updated VEPM 5.3
because the trend of reduced vehicle registrations and consequent ageing of the fleet
has stabilised since the VEPM 5.1 projections were provided in 2010.
Figure 3: Average age of the light duty vehicle fleet in VEPM 5.1 and VEPM 5.3
2.2 Incorporating NO2 in VEPM
VEPM 5.1 had emissions from nitrogen oxides (NOx) but did not include NO2 either directly or as a proportion of NOx. Research recommended the inclusion of NO2 (due to the higher toxicity of NO2 compared to NO) in VEPM as a valuable first step in improving understanding of NO2 trends (Metcalfe et al. 2013).
The EMEP/EEA Air pollutant emission inventory guidebook 2016 (EEA, 2016a) includes factors for the proportion of NO2 in NOx (f-NO2) according to vehicle type, fuel used and the Euro emission standard (EEA,2016a).
These factors are shown in Tables 3, 4 and 5, and are directly compatible with VEPM.
Vehicle Emissions Prediction Model technical update Technical report
Page | 7
Table 3: Fraction of NO2 emitted by petrol cars and light duty vehicles (LDVs) (EEA, 2016a)
Emission f-NO2
Pre-EURO 0.04
Euro 1 0.04
Euro 2 0.04
Euro 3 0.03
Euro 4 0.03
Euro 5 0.03
Euro 6 0.03
Table 4: Fraction of NO2 emitted by diesel cars and LDVs (EEA, 2016a)
Emission f-NO2
Pre-EURO 0.15
Euro 1 0.13
Euro 2 0.13
Euro 3 0.27
Euro 3 with DPF* 0.51
Euro 4 0.46
Euro 5 0.33
Euro 6 0.30 * Not used in VEPM 5.3
Table 5: Fraction of NO2 emitted by diesel (HDVs) and buses (EEA, 2016a)
Emission f-NO2
Pre-EURO 0.11
Euro I 0.11
Euro II 0.11
Euro III 0.14
Euro IV 0.10
Euro V 0.12
Euro VI 0.08
Euro III + CRT* 0.35 * Not used in VEPM 5.3
2.3 Emission standards and country of origin
In VEPM 5.1 it was assumed that vehicles manufactured in Japan are manufactured to Japanese standards and vehicles manufactured in Europe are manufactured to European Standards. Previous research has suggested that it may be more correct to assign the
Vehicle Emissions Prediction Model technical update Technical report
Page | 8
emission standard based on country of first registration, because vehicles should be manufactured to the emission standard of the country where they are sold (Metcalfe et al., 2013).
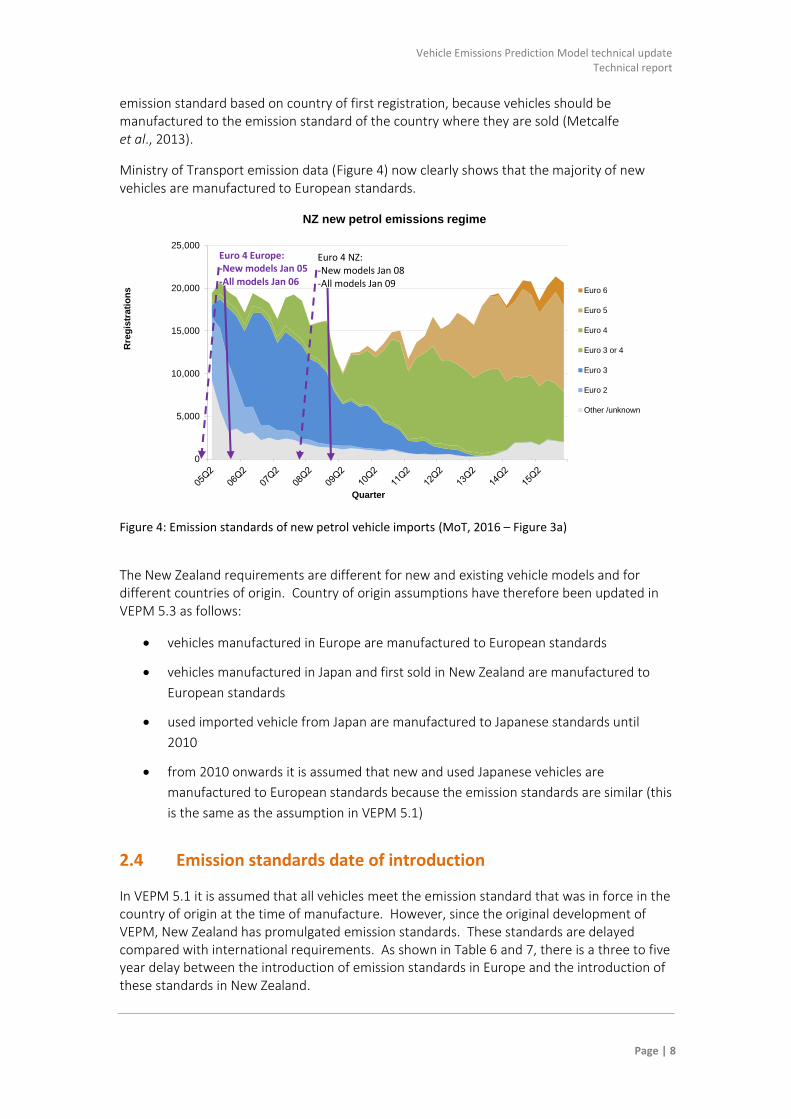
Ministry of Transport emission data (Figure 4) now clearly shows that the majority of new vehicles are manufactured to European standards.
Figure 4: Emission standards of new petrol vehicle imports (MoT, 2016 – Figure 3a)
The New Zealand requirements are different for new and existing vehicle models and for different countries of origin. Country of origin assumptions have therefore been updated in VEPM 5.3 as follows:
vehicles manufactured in Europe are manufactured to European standards
vehicles manufactured in Japan and first sold in New Zealand are manufactured to
European standards
used imported vehicle from Japan are manufactured to Japanese standards until
2010
from 2010 onwards it is assumed that new and used Japanese vehicles are
manufactured to European standards because the emission standards are similar (this
is the same as the assumption in VEPM 5.1)
2.4 Emission standards date of introduction
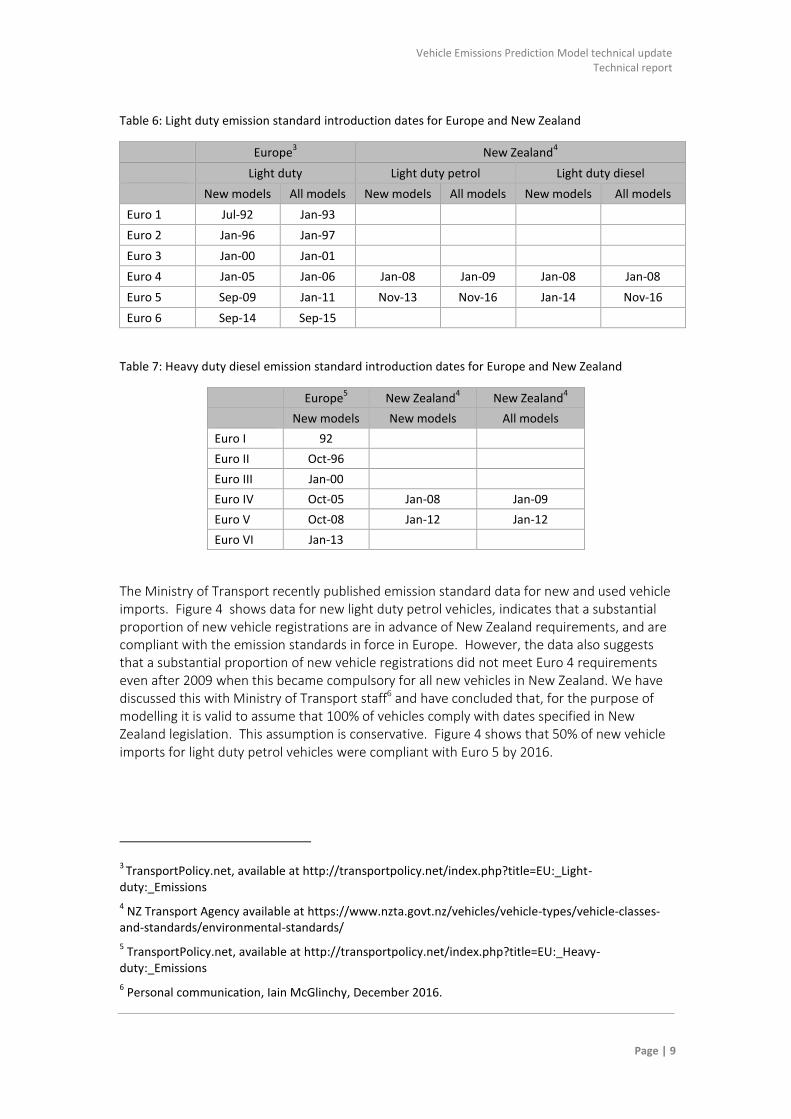
In VEPM 5.1 it is assumed that all vehicles meet the emission standard that was in force in the country of origin at the time of manufacture. However, since the original development of VEPM, New Zealand has promulgated emission standards. These standards are delayed compared with international requirements. As shown in Table 6 and 7, there is a three to five year delay between the introduction of emission standards in Europe and the introduction of these standards in New Zealand.
0
5,000
10,000
15,000
20,000
25,000
Rre
gis
trati
on
s
Quarter
NZ new petrol emissions regime
Euro 6
Euro 5
Euro 4
Euro 3 or 4
Euro 3
Euro 2
Other /unknown
Euro 4 Europe: -New models Jan 05 -All models Jan 06
Euro 4 NZ: -New models Jan 08 -All models Jan 09
Vehicle Emissions Prediction Model technical update Technical report
Page | 9
Table 6: Light duty emission standard introduction dates for Europe and New Zealand
Europe
3 New Zealand
4
Light duty Light duty petrol Light duty diesel
New models All models New models All models New models All models
Euro 1 Jul-92 Jan-93
Euro 2 Jan-96 Jan-97
Euro 3 Jan-00 Jan-01
Euro 4 Jan-05 Jan-06 Jan-08 Jan-09 Jan-08 Jan-08
Euro 5 Sep-09 Jan-11 Nov-13 Nov-16 Jan-14 Nov-16
Euro 6 Sep-14 Sep-15
Table 7: Heavy duty diesel emission standard introduction dates for Europe and New Zealand
Europe
5 New Zealand
4 New Zealand
4
New models New models All models
Euro I 92
Euro II Oct-96
Euro III Jan-00
Euro IV Oct-05 Jan-08 Jan-09
Euro V Oct-08 Jan-12 Jan-12
Euro VI Jan-13
The Ministry of Transport recently published emission standard data for new and used vehicle imports. Figure 4 shows data for new light duty petrol vehicles, indicates that a substantial proportion of new vehicle registrations are in advance of New Zealand requirements, and are compliant with the emission standards in force in Europe. However, the data also suggests that a substantial proportion of new vehicle registrations did not meet Euro 4 requirements even after 2009 when this became compulsory for all new vehicles in New Zealand. We have discussed this with Ministry of Transport staff6 and have concluded that, for the purpose of modelling it is valid to assume that 100% of vehicles comply with dates specified in New Zealand legislation. This assumption is conservative. Figure 4 shows that 50% of new vehicle imports for light duty petrol vehicles were compliant with Euro 5 by 2016.
3 TransportPolicy.net, available at http://transportpolicy.net/index.php?title=EU:_Light-
duty:_Emissions
4 NZ Transport Agency available at https://www.nzta.govt.nz/vehicles/vehicle-types/vehicle-classes-
and-standards/environmental-standards/
5 TransportPolicy.net, available at http://transportpolicy.net/index.php?title=EU:_Heavy-
duty:_Emissions
6 Personal communication, Iain McGlinchy, December 2016.

Vehicle Emissions Prediction Model technical update Technical report
Page | 10
The date of introduction of emission standards in VEPM has been updated based on the following assumptions:
It is assumed that all New Zealand new vehicles are manufactured to European emission standards
For emission standards that are specified in New Zealand legislation, it is assumed that 100% of new vehicles comply with the European emission standard required by New Zealand legislation at the year of manufacture
For emission standards which are not specified in New Zealand legislation (Euro 1, 2, 3 and 6), a four to five year delay is assumed for compliance with European emission standards in New Zealand.
The emission standards assumed in VEPM for new vehicles by year of manufacture are summarised in Table 8 and Table 9.
Table 8: Assumed date of introduction of Euro emissions standards in VEPM 5.3 for light duty vehicles
Europe
Assumed date of introduction in VEPM for new vehicles
All models Petrol Diesel
Euro 1 Jan-93 =>96<00 =>96<00
Euro 2 Jan-97 =>00<04 =>00<04
Euro 3 Jan-01 =>04<09 =>04<08
Euro 4 Jan-06 =>09<16 =>08<16
Euro 5 Jan-11 =>16<20 =>16<20
Euro 6 Sep-15 =>20 =>20
Table 9: Assumed date of introduction of Euro emissions standards in VEPM 5.3 for heavy duty vehicles
Europe
Assumed date for NZ
New models
Euro I 92 =>95<00
Euro II Oct-96 =>00<03
Euro III Jan-00 =>03<08
Euro IV Oct-05 =>08<12
Euro V Oct-08 =>12<20
Euro VI Jan-13 =>20
2.5 Emission factors
As described in previous technical reports (EFRU, 2011), emission factors in VEPM 5.1 were based primarily on:
emission factors from the UK National Atmospheric Emissions Inventory (NAEI) database for light duty vehicles from 2009, and
emission factors from COPERT4 for heavy duty vehicles

Vehicle Emissions Prediction Model technical update Technical report
Page | 11
The UK database has been updated a number of times since 2009 (DEFRA, 2016). Emission factors in the UK database for NOx, PM and HC are now based on the COPERT model. Therefore, light duty emission factors in this version of VEPM have been updated based on emission factors from the COPERT model.
Emission factors are therefore updated in VEPM 5.3. This involves the replacement of:
emission factor equations for all pollutants, for all Euro 5, Euro 6 and Euro V vehicles.
And the addition of:
Euro VI (heavy duty) emission factors (which is not currently included in VEPM)
The updated emission factors are the latest available COPERT factors from the European Environment Agency (EEA) as at December 2016 7,8.
Figure 5: HDV 3.5 – 7.5t vehicle class emission factors from VEPM 5.3 (50 km/hr) for NOx by emissions standard
Figure 5 displays NOx emission factors from VEPM 5.3 (at 50km/hour) by emissions standard
for the HDV 3.5 – 7.5t vehicle class (includes buses). This shows that substantial reductions in
NOx emissions are expected from heavy duty vehicles, particularly with the introduction of
Euro VI.
7 Light duty Euro 5 and Euro 6 emission factors are from EEA (2016B). EMEP/EEA Air pollutant
emission inventory guidebook 2016 – Update Dec. 2016. 8 Heavy duty Euro V and Euro VI emission factors are from the accompanying spreadsheet EMEP/EEA
Air pollutant emission inventory guidebook 2016 1.A.3.bi-iv Road transport Annex 2: HDVs 2016.xlsx. (Downloaded from http://www.eea.europa.eu/publications/emep-eea-guidebook-2016 10 December 2016)
Vehicle Emissions Prediction Model technical update Technical report
Page | 12
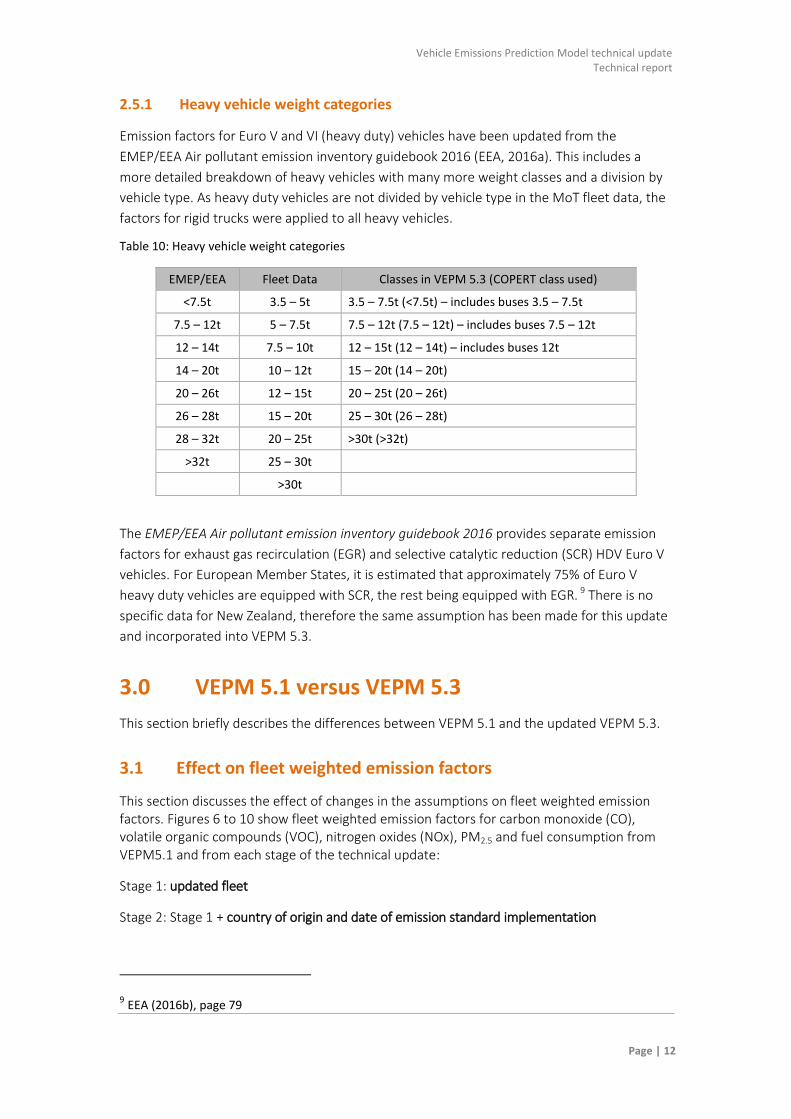
2.5.1 Heavy vehicle weight categories
Emission factors for Euro V and VI (heavy duty) vehicles have been updated from the
EMEP/EEA Air pollutant emission inventory guidebook 2016 (EEA, 2016a). This includes a
more detailed breakdown of heavy vehicles with many more weight classes and a division by
vehicle type. As heavy duty vehicles are not divided by vehicle type in the MoT fleet data, the
factors for rigid trucks were applied to all heavy vehicles.
Table 10: Heavy vehicle weight categories
EMEP/EEA Fleet Data Classes in VEPM 5.3 (COPERT class used)
<7.5t 3.5 – 5t 3.5 – 7.5t (<7.5t) – includes buses 3.5 – 7.5t
7.5 – 12t 5 – 7.5t 7.5 – 12t (7.5 – 12t) – includes buses 7.5 – 12t
12 – 14t 7.5 – 10t 12 – 15t (12 – 14t) – includes buses 12t
14 – 20t 10 – 12t 15 – 20t (14 – 20t)
20 – 26t 12 – 15t 20 – 25t (20 – 26t)
26 – 28t 15 – 20t 25 – 30t (26 – 28t)
28 – 32t 20 – 25t >30t (>32t)
>32t 25 – 30t
>30t
The EMEP/EEA Air pollutant emission inventory guidebook 2016 provides separate emission
factors for exhaust gas recirculation (EGR) and selective catalytic reduction (SCR) HDV Euro V
vehicles. For European Member States, it is estimated that approximately 75% of Euro V
heavy duty vehicles are equipped with SCR, the rest being equipped with EGR. 9 There is no
specific data for New Zealand, therefore the same assumption has been made for this update
and incorporated into VEPM 5.3.
3.0 VEPM 5.1 versus VEPM 5.3
This section briefly describes the differences between VEPM 5.1 and the updated VEPM 5.3.
3.1 Effect on fleet weighted emission factors
This section discusses the effect of changes in the assumptions on fleet weighted emission factors. Figures 6 to 10 show fleet weighted emission factors for carbon monoxide (CO), volatile organic compounds (VOC), nitrogen oxides (NOx), PM2.5 and fuel consumption from VEPM5.1 and from each stage of the technical update:
Stage 1: updated fleet
Stage 2: Stage 1 + country of origin and date of emission standard implementation
9 EEA (2016b), page 79

Vehicle Emissions Prediction Model technical update Technical report
Page | 13
Stage 3 (VEPM 5.3): Stage 2+ updated emission factors for Euro 5, 6, and V, and the addition of Euro VI.
Figure 6: Comparison of CO emission factors from VEPM 5.1 and VEPM 5.3
Figure 7: Comparison of VOC emission factors from VEPM 5.1 and VEPM 5.3

Vehicle Emissions Prediction Model technical update Technical report
Page | 14
Figure 8: Comparison of NOx emission factors from VEPM 5.1 and VEPM 5.3
Figure 9: Comparison of PM2.5 emission factors from VEPM 5.1 and VEPM 5.3
Vehicle Emissions Prediction Model technical update Technical report
Page | 15
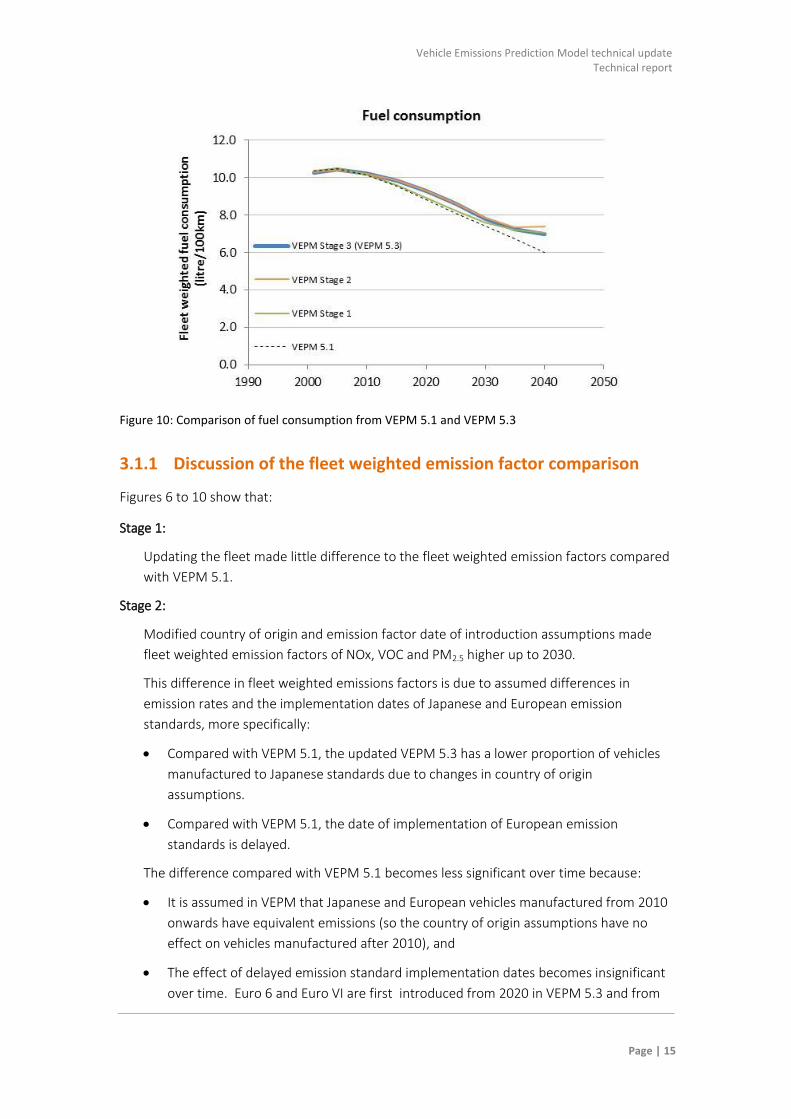
Figure 10: Comparison of fuel consumption from VEPM 5.1 and VEPM 5.3
3.1.1 Discussion of the fleet weighted emission factor comparison
Figures 6 to 10 show that:
Stage 1:
Updating the fleet made little difference to the fleet weighted emission factors compared
with VEPM 5.1.
Stage 2:
Modified country of origin and emission factor date of introduction assumptions made
fleet weighted emission factors of NOx, VOC and PM2.5 higher up to 2030.
This difference in fleet weighted emissions factors is due to assumed differences in
emission rates and the implementation dates of Japanese and European emission
standards, more specifically:
Compared with VEPM 5.1, the updated VEPM 5.3 has a lower proportion of vehicles
manufactured to Japanese standards due to changes in country of origin
assumptions.
Compared with VEPM 5.1, the date of implementation of European emission
standards is delayed.
The difference compared with VEPM 5.1 becomes less significant over time because:
It is assumed in VEPM that Japanese and European vehicles manufactured from 2010
onwards have equivalent emissions (so the country of origin assumptions have no
effect on vehicles manufactured after 2010), and
The effect of delayed emission standard implementation dates becomes insignificant
over time. Euro 6 and Euro VI are first introduced from 2020 in VEPM 5.3 and from
Vehicle Emissions Prediction Model technical update Technical report
Page | 16
2015 in VEPM5.1. After the introduction of Euro 6 and Euro VI standards (from 2015
in VEPM5.1 and from 2020 in VEPM 5.3) there are no further emission reductions
assumed in VEPM, so emission reductions stabilise.
Stage 3:
Changing the assumptions and updating emission factors for Euro 5, 6 LDVs and Euro VI
HDVs made little difference to fleet weighted emission factors until 2030 when the
emission factors for NOx, VOC and PM2.5 fall below the emission factors in VEPM 5.1.
The reduction in fleet weighted emissions from 2030 compared to VEPM 5.1 is due to the
addition of Euro VI emission factors for HDVs, which are much lower than Euro V emission
factors, especially for NOx (as shown in Figure 6).
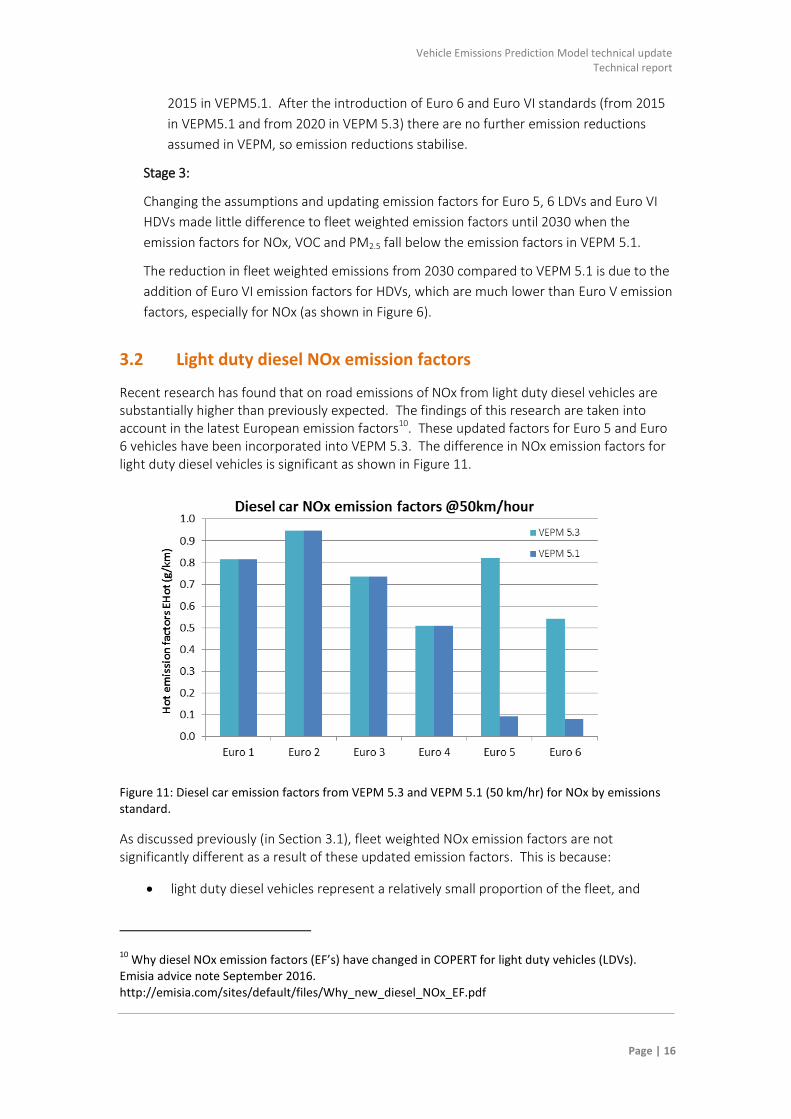
3.2 Light duty diesel NOx emission factors
Recent research has found that on road emissions of NOx from light duty diesel vehicles are substantially higher than previously expected. The findings of this research are taken into account in the latest European emission factors10. These updated factors for Euro 5 and Euro 6 vehicles have been incorporated into VEPM 5.3. The difference in NOx emission factors for light duty diesel vehicles is significant as shown in Figure 11.
Figure 11: Diesel car emission factors from VEPM 5.3 and VEPM 5.1 (50 km/hr) for NOx by emissions standard.
As discussed previously (in Section 3.1), fleet weighted NOx emission factors are not significantly different as a result of these updated emission factors. This is because:
light duty diesel vehicles represent a relatively small proportion of the fleet, and
10 Why diesel NOx emission factors (EF’s) have changed in COPERT for light duty vehicles (LDVs).
Emisia advice note September 2016. http://emisia.com/sites/default/files/Why_new_diesel_NOx_EF.pdf
Vehicle Emissions Prediction Model technical update Technical report
Page | 17
as discussed in Section 2.1.1, the proportion of light duty diesel vehicles is lower in VEPM 5.3 compared with VEPM 5.1.
3.3 NO2 emission factors
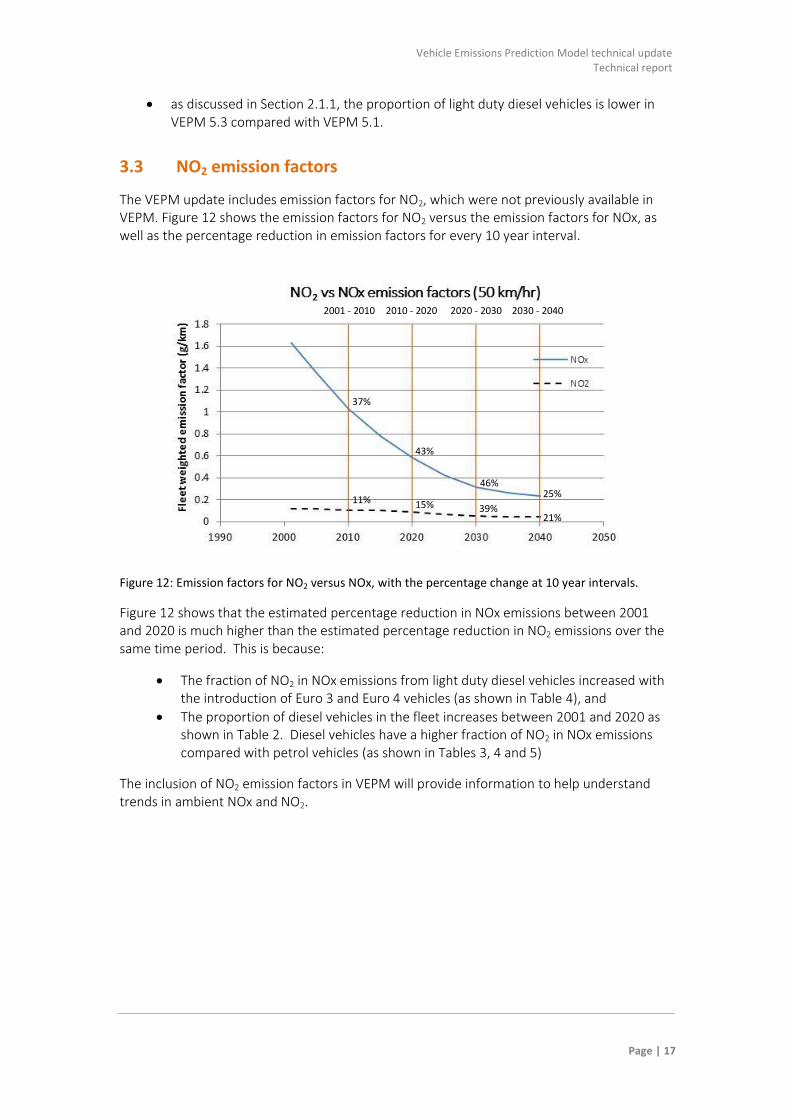
The VEPM update includes emission factors for NO2, which were not previously available in VEPM. Figure 12 shows the emission factors for NO2 versus the emission factors for NOx, as well as the percentage reduction in emission factors for every 10 year interval.
Figure 12: Emission factors for NO2 versus NOx, with the percentage change at 10 year intervals.
Figure 12 shows that the estimated percentage reduction in NOx emissions between 2001 and 2020 is much higher than the estimated percentage reduction in NO2 emissions over the same time period. This is because:
The fraction of NO2 in NOx emissions from light duty diesel vehicles increased with the introduction of Euro 3 and Euro 4 vehicles (as shown in Table 4), and
The proportion of diesel vehicles in the fleet increases between 2001 and 2020 as shown in Table 2. Diesel vehicles have a higher fraction of NO2 in NOx emissions compared with petrol vehicles (as shown in Tables 3, 4 and 5)
The inclusion of NO2 emission factors in VEPM will provide information to help understand trends in ambient NOx and NO2.
37%
43%
46% 25%
15% 11% 39%
21%
2001 - 2010 2010 - 2020 2020 - 2030 2030 - 2040
Vehicle Emissions Prediction Model technical update Technical report
Page | 18
4.0 Future updates
The methodology for this update of VEPM has been peer reviewed by Pacific Environment Limited11. This review identified a number of additional updates or modifications to VEPM that may be considered in future versions. These include:
The current update incorporates the latest emission factors for Euro 5 and 6 light
duty and Euro V and VI heavy duty vehicles. In future, for general consistency and
ease of updating it would be preferable to make all European emission factors
consistent with the latest version of COPERT. If possible adjustment factors and
equivalencies for Japanese vehicles should also be recalculated to be consistent with
COPERT.
Inclusion of additional vehicle technologies (e.g. plug in petrol hybrids, diesel hybrids
and gasoline direct injection (GDI) vehicles) and emission control devices based (e.g.
DPF, SCR, EGR).
There is scope for inclusion of unregulated pollutants in VEPM.
COPERT Australia could potentially be used to fill some gaps in VEPM including SUVs
and Australian imports.
COPERT Australia approach to estimating cold start emissions could be considered.
In general, it is recommended that VEPM should be updated whenever COPERT is updated. The detailed fleet profile should also be updated regularly.
5.0 Conclusions
VEPM is now based on recent fleet information and projections from Ministry of Transport, as well as the latest emission factors from Europe
The key conclusions from this update of VEPM were:
Updating the vehicle fleet resulted in minor differences to fleet weighted emission
factors;
Changes to the country of origin assumptions and the implementation dates of
European emission standards resulted in higher fleet weighted average emission
factors compared with VEPM 5.1 up to 2030, however the difference becomes less
significant over time;
Updating the emission factors for Euro 5, 6 and V, and including Euro VI saw little
impact on the overall emission factors until 2030, after which fleet weighted emission
factors are lower due to the inclusion of Euro VI to the fleet.
11 Pacific Environment Limited, 2016. Comments on VEPM Technical Updates – proposed
content. Prepared by Paul Boulter, 11 December 2016.

Vehicle Emissions Prediction Model technical update Technical report
Page | 19
The inclusion of NO2 emission factors in VEPM will provide valuable information for
evaluation of vehicle emission trends.
Vehicle Emissions Prediction Model technical update Technical report
Page | 20
References
DEFRA (2016). Emissions Factors Toolkit v7.0 User Guide. Prepared by the Department for Environment, Food & Rural Affairs, UK, August 2016
EEA (2014). Air pollutant emission inventory guidebook 2013, 1.A.3.b.i-iv Exhaust Emissions from Road Transport Annex September 2014. EEA Report No 12/2013, Denmark
EEA (2016a). Air pollutant emission inventory guidebook 2016, 1.A.3.b.i-iv Road transport Annex HDVs 2016. EEA Report No 21/2016, Denmark
EEA (2016b). Air pollutant emission inventory guidebook 2016 – Update Dec. 2016, Available at: http://www.eea.europa.eu/publications/emep-eea-guidebook-2016/part-b-sectoral-guidance-chapters/1-energy/1-a-combustion/1-a-3-b-i/view
EFRU (2011). Vehicle Emissions Prediction Model (VEPM) Version 5.0 Development and User Information Report. Prepared for NZ Transport Agency and Auckland Council by Energy & Fuels Research Unit, The University of Auckland, November 2011
EFRU (2012). Vehicle emissions prediction model (VEPM) version 5.1. Prepared by Energy and Fuels Research Unit, The University of Auckland.
Emisia (2014). Update of the Air Emissions Inventory Guidebook - Road Transport 2014 Update. Report prepared by Emisia SA for the European Environment Agency, May 2014. Available at: www.emisia.com
MoT (2014). New Zealand Vehicle Fleet Annual Statistics 2014. Ministry of Transport 2014, available at: http://www.transport.govt.nz/research/newzealandvehiclefleetstatistics/
MoT (2016). The New Zealand Vehicle Fleet: Quarterly Update March 2016. Ministry of Transport 2016, available at: http://www.transport.govt.nz/research/newzealandvehiclefleetstatistics/
Metcalfe J, Bluett J, & Kuschel G (2013). Comparison of trends in predicted (VEPM) and real-world (RSD) emissions for the light duty fleet – 2003 to 2011. Report prepared by Emission Impossible Ltd and Golder Associates (NZ) Ltd for the NZ Transport Agency, December 2013