Embed Size (px)
Citation preview

VEHICLE POWERELECTRONICS AND
ELECTRIC MACHINES
2 0 0 1
A N N U A L
P R O G R E S S
R E P O R T
U.S. Department of Energy
Energy Efficiency and Renewable Energy
Office of Transportation Technologies

A C K N O W L E D G E M E N T
We would like to express our sincere appreciation to NationalRenewable Energy Laboratory and Energetics, Inc., for their artistic and technical contributions in preparing and publishingthis report.
In addition, we would like to thank all our program participantsfor their contributions to the programs and all the authors whoprepared the project abstracts that comprise this report.
U.S. Department of EnergyOffice of Advanced Automotive Technologies1000 Independence Avenue, S.W.Washington, D.C. 20585-0121
FY 2001
Progress Report for theVehicle Power Electronics and Electric Machines
Program
Energy Efficiency and Renewable EnergyOffice of Transportation TechnologiesOffice of Advanced Automotive TechnologiesEnergy Management Team
David Hamilton Program Manager
December 2001

i
Contents
1. INTRODUCTION ...........................................................................................................................1 2. AUTOMOTIVE INTEGRATED POWER MODULES (AIPM)...............................................................5
• Silicon Power Corporation (SPCO)/Rockwell...........................................................................5 • Satcon.................................................................................................................................. 17 • Semikron ............................................................................................................................. 22 • AIPM Validation Testing and Contract Support ...................................................................... 26
3. AUTOMOTIVE ELECTRIC MOTOR DRIVE (AEMD).....................................................................28 • Delco Remy......................................................................................................................... 28 • Delphi.................................................................................................................................. 34 • AEMD Validation Testing and Contract Support .................................................................... 40
4. CAPACITORS .............................................................................................................................42 • High Dielectric Constant Capacitor Technologies for Power Electronic Systems ...................... 42 • Dc Bus Capacitors for PNGV Power Electronics .................................................................... 47 • Mechanical Reliability of Electronic Ceramics and Electronic Ceramic Devices....................... 54
5. MAGNETIC MATERIALS .............................................................................................................58 • Development of Improved Powder for Bonded Permanent Magnets......................................... 58 • Low-Cost, High Energy-Product Permanent Magnets ............................................................. 62
6. THERMAL MANAGEMENT..........................................................................................................67 • CARAT – Use of Micro-PCM Fluids as Enhanced Liquid Coolants in Automotive Electric and
Hybrid Electric Vehicles ....................................................................................................... 67 • Carbon Foam for Electronics Cooling .................................................................................... 74 • SBIR - Improved Rotor Cooling for PM Machines.................................................................. 81
7. SUPPORTING RESEARCH............................................................................................................85 • Fiber-optic Microsensors for Automotive Power Electronics ................................................... 85 • Silicon-Carbide Modeling Tool for Transportation Applications .............................................. 87 • Field Weakening and Magnet Retention for PM Machines ...................................................... 93 • Inverter/Converter Topologies and Packaging R&D.............................................................. 100 • Electric Machinery R&D..................................................................................................... 113 • Real-Time Platform for the Evaluation of Electric Machinery Control Algorithms .................. 125 • HEV Motor Inverter Modeling ............................................................................................ 136 • Exploration of Advanced Propulsion Concepts and Control................................................... 145 • HEV Switched Reluctance Machines ................................................................................... 150 • SBIR – Integrated Electric Traction System.......................................................................... 155 •
8. ACRONYMS ............................................................................................................................. 159

ii
1
1. INTRODUCTION
Power Electronics and Electric Machines Program
On behalf of the Department of Energy's Office of Advanced Automotive Technologies (OAAT), I am pleased to introduce the Fiscal Year (FY) 2001 Annual Progress Report for the Power Electronics and Electric Machines Program. Together with DOE laboratories and in partnership with private industry and universities, OAAT engages in high-risk research and development that provides enabling technology for fuel-efficient and environmentally friendly light- and heavy-duty vehicles. Through many of its technology research programs, the DOE Office of Advanced Automotive Technologies (OAAT) has supported the government/industry Partnership for a New Generation of Vehicles (PNGV) since its inception. The PNGV leadership is now re-evaluating the partnership goals to identify changes that will maximize the potential national petroleum-savings benefit of the emerging PNGV technologies. When these PNGV goal changes have been defined, the OAAT will adjust the focus of its technology research programs accordingly. The goal of the Power Electronics and Electric Machines Program is to develop power electronics and electric machinery technologies that enable dramatic decreases in vehicle system costs by increasing component integration, while maintaining system flexibility, high reliability, ruggedness, low volume, and low weight. National laboratories and universities are conducting high-risk, enabling technology R&D focused on overcoming the critical technical barriers that impede the development of advanced power electronics and electric machines. The lead laboratory in the Power Electronics and Electric Machines Program is Oak Ridge National Laboratory (ORNL). This program requires the close coordination of research and diagnostic efforts at a number of national laboratories and universities, primarily Argonne National Laboratory (ANL), Lawrence Livermore National Laboratory (LLNL), Sandia National Laboratory (SNL), Pennsylvania State University (PSU), Ames Laboratory, University of Tenessee (UT), and North Carolina State University (NCS). The Power Electronics and Electric Machines Program is also partnering with automotive suppliers and other federal government agencies to develop technologies that will be compatible with automotive-scale manufacturing and other attributes conducive to wide-scale deployment in allied applications to ensure lowest possible cost. This approach ensures that the resulting technologies reside with companies that not only have the capability to supply derived products, but also have a return-on-investment incentive to do so. Within OAAT, the Power Electronics and Electric Machines Program works in cooperation with the Automotive Propulsion Materials, Advanced Combustion and Emissions Control, and the Fuel Cells for Transportation research and development programs. Projects within the Power Electronics and Electric Machines Program address integrated power controls, integrated chassis system controls, and navigational and
2
communication systems that are needed to enable the success of these other OAAT/DOE programs. Addressing Technical Challenges Significant progress has been made in the development of more efficient electric machinery such as permanent magnet AC traction motors and high-power electronic controls. These technologies demonstrate the feasibility of designing and delivering hybrid and electric vehicles that can achieve the performance levels of current light-duty automobiles. However, major barriers must still be overcome in power electronics and electric machines development. High system cost remains critical, as do thermal management and the high degree of reliability and ruggedness demanded for automotive applications, while under the intense thermal stress of the power devices and the harsh environmental conditions. Volume and weight considerations and other integration issues remain important, due mainly to signal radiation considerations. Materials, processing, and fabrication technologies for both power electronics and electric machinery are currently too expensive for automotive applications. Existing power electronics and electric machinery are bulky, heavy and difficult to package in automotive applications. The challenge of simultaneously achieving low cost and high performance is exacerbated by the need to effectively package and cool the components. The components necessary for the high fuel economy, low emission vehicles require power electronics components to be smaller and lighter in weight. Integration of the power electronics and motors into one package would promote greater packaging density and use fewer connectors, hoses and cables while reducing weight, volume and cost and offering greater reliability. One of the important technical barriers being addressed is the prevention of overheating and failure of vehicle electronics' thermal management. Both materials and advanced controller topologies are under investigation. For automotive applications, power electronics and electric machinery need to be very rugged and reliable for 150,000-mile vehicle lifetimes. In particular, the electrolytic capacitors, a key component of power electronics, generally have an operating and shelf life of only five years. Achieving a target of 10-15 years and 5,000 to 10,000 hours of operation in the harsh automotive environment remains a major challenge. FY 2001 Accomplishments In addition to the numerous technical accomplishments reported in the project briefs that follow, several accomplishments relating to improved program planning and the integration of commercial development projects deserve mention, including:
• Merit Review Meeting: DOE's Office of Transportation Technologies (OTT) held
the Power Electronics peer review meeting over the internet using PlaceWare software and a telephone conference call. The peer review panel provided an opportunity for industry program participants (automotive manufacturers, OEMs,
3
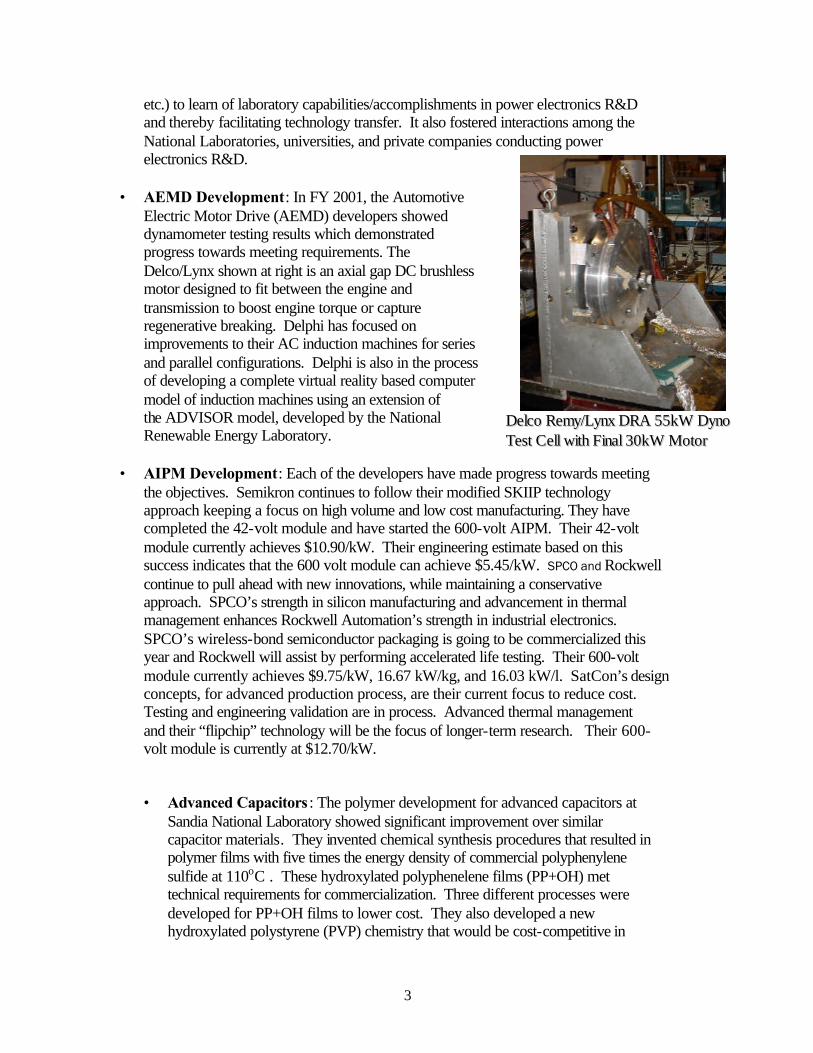
DDeellccoo RReemmyy//LLyynnxx DDRRAA 5555kkWW DDyynnoo TTeesstt CCeellll wwiitthh FFiinnaall 3300kkWW MMoottoorr
etc.) to learn of laboratory capabilities/accomplishments in power electronics R&D and thereby facilitating technology transfer. It also fostered interactions among the National Laboratories, universities, and private companies conducting power electronics R&D.
• AEMD Development: In FY 2001, the Automotive Electric Motor Drive (AEMD) developers showed dynamometer testing results which demonstrated progress towards meeting requirements. The Delco/Lynx shown at right is an axial gap DC brushless motor designed to fit between the engine and transmission to boost engine torque or capture regenerative breaking. Delphi has focused on improvements to their AC induction machines for series and parallel configurations. Delphi is also in the process of developing a complete virtual reality based computer model of induction machines using an extension of the ADVISOR model, developed by the National Renewable Energy Laboratory.
• AIPM Development: Each of the developers have made progress towards meeting the objectives. Semikron continues to follow their modified SKIIP technology approach keeping a focus on high volume and low cost manufacturing. They have completed the 42-volt module and have started the 600-volt AIPM. Their 42-volt module currently achieves $10.90/kW. Their engineering estimate based on this success indicates that the 600 volt module can achieve $5.45/kW. SPCO and Rockwell continue to pull ahead with new innovations, while maintaining a conservative approach. SPCO’s strength in silicon manufacturing and advancement in thermal management enhances Rockwell Automation’s strength in industrial electronics. SPCO’s wireless-bond semiconductor packaging is going to be commercialized this year and Rockwell will assist by performing accelerated life testing. Their 600-volt module currently achieves $9.75/kW, 16.67 kW/kg, and 16.03 kW/l. SatCon’s design concepts, for advanced production process, are their current focus to reduce cost. Testing and engineering validation are in process. Advanced thermal management and their “flipchip” technology will be the focus of longer-term research. Their 600-volt module is currently at $12.70/kW.
• Advanced Capacitors : The polymer development for advanced capacitors at
Sandia National Laboratory showed significant improvement over similar capacitor materials. They invented chemical synthesis procedures that resulted in polymer films with five times the energy density of commercial polyphenylene sulfide at 110oC . These hydroxylated polyphenelene films (PP+OH) met technical requirements for commercialization. Three different processes were developed for PP+OH films to lower cost. They also developed a new hydroxylated polystyrene (PVP) chemistry that would be cost-competitive in
4
commercial markets and meets technical specifications for commercialization. They are also collaborating with TPL, Inc., to fabricate free-standing dielectric sheets that have breakdown strengths of greater than 4 MV/cm from -40o to 110oC.
• SBIR Contributions : Advanced exploratory research in power electronics and
electric machines continues to be supported through the Small Business Innovative Research (SBIR) Program. The thermo-electric device contract is showing promise toward 40% efficiency in the lab.
Future Directions
In FY 2002, more extensive testing is planned for the graphite foam at Oak Ridge National Laboratory (ORNL). The Materials Research group and the Power Electronics and Electric Machinery Research Center both at ORNL will work together to evaluate graphite foam performance for cooling of power electronic devices. The latest evaporative and spray cooling techniques will be reviewed and inverters using these cooling systems will be fabricated and tested to determine how these cooling techniques can be applied to PNGV HEV inverters. The remainder of this report presents project abstracts that highlight progress achieved during FY 2001 under the Power Electronics and Electric Machines Program. The abstracts summarize national laboratory projects and provide an overview of the work being conducted to overcome the technical barriers associated with the development of advanced power electronics and electric machines. Project briefs from the FY 2001 Progress Report for Propulsion Materials which apply to Advanced Materials for Power Electronics were also included in this report. The briefs have been included in this volume due to their direct relevance and importance to the successful development of power electronics and electric machines. In addition, we have included brief project descriptions of work that is to be conducted by our industry partners in FY 2001 covering the development of Automotive Integrated Power Modules (AIPM) and Automotive Electric Motor Drives (AEMD). David Hamilton, Program Manager Power Electronics and Electric Machines Program Office of Advanced Automotive Technologies Office of Transportation Technologies
5
The Development of the Automotive Integrated Power Module (AIPM)
Victor A.K. Temple Silicon Power Corporation Commercial Power Division 3 Northway Lane North Latham, NY 12110 (518) 782-1182; e-mail: [email protected]
DOE Program Manager: David Hamilton (202) 586-2314; fax: (202) 586-9811; e-mail: [email protected] Cooperative Agreement No. DE-FC02-99EE50571
Introduction
SPCO (Silicon Power Corporation) and its team are developing and demonstrating low-cost Automotive Integrated Power Modules (AIPM) suitable for mass production and for a wide range of automotive applications. This team includes Rockwell Automation, Rockwell Science Center, and MICREL, a large semiconductor manufacturer located in San Jose. Silicon Power’s Power Electronic Building Block or PEBB technology, MICREL’s very large semiconductor manufacturing capability, and Rockwell’s drive know-how and large commercial market give this team an unbeatable combination of technology, manufacturing, and marketing. Approach
Over the first 12 months the team focused on two design alternatives, one led by Silicon Power and based on advance modules and cooling with a distributed bus capacitor and one led by the Rockwell Automation team in which the bus capacitor is a single unit. Both
approaches use the Rockwell Science Center controller. Technical Accomplishments: Meeting Scheduled Deliverables
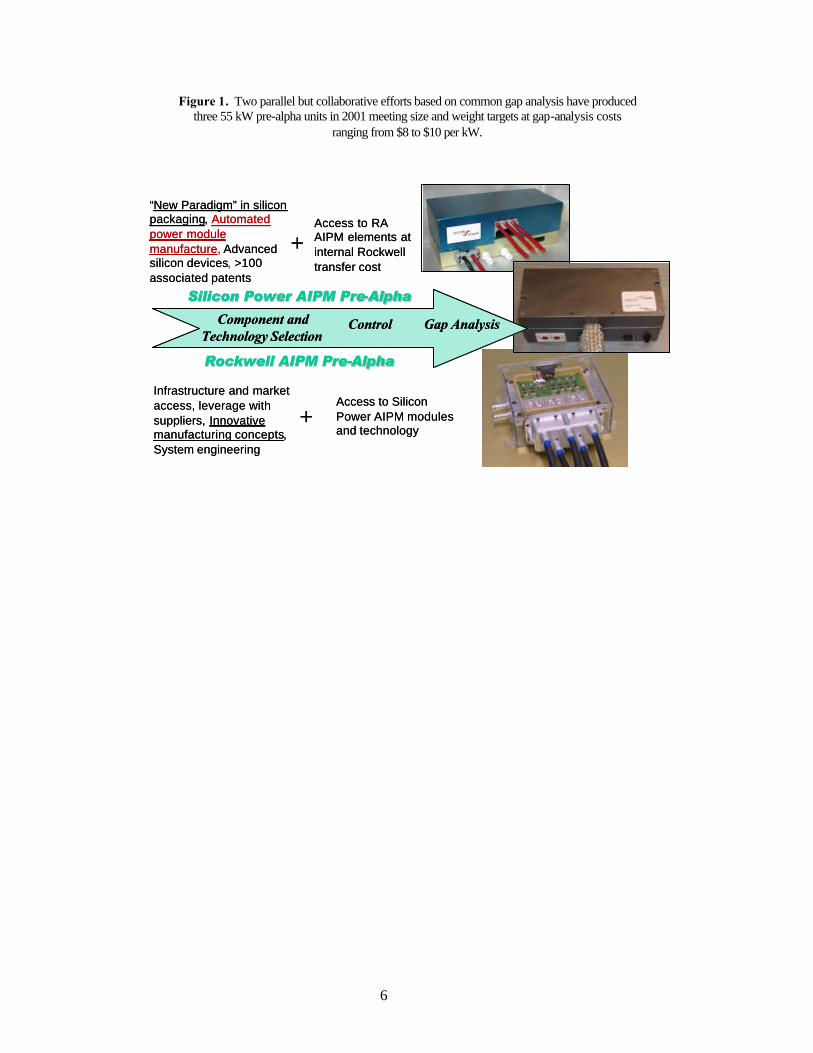
In the last 12 months these two paths have resulted in three AIPM drives, Silicon Power’s Gen1 and Gen2 pre-alpha units and a Rockwell pre-alpha unit. All three units have taken advantage of the mix of capabilities and intellectual property held by both companies as illustrated by Figure 1. The upper drives are Silicon Power’s. The lower is the Rockwell drive. All three meet electrical requirements and are well within the weight and volume goals of the program.
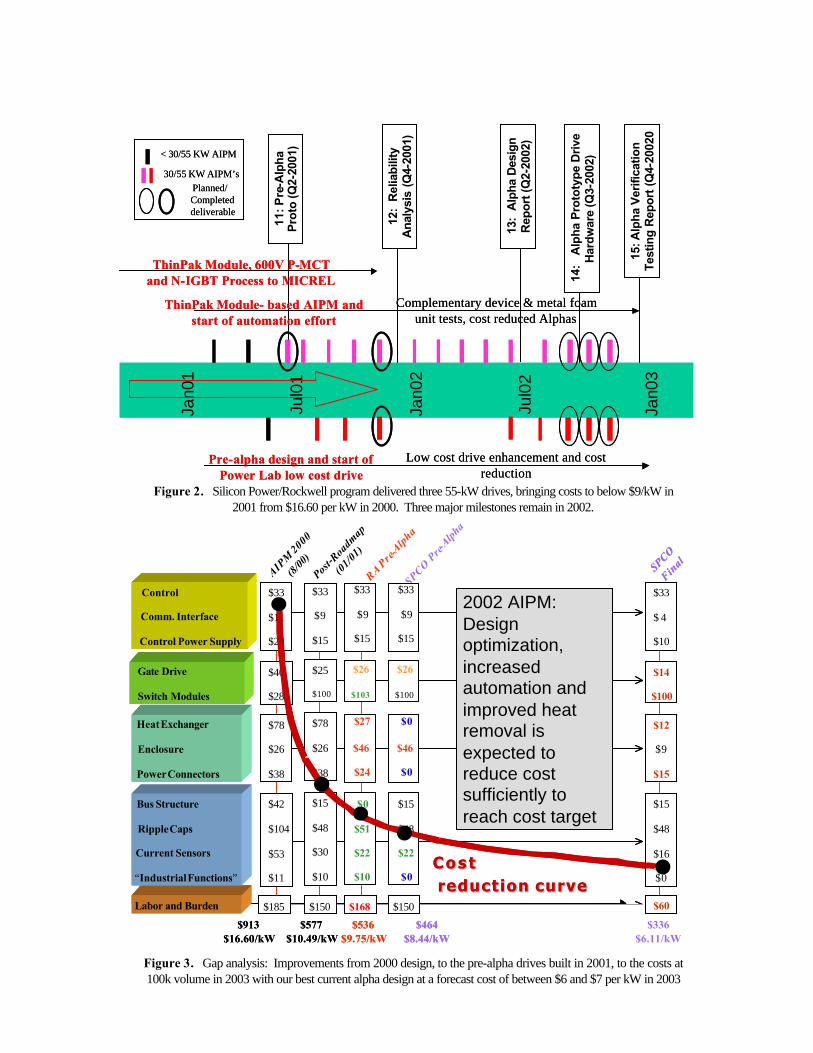
Figure 2 shows the program plan and deliverables/milestone chart both for the last year and for the upcoming, final year of the program. It shows that our team has built a quantity of drives over the last year, with six drives to be delivered of our final alpha design. The three drives already delivered (i.e., built and tested by the end of the year and shown in Figure 1) are identified on the time line by bold ellipses in June and October of 2001.
6
Figure 1. Two parallel but collaborative efforts based on common gap analysis have produced three 55 kW pre-alpha units in 2001 meeting size and weight targets at gap-analysis costs
ranging from $8 to $10 per kW.
“New Paradigm” in silicon packaging, Automated power module manufacture, Advanced silicon devices, >100 associated patents
Infrastructure and market access, leverage with suppliers, Innovative manufacturing concepts, System engineering
Access to Silicon Power AIPM modules and technology
Access to RA AIPM elements at internal Rockwell transfer cost
Silicon Power AIPM PreSilicon Power AIPM Pre--AlphaAlpha
Rockwell AIPM PreRockwell AIPM Pre--AlphaAlpha
+
+
Gap AnalysisComponent and Technology Selection
Control
“New Paradigm” in silicon packaging, Automated power module manufacture, Advanced silicon devices, >100 associated patents
Infrastructure and market access, leverage with suppliers, Innovative manufacturing concepts, System engineering
Access to Silicon Power AIPM modules and technology
Access to RA AIPM elements at internal Rockwell transfer cost
Silicon Power AIPM PreSilicon Power AIPM Pre--AlphaAlpha
Rockwell AIPM PreRockwell AIPM Pre--AlphaAlpha
+
+
Gap AnalysisComponent and Technology Selection
Control Gap AnalysisComponent and Technology Selection
Control
7
Technical Accomplishments: Reducing
14:
Alp
ha
Pro
toty
pe
Dri
ve
Har
dw
are
(Q3-
2002
)
15: A
lph
a V
erifi
catio
n
Tes
ting
Rep
ort
(Q
4-20
020
11:
Pre
-Alp
ha
Pro
to (Q
2-20
01)
12:
Rel
iab
ility
A
nal
ysis
(Q4-
2001
)
ThinPak Module, 600V P-MCT and N-IGBT Process to MICREL
ThinPak Module- based AIPM and start of automation effort
Complementary device & metal foam unit tests, cost reduced Alphas
< 30/55 KW AIPM
30/55 KW AIPM’sPlanned/ Completed deliverable
Pre-alpha design and start of Power Lab low cost drive
Low cost drive enhancement and cost reduction
13:
Alp
ha D
esig
n R
epo
rt (Q
2-20
02)
Jan0
1
Jul0
1
Jan0
2
Jul0
2
Jan0
3
AIPM
2000(8/
00)
Post-R
oadm
ap
(01/0
1)RA Pre-
Alpha
$935$17/kW
Control
Comm. Interface
Control Power Supply
Gate Drive
Switch Modules
Labor and Burden
Bus Structure
RippleCaps
Current Sensors
“IndustrialFunctions”
HeatExchanger
Enclosure
PowerConnectors
$33
$ 4
$10
$14
$100
$12
$9
$15
$15
$48
$16
$0
$60
SPCOFin
al
$336$6.11/kW
$33
$9
$15
$26
$38
$15
$30
$10
$577$10.49/kW
$25
$100
$78
$48
$185$150
$536$9.75/kW
$33
$9
$15
$26
$103
$27
$46
$24
$10
$22
$51
$0
$168$168
SPCO Pre-
Alpha
$464$8.44/kW
$33
$9
$15
$26
$100
$0
$46
$0
$0
$22
$48
$15
$168$150
$33
$11
$28
$40
$284
$78
$26
$38
$42
$104
$53
$11
$185
$913$16.60/kW
C o s tC o s t
reduction curvereduction curve
2002 AIPM: Design optimization, increased automation and improved heat removal is expected to reduce cost sufficiently to reach cost target
AIPM
2000(8/
00)
Post-R
oadm
ap
(01/0
1)RA Pre-
Alpha
$935$17/kW
Control
Comm. Interface
Control Power Supply
Gate Drive
Switch Modules
Labor and Burden
Bus Structure
RippleCaps
Current Sensors
“IndustrialFunctions”
HeatExchanger
Enclosure
PowerConnectors
$33
$ 4
$10
$14
$100
$12
$9
$15
$15
$48
$16
$0
$60
SPCOFin
al
$336$6.11/kW
$33
$9
$15
$26
$38
$15
$30
$10
$577$10.49/kW
$25
$100
$78
$48
$185$150
$33
$9
$15
$26
$38
$15
$30
$10
$577$10.49/kW
$25
$100
$78
$48
$185$150
$536$9.75/kW
$33
$9
$15
$26
$103
$27
$46
$24
$10
$22
$51
$0
$168$168
$536$9.75/kW
$33
$9
$15
$26
$103
$27
$46
$24
$10
$22
$51
$0
$168$168
SPCO Pre-
Alpha
$464$8.44/kW
$33
$9
$15
$26
$100
$0
$46
$0
$0
$22
$48
$15
$168$150
SPCO Pre-
Alpha
$464$8.44/kW
$33
$9
$15
$26
$100
$0
$46
$0
$0
$22
$48
$15
$168$150
$33
$9
$15
$26
$100
$0
$46
$0
$0
$22
$48
$15
$168$150
$33
$11
$28
$40
$284
$78
$26
$38
$42
$104
$53
$11
$185
$913$16.60/kW
$33
$11
$28
$40
$284
$78
$26
$38
$42
$104
$53
$11
$185
$33
$11
$28
$40
$284
$78
$26
$38
$42
$104
$53
$11
$185
$913$16.60/kW
C o s tC o s t
reduction curvereduction curve
2002 AIPM: Design optimization, increased automation and improved heat removal is expected to reduce cost sufficiently to reach cost target
Figure 2. Silicon Power/Rockwell program delivered three 55-kW drives, bringing costs to below $9/kW in 2001 from $16.60 per kW in 2000. Three major milestones remain in 2002.
Figure 3. Gap analysis: Improvements from 2000 design, to the pre-alpha drives built in 2001, to the costs at 100k volume in 2003 with our best current alpha design at a forecast cost of between $6 and $7 per kW in 2003
8
Technical Accomplishments: Reducing Cost per kW by >40%
In order to optimize the AIPM with respect to cost, Silicon Power and Rockwell have been interviewing vendors for all of the critical system components. These interviews are of some depth and involve technology under development that may allow cost and performance enhancement. This has allowed us to look at the prospective costs of the previous year’s (2000) design and compare them with the units built in the past year (2001). The costs are roughly split by drive function and are totaled for each design. What is clear from the data and curve plotted in Figure 3 is that in the past 12 months we have brought our drive cost down from $16 per kW to about $9 per kW on both companies’ designs. It is not a coincidence that the technologies and components chosen in the two designs are very similar – even down to the silicon-die area and the type of bus capacitors.
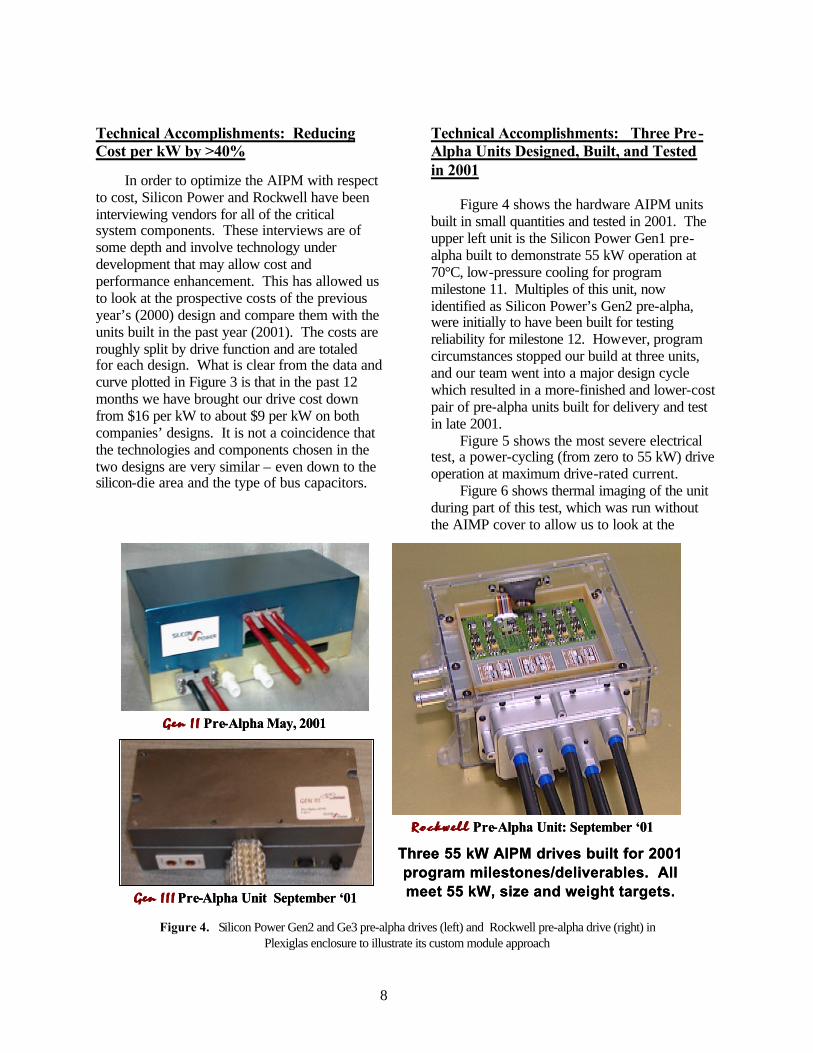
Technical Accomplishments: Three Pre-Alpha Units Designed, Built, and Tested in 2001
Figure 4 shows the hardware AIPM units built in small quantities and tested in 2001. The upper left unit is the Silicon Power Gen1 pre-alpha built to demonstrate 55 kW operation at 70°C, low-pressure cooling for program milestone 11. Multiples of this unit, now identified as Silicon Power’s Gen2 pre-alpha, were initially to have been built for testing reliability for milestone 12. However, program circumstances stopped our build at three units, and our team went into a major design cycle which resulted in a more-finished and lower-cost pair of pre-alpha units built for delivery and test in late 2001.
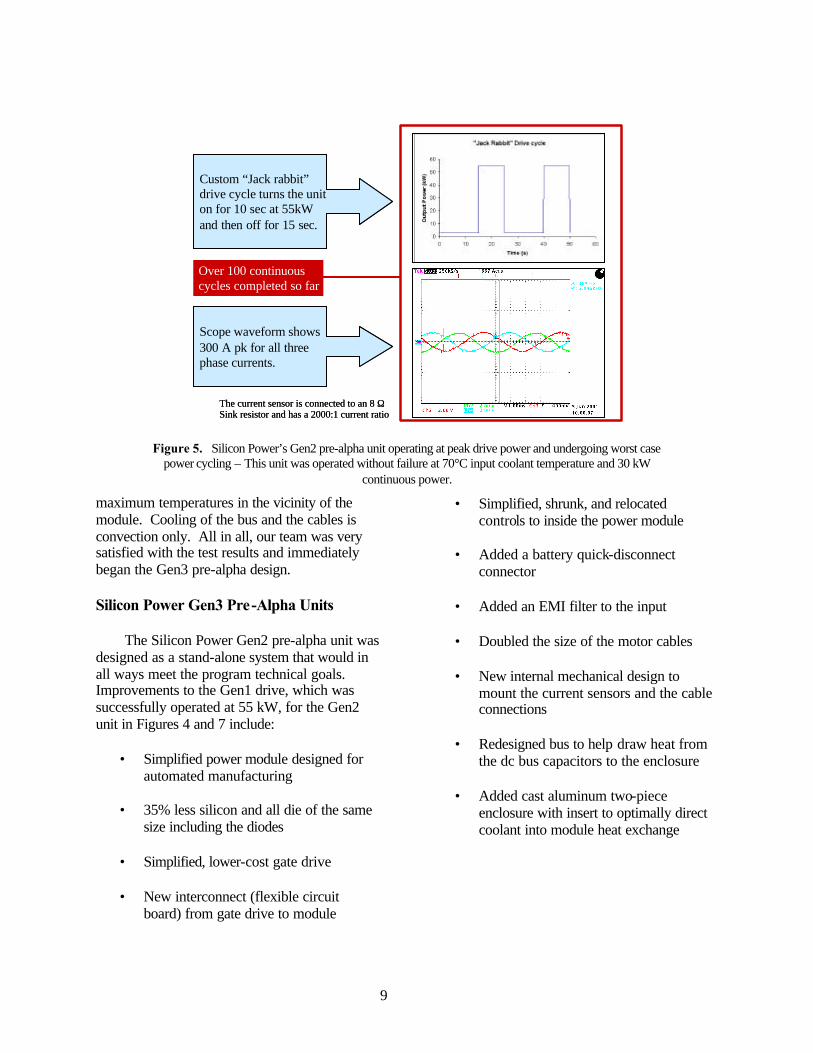
Figure 5 shows the most severe electrical test, a power-cycling (from zero to 55 kW) drive operation at maximum drive-rated current.
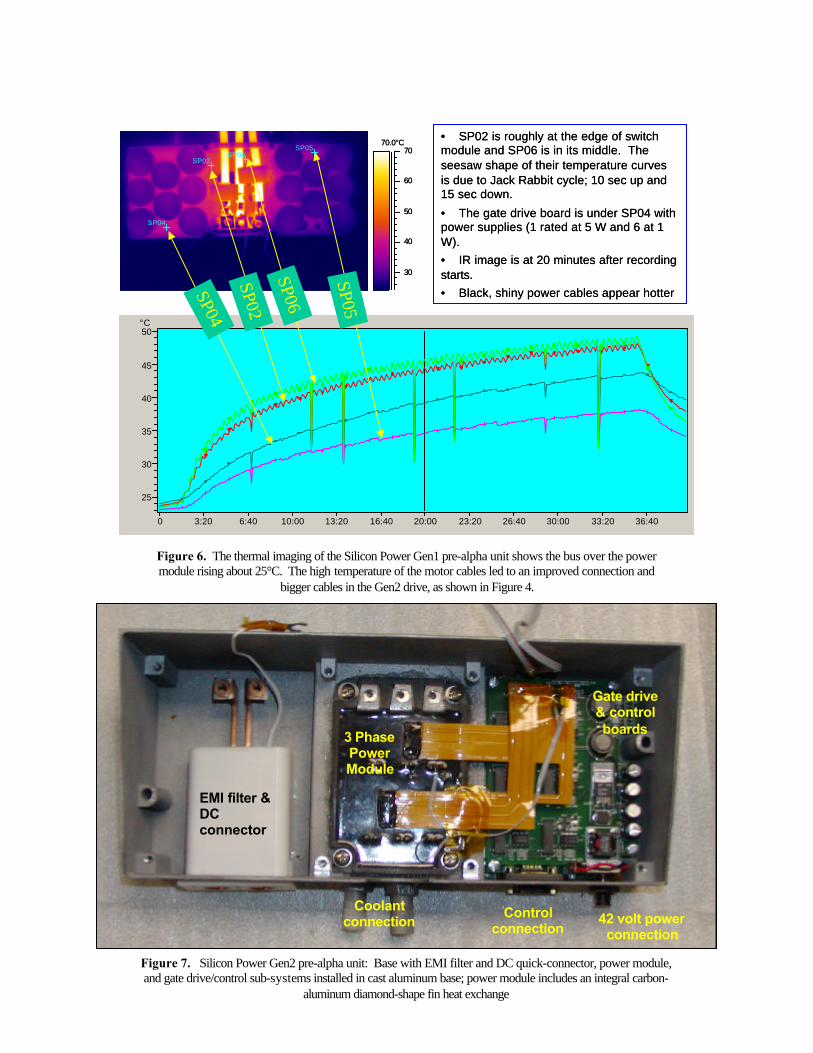
Figure 6 shows thermal imaging of the unit during part of this test, which was run without the AIMP cover to allow us to look at the
Gen I IGen I I Pre-Alpha May, 2001
Gen II IGen I I I Pre-Alpha Unit September ‘01
R o c k w e l lR o c k w e l l Pre-Alpha Unit: September ‘01
Three 55 kW AIPM drives built for 2001 program milestones/deliverables. All meet 55 kW, size and weight targets.
Gen I IGen I I Pre-Alpha May, 2001
Gen II IGen I I I Pre-Alpha Unit September ‘01
R o c k w e l lR o c k w e l l Pre-Alpha Unit: September ‘01
Three 55 kW AIPM drives built for 2001 program milestones/deliverables. All meet 55 kW, size and weight targets.
Figure 4. Silicon Power Gen2 and Ge3 pre-alpha drives (left) and Rockwell pre-alpha drive (right) in Plexiglas enclosure to illustrate its custom module approach
9
maximum temperatures in the vicinity of the module. Cooling of the bus and the cables is convection only. All in all, our team was very satisfied with the test results and immediately began the Gen3 pre-alpha design.
Silicon Power Gen3 Pre-Alpha Units
The Silicon Power Gen2 pre-alpha unit was designed as a stand-alone system that would in all ways meet the program technical goals. Improvements to the Gen1 drive, which was successfully operated at 55 kW, for the Gen2 unit in Figures 4 and 7 include:
• Simplified power module designed for automated manufacturing
• 35% less silicon and all die of the same
size including the diodes
• Simplified, lower-cost gate drive
• New interconnect (flexible circuit board) from gate drive to module
• Simplified, shrunk, and relocated controls to inside the power module
• Added a battery quick-disconnect
connector
• Added an EMI filter to the input
• Doubled the size of the motor cables
• New internal mechanical design to mount the current sensors and the cable connections
• Redesigned bus to help draw heat from
the dc bus capacitors to the enclosure
• Added cast aluminum two-piece enclosure with insert to optimally direct coolant into module heat exchange
Custom “Jack rabbit” drive cycle turns the uniton for 10 sec at 55kWand then off for 15 sec.
Scope waveform shows 300 A pk for all three phase currents.
The current sensor is connected to an 8 ΩSink resistor and has a 2000:1 current ratio
Over 100 continuous cycles completed so far
Custom “Jack rabbit” drive cycle turns the uniton for 10 sec at 55kWand then off for 15 sec.
Scope waveform shows 300 A pk for all three phase currents.
The current sensor is connected to an 8 ΩSink resistor and has a 2000:1 current ratio
Over 100 continuous cycles completed so far
Figure 5. Silicon Power’s Gen2 pre-alpha unit operating at peak drive power and undergoing worst case power cycling – This unit was operated without failure at 70°C input coolant temperature and 30 kW
continuous power.
6
Figure 7 shows the lower half of the cast Figure 7. Silicon Power Gen2 pre-alpha unit: Base with EMI filter and DC quick-connector, power module, and gate drive/control sub-systems installed in cast aluminum base; power module includes an integral carbon-
aluminum diamond-shape fin heat exchange
70.0°C
30
40
50
60
70SP02
SP04
SP05SP06
°C
25
30
35
40
45
50
0 3:20 6:40 10:00 13:20 16:40 20:00 23:20 26:40 30:00 33:20 36:40
SP04
SP02
SP05
SP06
• SP02 is roughly at the edge of switch module and SP06 is in its middle. The seesaw shape of their temperature curves is due to Jack Rabbit cycle; 10 sec up and 15 sec down.
• The gate drive board is under SP04 with power supplies (1 rated at 5 W and 6 at 1 W). • IR image is at 20 minutes after recording starts.• Black, shiny power cables appear hotter
Figure 6. The thermal imaging of the Silicon Power Gen1 pre-alpha unit shows the bus over the power module rising about 25°C. The high temperature of the motor cables led to an improved connection and
bigger cables in the Gen2 drive, as shown in Figure 4.
EMI filter & DC connector
3 Phase Power Module
Gate drive & control boards
Coolant connection
Control connection
42 volt power connection
EMI filter & DC connector
3 Phase Power Module
Gate drive & control boards
Coolant connection
Control connection
42 volt power connection
11
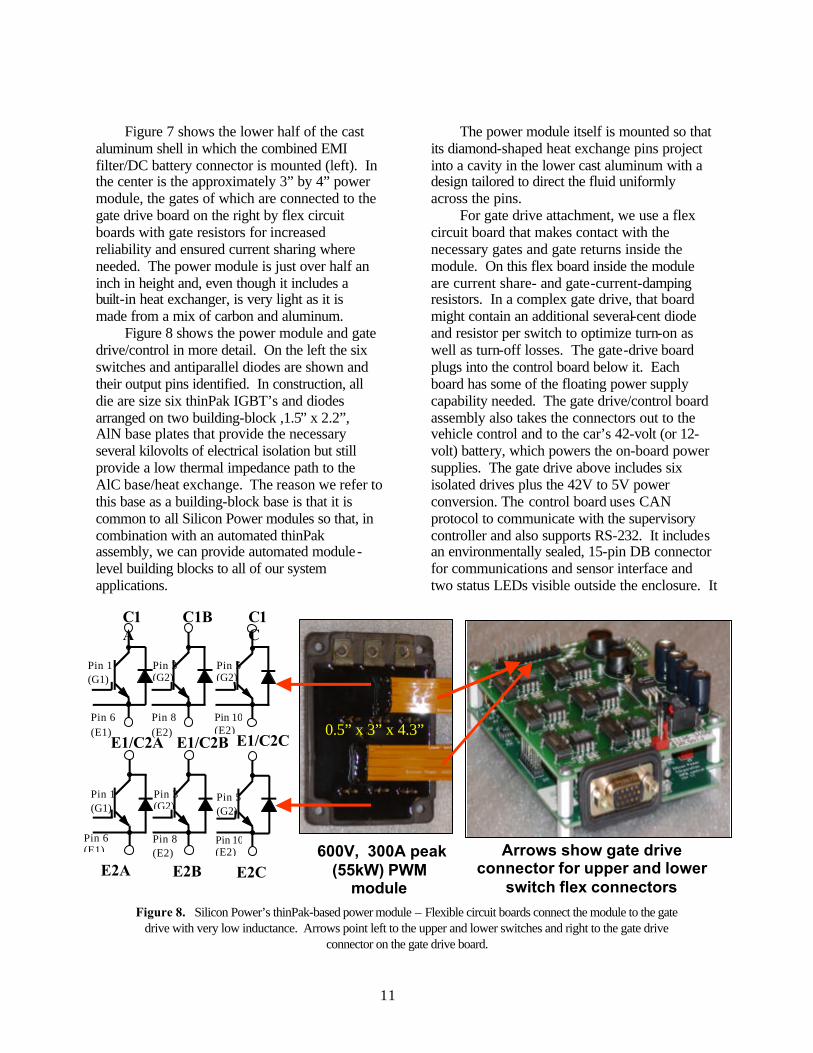
Figure 7 shows the lower half of the cast aluminum shell in which the combined EMI filter/DC battery connector is mounted (left). In the center is the approximately 3” by 4” power module, the gates of which are connected to the gate drive board on the right by flex circuit boards with gate resistors for increased reliability and ensured current sharing where needed. The power module is just over half an inch in height and, even though it includes a built-in heat exchanger, is very light as it is made from a mix of carbon and aluminum.
Figure 8 shows the power module and gate drive/control in more detail. On the left the six switches and antiparallel diodes are shown and their output pins identified. In construction, all die are size six thinPak IGBT’s and diodes arranged on two building-block ,1.5” x 2.2”, AlN base plates that provide the necessary several kilovolts of electrical isolation but still provide a low thermal impedance path to the AlC base/heat exchange. The reason we refer to this base as a building-block base is that it is common to all Silicon Power modules so that, in combination with an automated thinPak assembly, we can provide automated module-level building blocks to all of our system applications.
The power module itself is mounted so that its diamond-shaped heat exchange pins project into a cavity in the lower cast aluminum with a design tailored to direct the fluid uniformly across the pins.
For gate drive attachment, we use a flex circuit board that makes contact with the necessary gates and gate returns inside the module. On this flex board inside the module are current share- and gate-current-damping resistors. In a complex gate drive, that board might contain an additional several-cent diode and resistor per switch to optimize turn-on as well as turn-off losses. The gate-drive board plugs into the control board below it. Each board has some of the floating power supply capability needed. The gate drive/control board assembly also takes the connectors out to the vehicle control and to the car’s 42-volt (or 12-volt) battery, which powers the on-board power supplies. The gate drive above includes six isolated drives plus the 42V to 5V power conversion. The control board uses CAN protocol to communicate with the supervisory controller and also supports RS-232. It includes an environmentally sealed, 15-pin DB connector for communications and sensor interface and two status LEDs visible outside the enclosure. It
E1/C2C
Pin 1 (G1)
Pin 6 (E1)
C1A
E1/C2A
Pin 3 (G2)
C1B
E1/C2B
C1C
Pin 8 (E2)
Pin 5 (G2)
Pin 10 (E2)
Pin 1 (G1)
Pin 6 (E1)
E2A
Pin 3 (G2)
Pin 8 (E2)
Pin 5 (G2)
Pin 10 (E2)
E2B E2C 600V, 300A peak
(55kW) PWM module
0.5” x 3” x 4.3”
Arrows show gate drive connector for upper and lower
switch flex connectors
Figure 8. Silicon Power’s thinPak-based power module – Flexible circuit boards connect the module to the gate drive with very low inductance. Arrows point left to the upper and lower switches and right to the gate drive
connector on the gate drive board.

12
also features the TI TMS2406 DSP and vector motor control software and houses the +15/-15/ +3.3V power supplies.
Figure 9 shows the electrical performance of the power module using devices that Silicon Power helped to develop for Harris Semiconductor through the ONR PEBB program. This technology now belongs to Fairchild and includes the very-low-forward-drop, high-speed and low-switching-loss IGBT’s, the curves of which are shown in the figure. In both the case of the diode (one size six die) and the IGBT (three parallel size six die) the conduction drop at 300A, our peak device current, is approximately two volts. These low losses justify reducing the silicon area in our Gen2 modules. Since the number of parallel die are not a cost issue given the automation planned, it can be evaluated on a cost and reliability basis. Both favor paralleling die: cost on the basis of die yield per ampere and reliability based on better spreading the heat and lower expansion mismatch stress. Only if greatly different forward-drop die are paralleled would there be a difficulty. However, since individual thinPak die can be tested at full
current, we will always be able to deal with whatever distribution of forward drop the Fairchild process (at Mountaintop, PA) provides.
Instead of showing switching waveforms at high voltage and current, Figure 9 indicates that the effective switching time at elevated temperature is ~90 na. This number is produced by adding turn-off and turn-on loss at rated voltage and peak current and then dividing by the current and voltage. With this number, switching losses in a complex system can be approximated by multiplying the average switching current by the switching voltage and the switching frequency. With a 12-kHz switching frequency, a 300-volt bus voltage and an average current of under 100A, total switching losses are only 32W per switch and <200W for the six IGBT switches.
Adding the dc bus capacitor board and mounting the current sensors brings us to the nearly complete Gen2 Silicon Power pre-alpha unit shown in Figure 10. A small circuit board that supports the sensor function (not shown) is connected to a small connector cable already wired into the control board. The inset figure on the left shows the power cables to the battery are
Pin 1 (G1)
Pin 6 (E1)
CA
EA
Pin 3 (G2)
CB
EB
CC
EC
Pin 8 (E2)
Pin 5 (G2)
Pin 10 (E2)
125C VCE(SAT)
0
100
200
300
400
500
0.0 0.5 1.0 1.5 2.0 2.5 3.0 3.5 4.0
VCE(SAT) - V
IC -
A
vge=7Vvge=8v
vge=9Vvge=10Vvge=11V
vge=12Vvge=13Vvge=14V
vge=15V
125C Saturation Characteristics
VGE=7V
VGE=15V
VGE=8V
VGE=9V
25oC Saturation Characteristics
0
100
200
300
400
500
0.0 0.5 1.0 1.5 2.0 2.5 3.0 3.5 4.0VCE(SAT) - V
I C -
A
VGE=7V
VGE=8V
VGE=9V
VGE=10V
VGE=12V
VGE=15V
3 Size 6 thinPak
IGBT die
3 Size 6 thinPak
IGBT die
Diode Forward Characteristics
0
100
200
300
400
500
0 0.5 1 1.5 2 2.5 3VF - V
I F -
A
TC=25oCTC=125oC
1 Size 6 thinPak Diode die
Effective switching time with module diode: ~90 ns at 125C(switching loss = teff*I*V)
Pin 1 (G1)
Pin 6 (E1)
CA
EA
Pin 3 (G2)
CB
EB
CC
EC
Pin 8 (E2)
Pin 5 (G2)
Pin 10 (E2)
Pin 1 (G1)
Pin 6 (E1)
CA
EA
Pin 3 (G2)
CB
EB
CC
EC
Pin 8 (E2)
Pin 5 (G2)
Pin 10 (E2)
125C VCE(SAT)
0
100
200
300
400
500
0.0 0.5 1.0 1.5 2.0 2.5 3.0 3.5 4.0
VCE(SAT) - V
IC -
A
vge=7Vvge=8v
vge=9Vvge=10Vvge=11V
vge=12Vvge=13Vvge=14V
vge=15V
125C Saturation Characteristics
VGE=7V
VGE=15V
VGE=8V
VGE=9V
25oC Saturation Characteristics
0
100
200
300
400
500
0.0 0.5 1.0 1.5 2.0 2.5 3.0 3.5 4.0VCE(SAT) - V
I C -
A
VGE=7V
VGE=8V
VGE=9V
VGE=10V
VGE=12V
VGE=15V
3 Size 6 thinPak
IGBT die
3 Size 6 thinPak
IGBT die
Diode Forward Characteristics
0
100
200
300
400
500
0 0.5 1 1.5 2 2.5 3VF - V
I F -
A
TC=25oCTC=125oC
1 Size 6 thinPak Diode die
Diode Forward Characteristics
0
100
200
300
400
500
0 0.5 1 1.5 2 2.5 3VF - V
I F -
A
TC=25oCTC=125oC
1 Size 6 thinPak Diode die
Effective switching time with module diode: ~90 ns at 125C(switching loss = teff*I*V)
Figure 9. Electrical performance of the Silicon Power thinPak-based power module
13
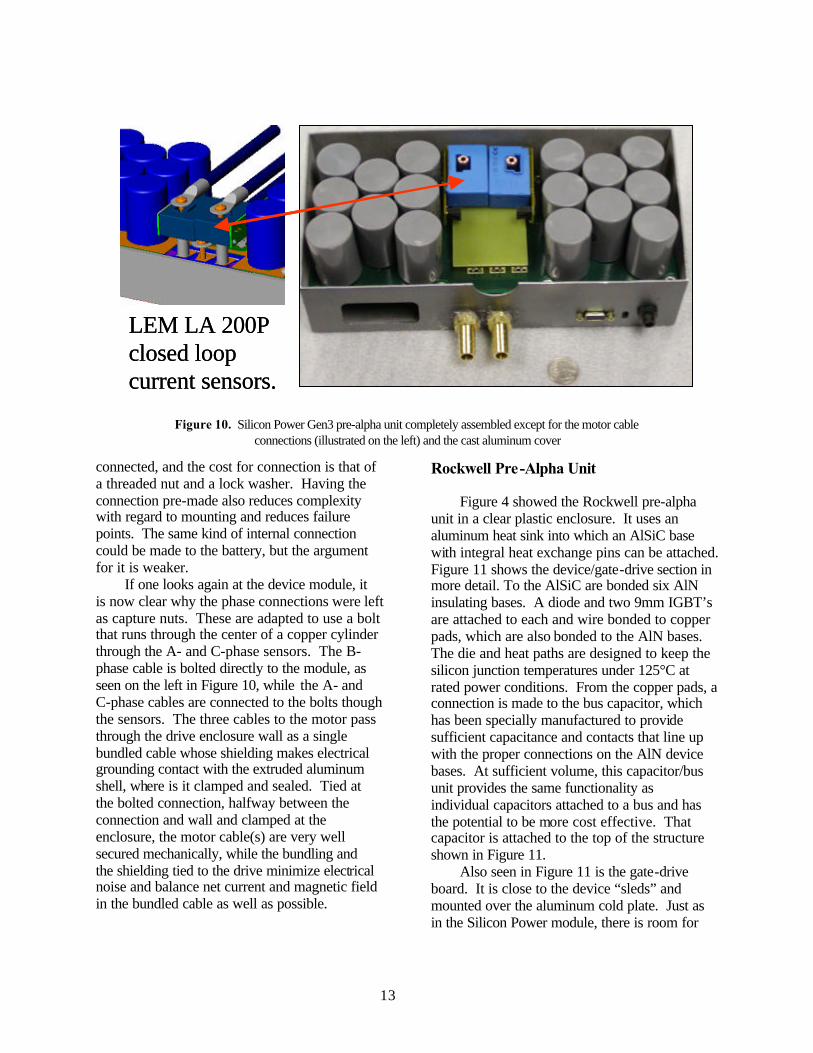
connected, and the cost for connection is that of a threaded nut and a lock washer. Having the connection pre-made also reduces complexity with regard to mounting and reduces failure points. The same kind of internal connection could be made to the battery, but the argument for it is weaker.
If one looks again at the device module, it is now clear why the phase connections were left as capture nuts. These are adapted to use a bolt that runs through the center of a copper cylinder through the A- and C-phase sensors. The B-phase cable is bolted directly to the module, as seen on the left in Figure 10, while the A- and C-phase cables are connected to the bolts though the sensors. The three cables to the motor pass through the drive enclosure wall as a single bundled cable whose shielding makes electrical grounding contact with the extruded aluminum shell, where is it clamped and sealed. Tied at the bolted connection, halfway between the connection and wall and clamped at the enclosure, the motor cable(s) are very well secured mechanically, while the bundling and the shielding tied to the drive minimize electrical noise and balance net current and magnetic field in the bundled cable as well as possible.
Rockwell Pre-Alpha Unit
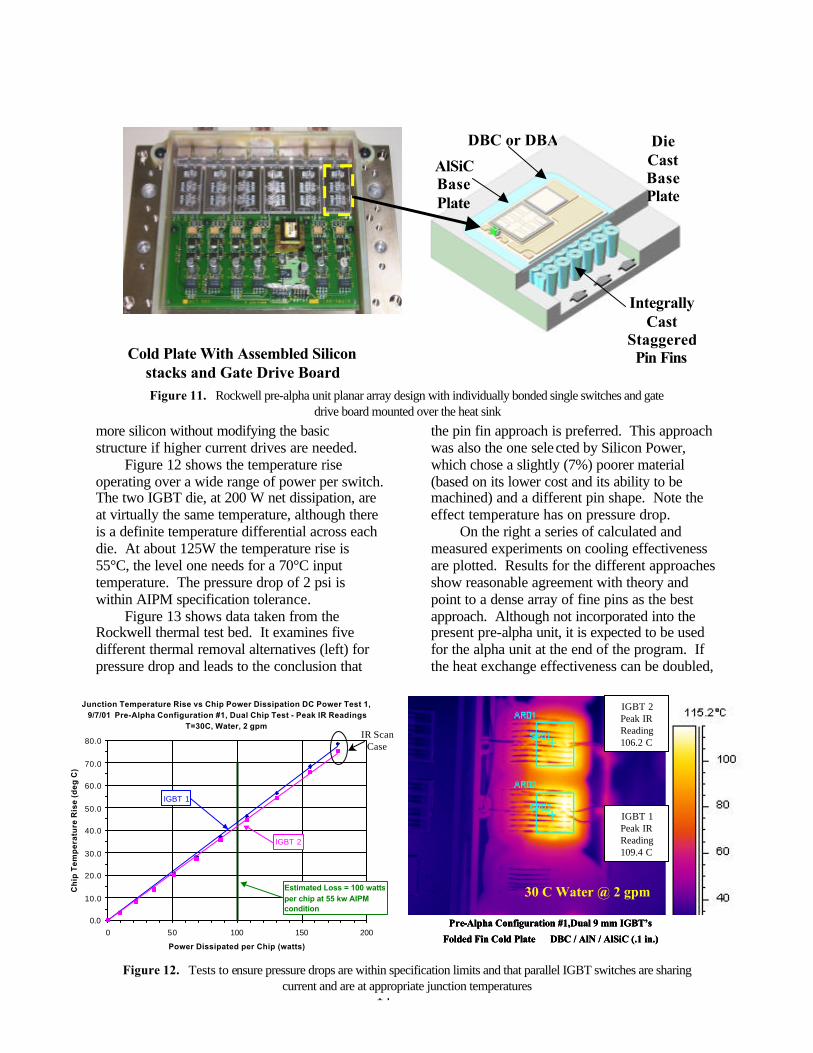
Figure 4 showed the Rockwell pre-alpha unit in a clear plastic enclosure. It uses an aluminum heat sink into which an AlSiC base with integral heat exchange pins can be attached. Figure 11 shows the device/gate-drive section in more detail. To the AlSiC are bonded six AlN insulating bases. A diode and two 9mm IGBT’s are attached to each and wire bonded to copper pads, which are also bonded to the AlN bases. The die and heat paths are designed to keep the silicon junction temperatures under 125°C at rated power conditions. From the copper pads, a connection is made to the bus capacitor, which has been specially manufactured to provide sufficient capacitance and contacts that line up with the proper connections on the AlN device bases. At sufficient volume, this capacitor/bus unit provides the same functionality as individual capacitors attached to a bus and has the potential to be more cost effective. That capacitor is attached to the top of the structure shown in Figure 11.
Also seen in Figure 11 is the gate-drive board. It is close to the device “sleds” and mounted over the aluminum cold plate. Just as in the Silicon Power module, there is room for
LEM LA 200P closed loopcurrent sensors.
LEM LA 200P closed loopcurrent sensors.
Figure 10. Silicon Power Gen3 pre-alpha unit completely assembled except for the motor cable connections (illustrated on the left) and the cast aluminum cover
14
more silicon without modifying the basic structure if higher current drives are needed.
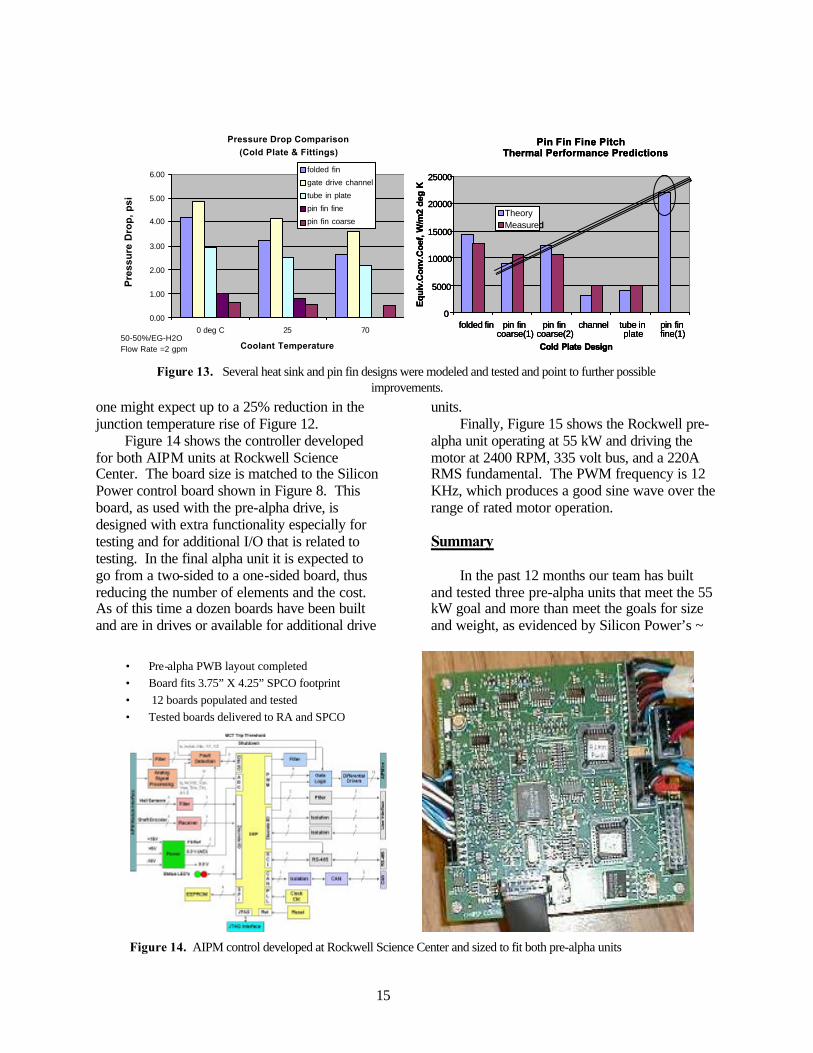
Figure 12 shows the temperature rise operating over a wide range of power per switch. The two IGBT die, at 200 W net dissipation, are at virtually the same temperature, although there is a definite temperature differential across each die. At about 125W the temperature rise is 55°C, the level one needs for a 70°C input temperature. The pressure drop of 2 psi is within AIPM specification tolerance.
Figure 13 shows data taken from the Rockwell thermal test bed. It examines five different thermal removal alternatives (left) for pressure drop and leads to the conclusion that
the pin fin approach is preferred. This approach was also the one selected by Silicon Power, which chose a slightly (7%) poorer material (based on its lower cost and its ability to be machined) and a different pin shape. Note the effect temperature has on pressure drop.
On the right a series of calculated and measured experiments on cooling effectiveness are plotted. Results for the different approaches show reasonable agreement with theory and point to a dense array of fine pins as the best approach. Although not incorporated into the present pre-alpha unit, it is expected to be used for the alpha unit at the end of the program. If the heat exchange effectiveness can be doubled,
Cold Plate With Assembled Silicon stacks and Gate Drive Board
DBC or DBA
AlSiC Base Plate
Integrally Cast
Staggered Pin Fins
Die Cast Base Plate
Figure 11. Rockwell pre-alpha unit planar array design with individually bonded single switches and gate drive board mounted over the heat sink
Junction Temperature Rise vs Chip Power Dissipation DC Power Test 1, 9/7/01 Pre-Alpha Configuration #1, Dual Chip Test - Peak IR Readings
T=30C, Water, 2 gpm
IGBT 1
IGBT 2
0.0
10.0
20.0
30.0
40.0
50.0
60.0
70.0
80.0
0 50 100 150 200
Power Dissipated per Chip (watts)
Ch
ip T
em
pe
ratu
re R
ise
(d
eg
C)
Estimated Loss = 100 watts per chip at 55 kw AIPM condition
IR ScanCase
IGBT 2Peak IR Reading106.2 C
IGBT 1Peak IR Reading109.4 C
Pre-Alpha Configuration #1,Dual 9 mm IGBT’s
Folded Fin Cold Plate DBC / AlN / AlSiC (.1 in.)
30 C Water @ 2 gpm
Junction Temperature Rise vs Chip Power Dissipation DC Power Test 1, 9/7/01 Pre-Alpha Configuration #1, Dual Chip Test - Peak IR Readings
T=30C, Water, 2 gpm
IGBT 1
IGBT 2
0.0
10.0
20.0
30.0
40.0
50.0
60.0
70.0
80.0
0 50 100 150 200
Power Dissipated per Chip (watts)
Ch
ip T
em
pe
ratu
re R
ise
(d
eg
C)
Estimated Loss = 100 watts per chip at 55 kw AIPM condition
IR ScanCase
IGBT 2Peak IR Reading106.2 C
IGBT 1Peak IR Reading109.4 C
Pre-Alpha Configuration #1,Dual 9 mm IGBT’s
Folded Fin Cold Plate DBC / AlN / AlSiC (.1 in.)
30 C Water @ 2 gpm
IGBT 2Peak IR Reading106.2 C
IGBT 1Peak IR Reading109.4 C
Pre-Alpha Configuration #1,Dual 9 mm IGBT’s
Folded Fin Cold Plate DBC / AlN / AlSiC (.1 in.)
30 C Water @ 2 gpm
Figure 12. Tests to ensure pressure drops are within specification limits and that parallel IGBT switches are sharing current and are at appropriate junction temperatures
15
• Pre-alpha PWB layout completed• Board fits 3.75” X 4.25” SPCO footprint• 12 boards populated and tested• Tested boards delivered to RA and SPCO
one might expect up to a 25% reduction in the junction temperature rise of Figure 12.
Figure 14 shows the controller developed for both AIPM units at Rockwell Science Center. The board size is matched to the Silicon Power control board shown in Figure 8. This board, as used with the pre-alpha drive, is designed with extra functionality especially for testing and for additional I/O that is related to testing. In the final alpha unit it is expected to go from a two-sided to a one-sided board, thus reducing the number of elements and the cost. As of this time a dozen boards have been built and are in drives or available for additional drive
units. Finally, Figure 15 shows the Rockwell pre-
alpha unit operating at 55 kW and driving the motor at 2400 RPM, 335 volt bus, and a 220A RMS fundamental. The PWM frequency is 12 KHz, which produces a good sine wave over the range of rated motor operation. Summary
In the past 12 months our team has built and tested three pre-alpha units that meet the 55 kW goal and more than meet the goals for size and weight, as evidenced by Silicon Power’s ~
Pressure Drop Comparison(Cold Plate & Fittings)
0.00
1.00
2.00
3.00
4.00
5.00
6.00
0 deg C 25 70
Coolant Temperature
Pre
ssu
re D
rop
, psi
folded fin
gate drive channel
tube in plate
pin fin fine
pin fin coarse
50-50%/EG-H2OFlow Rate =2 gpm
Pin Fin Fine PitchThermal Performance Predictions
0
5000
10000
15000
20000
25000
folded fin pin fincoarse(1)
pin fincoarse(2)
channel tube inplate
pin finfine(1)
Cold Plate Design
Eq
uiv
.Co
nv.
Co
ef, W
/m2
deg
K
TheoryMeasured
Pin Fin Fine PitchThermal Performance Predictions
0
5000
10000
15000
20000
25000
folded fin pin fincoarse(1)
pin fincoarse(2)
channel tube inplate
pin finfine(1)
Cold Plate Design
Eq
uiv
.Co
nv.
Co
ef, W
/m2
deg
K
TheoryMeasuredTheoryMeasured
Figure 13. Several heat sink and pin fin designs were modeled and tested and point to further possible improvements.
Figure 14. AIPM control developed at Rockwell Science Center and sized to fit both pre-alpha units
16
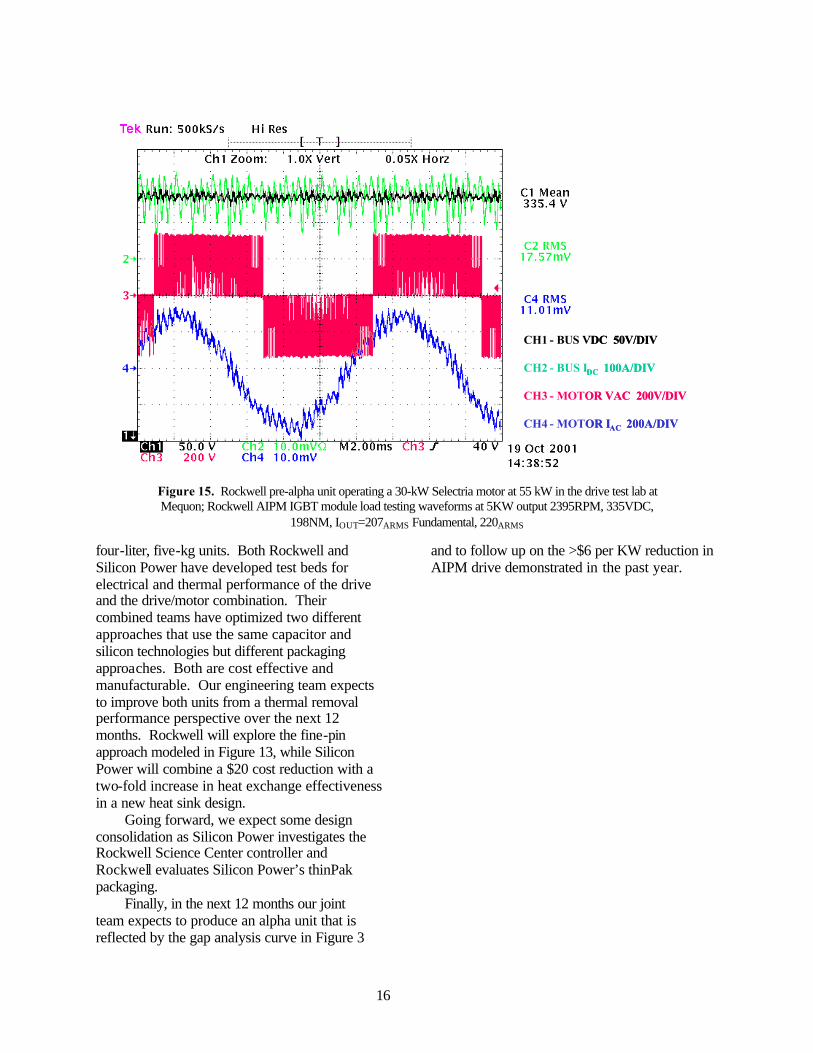
four-liter, five-kg units. Both Rockwell and Silicon Power have developed test beds for electrical and thermal performance of the drive and the drive/motor combination. Their combined teams have optimized two different approaches that use the same capacitor and silicon technologies but different packaging approaches. Both are cost effective and manufacturable. Our engineering team expects to improve both units from a thermal removal performance perspective over the next 12 months. Rockwell will explore the fine-pin approach modeled in Figure 13, while Silicon Power will combine a $20 cost reduction with a two-fold increase in heat exchange effectiveness in a new heat sink design.
Going forward, we expect some design consolidation as Silicon Power investigates the Rockwell Science Center controller and Rockwell evaluates Silicon Power’s thinPak packaging.
Finally, in the next 12 months our joint team expects to produce an alpha unit that is reflected by the gap analysis curve in Figure 3
and to follow up on the >$6 per KW reduction in AIPM drive demonstrated in the past year.
CH1 - BUS VDC 50V/DIV
CH2 - BUS IDC 100A/DIV
CH3 - MOTOR VAC 200V/DIV
CH4 - MOTOR IAC 200A/DIV
CH1 - BUS VDC 50V/DIV
CH2 - BUS IDC 100A/DIV
CH3 - MOTOR VAC 200V/DIV
CH4 - MOTOR IAC 200A/DIV
Figure 15. Rockwell pre-alpha unit operating a 30-kW Selectria motor at 55 kW in the drive test lab at Mequon; Rockwell AIPM IGBT module load testing waveforms at 5KW output 2395RPM, 335VDC,
198NM, IOUT=207ARMS Fundamental, 220ARMS
17
Automotive Integrated Power Module (AIPM) Program Mark Harris SatCon Technology Corporation 161 First Street Cambridge, MA 02142 (617)-349-0819. [email protected]
DOE Program Manager: David Hamilton (202) 586-2314; fax: (202) 505-844-9781; e-mail: [email protected]
Introduction The past year has seen significant successes in the development of the SatCon Automotive Integrated Power Module (AIPM) inverter/motor-drive. These demonstrated successes have brought the concept of low cost motor drive technology closer to reality. Providing the automotive industry with options heretofore unavailable in the area of low cost rugged power electronics for next generation vehicles. Power electronics are an enabling technology for hybrid electric vehicles making these fuel efficient and capable vehicles competitive.
While the technical successes of the past year have been significant, the nuances of government programs necessitated changes in the direction and priority of our effort. These are not unique issues or problems, but contribute to potential program and development delays and necessitate the expenditure of effort away from the program goal of advancing technology in a timely and efficient manner. SatCon continues to be sensitive to these iterations of focus and priority and is encouraged with the results to date and potential for future applications of the AIPM design.
The following report outlines the programmatic and technical successes of the past year. It also provides a plan for completing the program to the benefit of industry, government and the general public.
Objective Develop a motor drive inverter for automotive propulsion applications that that can be built for less than $7/kW (~55kW @ ~300V) in production quantities of 100,000 per year in the 2005 time frame.
SatCon’s Approach Design a motor drive using a mixture of state of the art and state of the industry component and manufacturing technologies, thereby, reducing the development risks for near term high volume production. This approach caused us to focus our attention on: 1) the “bill-of-materials,” primarily a short list of high-cost components specific to high-power electronic modules; and 2) the manufacturing technology to eliminate manual assembly of the AIPM inverter utilizing standard, low-cost tooling.
The primary cost driver in the bill-of-materials is the switching devices. This cost is driven by the production quantities of devices produced and the yield/wafer. SatCon’s approach to minimizing the costs associated with rejects presents a solution that departs from that of our competitors. The strategy is to use the IGBT/diode die as the basic building block, then assemble this block into a package that provides electrical isolation to a heat-sink assembly. This approach minimizes the cost associated with device and manufacturing rejects by limiting exposure to a minimum set of power die. By compression bonding these components to the heat-sink SatCon has removed the cost and risk associated with soldering the substrate to the heat-sink assembly.
SatCon’s experience shows that the primary cost driver in the assembly process is manual assembly associated with multi-axis component placement. SatCon’s solution to this issue is to integrate the power and control
18
electronics into an assembly that can be produced using Surface Mount Technology (SMT) and standard SMT tooling. The whole inverter assembly consists of very few parts that can be easily assembled using standard, automated pick-and-place techniques.
In FY2000 SatCon developed the design for the pre production inverter to test and evaluate the overall design approach and several of the components in the inverters design approach. This design was then carried forward into FY 2001.
Accomplishments Overview In the past year SatCon has assembled and tested the AIPM power stage to include the new IGBT switching modules, gate drive, and isolated power supply assemblies. The components were largely provided by production-intent-suppliers using low volume assembly processes. The
power stage has been subjected to multiple levels of performance test and evaluation. This includes device parameter characterization, power cycling, and high speed dynamometer test. Evaluation of the manufacturing process has included techniques varying from acoustic microscopy to
destructive physical analysis. Various process and design issues have been identified and corrected during initial inverter testing. Preliminary ideas for improvements and revisions to be implemented in a Production Intent design have been developed from practical experience, inputs from the vendors and testing.
Technical information SatCon’s AIPM inverter Program
is focused on meeting the need for low cost rugged environment power electronics for electric vehicle programs, and many other existing and emerging power electronic applications and markets. The
requirements for an inverter to meet the automotive industries needs is not dissimilar to that of many other applications. The SatCon design includes the basic components of any inverter and with a flexible control architecture and a power interface that can accommodate the needs of various battery systems and application specific input and output customization.
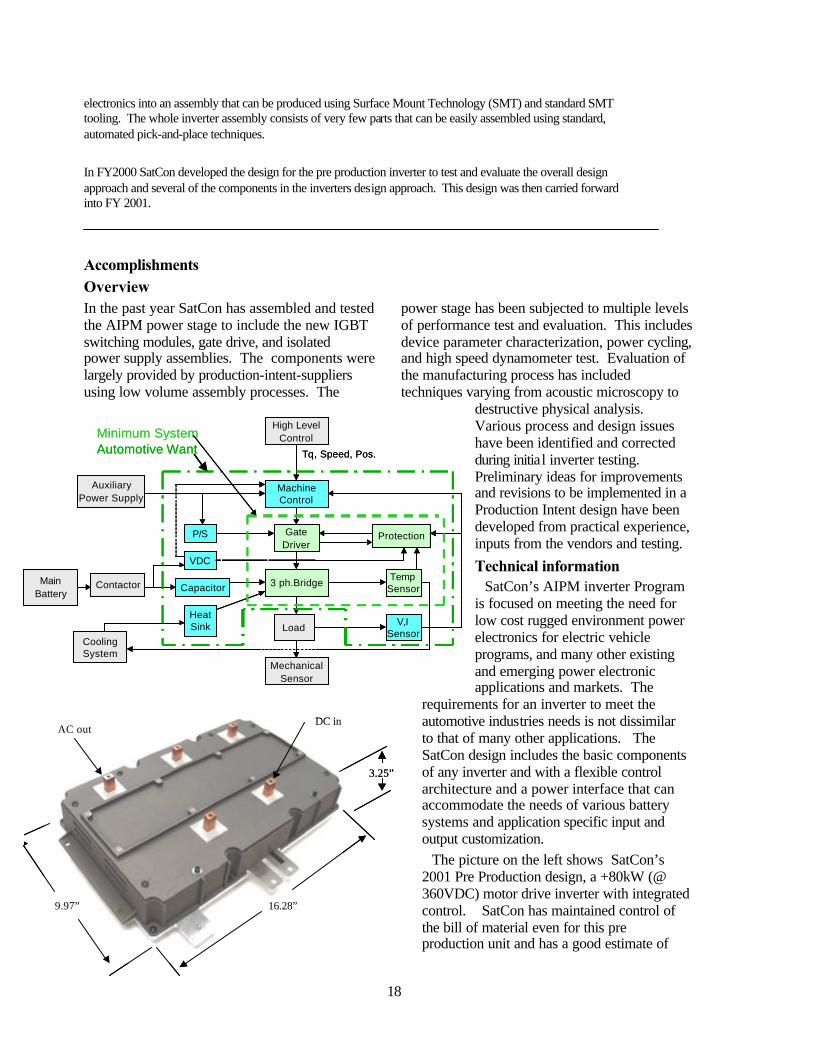
The picture on the left shows SatCon’s 2001 Pre Production design, a +80kW (@ 360VDC) motor drive inverter with integrated control. SatCon has maintained control of the bill of material even for this pre production unit and has a good estimate of
AC outDC in
9.97” 16.28”
3.25”
AC outDC in
9.97” 16.28”
3.25”
High LevelControl
GateDriver
3 ph.Bridge
Load
MechanicalSensor
MachineControl
Protection
TempSensor
V,ISensor
P/S
VDC
CapacitorContactor
HeatSink
AuxiliaryPower Supply
MainBattery
CoolingSystem
Tq, Speed, Pos.
Minimum SystemAutomotive Want
High LevelControl
GateDriver
3 ph.Bridge
Load
MechanicalSensor
MachineControl
Protection
TempSensor
V,ISensor
P/S
VDC
CapacitorContactor
HeatSink
AuxiliaryPower Supply
MainBattery
CoolingSystem
Tq, Speed, Pos.
Minimum SystemAutomotive Want
19
production costs in various production quantities. The current production cost is estimated to be approximately $10/kW for this design. Further refinement and sizing should bring the production cost of the 55kW objective inverter to the goal of $7/kW
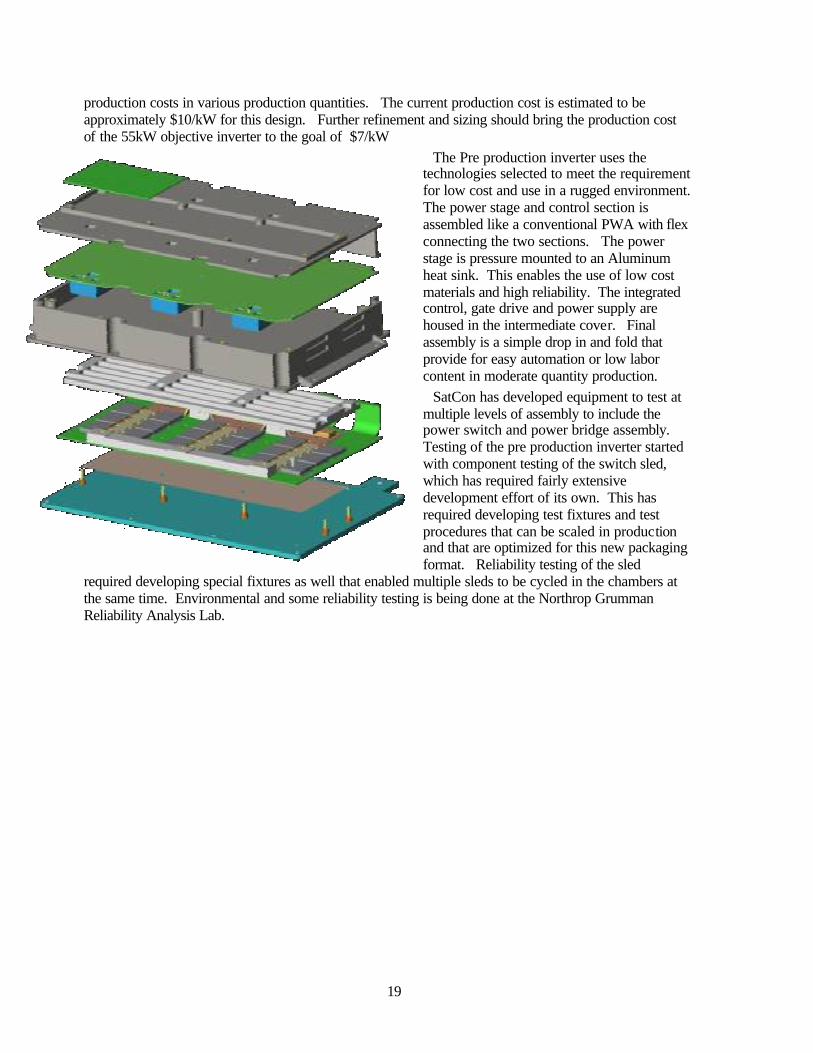
The Pre production inverter uses the technologies selected to meet the requirement for low cost and use in a rugged environment. The power stage and control section is assembled like a conventional PWA with flex connecting the two sections. The power stage is pressure mounted to an Aluminum heat sink. This enables the use of low cost materials and high reliability. The integrated control, gate drive and power supply are housed in the intermediate cover. Final assembly is a simple drop in and fold that provide for easy automation or low labor content in moderate quantity production.
SatCon has developed equipment to test at multiple levels of assembly to include the power switch and power bridge assembly. Testing of the pre production inverter started with component testing of the switch sled, which has required fairly extensive development effort of its own. This has required developing test fixtures and test procedures that can be scaled in production and that are optimized for this new packaging format. Reliability testing of the sled
required developing special fixtures as well that enabled multiple sleds to be cycled in the chambers at the same time. Environmental and some reliability testing is being done at the Northrop Grumman Reliability Analysis Lab.
20
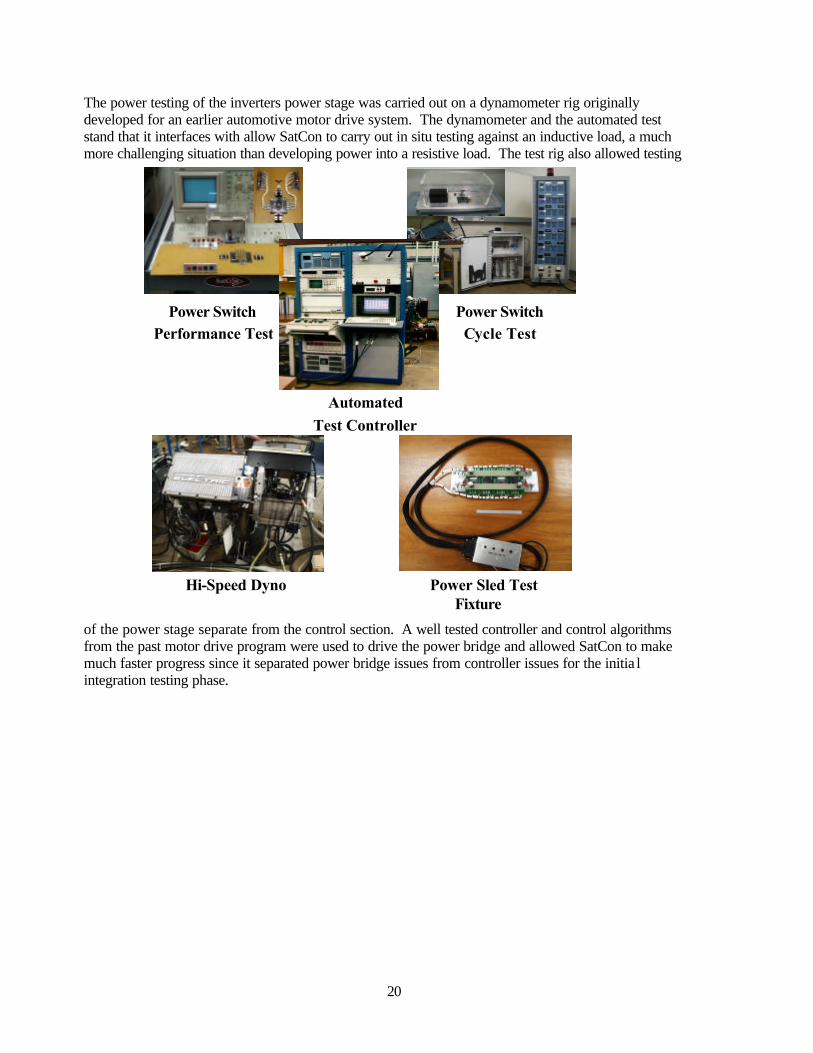
The power testing of the inverters power stage was carried out on a dynamometer rig originally developed for an earlier automotive motor drive system. The dynamometer and the automated test stand that it interfaces with allow SatCon to carry out in situ testing against an inductive load, a much more challenging situation than developing power into a resistive load. The test rig also allowed testing
of the power stage separate from the control section. A well tested controller and control algorithms from the past motor drive program were used to drive the power bridge and allowed SatCon to make much faster progress since it separated power bridge issues from controller issues for the initia l integration testing phase.
Hi-Speed Dyno Power Sled Test Fixture
Automated Test Controller
Power Switch Performance Test
Power Switch Cycle Test

21
Conclusion/Summary The AIPM inverter configuration and manufacturing concepts have been identified and a pre production unit designed based upon those concepts. Several pre production inverters have been assembled and initial integration testing carried out. Design concepts for the Production Intent Module have been outlined and prototypes have been built. Areas of cost improvement and manufacturing improvement have been identified and we are ready to begin design of the production intent power bridge assembly. Progress on the inverter has been hampered by continuing issues about future funding and direction of the program both in the DoE and automakers.
Future Direction Fiscal Year 2002 is the last scheduled year of the program, in this year the pre production inverter will be validated and the production intent inverter design developed and tested. This schedule is based upon full funding of the program effort. Integration testing and validation of the pre production inverter will continue. The controller with a low voltage digital signal processor will be integrated with the power bridge and testing carried out. The inverter will continue testing on both resistive and inductive loads and the control loop fully integrated. Durability testing of the Pre Production design will be carried out, with an emphasis on the power sleds. The production intent inverter design will be an evolution of the pre production design to improve compactness, eliminate manufacturing process steps, and reduce cost. The power sled design will be evolved, improved, probably size reduced and a commercial volume source of supply developed. Low cost current sensors will be investigated and if at all possible integrated in this inverter. Capacitor technology for improved and more compact system configuration will be investigated. If full funding is received the components for the production intent design will be acquired and
units built and tested. The production intent inverters will be validated and a final specification generated. The module and the components will be put through a durability testing cycle to validate the performance in a rugged automotive environment. During this year SatCon will work with first and second tier suppliers to find applications for the inverter and for power electronic sub systems based on the work done in this program.

22
The Development of the Automotive Integrated Power Module (AIPM)
Mike Toland Semikron 11 Executive Drive Hudson, NH 03051 (603) 883-8102; e-mail: [email protected]
DOE Program Manager: David Hamilton (202) 586-2314; fax: (202) 586-9811; e-mail: [email protected]
Objective • Develop an intelligent power module for the automotive industry • Develop two power modules, 42-volt and 450-volt • Expand the manufacturing and test capability • Reduce overall cost through process improvements in our existing semiconductor fabrication and the development
of improved performance semiconductors within our vendors Approach
Semiconductor development for the MOSFET (metal-oxide semiconductor field-effect transistor) switches for the 42-volt module was further along in the development cycle than the IGBT’s (insulated gate bipolar transistor) used in the 450-volt module, so it was decided to build the 42-volt system first. Since these are the basic building blocks that offered the most improvement over existing systems, the experience gained on the 42-volt system would enable us to design and build the 450-volt system more efficiently.
Semikron has taken the following approach to reduce costs: Low cost and efficient semiconductors and discrete components combined with elimination of parasitic inductance will produce the lowest cost per amp power module.
Results
42 Volt AIPM
This past year we have focused our attention on building and testing the 42-volt AIPM module. With the building blocks of prior research and simulations in place we were able to build and
deliver for testing a prototype 42-volt AIPM. This included a redesign effort to simplify the bus structure and reduce the parts count. This AIPM combines the power section, DC link capacitors, heat sink, driver and protection circuitry, controller, current sensor, and interface connector in one module.
23
Performance testing of the device was completed. In all cases the electrical specifications were met or exceeded. The module was also subjected to limited environmental screening. The parts have completed 600 temperature cycles of -40 to 125°C without indication of degradation.
The redesigned module was delivered to Oak Ridge National Lab for evaluation testing, where we have completed the inductive load test portion of the test plan. 450-volt Module Design
Meeting the need of the Partnership for a
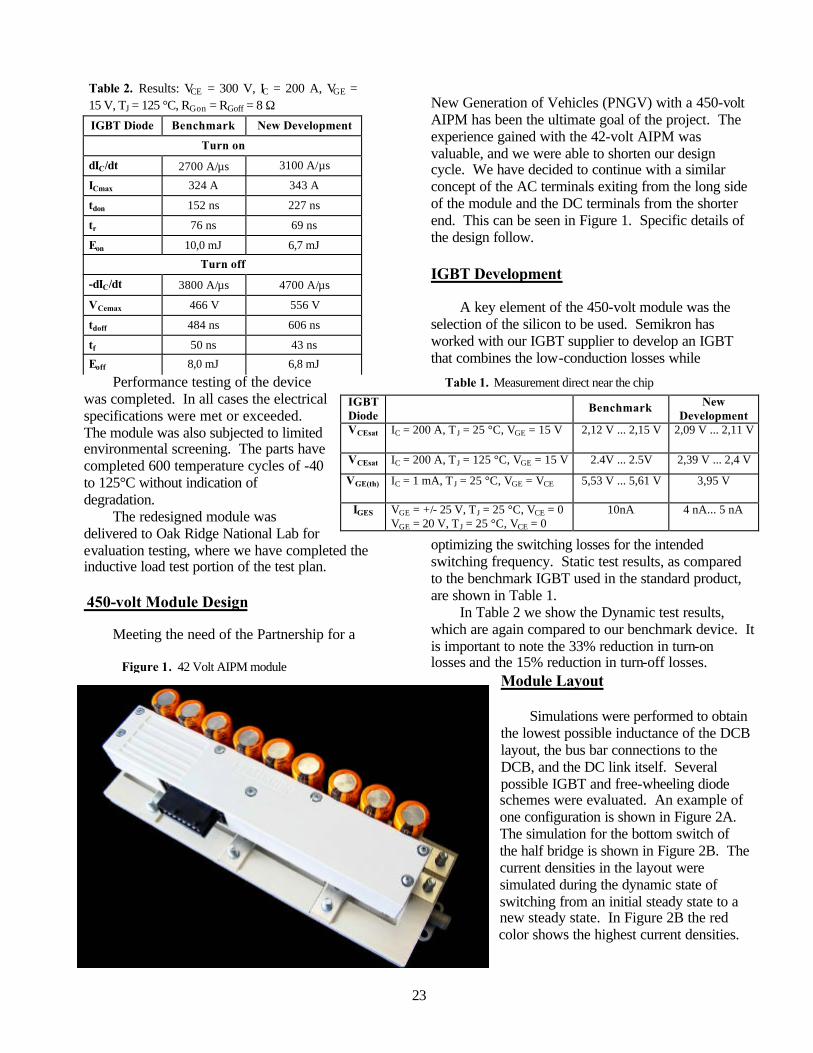
New Generation of Vehicles (PNGV) with a 450-volt AIPM has been the ultimate goal of the project. The experience gained with the 42-volt AIPM was valuable, and we were able to shorten our design cycle. We have decided to continue with a similar concept of the AC terminals exiting from the long side of the module and the DC terminals from the shorter end. This can be seen in Figure 1. Specific details of the design follow. IGBT Development
A key element of the 450-volt module was the selection of the silicon to be used. Semikron has worked with our IGBT supplier to develop an IGBT that combines the low-conduction losses while
optimizing the switching losses for the intended switching frequency. Static test results, as compared to the benchmark IGBT used in the standard product, are shown in Table 1.
In Table 2 we show the Dynamic test results, which are again compared to our benchmark device. It is important to note the 33% reduction in turn-on losses and the 15% reduction in turn-off losses.
Module Layout
Simulations were performed to obtain the lowest possible inductance of the DCB layout, the bus bar connections to the DCB, and the DC link itself. Several possible IGBT and free-wheeling diode schemes were evaluated. An example of one configuration is shown in Figure 2A. The simulation for the bottom switch of the half bridge is shown in Figure 2B. The current densities in the layout were simulated during the dynamic state of switching from an initial steady state to a new steady state. In Figure 2B the red color shows the highest current densities.
Table 1. Measurement direct near the chip IGBT Diode
Benchmark New Development
VCEsat IC = 200 A, TJ = 25 °C, VGE = 15 V 2,12 V ... 2,15 V 2,09 V ... 2,11 V
VCEsat IC = 200 A, TJ = 125 °C, VGE = 15 V 2.4V ... 2.5V 2,39 V ... 2,4 V
VGE(th) IC = 1 mA, TJ = 25 °C, VGE = VCE
5,53 V ... 5,61 V 3,95 V
IGES VGE = +/- 25 V, TJ = 25 °C, VCE = 0 VGE = 20 V, TJ = 25 °C, VCE = 0
10nA 4 nA... 5 nA
Table 2. Results: VCE = 300 V, IC = 200 A, VGE = 15 V, TJ = 125 °C, RGon = RGoff = 8 Ω IGBT Diode Benchmark New Development
Turn on
dIC/dt 2700 A/µs 3100 A/µs
ICmax 324 A 343 A
tdon 152 ns 227 ns
tr 76 ns 69 ns
Eon 10,0 mJ 6,7 mJ
Turn off
-dIC/dt 3800 A/µs 4700 A/µs
VCemax 466 V 556 V
tdoff 484 ns 606 ns
tf 50 ns 43 ns
Eoff 8,0 mJ 6,8 mJ
Figure 1. 42 Volt AIPM module

24
During this very fast switching, the current follows the least inductive path, and it is from there that we are able to determine and calculate the least-inductive DCB layout.
We have identified two possible layouts that will be built into prototype units for the 450-volt AIPM. Driver and Control Circuitry
Driver circuitry has been designed. Semikron
was able to reduce the cost of their standard drivers by tailoring the driver to application-specific requirements. Semikron has made alterations in the 42-volt driver to make it applicable to the 450-volt design. The software developed for the 42-volt design is also applicable to the 450-volt design, which was completed during this year. Heat Sink
The final evaluation of the heat sink testing
was performed. We were pleased to find that the thermal resistance of the heat sink was 0.019°C/Watt. This is low enough to dissipate an enormous amount of power. This information will be used in determining the amount of silicon used in the 450-volt AIPM. In the cost trade-off studies, the cost of the cast aluminum heat sink is low compared to the silicon die. Current Sensors
Significant progress was made for our current sensor using a Magneto resistive sensor mounted on the AC terminals. Simulations were performed
to determine the correct bus bar shape. During the year of development, we were able to simulate the proper bus bar shapes for various current ratings. We suffered a minor setback as the ASIC (application specific integrated circuit) devices used in the sensors were failing at elevated temperatures. We were able to recover by reverting to the discrete version and continuing to keep the ASIC as an incentive to cost reduction.
Manufacturing
We are in the process of qualifying the device and are setting up our initial marketing effort to introduce the unit into the commercial marketplace. Semikron has completed the building renovation, which allocated the floor space for manufacturing. We have been purchasing the equipment needed to build the modules.
Material has been ordered for the internal qualification of the devices. We are still in the process of design and are choosing an appropriate cover for the module. We feel that this part should be tailored to potential customers and their needs and thus have held off as long as possible in order to wait for that customer. To complete the testing of the device we will have to alter our strategy and implement our interim design.
We are in the process of obtaining our QS-9000 certification to be ready for the automotive marketplace. Future Initiatives
Initial documentation is being completed now for
the 450-volt module. A design review was scheduled for November of 2001. Through the end of the year we will be buying material to assemble the 450-volt
Figure 2A Figure 2B

25
AIPM prototypes. Testing of the device will be conducted during the first quarter of 2002. At that point, the first prototypes will be ready for delivery. We will again be ahead of schedule in accordance with our statement of work. The second and third quarters will be the redesign phase of the 450-volt AIPM as we clean up the issues that arise during prototype testing.
Our manufacturing group will be working with the automation integrators to identify the necessary equipment to reduce the assembly time, improve through put, and reduce the module costs. This will be the focus of the third and fourth quarters of 2002.
26
Automotive Integrated Power Module (AIPM) Validation Testing and Contract Support Laura D. Marlino Oak Ridge National Laboratory National Transportation Research Center 2360 Cherahala Boulevard Knoxville, Tennessee 37932 Voice: (865)-946-1245; Fax: (865)-241-6124; E-mail: [email protected] DOE Program Manager: David Hamilton Voice: (202) 586-2314; Fax: (202) 586-1600; E-mail: [email protected] ORNL Technical Advisor: Donald J. Adams Voice: (865) 946-1321; Fax: (865) 946-1262; E-mail: [email protected] Objectives
• Provide technical support to the automotive integrated power module (AIPM) contracts manager. • Plan, organize, and coordinate the testing of the individual AIPM units. • Develop a test plan and identify and purchase the equipment and instruments required to meet the
needs of the test plan. • Develop hardware and software for control, as well as data acquisition for testing. • Coordinate the development and assembly of the test cell and perform all required tests.
Approach
• The conformance to established standards will be assessed and the results will be utilized to determine the suitability of the AIPM technology for automotive applications.
Accomplishments
• A test plan has been written and reviewed by AIPM vendors and Tech Team members. • Environmental test procedures have been completed and arrangements made for testing facilities. • A dynamometer system has been installed and successfully operated in the Oak Ridge National
Laboratory (ORNL) test cell. • A multiquadrant dc supply capable of powering the AIPM units as well as performing regeneration
tests has been installed and tested at the ORNL facility. • Several motors to be utilized for the AIPM testing have been acquired and run on the dynamometer
system. • Inductive loads as well as dynamometer tests have been performed at ORNL with the 42-V
Semikron AIPM. • Testing of the Rockwell and SPCO units has been observed at the vendor sites. • Hardware has been purchased and integrated into the control and data acquisition systems for the
testing. • Software has been developed for data acquisition and acquired for control purposes.
27
Future Direction
• The AIPM must be designed and manufactured to overcome cost, volume, weight, thermal, and reliability barriers in order to meet technical targets. This project will verify the suppliers/developers success in accomplishing these ends.
Introduction The AIPM sub-task supports Department of Energy’s (DOE) program effort to research, develop, and demonstrate an integrated power module for use in advanced hybrid electric vehicles (HEVs) that meets the goals and schedule of the Partnership for a New Generation of Vehicles (PNGV). The overall objective is to sponsor a commercially viable inverter technology development effort that contributes to the goal of having a passenger vehicle with three times the fuel economy of present vehicles. To achieve this goal, the modules must meet the following requirements: reduction in size, weight, and manufacturing cost and improvements in efficiency and reliability. ORNL’s role for the AIPM project is to provide technical support to DOE, plan and organize the testing phases of the AIPM program, and validate the technology’s conformance with the AIPM specification requirements through testing of the units. ORNL has produced a test plan for the AIPM prototypes and production units according to the specifications and standard test procedures called out in the solicitation. ORNL has determined and specified the equipment and instrumentation required to meet the needs of the test plan. A necessary sub-task of the project is the identification of needed equipment and the development of necessary software to accomplish the testing. The most cost-effective methods of testing the AIPMs will be considered in the decision to purchase test equipment, leverage use of equipment from related work, or utilize facilities elsewhere. ORNL will perform the required configuring, assembling, and other tasks for testing fixtures to support the developed test method(s). ORNL’s activities for FY 2001 were to develop the required testing methods, review the test
plan with the concerned parties, specify and procure instrumentation and equipment to perform the testing, and provide technical support to the contract manager. In addition, testing equipment and control and data acquisition software were to be developed, tested, and integrated into a test bed. Preliminary testing of prototypes from the vendors was performed on site at ORNL. During FY 2002, electrical testing of the pre-production AIPM units will continue at ORNL. Some of the production units also will be available for testing. Environmental testing will also begin during the year.
28
ELECTRIC MOTOR DRIVE COMMERCIAL DEVELOPMENT
Delco/KAT Automotive Electric Motor Drive (AEMD) Development
Delco Remy International
2902 Enterprise Drive
Anderson, IN 46013
Objectives
The Lynx Motion Technology/Delco Remy International/Kinetic Art and Technology/Electricore team will strive to meet the following objectives for the Partnership for a New Generation of Vehicles (PNGV) Electric Motor Drive, utilizing patented Segmented Electro Magnetic Array (SEMA) motor technology:
• Meet PNGV Performance and Cost Requirements
• Develop 3 Generations of 15-kW (Parallel Hybrid) and 3 Generations of 30-kW (Series Hybrid) Proof of Concept Motors
• Perform Performance and Durability Tests
• Perform Preliminary Vehicle Testing
• Establish Domestic Supplier Base
• Develop Pilot SEMA Motor Manufacturing Cell
• Develop Proof of Product Motors
• Support PNGV Independent Testing in Q1 2002 and Q1 2003
Approach
The team has taken an iterative approach of motor drive development with the early stages dedicated to establishing key manufacturing technologies and supplier base. During this phase several prototypes were built to establish strengths and weaknesses of the technology as well as defining key areas of potential improvement. At the end of this phase, a comparison with competing technologies was begun in order to analyze the anticipated benefits and
direction of pursuing future technology development. Following this analysis, the final phase of design refinements and model improvements will begin with the ultimate goal of producing a cost-competitive traction drive that meets the PNGV performance requirements. The team is currently in the process of finalizing their analysis of the technology and defining the design direction for the final phases of the program.
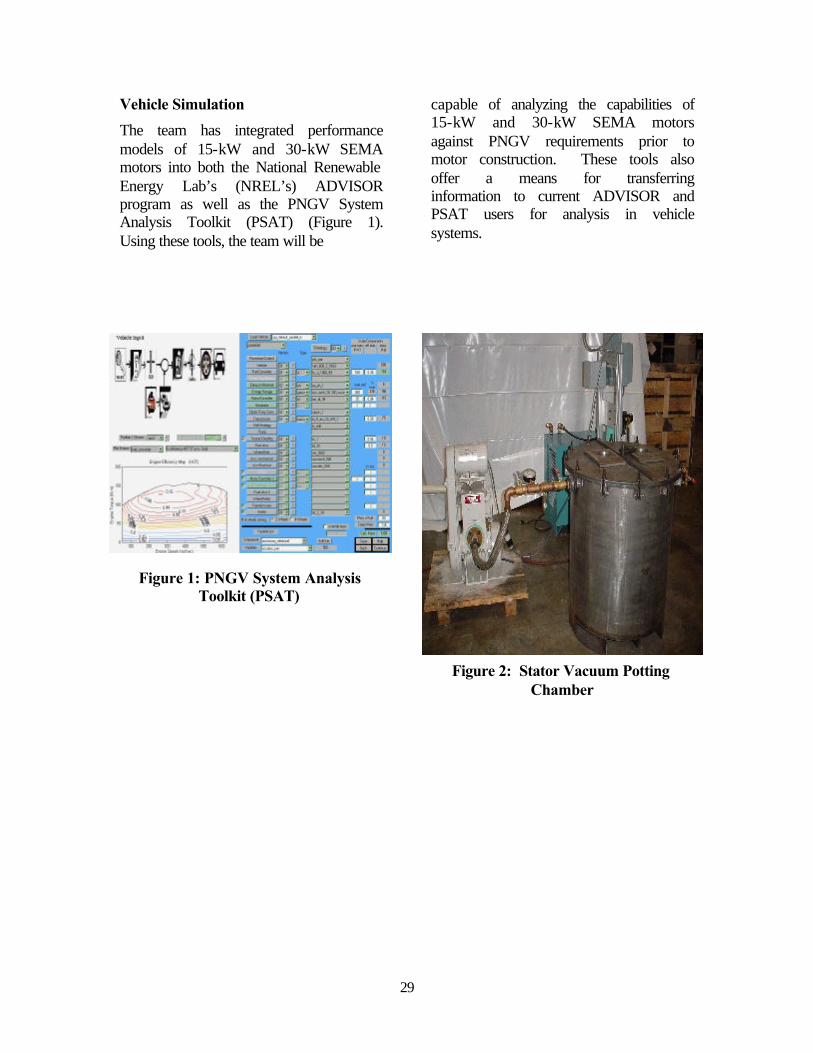
29
Vehicle Simulation
The team has integrated performance models of 15-kW and 30-kW SEMA motors into both the National Renewable Energy Lab’s (NREL’s) ADVISOR program as well as the PNGV System Analysis Toolkit (PSAT) (Figure 1). Using these tools, the team will be
capable of analyzing the capabilities of 15-kW and 30-kW SEMA motors against PNGV requirements prior to motor construction. These tools also offer a means for transferring information to current ADVISOR and PSAT users for analysis in vehicle systems.
Figure 1: PNGV System Analysis Toolkit (PSAT)
Figure 2: Stator Vacuum Potting Chamber
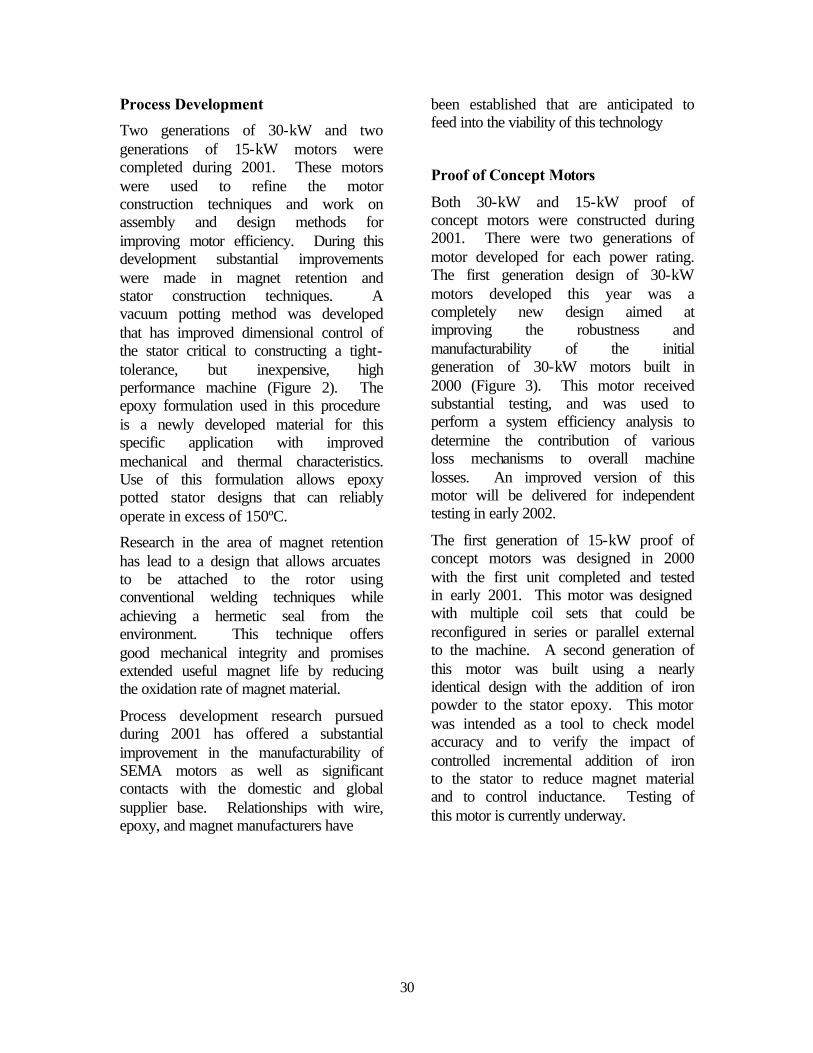
30
Process Development
Two generations of 30-kW and two generations of 15-kW motors were completed during 2001. These motors were used to refine the motor construction techniques and work on assembly and design methods for improving motor efficiency. During this development substantial improvements were made in magnet retention and stator construction techniques. A vacuum potting method was developed that has improved dimensional control of the stator critical to constructing a tight-tolerance, but inexpensive, high performance machine (Figure 2). The epoxy formulation used in this procedure is a newly developed material for this specific application with improved mechanical and thermal characteristics. Use of this formulation allows epoxy potted stator designs that can reliably operate in excess of 150ºC.
Research in the area of magnet retention has lead to a design that allows arcuates to be attached to the rotor using conventional welding techniques while achieving a hermetic seal from the environment. This technique offers good mechanical integrity and promises extended useful magnet life by reducing the oxidation rate of magnet material.
Process development research pursued during 2001 has offered a substantial improvement in the manufacturability of SEMA motors as well as significant contacts with the domestic and global supplier base. Relationships with wire, epoxy, and magnet manufacturers have
been established that are anticipated to feed into the viability of this technology
Proof of Concept Motors
Both 30-kW and 15-kW proof of concept motors were constructed during 2001. There were two generations of motor developed for each power rating. The first generation design of 30-kW motors developed this year was a completely new design aimed at improving the robustness and manufacturability of the initial generation of 30-kW motors built in 2000 (Figure 3). This motor received substantial testing, and was used to perform a system efficiency analysis to determine the contribution of various loss mechanisms to overall machine losses. An improved version of this motor will be delivered for independent testing in early 2002.
The first generation of 15-kW proof of concept motors was designed in 2000 with the first unit completed and tested in early 2001. This motor was designed with multiple coil sets that could be reconfigured in series or parallel external to the machine. A second generation of this motor was built using a nearly identical design with the addition of iron powder to the stator epoxy. This motor was intended as a tool to check model accuracy and to verify the impact of controlled incremental addition of iron to the stator to reduce magnet material and to control inductance. Testing of this motor is currently underway.

31
Performance and Durability Test Cells
The motor performance test cell became operational in Q1 2001 (Figure 4). This test cell has been used to test a number of motors constructed this year including the Final 30-kW Proof of Concept motor. To date this cell has been used to perform loss analysis, performance mapping, elevated temperature operation, and resistive loaded generator testing on AEMD machines. This cell contains a LEM power analyzer, recirculating chiller/heater, 90-kW power supply, and resistive load bank for motor and generator testing.
In addition to the performance test cell, a durability test cell is currently under development and is anticipated to be operational in Q1 2002. This cell will be rated at 115-kW continuous duty. At this time, this cell is configured to perform long-term continuous duty testing using a resistive load bank with the motor in a regenerating mode.
Figure 3: 30-kW Intermediate Proof of Concept Motor
Figure 4: Performance Test Cell
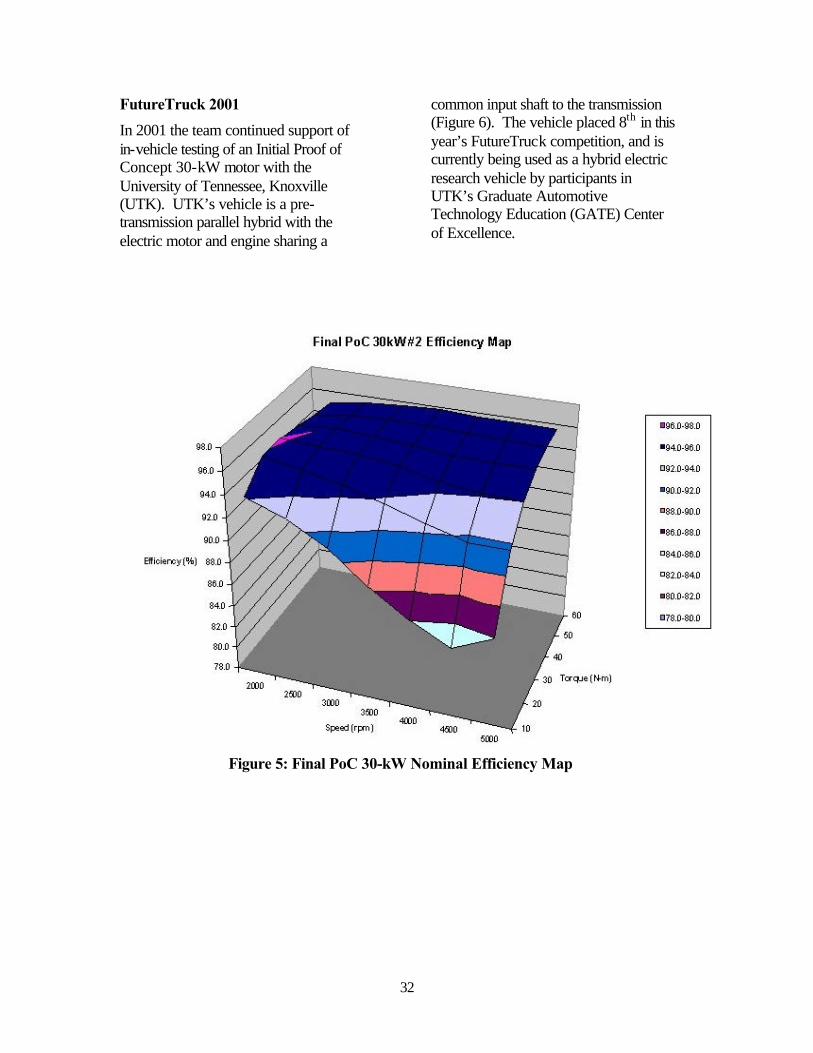
32
FutureTruck 2001
In 2001 the team continued support of in-vehicle testing of an Initial Proof of Concept 30-kW motor with the University of Tennessee, Knoxville (UTK). UTK’s vehicle is a pre-transmission parallel hybrid with the electric motor and engine sharing a
common input shaft to the transmission (Figure 6). The vehicle placed 8th in this year’s FutureTruck competition, and is currently being used as a hybrid electric research vehicle by participants in UTK’s Graduate Automotive Technology Education (GATE) Center of Excellence.
Figure 5: Final PoC 30-kW Nominal Efficiency Map
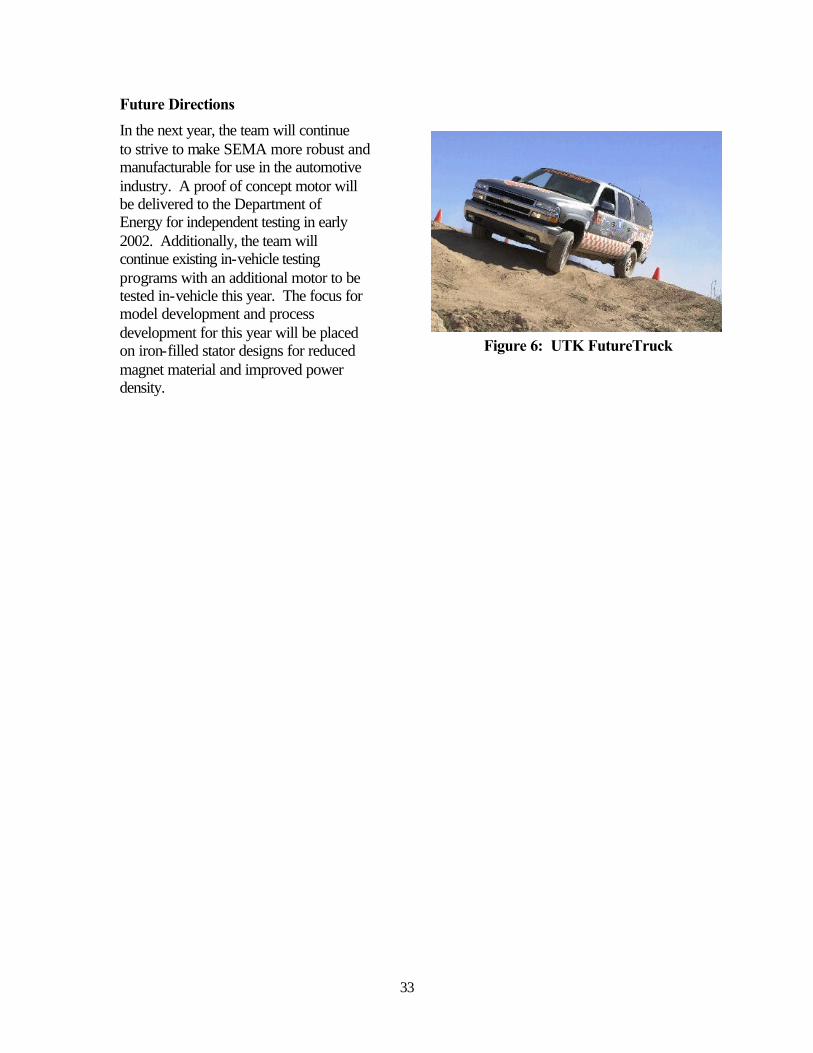
33
Future Directions
In the next year, the team will continue to strive to make SEMA more robust and manufacturable for use in the automotive industry. A proof of concept motor will be delivered to the Department of Energy for independent testing in early 2002. Additionally, the team will continue existing in-vehicle testing programs with an additional motor to be tested in-vehicle this year. The focus for model development and process development for this year will be placed on iron-filled stator designs for reduced magnet material and improved power density.
Figure 6: UTK FutureTruck
34
The Development of the Automotive Electric Motor Drive (AEMD) Larry Kline Program Manager Electric Machines Program Delphi Automotive Systems 2705 S. Goyer Rd P.O. Box 9005 Kokomo, IN 46904-9005 Phone: (765)-451-3721 / 8-322-3721 Fax: (765)-451-3780 / 8-322-3780 Internet E-Mail: [email protected] DOE Program Manager: David Hamilton (202) 586-2314; fax: (202) 505-844-9781; e-mail: [email protected]
Introduction: Electric Machines Program
On behalf of the partnership of Electricore, Inc., Delphi Automotive Systems, and the United States Department of Energy (DOE) I am pleased to submit the Fiscal Year (FY) 2001 Annual Progress Report for Delphi Automotive Systems. This progress report will point out the work performed during FY 2001 and how Delphi is working toward successfully meeting the challenges facing the DOE Automotive Electric Motor Drive (AEMD) program to develop low- cost, long-life, electric motor drive technologies for automotive applications. Delphi Automotive, a tier one supplier to the automotive original equipment manufacturers (OEMs), has the experience, ability and the interest to support the aggressive technical performance specifications of the Partnership for a New Generation of Vehicles (PNGV)and subsequent programs sponsored by the DOE. Delphi is leveraging experience gained previously on DOE-funded hybrid vehicle programs with General Motors and DaimlerChrysler, for successful execution of the current AEMD program. Delphi’s challenge is to develop the technology and demonstrate commercial viability for high volume production to support the integration of parallel and series advanced electric motor drives into PNGV concept vehicle demonstrations. The goal of Delphi Automotive Systems is to develop manufacturing technologies that will reduce the cost of an AEMD by 40 to 60 percent when compared to the present cost of comparable industrial AC motors. Successful development of new manufacturing technologies will significantly improve the manufacturing process for electric motor drives, which can be used in all electric and hybrid vehicles. Since the economy is global and economic competitiveness among nations is increasing, advances in manufacturing processes will help strengthen U.S. competitiveness in manufacturing. In addition, these motor drives can be used in zero- and low- pollution vehicles, thereby improving our environment. If the new generation of vehicles with improved fuel economy and low emissions is to be widely accepted, the vehicles have to be economical and simple to manufacture. Addressing Technical Challenges Current processing and fabrication technologies used to manufacture today’s electric machines are too expensive for automotive applications. Packaging higher power electric machines into existing vehicle architectures for hybrid-type applications usually means packaging around existing hardware without affecting the rest of the vehicle such as powertrain length, diameter et al. For some applications, positioning the electric machine between the engine and the transmission is a space conserving method. This method can approximately double the diameter of the machine and creates a large diameter hole in the middle to clear existing powertrain components. What was once a nearly solid 180-mm circular lamination set for the stator and rotor with an OD to ID ratio of 5:1, is now approximately 360 mm in
35
diameter with an OD to ID ratio of 1:3 to1. This condition pushes conventional stamping methods outside the range of traditional lamination stamping presses and dies. The recycled portion of the stampings is now in the 70+ percent range, which negatively affects the cost viability of the machine. The close ratio also reduces the strength of the lamination core, which must be addressed for inserting the copper windings and related operations. The rotor in hybrid electric motors is typically assembled from two separate components: a rotor cage and a hub. In some hybrid applications, the torque converter is packaged inside the hub of the rotor, which is attached to the crankshaft of the engine. The rotor hub’s dimensions, limited by packaging constraints, are designed in a way that makes it difficult to manufacture the component. In particular, a variable wall thickness and the overall design of the rotor present challenges to manufacturing rotors in high volumes. The phase leads in today’s electric motor/automotive generators typically contain two wires per phase. The phase leads are passed in front of a burner to thermally destroy the insulation on copper magnet wire and then wire-brushed in two passes to remove the insulation. On larger hybrid electric machines, there can be in excess of 72 copper wires to strip. Although wire stripping can be accomplished manually, cost is negatively affected and quality is of concern. Conventional automotive generators use relatively simple winding patterns where the winding equipment is geared to volumes in excess of 500,000 units per year, and not much consideration is given to the generator efficiency. Hybrid electric machines require high motor drive efficiencies where the winding pattern is typically designed to a specific set of parameters based on the system in which the motor drive will operate without consideration to the manufacturing process. Machines can be designed and built to automatically insert the windings, but changing winding patterns has a negative effect on throughput due to certain equipment limitations such as wire gauge, number of coils per slot, and slot opening size. Due to the larger stator size, increased number of slots, and customized winding pattern, some industry-wide “rules of thumb” for wire insertion are not valid for these hybrid electric stators. Objectives • Develop manufacturing technologies that result in significant overall cost savings for 53-kW and 30-kW motor
drives to meet the Partnership for a New Generation of Vehicles (PNGV) goals.
• Focus on perfecting the manufacturing processes and assuring process repeatability. • Understand product issues associated with manufacturing processes. Approach • Investigate Induction, Switch Reluctance, and PM machine technologies to achieve high performance, better
efficiency, lower material cost, and lower manufacturing cost. • Examine every component of the drive motor to determine where reductions in terms of weight, cost, and time for
fabrication could be achieved.
• Use a coordinated product and process design approach to apply and evaluate innovative process solutions to electric machines, with minimal impact on machine and overall system performance.
• Propose the best technology based on performance, efficiency, manufacturability, and component- and system-
related costs.
• Validate the technologies by designing, building, and testing 10 kW to 15 kW drive machines, which would be scalable for 53 kW and 30 kW motor drives.

36
FY 2001 Accomplishments For the AEMD deliverable machine technology selection, numerous machine configurations were considered, analyzed, and documented in the AEMD Machine Technology Selection Final Report, which was completed in 2001. Machine topologies included variants of induction, sine wave permanent magnet, and switched reluctance machines. For the induction machine design, the conventional machine technology was modified to accommodate materials and a design methodology to achieve low-cost manufacturing processes. The low-cost manufacturing methods included a powdered iron rotor with a segmented stator. Development of the permanent magnet machine focused on a machine with a constant power speed over a wide range. The rationale and physics for achieving this goal were presented and the trade-offs were discussed extensively. Numerous stator slot and rotor pole combinations were analyzed in order to select and optimize the most appropriate combination. For the switched reluctance machine technology, various full-pitched configurations and inverter configurations were also explored and discussed in detail. These included machines based on a unipolar, 120-degree conduction configuration and switched reluctance machines utilizing a conventional inverter topology of both 120-degree and 180-degree conduction. In summary, the induction machine technology
was deemed most appropriate in meeting the performance, packaging, and cost objectives of the AEMD parallel hybrid specification, and is being pursued as the final deliverable machine technology. The machine will also incorporate several low-cost manufacturing techniques determined not to have a significant impact on machine performance. Significant additional information on the design and performance of the various technologies tested for permanent magnet and switched reluctance machines was gathered and documented in the delivered report. These findings are discussed in the following “bulle ted” paragraphs: • Cost Reduction to Date: The chart below
represents three different machine technologies that were studied for the AEMD parallel hybrid deliverable (designated Induction, S.R., and P.M.). Each technology is depicted as a pair of columns, with the left column representing the sales price if standard processes followed in the industrial machine industry were used. The right column represents a low-cost machine price using processes and product technology developed under the AEMD project.
• Iron Core Manufacturing Selection: Numerous iron core manufacturing methods were considered and studied for the AEMD-developed machine (see the chart below). These included traditional progressively stamped laminations, slinky wound, powder
M a c h i n e S a l e s P r i c e
$ 3 1 2 . 5 4
$ 2 1 8 . 8 9
$ 5 4 3 . 0 3
$ 2 5 7 . 3 9
$ 5 9 8 . 6 0
$ 3 4 4 . 5 6
$0
$100
$200
$300
$400
$500
$600
$700
Induct ion Induct ionL o w C o s t
S . R . S . R .L o w C o s t
P . M . P . M .L o w C o s t
M a c h i n e T y p e
Do
llar
Val
ue
P N G V T a r g e t P r i c e $ 3 0 0
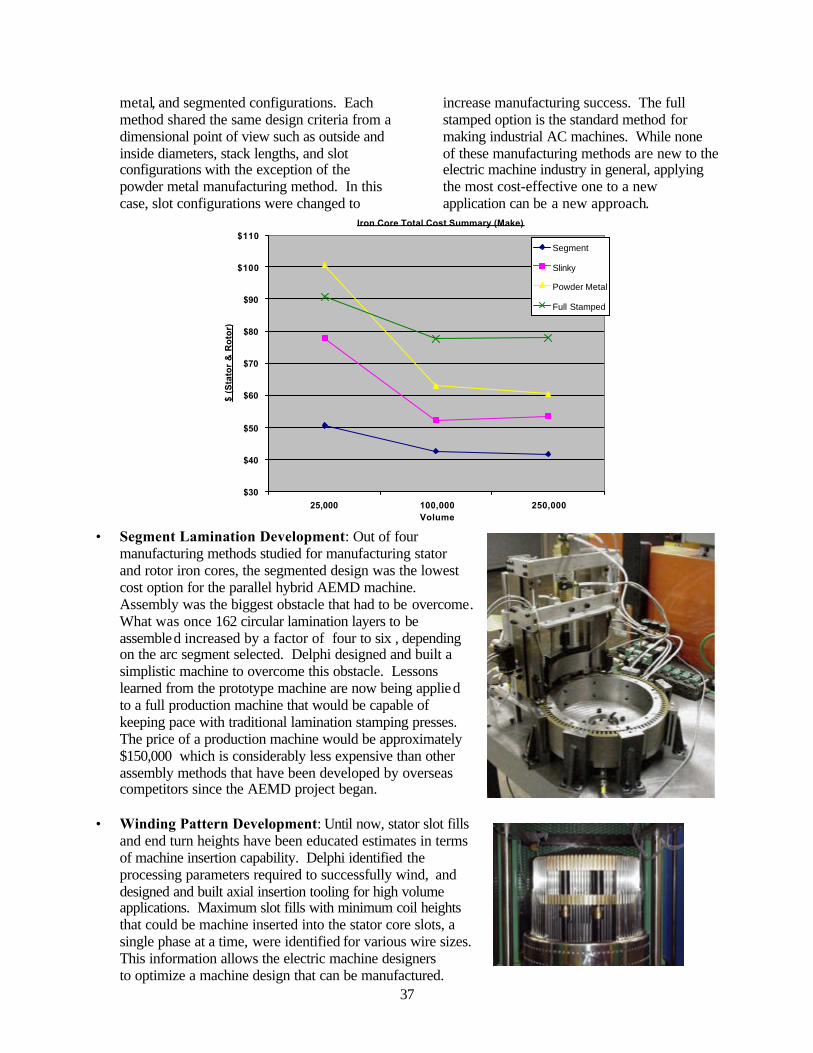
37
metal, and segmented configurations. Each method shared the same design criteria from a dimensional point of view such as outside and inside diameters, stack lengths, and slot configurations with the exception of the powder metal manufacturing method. In this case, slot configurations were changed to
increase manufacturing success. The full stamped option is the standard method for making industrial AC machines. While none of these manufacturing methods are new to the electric machine industry in general, applying the most cost-effective one to a new application can be a new approach.
Iron Core Total Cost Summary (Make)
$30
$40
$50
$60
$70
$80
$90
$100
$110
25,000 100,000 250,000Volume
$ (S
tato
r &
Ro
tor)
Segment
Slinky
Powder Metal
Full Stamped
• Segment Lamination Development: Out of four
manufacturing methods studied for manufacturing stator and rotor iron cores, the segmented design was the lowest cost option for the parallel hybrid AEMD machine. Assembly was the biggest obstacle that had to be overcome. What was once 162 circular lamination layers to be assembled increased by a factor of four to six , depending on the arc segment selected. Delphi designed and built a simplistic machine to overcome this obstacle. Lessons learned from the prototype machine are now being applied to a full production machine that would be capable of keeping pace with traditional lamination stamping presses. The price of a production machine would be approximately $150,000 which is considerably less expensive than other assembly methods that have been developed by overseas competitors since the AEMD project began.
• Winding Pattern Development: Until now, stator slot fills
and end turn heights have been educated estimates in terms of machine insertion capability. Delphi identified the processing parameters required to successfully wind, and designed and built axial insertion tooling for high volume applications. Maximum slot fills with minimum coil heights that could be machine inserted into the stator core slots, a single phase at a time, were identified for various wire sizes. This information allows the electric machine designers
to optimize a machine design that can be manufactured.
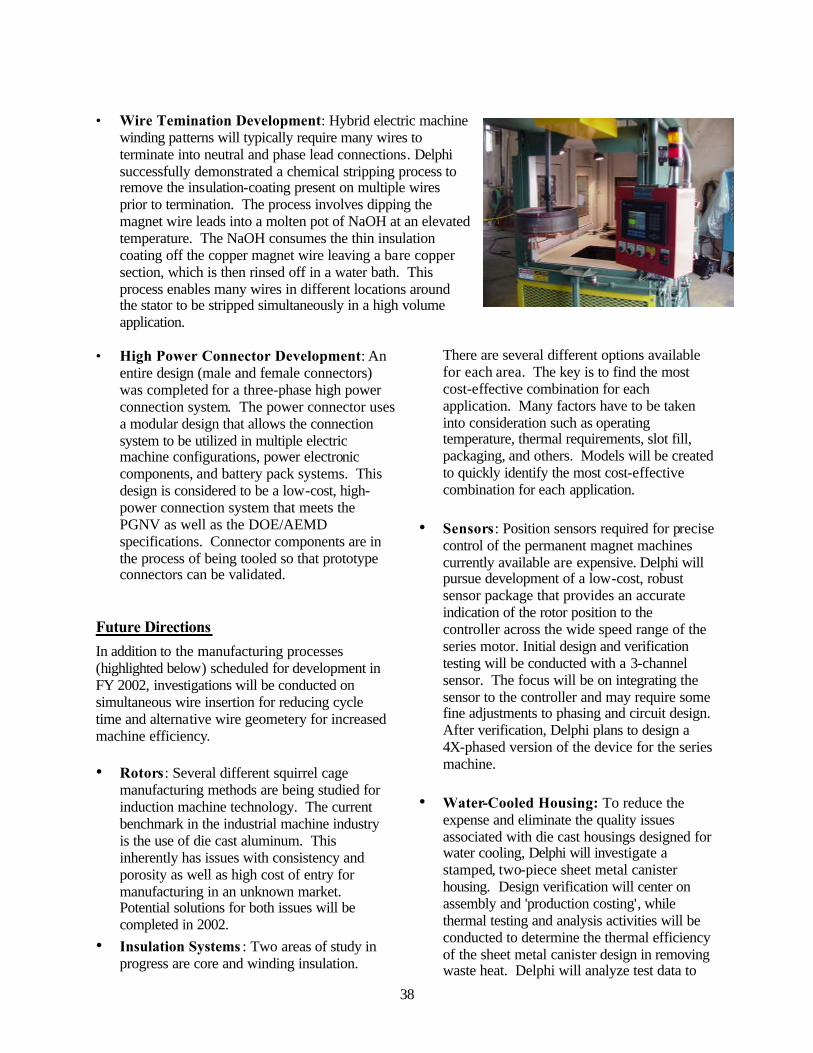
38
• Wire Temination Development: Hybrid electric machine
winding patterns will typically require many wires to terminate into neutral and phase lead connections. Delphi successfully demonstrated a chemical stripping process to remove the insulation-coating present on multiple wires prior to termination. The process involves dipping the magnet wire leads into a molten pot of NaOH at an elevated temperature. The NaOH consumes the thin insulation coating off the copper magnet wire leaving a bare copper section, which is then rinsed off in a water bath. This process enables many wires in different locations around the stator to be stripped simultaneously in a high volume application.
• High Power Connector Development: An entire design (male and female connectors) was completed for a three-phase high power connection system. The power connector uses a modular design that allows the connection system to be utilized in multiple electric machine configurations, power electronic components, and battery pack systems. This design is considered to be a low-cost, high-power connection system that meets the PGNV as well as the DOE/AEMD specifications. Connector components are in the process of being tooled so that prototype connectors can be validated.
Future Directions
In addition to the manufacturing processes (highlighted below) scheduled for development in FY 2002, investigations will be conducted on simultaneous wire insertion for reducing cycle time and alternative wire geometery for increased machine efficiency.
• Rotors: Several different squirrel cage manufacturing methods are being studied for induction machine technology. The current benchmark in the industrial machine industry is the use of die cast aluminum. This inherently has issues with consistency and porosity as well as high cost of entry for manufacturing in an unknown market. Potential solutions for both issues will be completed in 2002.
• Insulation Systems : Two areas of study in progress are core and winding insulation.
There are several different options available for each area. The key is to find the most cost-effective combination for each application. Many factors have to be taken into consideration such as operating temperature, thermal requirements, slot fill, packaging, and others. Models will be created to quickly identify the most cost-effective combination for each application.
• Sensors: Position sensors required for precise control of the permanent magnet machines currently available are expensive. Delphi will pursue development of a low-cost, robust sensor package that provides an accurate indication of the rotor position to the controller across the wide speed range of the series motor. Initial design and verification testing will be conducted with a 3-channel sensor. The focus will be on integrating the sensor to the controller and may require some fine adjustments to phasing and circuit design. After verification, Delphi plans to design a 4X-phased version of the device for the series machine.
• Water-Cooled Housing: To reduce the
expense and eliminate the quality issues associated with die cast housings designed for water cooling, Delphi will investigate a stamped, two-piece sheet metal canister housing. Design verification will center on assembly and 'production costing', while thermal testing and analysis activities will be conducted to determine the thermal efficiency of the sheet metal canister design in removing waste heat. Delphi will analyze test data to

39
determine design-for-manufacturing modifications, which could lower costs. The two piece canister housing design will be incorporated in the final DOE parallel drive motor due in September 2002.
Delphi plans to continue identifying, developing, and validating low-cost manufacturing processes for the parallel hybrid motor with the goal of meeting the PNGV specifications. Where
applicable, these manufacturing methods will also be utilized in the design of the series hybrid motor. Completion of the design trade study and manufacturing process selection is planned for early 2002 with bench test hardware following later in the year. Fabrication and testing of the deliverable series hybrid motor, with the goal of achieving the PNGV specifications, will be completed in 2003.

40
Automotive Electric Motor Drive (AEMD) Validation Testing and Contract Support
Samuel C. Nelson, Jr. Oak Ridge National Laboratory National Transportation Research Center 2360 Cherahala Boulevard Knoxville, Tennessee 37932 Voice: (865) 946-1327; Fax: (865) 946-1262; E-mail: [email protected] DOE Program Manager: David Hamilton Voice: (202) 586-2314; Fax: (202) 586-1600; E-mail: [email protected] ORNL Technical Advisor: Donald J. Adams Voice: (865) 946-1321; Fax: (865) 946-1262; E-mail: [email protected] Objectives
• Provide technical support to the Automotive Electric Motor Drive (AEMD) contracts manager. • Plan and organize the testing phases of the AEMD program. • Produce a plan to test, identify, and purchase the equipment and instruments required to meet the
needs of the test plan. • Develop software for controlling the AEMD load profiles for various tests. • Procure and assemble the test stand and perform preliminary tests.
Approach
• The conformance to established standards will be assessed and the results will be utilized to determine the suitability of the AEMD technology for automotive applications.
Accomplishments
• Referenced test standards and pertinent documents have been acquired. • Environmental test procedures have been completed. • The functional test and electrical characterization tests have been completed. • Test agreement and test matrix has been completed. • Dynamometer system has been installed in the Oak Ridge National Laboratory (ORNL) test cell and
some preliminary tests have been performed.
Future Direction The AEMD must be designed and manufactured to overcome cost, volume, weight, and thermal and reliability barriers in order to meet technical targets. This project will verify the suppliers/developers success in accomplishing these ends.
41
Introduction The AEMD sub-task supports the Department of Energy’s (DOE’s) Program effort to research, develop, and demonstrate a traction motor for use in advanced hybrid electric vehicles (HEVs) that meets the goals and schedule of the Partnership for a New Generation of Vehicles (PNGV). The overall objective is to sponsor a commercially viable electric motor technology that contributes to the goal of having a passenger vehicle with three times the fuel economy of present vehicles. To achieve this goal, the traction motor must meet the following requirements: reduction in size, weight, and manufacturing cost, and improvements in efficiency and reliability. ORNL’s role for the AEMD project is to provide technical support to DOE, plan and organize the testing phases of the AEMD program, and validate the technology’s conformance with the AEMD specification requirements. ORNL has produced a plan for testing of the AEMD pre-production prototypes according to the specifications and standard test procedures called out in the solicitation. ORNL has specified the equipment and instrumentation required to meet the needs of the test plan. The most cost effective methods of testing the AEMDs will be considered in the decision to purchase test equipment, leverage use of equipment from related work, or utilize facilities elsewhere. A large portion of the testing facilities and procedures will be leveraged from the Automotive Integrated Power Module (AIPM) project. This sub-task will include software development for controlling the AEMD load profiles for various tests. ORNL will perform the required configuring, assembling, etc., for testing fixtures to support the developed test method(s). The sub-task will include some preliminary testing of the systems in preparation of the actual AEMD testing and any necessary refinement of the test procedures. It is anticipated that the AEMD contract motors will become available at ORNL in the first quarter of FY 2002. ORNL activities for FY 2000 were to develop the required testing methods, specify and
procure instrumentation and equipment to perform the testing, and provide technical support to the contract manager. In addition, questions concerning the AEMD specification and solicitation involving current and power levels, as well as specific environmental tests, are being resolved. Recommended changes to the AEMD specifications have been submitted to the program participants for review, and some comments have been received. ORNL activities for FY 2001 were to refine test methods to specific AEMD test articles, specify and procure additional instrumentation and equipment, assemble the equipment and/or instrumentation in the configurations needed for the various tests, and provide support to the contracts manager. An AEMD test agreement was developed which will serve as an understanding between the AEMD developers/suppliers, ORNL, and DOE as to the actions that will be performed as part of the AEMD testing at ORNL. The AEMD test agreement contains a test matrix that identifies the tests that will be performed at the various stages of the AEMD project (i.e., pre-production and production). The dynamometer system has been installed in the ORNL test cell, startup and checkout tests have been completed, and some preliminary tests have been performed. During FY 2002, testing of the pre-production AEMD units will begin at ORNL.
42
High Dielectric Constant Capacitor Technologies for Power Electronic Systems D.Y. Kaufman, S.K. Streiffer, M.T. Lanagan,† O. Auciello, and U. Balachandran Energy Technology and Materials Science Divisions Argonne National Laboratory 9700 S. Cass Ave. 60439 (630)252-4250 e-mail: [email protected] †Center for Dielectric Studies, Pennsylvania State University DOE Program Manager: David Hamilton (202) 586-2314; fax: (202) 505-844-9781; e-mail: [email protected]
Objectives
• Develop advanced capacitor technologies to reduce the size, weight, and cost of power electronic modules Approach
• Develop high-energy-density, microelectronic-scale, ferroelectric, barium-strontium-titanate (BST) thin-film (<1 µm) capacitors for use as discrete and integrated capacitors
• Develop test protocols to quantify the reliability of antiferroelectric/ferroelectric (AFE/FE) phase switch capacitors for power inverter applications
• Develop base-metal electrode technologies to reduce capacitor cost
• Collaborate with capacitor manufacturers and universities to test capacitors under high-power conditions; supply prototype capacitors to high-power inverter manufacturers for reliability and performance studies
• Develop a technology roadmap to advise PNGV EE Tech team on near- and long-term capacitor options
Accomplishments
• Developed routine to fabricate BST thin films by metalorganic chemical vapor deposition (MOCVD) with dielectric constant of 600 and dielectric loss of 0.005
• Tailored BST thin-film dielectric composition to improve the temperature-dependent dielectric properties
• Fabricated thin-film BST capacitors on Ni foils with dielectric constants of 250, dielectric loss as low as 0.008, and better than X7R capacitor specifications
• Fabricated AFE/FE-based capacitors and distributed capacitors for testing at power inverter and capacitor manufacturers and at Virginia Tech Center for Power Electronic Systems
• Constructed an inverter with an inductive load to examine distributed capacitor architectures
• Reported on market and technology drivers and cost analysis for multilayer ceramic capacitors

43
Future Direction
• Elucidate the role of composition and dimensional effects on the temperature and voltage response of ferroelectric thin films to optimize capacitor performance
• Develop optimum processing strategies for robust base-metal-electrode BST thin films and determine the impact of interfacial layers on capacitor performance
• Quantify the reliability of thin film and bulk AFE/FE ceramics capacitors and design novel capacitor structures to achieve graceful failure modes
• Test capacitors in an inverter bus structure to determine the optimum array arrangement
Assemble a technology and cost driver analysis of capacitor technologies and advise the PNGV EE Tech Team on near-term and long-term capacitor options
Thin Film Ferroelectric Capacitors Power electronic modules with high volumetric efficiency require reduction of the capacitor weight and volume. With vapor deposition of thin-film, high-dielectric-constant ferroelectric BST dielectrics, capacitors can be miniaturized to microelectronic scale dimensions. Besides exhibiting higher breakdown strengths, thin-film dielectrics exhibit greater temperature stability than conventional bulk ceramic capacitors. We have fabricated BST thin-film capacitors by metalorganic chemical vapor deposition (MOCVD), a technique extensively used in the microelectronics industry. The deposition system incorporates a commercial liquid precursor delivery system (ATMI LDS-300B) with an ANL-designed, large-area vertical MOCVD reactor. The combination of both these sub-systems contributes to a high degree of compositional control and process reproducibility. Good film uniformity was obtained over a 4" diameter area, as observed by a uniform thickness fringe color. Growth rates as high as 60Å/min have been achieved. Scaling and Compositional Effects In order to obtain high-voltage capacitors, thickness scaling effects
were investigated. Process compositional control was obtained through the thickest films examined (700 nm), and the dielectric properties are consistent with an interfacial dead layer model (Figure 1). Dielectric constants as high as 600 with dielectric losses as low as 0.005 have been measured in 224 nm thick films. BST films are expected to exhibit more bulk-like behavior as the film thickness is increased. While this results in a greater dielectric constant, it also increases the degree of temperature variation of the dielectric properties. Since the temperature response is a function of Ba:Sr ratio, the LDS parameters were controlled to deposit 70
Figure 1. Dielectric properties of MOCVD BST thin film
capacitors as a function of BST thickness
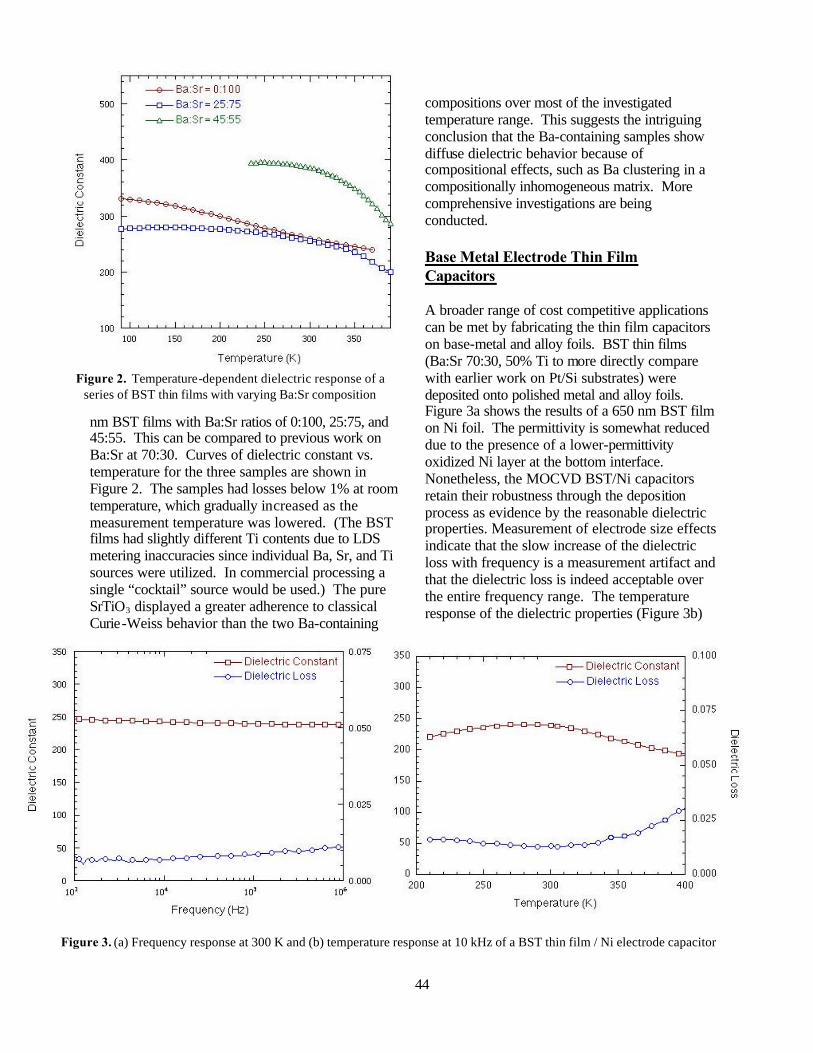
44
nm BST films with Ba:Sr ratios of 0:100, 25:75, and 45:55. This can be compared to previous work on Ba:Sr at 70:30. Curves of dielectric constant vs. temperature for the three samples are shown in Figure 2. The samples had losses below 1% at room temperature, which gradually increased as the measurement temperature was lowered. (The BST films had slightly different Ti contents due to LDS metering inaccuracies since individual Ba, Sr, and Ti sources were utilized. In commercial processing a single “cocktail” source would be used.) The pure SrTiO3 displayed a greater adherence to classical Curie-Weiss behavior than the two Ba-containing
compositions over most of the investigated temperature range. This suggests the intriguing conclusion that the Ba-containing samples show diffuse dielectric behavior because of compositional effects, such as Ba clustering in a compositionally inhomogeneous matrix. More comprehensive investigations are being conducted. Base Metal Electrode Thin Film Capacitors A broader range of cost competitive applications can be met by fabricating the thin film capacitors on base-metal and alloy foils. BST thin films (Ba:Sr 70:30, 50% Ti to more directly compare with earlier work on Pt/Si substrates) were deposited onto polished metal and alloy foils. Figure 3a shows the results of a 650 nm BST film on Ni foil. The permittivity is somewhat reduced due to the presence of a lower-permittivity oxidized Ni layer at the bottom interface. Nonetheless, the MOCVD BST/Ni capacitors retain their robustness through the deposition process as evidence by the reasonable dielectric properties. Measurement of electrode size effects indicate that the slow increase of the dielectric loss with frequency is a measurement artifact and that the dielectric loss is indeed acceptable over the entire frequency range. The temperature response of the dielectric properties (Figure 3b)
Figure 2. Temperature-dependent dielectric response of a
series of BST thin films with varying Ba:Sr composition
Figure 3. (a) Frequency response at 300 K and (b) temperature response at 10 kHz of a BST thin film / Ni electrode capacitor

45
were better than those specified for X7R capacitors. The hard breakdown field of 650 nm BST films on Ni foil was on the order of 0.7 MV/cm. Scaling effects were evident, as a 130 nm BST/Ni capacitor exhibited a permittivity of 80 and a hard breakdown field of 1.25 MV/cm. BST films deposited onto Inconel and Hastelloy foils showed unacceptably high losses, accompanied by a very strong frequency dispersion in the dielectric constant. Scaling effects and the chemical, structural, and electrical character of the BST/metal interface are being explored in greater detail. Additional work on copper and tungsten electrodes has been initiated as well. Antiferroelectric/Ferroelectric (AFE/FE) Capacitors Commercial bulk multilayer ceramic capacitors (MLCCs) have a high dielectric constant at zero-field over a wide temperature range, but the dielectric constant drops as the electric field is increased. Antiferroelectrics, on the other hand, show an increase in dielectric constant with field due to switching from the antiferroelectric (AFE) to ferroelectric (FE) phase at electric fields greater than the coercive or switching field (Es). We have collaborated with Prof. J. D. Van Wyk (Center for Power Electronic Systems, Virginia Tech.) to explore AFE/FE multilayer ceramic capacitors under high-voltage high-frequency conditions. As can be seen in Figure 4, the AFE/FE capacitor switch response is maintained at inverter frequency. Higher capacitance parts have been sent to AVX Corp. for testing in fixtures with higher power capability. In another effort, an inverter with an inductive load has
been constructed to examine distributed capacitor architectures (Figure 5). A cost analysis has been carried out to determine the interrelationships among fabrication processes, materials, capital investment, and market size on ceramic capacitor cost. The present costs for high-voltage, high-capacitance capacitors exceed PNGV goals; however, new capacitor technology coupled with market expansion should reduce capacitor cost. Cost projections were based on large markets and assumed fabrication process and materials costs. The capacitor industry has invested in equipment to cast
defect-free dielectric layers in specialized stacking machines for over 600 dielectric/metal layers and in specialized furnaces for heat treating MLCCs with Ni electrodes. The market
Figure 4. AFE/FE capacitor switch response – Response
during discharge interval is similar.
Figure 5. (a) Schematic diagram and (b) actual layout of an inverter with an inductive load testbed used to
examine distributed capacitor architectures
46
size, with billions of capacitors manufactured per month by a single plant, warrants this type of capital investment. It is anticipated that smaller companies will also adopt this new base-metal electrode MLCC technology, which will reduce capacitor cost for high-capacitance and high-voltage parts. Selected Publications and Presentations M. Lanagan, D. Kaufman, and B. Tuttle, "Capacitor Cost Analysis Report: Market Trends, Materials, and Processes,” Department of Energy Report, March 2001. D.Y. Kaufman, J. Im, P.K. Baumann, S.K. Streiffer, O. Auciello, and R.A. Erck, “Processing Strategies for (Ba,Sr)TiO3 Thin Film Capacitors by Metalorganic Chemical Vapor Deposition and Magnetron Sputtering,” Electronics Division Meeting of the American Ceramic Society, Clemson, SC, October 2001 D.Y. Kaufman, S.K. Streiffer, J. Im, O. Auciello , “(Ba,Sr)TiO3 Thin-Film Capacitors on Metal Foils,” International Symposium on Integrated Ferroelectrics (ISIF), Colorado Springs, CO, March 2001. R.M. Anklekar, M.T. Lanagan, T.R. Shrout, L. Eric Cross, and M-J. Pan, "Electric Field-Forced Antiferroelectric -to-Ferroelectric Phase Switching Materials for High-Energy Density Capacitors," Capacitor and Resistor Technology Conference, St. Petersburg, FL, March 2000. R.M. Anklekar, M.T. Lanagan, and M-J. Pan, "Trends and Developments in Capacitor Technologies for Power Electronics Applications," Passive Component Industry, 3(4):16-27 (July-August 2001).
47
dc Bus Capacitors for PNGV Power Electronics B. A. Tuttle, D. Wheeler, G. Jamison, J. S. Wheeler, and D. Dimos Sandia National Laboratories, P.O. Box 5800, MS1411, Albuquerque, NM 87185-1405 (505) 845-8026; fax: (505) 844-2974; e-mail: [email protected] DOE Program Managers: Patrick Davis (202) 586-8061; fax: (202) 586-9811; e-mail: [email protected] David Hamilton (202) 586-2314; fax: (202) 505-844-9781; e-mail: [email protected]
Contractor: Oak Ridge National Laboratory, Oak Ridge, Tennessee Prime Contract No.: DE-AC05-00OR22725
Objectives
• Develop a replacement technology for current aluminum electrolytic dc bus capacitors for 2004 new-generation vehicles
• Develop a high-temperature polymer dielectric film technology that has dielectric properties technically superior to those of aluminum electrolytic dc bus capacitors and is of comparable or smaller size
• Scale up cost-competitive polymer film dielectric technology to develop a continuous process for dielectric sheet fabrication and fabricate prototype capacitors
Approach
• Contact automobile design and component engineers, dielectric powder and polymer film suppliers, and capacitor manufacturers to determine state-of-the-art capabilities and to define market-enabling technical goals
• Develop a project plan with automobile manufacturers and large and small capacitor companies to fabricate polymer dielectric sheets suitable for the manufacture of PNGV capacitors
• Synthesize unique conjugated polyaromatic chemical solution precursors that result in dielectric films with low dissipation factors (DFs) and excellent high-temperature dielectric properties
• Develop polymer film processes and technologies that will lower costs to permit competitive high-volume capacitor manufacturing
• Interact with Oak Ridge National Laboratory (ORNL) with regard to mechanical characterization of films
Accomplishments
• Invented chemical synthesis procedures that resulted in polymer films with five times the energy density of commercial polyphenylene sulfide at 110oC – These films exhibited properties ranging from dielectric constants of K = 6 and DF = 0.009 to K = 4 and DF = 0.002. These hydroxylated polyphenelene films (PP+OH) met technical requirements for commercialization.
• Developed and evaluated four different process steps for PP+OH films to lower cost – Three of the new processes were successful.
• Developed a new hydroxylated polystyrene (PVP) chemistry that would be cost-competitive in commercial markets and meets technical specifications for commercialization

48
• Collaborated with TPL, Inc., to fabricate free-standing dielectric sheets that have breakdown strengths of greater than 4 MV/cm from -40o to 110oC
• Collaborated with ORNL to characterize mechanical properties of PVP films
Future Directions
• Perform extensive electric field and temperature characterization to determine that the Sandia National Laboratories (SNL) polyfilm dielectrics will meet the PNGV requirements for breakdown field and DF for temperatures from -40o to 110oC
• Interface with an appropriate scale-up company to fabricate large rolls of slit dielectric polymer sheet (10-kg lots) suitable for fabrication of multilayer capacitors (2 to 200 µF) – TPL, Electronic Concepts, and AVX/TPC are potential collaborators.
• Have General Motors (GM) and SNL evaluate large-value (20µF to 200 µF) capacitors, fabricated by vendor(s), in simulated electric hybrid vehicle environments
• Develop more cost-effective synthesis routes for lower-DF polymer film dielectrics that meet 2004 PNGV requirements
Results
Strategy and Interactions SNL has actively worked with a number of
representatives from the automobile industry to obtain their perspectives on what is needed for 2004 automobiles. In FY 2001, SNL has continued its emphasis on the development of polymer film dielectrics for two reasons. First, GM has been in favor of soft-breakdown dielectric film technology, a characteristic that bulk ceramic capacitors do not exhibit. Second, emphasis on polymer dielectrics provides a greater balance of the DOE effort between polyfilm and ceramic technologies, as requested by the Electrical/ Electronics Tech Team.
These interactions led us to conclude that the most viable replacement technology for the electrolytic dc bus capacitors by 2004 is multilayer polymer film capacitors. Reducing the size of the polymer capacitors was the breakthrough most often cited by automobile design engineers and capacitor manufacturers as needed. In addition, it is necessary to improve high-temperature (110oC) performance while keeping the technology cost competitive. For polymer film dielectrics, a goal for commercializa-tion of a dielectric constant of 6 and a DF of less than 0.01 was initially agreed to by AVX/TPC and GM. However, based on the GM 2004 criteria for capacitance density of 2.0 µF/cm3, the team agreed that, if a polyfilm of K = 4.5 could be developed that could meet the temperature requirements, that film would be suitable for scale -up activities.
The initial scale-up strategy consisted of the following steps: (1) develop a polymer film technology that meets requirements, (2) synthesize 10-kg to 20-kg batches, (3) develop a continuous process for 3-µm-thick polymer films, and (4) fabricate prototype capacitors from it. This approach had to be modified for two reasons: (1) the cost of dielectric film technology became a high priority in FY 2001 and (2) the synthesis and development of a continuous process had to be broken down into multiple steps to be accomplished. Although an initial polymer film technology (PP+OH) was developed that met all criteria and was exceedingly low-loss, its cost was prohibitive. SNL was successful in developing three new processes that reduced the cost of the PP+OH technology by a factor of ten, but costs were still not satisfactory for PNGV applications. Thus, a second polymer film technology, hydroxylated polystyrene, was developed that exhibited more loss than PP+OH but is 10 to 100 times more cost-effective. This new technology has five times the energy-density-handling capability of the commercial standard, polyphenylene sulfide.
Inverter designs and operating conditions for dc bus capacitors vary from manufacturer to manufacturer. Frank Zollner of GM has presented 2-to-5-year goals and 10-year goals for dc bus capacitors that other auto manufacturers feel are satisfactory milestones for the PNGV program. Specific goals for 2004 commercialization include the following: (1) -40oC to 110oC operation, (2)
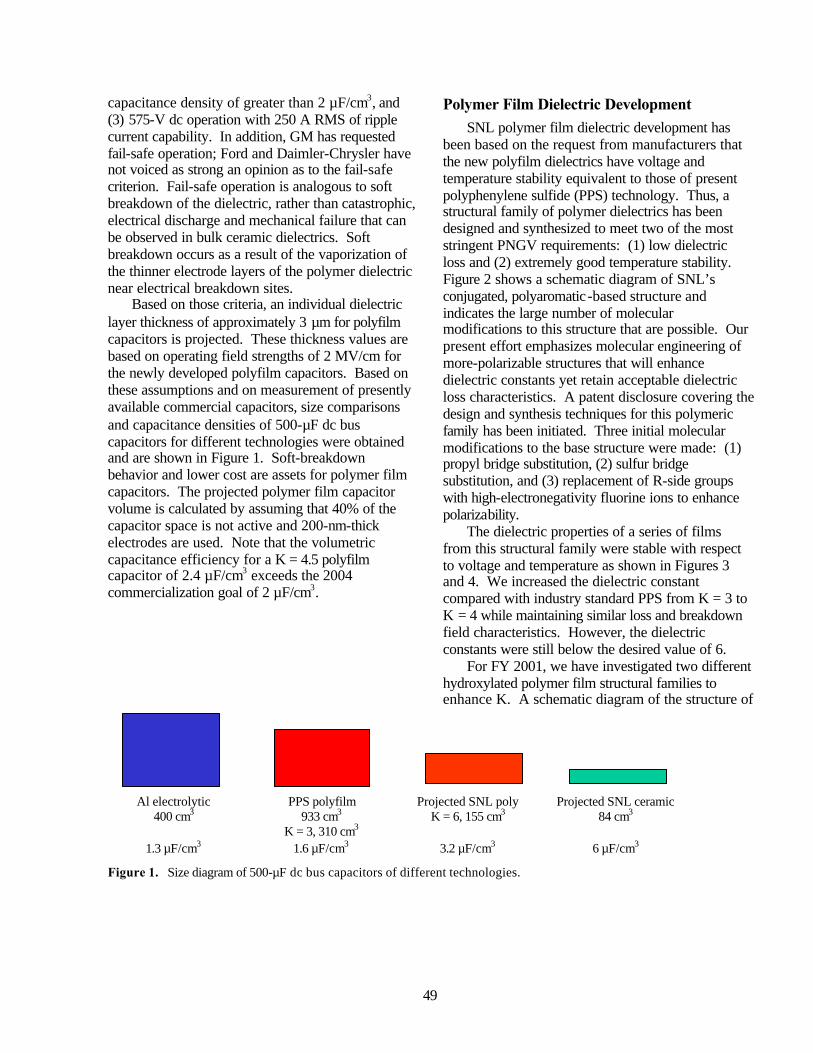
49
capacitance density of greater than 2 µF/cm3, and (3) 575-V dc operation with 250 A RMS of ripple current capability. In addition, GM has requested fail-safe operation; Ford and Daimler-Chrysler have not voiced as strong an opinion as to the fail-safe criterion. Fail-safe operation is analogous to soft breakdown of the dielectric, rather than catastrophic, electrical discharge and mechanical failure that can be observed in bulk ceramic dielectrics. Soft breakdown occurs as a result of the vaporization of the thinner electrode layers of the polymer dielectric near electrical breakdown sites.
Based on those criteria, an individual dielectric layer thickness of approximately 3 µm for polyfilm capacitors is projected. These thickness values are based on operating field strengths of 2 MV/cm for the newly developed polyfilm capacitors. Based on these assumptions and on measurement of presently available commercial capacitors, size comparisons and capacitance densities of 500-µF dc bus capacitors for different technologies were obtained and are shown in Figure 1. Soft-breakdown behavior and lower cost are assets for polymer film capacitors. The projected polymer film capacitor volume is calculated by assuming that 40% of the capacitor space is not active and 200-nm-thick electrodes are used. Note that the volumetric capacitance efficiency for a K = 4.5 polyfilm capacitor of 2.4 µF/cm3 exceeds the 2004 commercialization goal of 2 µF/cm3.
Polymer Film Dielectric Development SNL polymer film dielectric development has
been based on the request from manufacturers that the new polyfilm dielectrics have voltage and temperature stability equivalent to those of present polyphenylene sulfide (PPS) technology. Thus, a structural family of polymer dielectrics has been designed and synthesized to meet two of the most stringent PNGV requirements: (1) low dielectric loss and (2) extremely good temperature stability. Figure 2 shows a schematic diagram of SNL’s conjugated, polyaromatic-based structure and indicates the large number of molecular modifications to this structure that are possible. Our present effort emphasizes molecular engineering of more-polarizable structures that will enhance dielectric constants yet retain acceptable dielectric loss characteristics. A patent disclosure covering the design and synthesis techniques for this polymeric family has been initiated. Three initial molecular modifications to the base structure were made: (1) propyl bridge substitution, (2) sulfur bridge substitution, and (3) replacement of R-side groups with high-electronegativity fluorine ions to enhance polarizability.
The dielectric properties of a series of films from this structural family were stable with respect to voltage and temperature as shown in Figures 3 and 4. We increased the dielectric constant compared with industry standard PPS from K = 3 to K = 4 while maintaining similar loss and breakdown field characteristics. However, the dielectric constants were still below the desired value of 6.
For FY 2001, we have investigated two different hydroxylated polymer film structural families to enhance K. A schematic diagram of the structure of
Al electrolytic 400 cm3
1.3 µF/cm3
PPS polyfilm 933 cm3
K = 3, 310 cm3 1.6 µF/cm3
Projected SNL poly K = 6, 155 cm3
3.2 µF/cm3
Projected SNL ceramic 84 cm3
6 µF/cm3
Figure 1. Size diagram of 500-µF dc bus capacitors of different technologies.
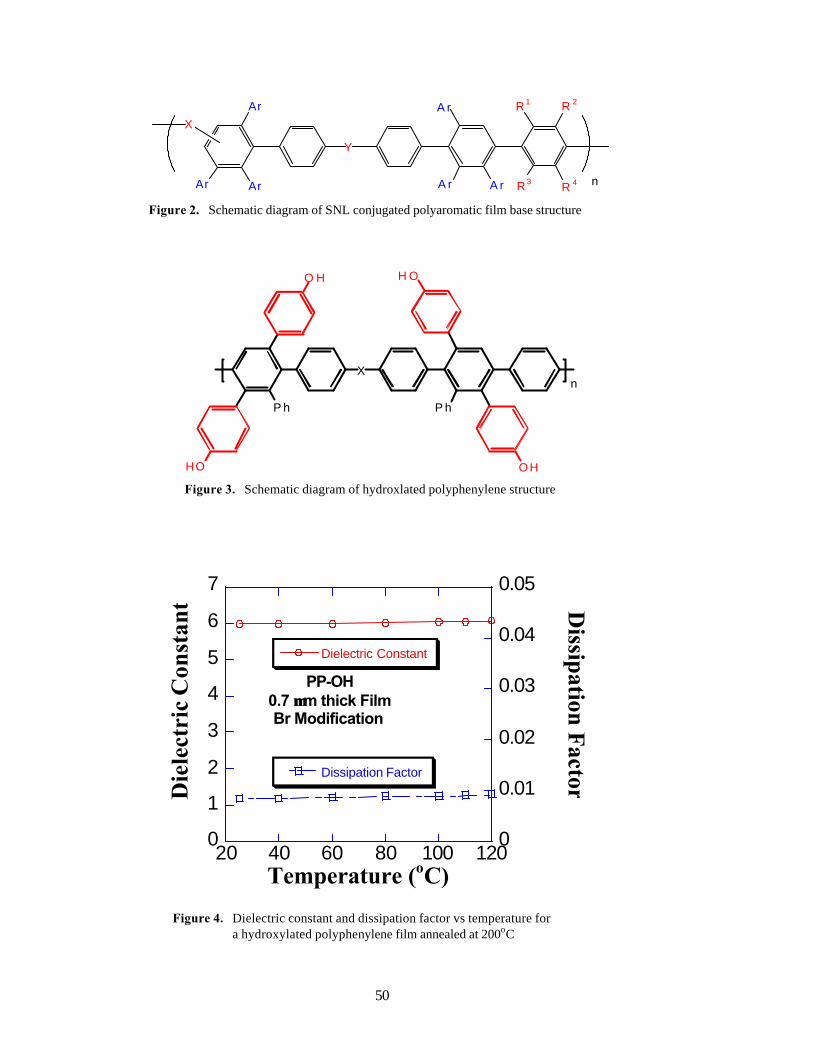
50
Y
Ar
ArAr
A r
A r A r
R1 R 2
R3 R 4
X
n
Figure 2. Schematic diagram of SNL conjugated polyaromatic film base structure
X
P h P h
n
O H H O
OHHO Figure 3. Schematic diagram of hydroxlated polyphenylene structure
0
1
2
3
4
5
6
7
0
0.01
0.02
0.03
0.04
0.05
20 40 60 80 100 120
Dielectric Constant
Dissipation Factor
PP-OH0.7 µµm thick FilmBr Modification
Temperature (oC)
Die
lect
ric
Con
stan
t Dissipation F
actor
Figure 4. Dielectric constant and dissipation factor vs temperature for a hydroxylated polyphenylene film annealed at 200oC
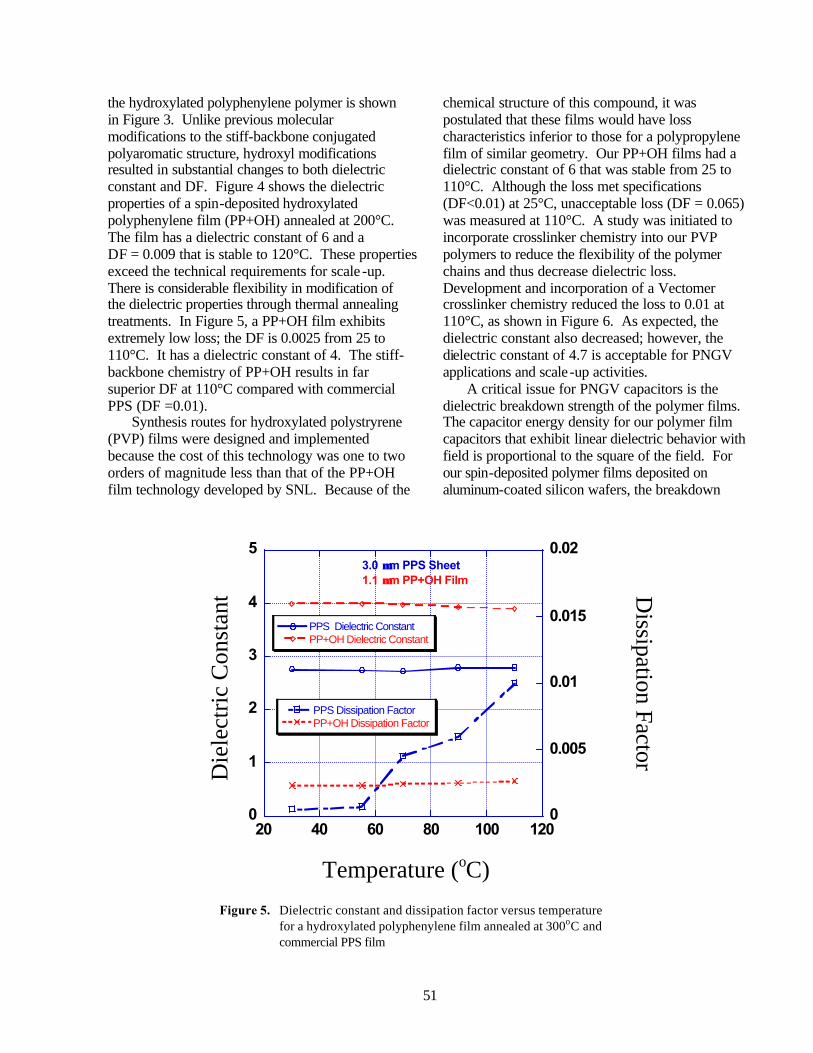
51
the hydroxylated polyphenylene polymer is shown in Figure 3. Unlike previous molecular modifications to the stiff-backbone conjugated polyaromatic structure, hydroxyl modifications resulted in substantial changes to both dielectric constant and DF. Figure 4 shows the dielectric properties of a spin-deposited hydroxylated polyphenylene film (PP+OH) annealed at 200°C. The film has a dielectric constant of 6 and a DF = 0.009 that is stable to 120°C. These properties exceed the technical requirements for scale -up. There is considerable flexibility in modification of the dielectric properties through thermal annealing treatments. In Figure 5, a PP+OH film exhibits extremely low loss; the DF is 0.0025 from 25 to 110°C. It has a dielectric constant of 4. The stiff-backbone chemistry of PP+OH results in far superior DF at 110°C compared with commercial PPS (DF =0.01).
Synthesis routes for hydroxylated polystryrene (PVP) films were designed and implemented because the cost of this technology was one to two orders of magnitude less than that of the PP+OH film technology developed by SNL. Because of the
chemical structure of this compound, it was postulated that these films would have loss characteristics inferior to those for a polypropylene film of similar geometry. Our PP+OH films had a dielectric constant of 6 that was stable from 25 to 110°C. Although the loss met specifications (DF<0.01) at 25°C, unacceptable loss (DF = 0.065) was measured at 110°C. A study was initiated to incorporate crosslinker chemistry into our PVP polymers to reduce the flexibility of the polymer chains and thus decrease dielectric loss. Development and incorporation of a Vectomer crosslinker chemistry reduced the loss to 0.01 at 110°C, as shown in Figure 6. As expected, the dielectric constant also decreased; however, the dielectric constant of 4.7 is acceptable for PNGV applications and scale-up activities.
A critical issue for PNGV capacitors is the dielectric breakdown strength of the polymer films. The capacitor energy density for our polymer film capacitors that exhibit linear dielectric behavior with field is proportional to the square of the field. For our spin-deposited polymer films deposited on aluminum-coated silicon wafers, the breakdown
0
1
2
3
4
5
0
0.005
0.01
0.015
0.02
20 40 60 80 100 120
PPS Dielectric ConstantPP+OH Dielectric Constant
PPS Dissipation FactorPP+OH Dissipation Factor
3.0 µµm PPS Sheet1.1 µµm PP+OH Film
Die
lect
ric
Con
stan
t Dissipation Factor
Temperature (oC)
Figure 5. Dielectric constant and dissipation factor versus temperature for a hydroxylated polyphenylene film annealed at 300oC and commercial PPS film
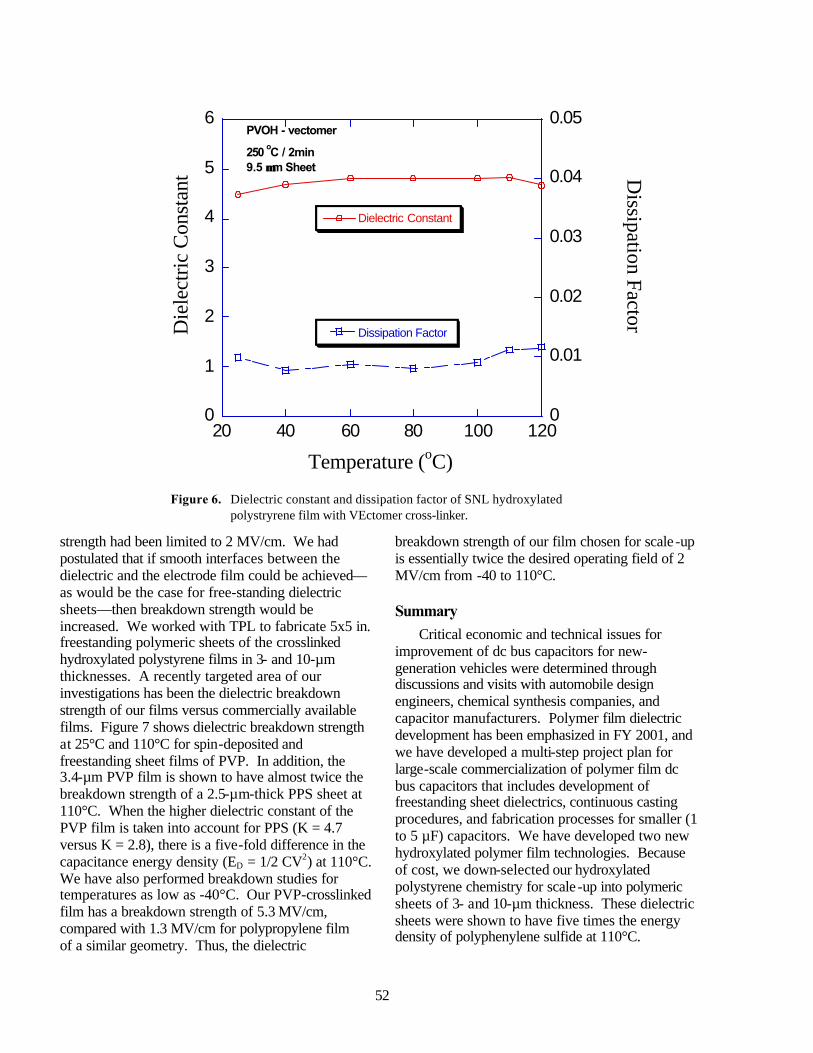
52
strength had been limited to 2 MV/cm. We had postulated that if smooth interfaces between the dielectric and the electrode film could be achieved—as would be the case for free-standing dielectric sheets—then breakdown strength would be increased. We worked with TPL to fabricate 5x5 in. freestanding polymeric sheets of the crosslinked hydroxylated polystyrene films in 3- and 10-µm thicknesses. A recently targeted area of our investigations has been the dielectric breakdown strength of our films versus commercially available films. Figure 7 shows dielectric breakdown strength at 25°C and 110°C for spin-deposited and freestanding sheet films of PVP. In addition, the 3.4-µm PVP film is shown to have almost twice the breakdown strength of a 2.5-µm-thick PPS sheet at 110°C. When the higher dielectric constant of the PVP film is taken into account for PPS (K = 4.7 versus K = 2.8), there is a five-fold difference in the capacitance energy density (ED = 1/2 CV2) at 110°C. We have also performed breakdown studies for temperatures as low as -40°C. Our PVP-crosslinked film has a breakdown strength of 5.3 MV/cm, compared with 1.3 MV/cm for polypropylene film of a similar geometry. Thus, the dielectric
breakdown strength of our film chosen for scale -up is essentially twice the desired operating field of 2 MV/cm from -40 to 110°C. Summary
Critical economic and technical issues for improvement of dc bus capacitors for new-generation vehicles were determined through discussions and visits with automobile design engineers, chemical synthesis companies, and capacitor manufacturers. Polymer film dielectric development has been emphasized in FY 2001, and we have developed a multi-step project plan for large-scale commercialization of polymer film dc bus capacitors that includes development of freestanding sheet dielectrics, continuous casting procedures, and fabrication processes for smaller (1 to 5 µF) capacitors. We have developed two new hydroxylated polymer film technologies. Because of cost, we down-selected our hydroxylated polystyrene chemistry for scale -up into polymeric sheets of 3- and 10-µm thickness. These dielectric sheets were shown to have five times the energy density of polyphenylene sulfide at 110°C.
Temperature (oC)
0
1
2
3
4
5
6
0
0.01
0.02
0.03
0.04
0.05
20 40 60 80 100 120
Dielectric Constant
Dissipation Factor
PVOH - vectomer
250 oC / 2min9.5 µµm Sheet
Die
lect
ric
Con
stan
t Dissipation Factor
Figure 6. Dielectric constant and dissipation factor of SNL hydroxylated polystryrene film with VEctomer cross-linker.
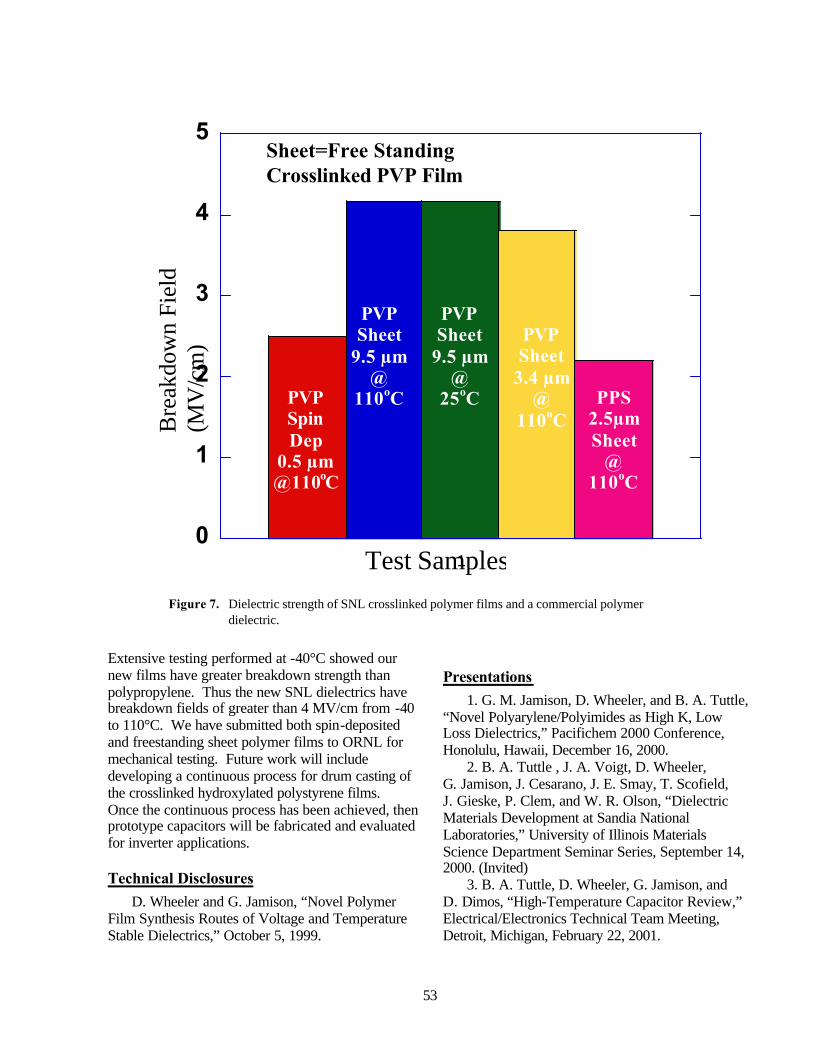
53
Extensive testing performed at -40°C showed our new films have greater breakdown strength than polypropylene. Thus the new SNL dielectrics have breakdown fields of greater than 4 MV/cm from -40 to 110°C. We have submitted both spin-deposited and freestanding sheet polymer films to ORNL for mechanical testing. Future work will include developing a continuous process for drum casting of the crosslinked hydroxylated polystyrene films. Once the continuous process has been achieved, then prototype capacitors will be fabricated and evaluated for inverter applications. Technical Disclosures
D. Wheeler and G. Jamison, “Novel Polymer Film Synthesis Routes of Voltage and Temperature Stable Dielectrics,” October 5, 1999.
Presentations
1. G. M. Jamison, D. Wheeler, and B. A. Tuttle, “Novel Polyarylene/Polyimides as High K, Low Loss Dielectrics,” Pacifichem 2000 Conference, Honolulu, Hawaii, December 16, 2000.
2. B. A. Tuttle , J. A. Voigt, D. Wheeler, G. Jamison, J. Cesarano, J. E. Smay, T. Scofield, J. Gieske, P. Clem, and W. R. Olson, “Dielectric Materials Development at Sandia National Laboratories,” University of Illinois Materials Science Department Seminar Series, September 14, 2000. (Invited)
3. B. A. Tuttle, D. Wheeler, G. Jamison, and D. Dimos, “High-Temperature Capacitor Review,” Electrical/Electronics Technical Team Meeting, Detroit, Michigan, February 22, 2001.
0
1
2
3
4
5
1
Bre
akdo
wn
Fiel
d (M
V/c
m)
Sheet=Free Standing Crosslinked PVP Film
PVP Sheet
9.5 µm @
110oC PVP Spin Dep
0.5 µm @110oC
PVP Sheet
9.5 µm @
25oC
PVP Sheet
3.4 µm@
110oC PPS
2.5µm Sheet
@ 110oC
Test Samples
Figure 7. Dielectric strength of SNL crosslinked polymer films and a commercial polymer dielectric.
54
Mechanical Reliability of Electronic Ceramics and Electronic Ceramic Devices M. K. Ferber, L. Riester, C-H Hsueh, and M. Lance Mechanical Characterization and Analysis Group Oak Ridge National Laboratory, P.O. Box 2008, MS 6068, Bldg. 4515 Oak Ridge, TN 37830-6069 (865) 576-0818; fax: (865) 574-6098; e-mail: [email protected] DOE Program Manager: Patrick Davis (202) 586-8061; fax: (202) 586-9811; e-mail: [email protected] ORNL Technical Advisor: David Stinton (865) 574-4556; fax: (865) 241-0411; e-mail: [email protected]
Contractor: Oak Ridge National Laboratory, Oak Ridge, Tennessee Prime Contract No.: DE-AC05-00OR22725
Objectives
• Predict and assess the mechanical reliability of electronic devices with emphasis on those used for automotive power electronics (e.g., capacitors)
• Correlate the mechanical characterization of polymer film capacitors developed by Sandia National Laboratory (SNL) with the dielectric behavior
Approach
• Characterize the reliability of the electronic ceramics using thermomechanical stress modeling and probable design and life-prediction techniques specifically developed for ceramics
• Develop an analytical model predicting residual stresses in ceramic devices
• Develop techniques to characterize polymer films developed by SNL and correlate mechanical behavior with dielectric behavior
Accomplishments
• Used a micro-mechanical test apparatus to directly measure the strength of small, multi-layer ceramic capacitors (MLCCs)
• Developed an analytical model for predicting residual stresses in MLCCs and applied it to explain strength differences in several varieties of 1206 MLCCs
• Received the first series of polymer film samples from SNL and analyzed them using a mechanical properties microprobe
Future Direction
• Develop hardware and test procedures for analyzing polymer films with respect to temperature
• Use the mechanical properties microprobe to track changes in polymer structure resulting from in-service use

55
Introduction
A lack of mechanical reliability of electronic ceramics in multi-layer ceramic capacitors (MLCCs) can often limit the reliability of their electronic function. The application of ceramic life prediction codes (developed for structural ceramic component design in high-temperature gas turbine engines) is used in concert with the mechanical testing analyses of the electronic ceramics because they portray the probable strength and fatigue properties of electronic ceramics in an appropriate (but underutilized) manner. The primary effort in FY 2001 involved the direct measurement of the three-point flexure strength of the MLCCs.
Because of the interest in polymer film capacitors, a collaboration with SNL was initiated to evaluate SNL’s materials. Synthetic chemists at SNL are currently fabricating a number of different temperature-stable polymers for the PNGV program. The 2004 goal is to have a polymer film dielectric that can operate continuously at 110EC. Although these films are expected to be similar to polyphenylene sulfide in terms of properties, they are truly unique films that have not been used before by the capacitor industry. Therefore, the mechanical characterization of these new materials would be very beneficial, if not vital.
MLCCs for Automotive Power Electronics
In FY 2000, an in-situ measurement technique was used to assess the mechanical strength of MLCCs.1–3 (The capacitor size examined is illustrated in Figure 1.) The basic approach involved the calculation of the Weibull strength distribution from the measurement of potential strength-limiting flaw-size distributions (using image analysis) and the use of the Griffith equation. The dielectric ceramic in all three MLCC sets contained two different and concurrent flaw types that were studied as potential strength-limiters: pores and secondary phase “inclusions” (see Figure 2 for a representative microstructure that shows both).
More recent studies have focused on the direct measurement of the three-point flexure strength using the micro-mechanical test facility shown in Figure 3. The X-Y-Z stages, which are driven by computer-controlled stepper motors, provide for precise positioning of the specimen. During testing,
the capacitor is first placed on a lower, three-point support fixture that is attached to the Z-stage. The
Figure 1. Multi-layer ceramic capacitors of 0805 (top) and 1206 (bottom)
Figure 2. The size distribution of two potential strength-limiting flaw types, pores and secondary phase “inclusions,” were measured
load then is applied by raising the Z-stage at a controlled rate until the specimen contacts the fixed upper load point, which is attached to a load cell. The strength data generated using this facility are
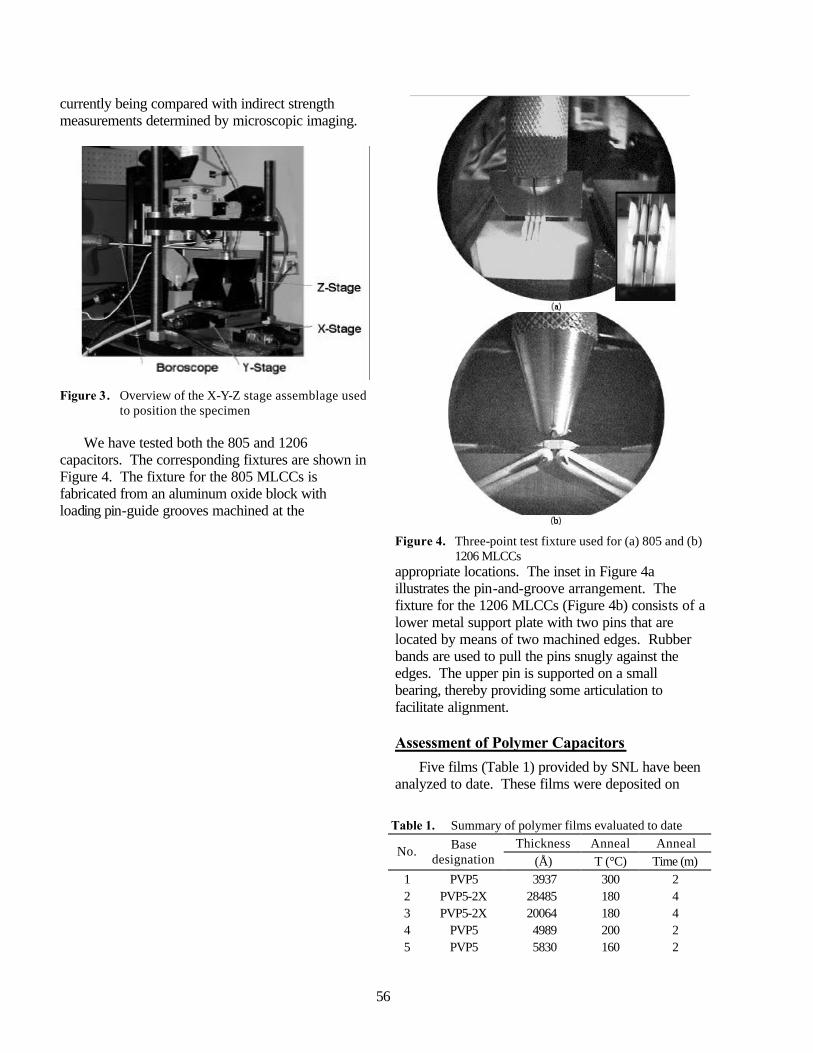
56
currently being compared with indirect strength measurements determined by microscopic imaging.
Figure 3. Overview of the X-Y-Z stage assemblage used to position the specimen
We have tested both the 805 and 1206
capacitors. The corresponding fixtures are shown in Figure 4. The fixture for the 805 MLCCs is fabricated from an aluminum oxide block with loading pin-guide grooves machined at the
Figure 4. Three-point test fixture used for (a) 805 and (b)
1206 MLCCs appropriate locations. The inset in Figure 4a illustrates the pin-and-groove arrangement. The fixture for the 1206 MLCCs (Figure 4b) consists of a lower metal support plate with two pins that are located by means of two machined edges. Rubber bands are used to pull the pins snugly against the edges. The upper pin is supported on a small bearing, thereby providing some articulation to facilitate alignment. Assessment of Polymer Capacitors
Five films (Table 1) provided by SNL have been analyzed to date. These films were deposited on
Table 1. Summary of polymer films evaluated to date Thickness Anneal Anneal
No. Base designation (Å) T (°C) Time (m)
1 PVP5 3937 300 2 2 PVP5-2X 28485 180 4 3 PVP5-2X 20064 180 4 4 PVP5 4989 200 2 5 PVP5 5830 160 2
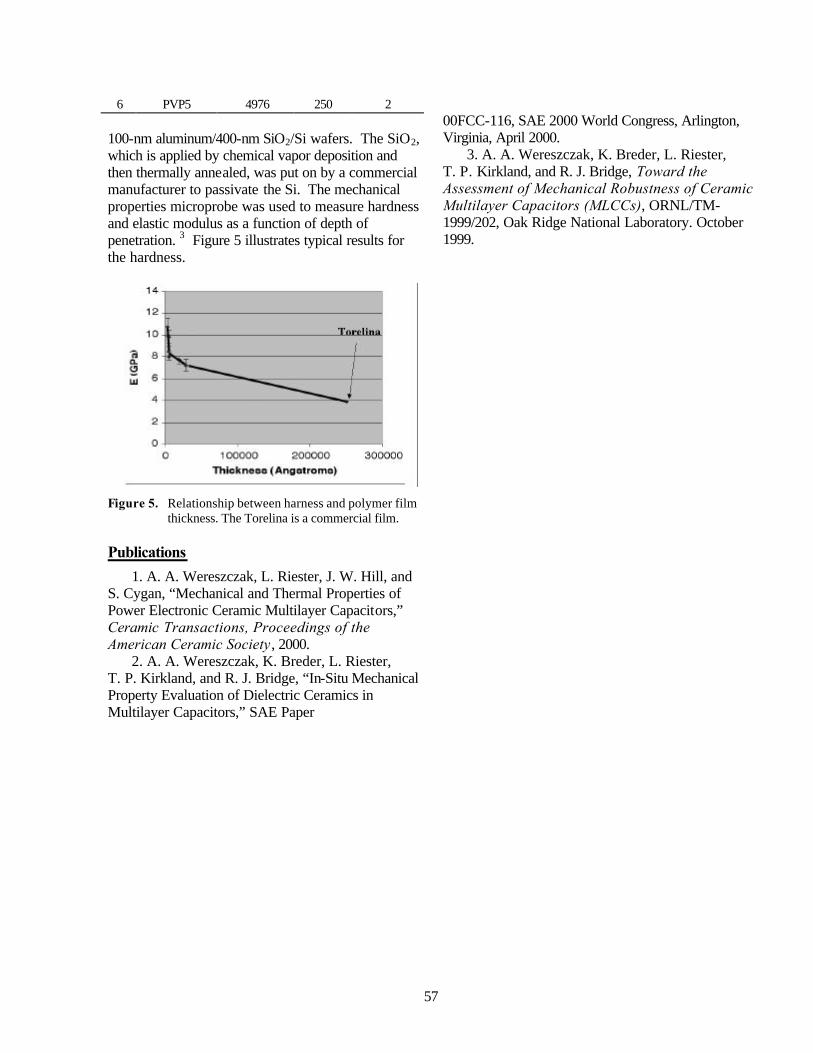
57
6 PVP5 4976 250 2
100-nm aluminum/400-nm SiO2/Si wafers. The SiO2, which is applied by chemical vapor deposition and then thermally annealed, was put on by a commercial manufacturer to passivate the Si. The mechanical properties microprobe was used to measure hardness and elastic modulus as a function of depth of penetration. 3 Figure 5 illustrates typical results for the hardness.
Figure 5. Relationship between harness and polymer film thickness. The Torelina is a commercial film.
Publications
1. A. A. Wereszczak, L. Riester, J. W. Hill, and S. Cygan, “Mechanical and Thermal Properties of Power Electronic Ceramic Multilayer Capacitors,” Ceramic Transactions, Proceedings of the American Ceramic Society, 2000.
2. A. A. Wereszczak, K. Breder, L. Riester, T. P. Kirkland, and R. J. Bridge, “In-Situ Mechanical Property Evaluation of Dielectric Ceramics in Multilayer Capacitors,” SAE Paper
00FCC-116, SAE 2000 World Congress, Arlington, Virginia, April 2000.
3. A. A. Wereszczak, K. Breder, L. Riester, T. P. Kirkland, and R. J. Bridge, Toward the Assessment of Mechanical Robustness of Ceramic Multilayer Capacitors (MLCCs), ORNL/TM-1999/202, Oak Ridge National Laboratory. October 1999.
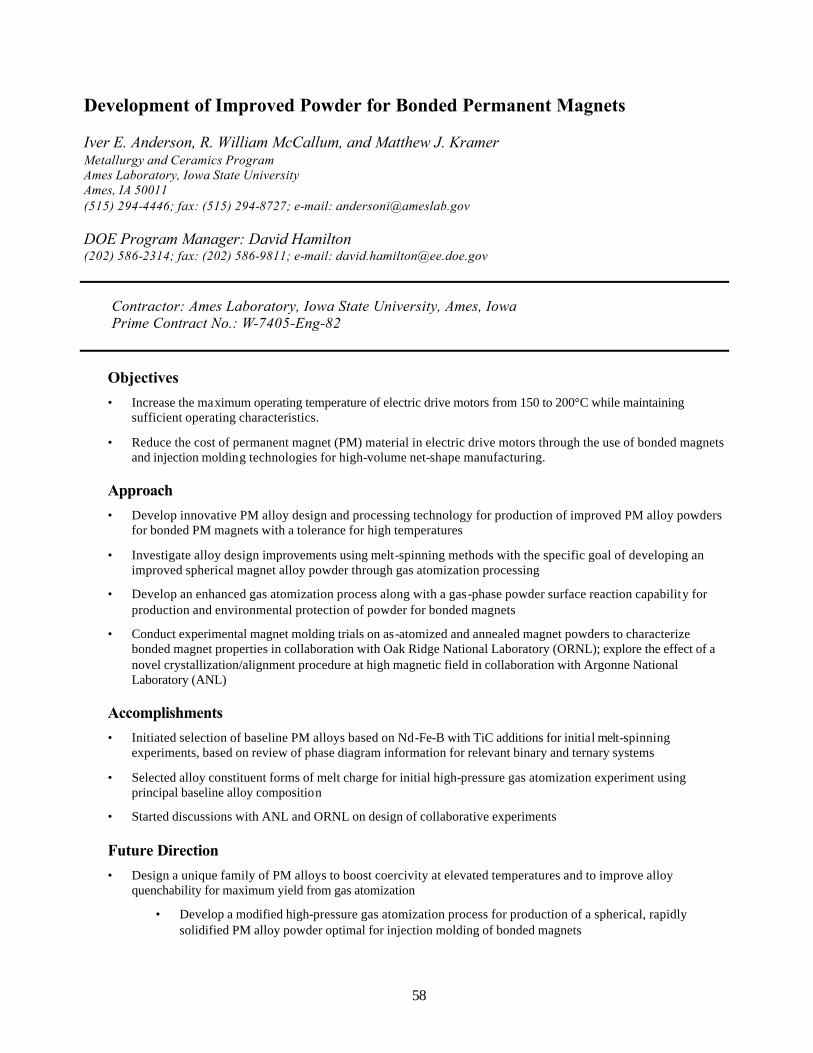
58
Development of Improved Powder for Bonded Permanent Magnets
Iver E. Anderson, R. William McCallum, and Matthew J. Kramer Metallurgy and Ceramics Program Ames Laboratory, Iowa State University Ames, IA 50011 (515) 294-4446; fax: (515) 294-8727; e-mail: [email protected]
DOE Program Manager: David Hamilton (202) 586-2314; fax: (202) 586-9811; e-mail: [email protected]
Contractor: Ames Laboratory, Iowa State University, Ames, Iowa Prime Contract No.: W-7405-Eng-82
Objectives
• Increase the maximum operating temperature of electric drive motors from 150 to 200°C while maintaining sufficient operating characteristics.
• Reduce the cost of permanent magnet (PM) material in electric drive motors through the use of bonded magnets and injection molding technologies for high-volume net-shape manufacturing.
Approach
• Develop innovative PM alloy design and processing technology for production of improved PM alloy powders for bonded PM magnets with a tolerance for high temperatures
• Investigate alloy design improvements using melt-spinning methods with the specific goal of developing an improved spherical magnet alloy powder through gas atomization processing
• Develop an enhanced gas atomization process along with a gas-phase powder surface reaction capability for production and environmental protection of powder for bonded magnets
• Conduct experimental magnet molding trials on as-atomized and annealed magnet powders to characterize bonded magnet properties in collaboration with Oak Ridge National Laboratory (ORNL); explore the effect of a novel crystallization/alignment procedure at high magnetic field in collaboration with Argonne National Laboratory (ANL)
Accomplishments
• Initiated selection of baseline PM alloys based on Nd-Fe-B with TiC additions for initial melt-spinning experiments, based on review of phase diagram information for relevant binary and ternary systems
• Selected alloy constituent forms of melt charge for initial high-pressure gas atomization experiment using principal baseline alloy composition
• Started discussions with ANL and ORNL on design of collaborative experiments Future Direction
• Design a unique family of PM alloys to boost coercivity at elevated temperatures and to improve alloy quenchability for maximum yield from gas atomization
• Develop a modified high-pressure gas atomization process for production of a spherical, rapidly solidified PM alloy powder optimal for injection molding of bonded magnets
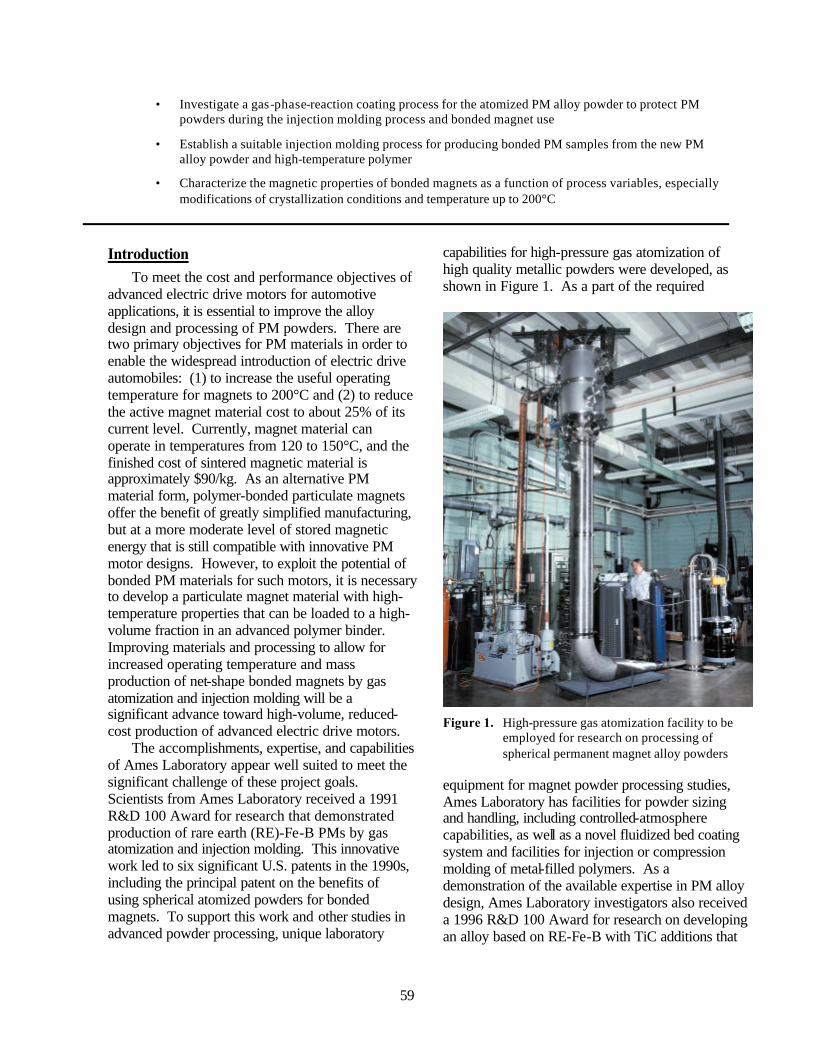
59
• Investigate a gas-phase-reaction coating process for the atomized PM alloy powder to protect PM powders during the injection molding process and bonded magnet use
• Establish a suitable injection molding process for producing bonded PM samples from the new PM alloy powder and high-temperature polymer
• Characterize the magnetic properties of bonded magnets as a function of process variables, especially modifications of crystallization conditions and temperature up to 200°C
Introduction
To meet the cost and performance objectives of advanced electric drive motors for automotive applications, it is essential to improve the alloy design and processing of PM powders. There are two primary objectives for PM materials in order to enable the widespread introduction of electric drive automobiles: (1) to increase the useful operating temperature for magnets to 200°C and (2) to reduce the active magnet material cost to about 25% of its current level. Currently, magnet material can operate in temperatures from 120 to 150°C, and the finished cost of sintered magnetic material is approximately $90/kg. As an alternative PM material form, polymer-bonded particulate magnets offer the benefit of greatly simplified manufacturing, but at a more moderate level of stored magnetic energy that is still compatible with innovative PM motor designs. However, to exploit the potential of bonded PM materials for such motors, it is necessary to develop a particulate magnet material with high-temperature properties that can be loaded to a high-volume fraction in an advanced polymer binder. Improving materials and processing to allow for increased operating temperature and mass production of net-shape bonded magnets by gas atomization and injection molding will be a significant advance toward high-volume, reduced-cost production of advanced electric drive motors.
The accomplishments, expertise, and capabilities of Ames Laboratory appear well suited to meet the significant challenge of these project goals. Scientists from Ames Laboratory received a 1991 R&D 100 Award for research that demonstrated production of rare earth (RE)-Fe-B PMs by gas atomization and injection molding. This innovative work led to six significant U.S. patents in the 1990s, including the principal patent on the benefits of using spherical atomized powders for bonded magnets. To support this work and other studies in advanced powder processing, unique laboratory
capabilities for high-pressure gas atomization of high quality metallic powders were developed, as shown in Figure 1. As a part of the required
Figure 1. High-pressure gas atomization facility to be
employed for research on processing of spherical permanent magnet alloy powders
equipment for magnet powder processing studies, Ames Laboratory has facilities for powder sizing and handling, including controlled-atmosphere capabilities, as well as a novel fluidized bed coating system and facilities for injection or compression molding of metal-filled polymers. As a demonstration of the available expertise in PM alloy design, Ames Laboratory investigators also received a 1996 R&D 100 Award for research on developing an alloy based on RE-Fe-B with TiC additions that

60
exhibits high quenchability and a high energy product. The results of this work also led to two more recent U.S. patents. The alloy design work is facilitated by fully developed laboratory capabilities for well-instrumented, controlled-atmosphere melt-spinning of ribbon samples, as shown in Figure 2, and for magnetic analysis (superconducting quantum interference device, vibrating sample magnetometer), calorimetric analysis (differential scanning calorimeter, differential thermal analysis), microstructural analysis (scanning electron microscopy, transmission electron microscopy, auger electron spectroscopy, X-ray photoelectron spectroscopy), and oxidation and corrosion measurements.
Figure 2. Well-instrumented, controlled-atmosphere
melt spinning apparatus for preparation of ribbon samples for permanent magnet alloy design work
Ames Laboratory scientists also interact with all
national laboratories that are active in the DOE-Basic Energy Sciences Center of Excellence for Synthesis and Processing, which has focused on PM materials in the six years since its formation. Continued Ames Lab industrial interactions include Magnequench (Anderson, Indiana) on alloy design and rapid solidification processing, including the recent award of an LTR-cooperative research and development agreement on advanced sensors and control of the melt-spinning process. Ames
Laboratory scientists have also interacted over the last ten years with Arnold Engineering (Norfolk, Nebraska) on injection molding and bonded magnet processing.
Approach
Innovative PM alloy design and processing technology will be developed for production of improved PM alloy powders for bonded PM magnets with a tolerance for high temperatures. Melt-spinning will be used to select alloy modifications that boost coercivity at elevated temperatures (up to 200°C) and improve alloy quenchability for optimum yield from a gas atomization process. A modified high-pressure gas atomization process will be developed for the improved PM alloys to enhance the yield of spherical, rapidly solidified powder. A gas-phase-reaction coating process will be developed for increased environmental protection of fine atomized powder without degrading magnetic properties or molding rheology, building on recent studies of fluidized bed fluorination of similar RE alloy powders. A model polymer will be selected and used to test injection molding properties for high-temperature bonded magnets. The effects of a conceptual crystallization/alignment procedure conducted at a high magnetic field (up to 9 Tesla) will be investigated in collaboration with ANL. The magnetic properties of bonded powder samples will be determined as a function of loading fraction, powder size, annealing schedule, coating treatment, and temperature up to a maximum of 200°C. Some of the bonded magnets also will be provided to ORNL for additional characterization in a collaborative effort.
Results
Currently, an evaluation of baseline PM alloys is underway. The evaluation is based on a review of all available phase diagram information for relevant binary and ternary systems and our understanding of the solidification process. Starting with Nd-Fe-B with TiC additions, alloying routes that have the potential to increase the high-temperature performance without adversely affecting the quenchability of the base alloy are being identified. Alloy constituent forms of the melt charge have been selected for initial high-pressure gas atomization experiments using the principal baseline
61
alloy composition. Discussions have been started on the design of collaborative experiments in high-temperature magnetic alignment and bonded magnet testing with Thomas Mulcahy of ANL and John Hsu of ORNL, respectively.
Conclusions
Because this project began in June 2001 and the accomplishments to date are preliminary in nature, no significant conclusions can be drawn at this time.
Bibliography
1. R. W. McCallum, K. W. Dennis, B. K. Lograsso, and I. E. Anderson, “Method of Making Bonded or Sintered Permanent Magnets,” U.S. Patent 5,240,513, August 31, 1993.
2. R. W. McCallum, K. W. Dennis, B. K. Lograsso, and I. E. Anderson, “Method of Making Permanent Magnets,” U.S. Patent 5,242,508, September 7, 1993.
3. I. E. Anderson, B. K. Lograsso, and R. L. Terpstra, “Environmentally Stable Reactive Alloy Powders and Method of Making Same,” U.S. Patent 5,372,629, December 13, 1994.
4. R. W. McCallum, K. W. Dennis, B. K. Lograsso, and I. E. Anderson, “Method of Making Bonded or Sintered Permanent Magnets (continuation),” U.S. Patent 5,470,401, November 28, 1995.
5. I. E. Anderson and R. L. Terpstra, “Apparatus for Making Environmentally Stable Reactive Alloy Powders,” U.S. Patent 5,589,199, December 31, 1996.
6. I. E. Anderson, B. K. Lograsso, and R. L. Terpstra, “Environmentally Stable Reactive Alloy Powders and Method of Making Same,” U.S. Patent 5,811,187, September 22, 1998.
7. R. W. McCallum and D. J. Branagan, “Carbide/Nitride Grain Refined Rare Earth-Iron-Boron Permanent Magnet and Method of Making,” U.S. Patent 5,803,992, September 8, 1998.
8. R. W. McCallum and D. J. Branagan, “Carbide/Nitride Grain Refined Rare Earth-Iron-Boron Permanent Magnet and Method of Making,” U.S. Patent 5,486,240, January 23, 1996.
9. D. J. Branagan and R. W. McCallum, “The Effects of Ti, C, and TiC on the Crystallization of Amorphous Nd2Fe14B,” J. Alloys and Compds., 245 (1996).
10. D. J. Branagan, T. A. Hyde, C. H. Sellers, and R. W. McCallum, “Developing Rare Earth Permanent Magnet Alloys for Gas Atomization,” J. Phys. D: Appl. Phys., 29, 2376 (1996).
11. M. J. Kramer, C. P. Li, K. W. Dennis, R. W. McCallum, C. H. Sellers, D. J. Branagan, L. H. Lewis, and J. Y. Wang, “Effect of TiC Additions to the Microstructure and Magnetic Properties of Nd9.5Fe84.5B6 Melt-spun Ribbons,” J. Appl. Phys., 83(11), pt. 2, 6631 (1998).
12. D. J. Branagan and R. W. McCallum, “Changes in Glass Formation and Glass Forming Ability of Nd2Fe14B by the Addition of TiC,” J. Alloys and Compds., 244 (1–2), 40 (1996).
13. B. K. Lograsso, R. Reaves, I. Anderson, and R. W. McCallum, “Powder Processing of Rare Earth-Iron-Boron Permanent Magnets,” Inst. Phys. Res. and Tech., Rev. Part. Mater., 3, 223 (1995).
14. D. J. Branagan and R. W. McCallum, “Altering Cooling Rate Dependence of Phase Formation during Rapid Solidification in the Nd2Fe14B System,” J. Magn. Magn. Mater., 146 (1–2), 89 (1995).
15. I. E. Anderson, B. K. Lograsso, and R. W. McCallum, “High Pressure Gas Atomization of Rare Earth-Iron Alloy Permanent Magnet Powders,” Int. Conf. Process. Mater. Prop., Warrendale, PA, ed. H. Henein, O. Takeo, 1993, p. 645.
Publications/Presentations
R. W. McCallum and I. E. Anderson, “Bonded Magnets—Maturity, Cost, Suppliers,” Segmented Electromagnetic Array Workshop at the Oak Ridge National Transportation Research Center, March 19-20, 2001.
62
Low-Cost, High-Energy-Product Permanent Magnets Tom M. Mulcahy and John R. Hull Argonne National Laboratory Energy Technology Division, Bldg. 335 Argonne, IL 60439
(630) 252-6145; fax: (630) 252-5568; e-mail: [email protected] Andrew E. Payzant Oak Ridge National Laboratory P.O. Box 2008, MS 6064 Oak Ridge, TN 37831-6069 (865) 574-6538; fax: (865) 574-3940; e-mail: [email protected]
DOE Program Manager: Patrick Davis (202) 586-8061; fax: (202) 586-9811; e-mail: [email protected]
ORNL Technical Advisor: David Stinton (865) 574-4556; fax: (865) 241-0411; e-mail: [email protected]
Contractor: Argonne National Laboratory, Argonne, Illinois Prime Contract No.: W-31-109-Eng-38
Objectives
• Develop a low-cost process to fabricate an anisotropic NdFeB permanent magnet (PM) with up to a 25% increase in energy product, which is a measure of the torque that a motor can produce for a given magnet mass – The higher-performance magnets will replace those made by traditional powder metallurgy processing and enable significant size and weight reductions in traction motors for hybrid vehicles.
• Use high fields of superconducting solenoids to improve magnetic grain alignment while pressing compacts for sintering, thus producing higher-performance magnets
Approach
• Develop a batch-mode press that enables alignment of the magnetic domains of NdFeB powders in the higher-strength magnetic fields created by a superconducting solenoid
• Characterize, compare, and correlate engineering and microscopic magnetic properties of magnets processed under varying conditions, including some in current production
• Use a reciprocating feed to automate the insertion and removal of loose and compacted magnet powder into and from the steady magnetic field of a superconducting solenoid
Accomplishments
• Produced energy products that were within 10% of the theoretical maximum by optimizing batch-mode alignment/pressing of cylindrical axial-die-pressed PMs in a 9-Tesla (T) superconducting solenoid – The magnetic properties are comparable to the more expensive magnets made by the transverse-die pressing technique.
63
• Improved energy product by 15% for thin near-final-shape magnets, production of which is the current cost-saving thrust in the PM industry
• Proved the crucial step in enabling automation feasible – For the first time, powder-filled dies were inserted into and pressed compacts were removed from an active (always on) superconducting solenoid. Most important, these magnets were the best made.
• Characterized the microscopic texture (alignment) of PMs made in the Argonne axial-die press facility and correlated the alignment with macroscopic magnetic properties
Future Direction
• Demonstrate the feasibility of competitive factory operation by fabricating and operating a reciprocating press in continuous-mode operation
• For cost-effective, near-final-shape magnets, completely identify the improvements that can be gained in engineering and microscopic magnet properties by alignment and pressing of powder in the higher magnetic fields of the 9-T superconducting solenoid
• Provide design rules for the fabrication of PMs, including knowledge related to scale-up to larger magnets at commercial rates of production
Introduction
More than 250 NdFeB compacts were pressed this year in Argonne’s batch-mode axial-die press facility. The facility includes a 9-T superconducting solenoid, which can produce alignment fields that significantly exceed those of the 2-T electromagnets used by industries. (The Argonne facility was completed in the fourth quarter of 2000.) Production-grade magnet powder was obtained from Magnequench UG. The 3- to 5-micron, single-crystal grains of powder were aligned in the same direction and compacted at Argonne. Then anisotropic compacts, with their grains mechanically locked in place, were returned to Magnequench UG for sintering, annealing, machining, and measurement of engineering magnetic properties. Finally, selected PMs were sent to Oak Ridge National Laboratory (ORNL) for measurement of microscopic properties and texture (the alignment of the crystals’ easy magnetic axes). The better the alignment, the greater is the energy product.
Industry considers an improvement of 2-3% in the magnetic properties of today’s PMs as significant. The properties of current PMs can be brought to within 5-25% of their theoretical maximums. The strength of the magnet depends for the most part on the method by which the compact is aligned and pressed. Large blocks within 5% of their theoretical maximum can be made by cold-isostatic pressing, but then the blocks
must be sliced, diced, and ground to final shape. Machining operations add significantly to the cost of magnets. Magnets that are axial-die pressed and sintered to near-final shape have magnetic properties farthest from their theoretical maximums, but they are the least expensive to make. The current industry goal is to make better near-final-shape magnets by axial-die pressing.
Even cheaper isotropic magnets can be made if the grain alignment step is eliminated. But they have, at most, one-fourth the energy product of orientated, anisotropic magnets. If lower-energy products are acceptable, then hot-formed or bonded isotropic magnets are a more cost-effective alternative.
Results
The first PMs made in the fourth quarter of 2000 had properties that were far from optimal. Thus, a significant effort was made, in cooperation with our industrial partner, to optimize processing at Argonne. Different press loads, press rates, lubricants, and powder-fill techniques were studied. Argonne learned that a lower fill density than can be achieved by gravity pouring is necessary to produce the best magnetic properties.
The results of the fill-density optimization study for cylindrical compacts with a length-to-diameter ratio
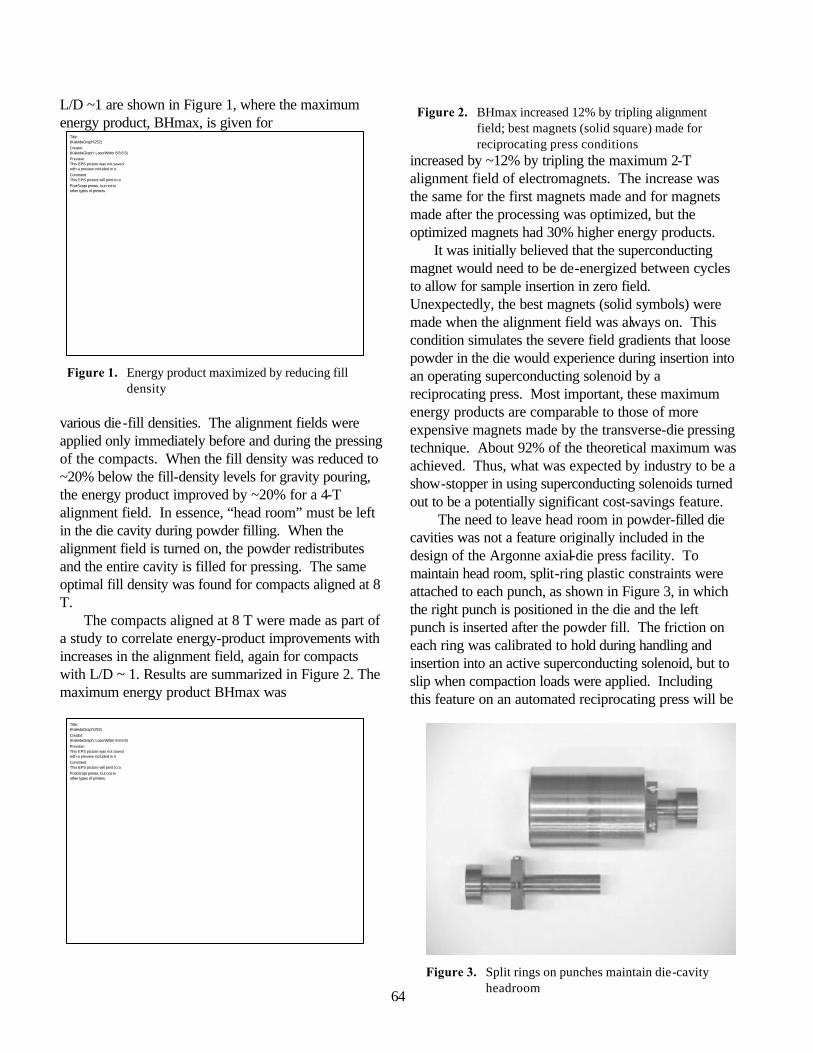
64
L/D ~1 are shown in Figure 1, where the maximum energy product, BHmax, is given for
Title:(KaleidaGraph\252)Creator:(KaleidaGraph: LaserWriter 8 8.6.5)Preview:This EPS picture was not savedwith a preview included in it.Comment:This EPS picture will print to aPostScript printer, but not toother types of printers.
Figure 1. Energy product maximized by reducing fill
density
various die-fill densities. The alignment fields were applied only immediately before and during the pressing of the compacts. When the fill density was reduced to ~20% below the fill-density levels for gravity pouring, the energy product improved by ~20% for a 4-T alignment field. In essence, “head room” must be left in the die cavity during powder filling. When the alignment field is turned on, the powder redistributes and the entire cavity is filled for pressing. The same optimal fill density was found for compacts aligned at 8 T.
The compacts aligned at 8 T were made as part of a study to correlate energy-product improvements with increases in the alignment field, again for compacts with L/D ~ 1. Results are summarized in Figure 2. The maximum energy product BHmax was
Title:(KaleidaGraph\252)Creator:(KaleidaGraph: LaserWriter 8 8.6.5)Preview:This EPS picture was not savedwith a preview included in it.Comment:This EPS picture will print to aPostScript printer, but not toother types of printers.
Figure 2. BHmax increased 12% by tripling alignment field; best magnets (solid square) made for reciprocating press conditions
increased by ~12% by tripling the maximum 2-T alignment field of electromagnets. The increase was the same for the first magnets made and for magnets made after the processing was optimized, but the optimized magnets had 30% higher energy products.
It was initially believed that the superconducting magnet would need to be de-energized between cycles to allow for sample insertion in zero field. Unexpectedly, the best magnets (solid symbols) were made when the alignment field was always on. This condition simulates the severe field gradients that loose powder in the die would experience during insertion into an operating superconducting solenoid by a reciprocating press. Most important, these maximum energy products are comparable to those of more expensive magnets made by the transverse-die pressing technique. About 92% of the theoretical maximum was achieved. Thus, what was expected by industry to be a show-stopper in using superconducting solenoids turned out to be a potentially significant cost-savings feature.
The need to leave head room in powder-filled die cavities was not a feature originally included in the design of the Argonne axial-die press facility. To maintain head room, split-ring plastic constraints were attached to each punch, as shown in Figure 3, in which the right punch is positioned in the die and the left punch is inserted after the powder fill. The friction on each ring was calibrated to hold during handling and insertion into an active superconducting solenoid, but to slip when compaction loads were applied. Including this feature on an automated reciprocating press will be
Figure 3. Split rings on punches maintain die-cavity headroom
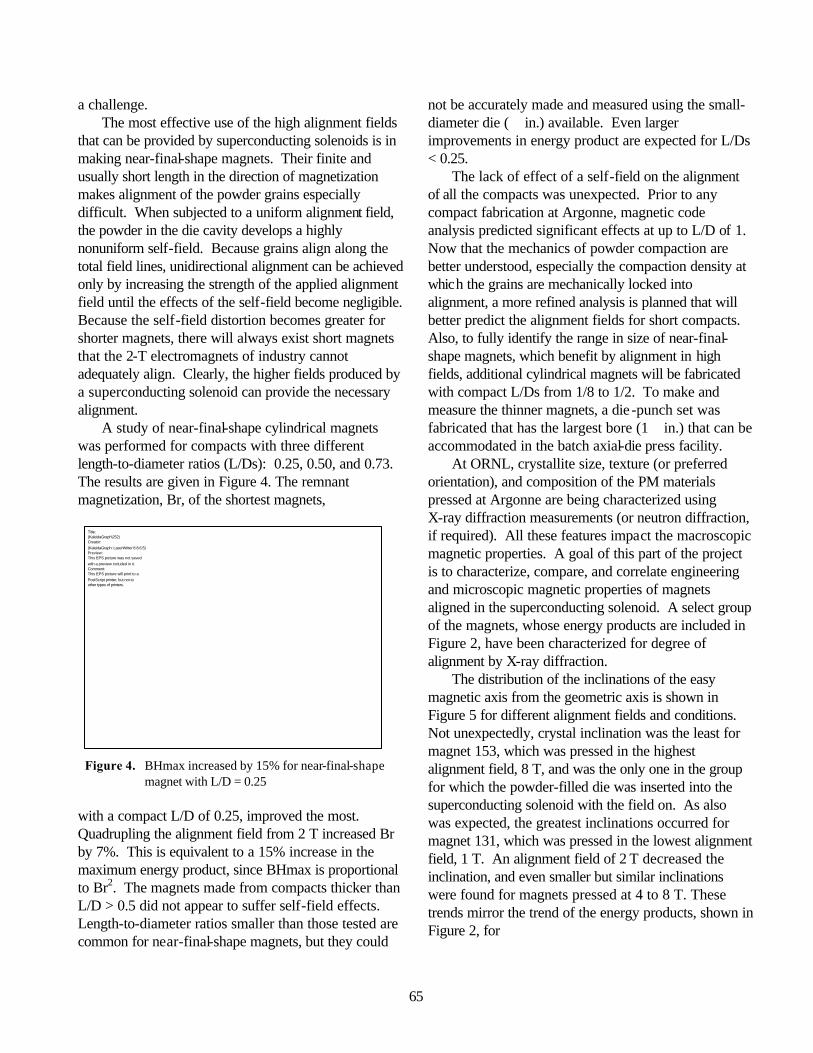
65
a challenge. The most effective use of the high alignment fields
that can be provided by superconducting solenoids is in making near-final-shape magnets. Their finite and usually short length in the direction of magnetization makes alignment of the powder grains especially difficult. When subjected to a uniform alignment field, the powder in the die cavity develops a highly nonuniform self-field. Because grains align along the total field lines, unidirectional alignment can be achieved only by increasing the strength of the applied alignment field until the effects of the self-field become negligible. Because the self-field distortion becomes greater for shorter magnets, there will always exist short magnets that the 2-T electromagnets of industry cannot adequately align. Clearly, the higher fields produced by a superconducting solenoid can provide the necessary alignment.
A study of near-final-shape cylindrical magnets was performed for compacts with three different length-to-diameter ratios (L/Ds): 0.25, 0.50, and 0.73. The results are given in Figure 4. The remnant magnetization, Br, of the shortest magnets,
Title:(KaleidaGraph\252)Creator:(KaleidaGraph: LaserWriter 8 8.6.5)Preview:This EPS picture was not savedwith a preview included in it.Comment:This EPS picture will print to aPostScript printer, but not toother types of printers.
Figure 4. BHmax increased by 15% for near-final-shape
magnet with L/D = 0.25
with a compact L/D of 0.25, improved the most. Quadrupling the alignment field from 2 T increased Br by 7%. This is equivalent to a 15% increase in the maximum energy product, since BHmax is proportional to Br2. The magnets made from compacts thicker than L/D > 0.5 did not appear to suffer self-field effects. Length-to-diameter ratios smaller than those tested are common for near-final-shape magnets, but they could
not be accurately made and measured using the small-diameter die ( in.) available. Even larger improvements in energy product are expected for L/Ds < 0.25.
The lack of effect of a self-field on the alignment of all the compacts was unexpected. Prior to any compact fabrication at Argonne, magnetic code analysis predicted significant effects at up to L/D of 1. Now that the mechanics of powder compaction are better understood, especially the compaction density at which the grains are mechanically locked into alignment, a more refined analysis is planned that will better predict the alignment fields for short compacts. Also, to fully identify the range in size of near-final-shape magnets, which benefit by alignment in high fields, additional cylindrical magnets will be fabricated with compact L/Ds from 1/8 to 1/2. To make and measure the thinner magnets, a die -punch set was fabricated that has the largest bore (1 in.) that can be accommodated in the batch axial-die press facility.
At ORNL, crystallite size, texture (or preferred orientation), and composition of the PM materials pressed at Argonne are being characterized using X-ray diffraction measurements (or neutron diffraction, if required). All these features impact the macroscopic magnetic properties. A goal of this part of the project is to characterize, compare, and correlate engineering and microscopic magnetic properties of magnets aligned in the superconducting solenoid. A select group of the magnets, whose energy products are included in Figure 2, have been characterized for degree of alignment by X-ray diffraction.
The distribution of the inclinations of the easy magnetic axis from the geometric axis is shown in Figure 5 for different alignment fields and conditions. Not unexpectedly, crystal inclination was the least for magnet 153, which was pressed in the highest alignment field, 8 T, and was the only one in the group for which the powder-filled die was inserted into the superconducting solenoid with the field on. As also was expected, the greatest inclinations occurred for magnet 131, which was pressed in the lowest alignment field, 1 T. An alignment field of 2 T decreased the inclination, and even smaller but similar inclinations were found for magnets pressed at 4 to 8 T. These trends mirror the trend of the energy products, shown in Figure 2, for
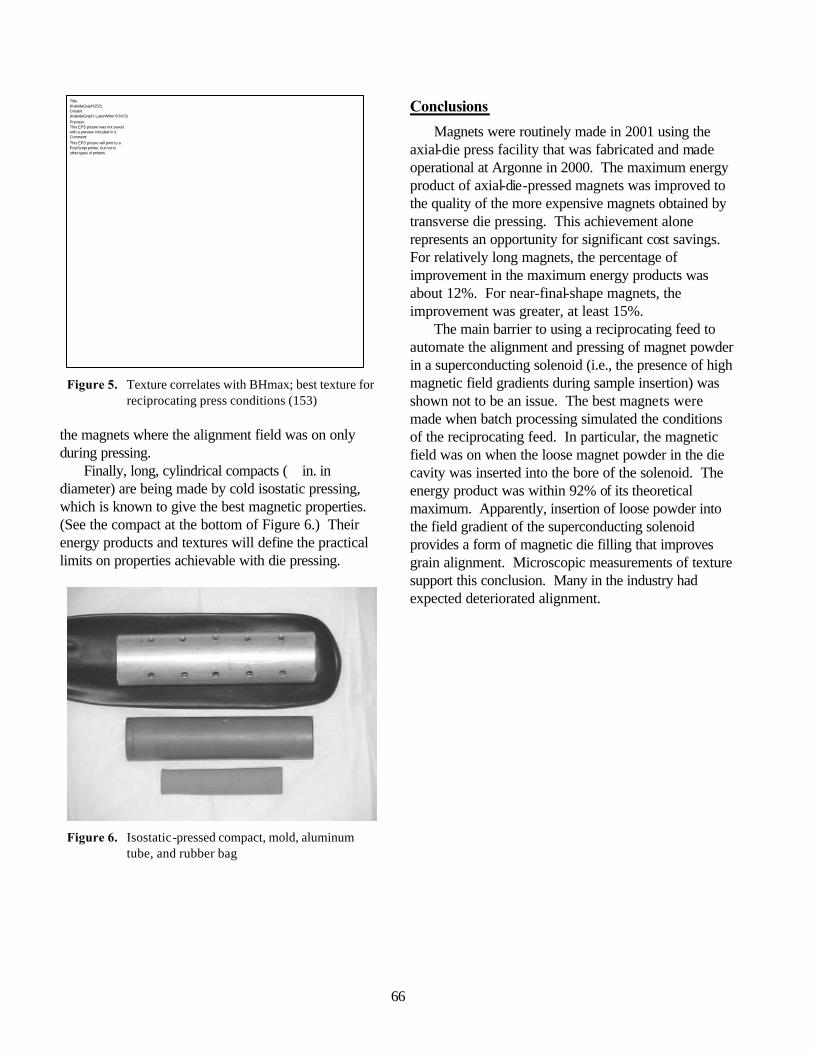
66
Title:(KaleidaGraph\252)Creator:(KaleidaGraph: LaserWriter 8 8.6.5)Preview:This EPS picture was not savedwith a preview included in it.Comment:This EPS picture will print to aPostScript printer, but not toother types of printers.
Figure 5. Texture correlates with BHmax; best texture for
reciprocating press conditions (153)
the magnets where the alignment field was on only during pressing.
Finally, long, cylindrical compacts ( in. in diameter) are being made by cold isostatic pressing, which is known to give the best magnetic properties. (See the compact at the bottom of Figure 6.) Their energy products and textures will define the practical limits on properties achievable with die pressing.
Figure 6. Isostatic-pressed compact, mold, aluminum tube, and rubber bag
Conclusions
Magnets were routinely made in 2001 using the axial-die press facility that was fabricated and made operational at Argonne in 2000. The maximum energy product of axial-die-pressed magnets was improved to the quality of the more expensive magnets obtained by transverse die pressing. This achievement alone represents an opportunity for significant cost savings. For relatively long magnets, the percentage of improvement in the maximum energy products was about 12%. For near-final-shape magnets, the improvement was greater, at least 15%.
The main barrier to using a reciprocating feed to automate the alignment and pressing of magnet powder in a superconducting solenoid (i.e., the presence of high magnetic field gradients during sample insertion) was shown not to be an issue. The best magnets were made when batch processing simulated the conditions of the reciprocating feed. In particular, the magnetic field was on when the loose magnet powder in the die cavity was inserted into the bore of the solenoid. The energy product was within 92% of its theoretical maximum. Apparently, insertion of loose powder into the field gradient of the superconducting solenoid provides a form of magnetic die filling that improves grain alignment. Microscopic measurements of texture support this conclusion. Many in the industry had expected deteriorated alignment.
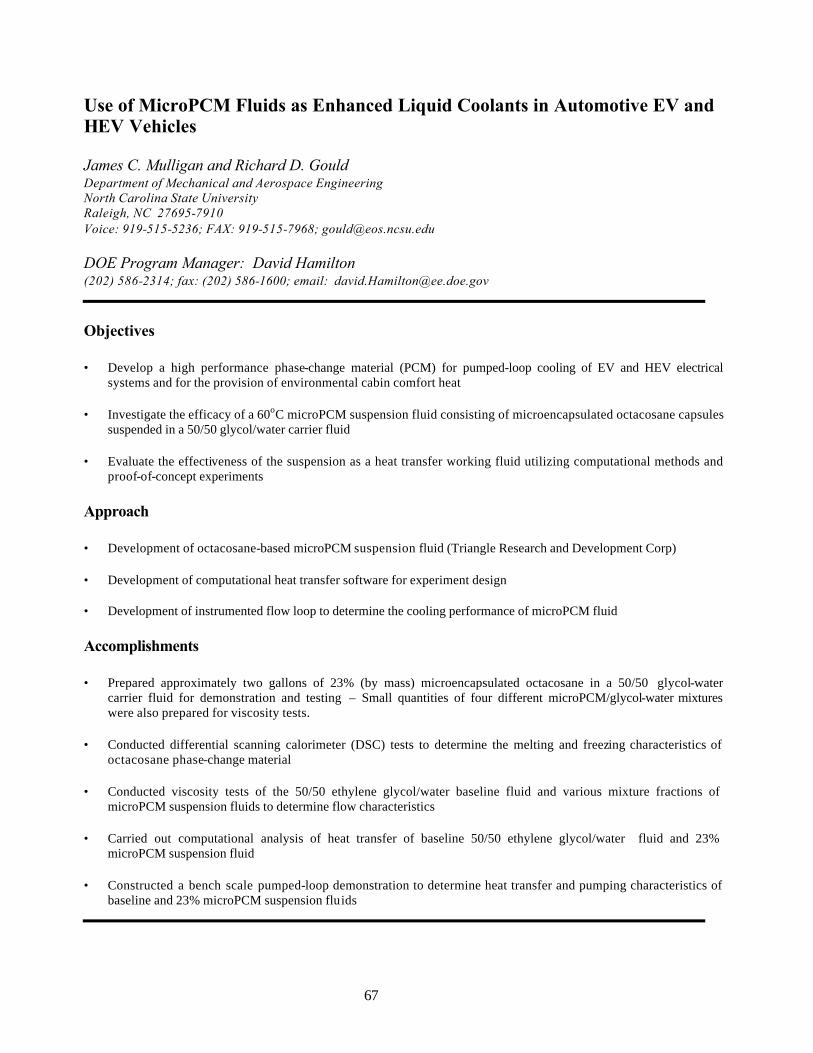
67
Use of MicroPCM Fluids as Enhanced Liquid Coolants in Automotive EV and HEV Vehicles James C. Mulligan and Richard D. Gould Department of Mechanical and Aerospace Engineering North Carolina State University Raleigh, NC 27695-7910 Voice: 919-515-5236; FAX: 919-515-7968; [email protected] DOE Program Manager: David Hamilton (202) 586-2314; fax: (202) 586-1600; email: [email protected]
Objectives • Develop a high performance phase-change material (PCM) for pumped-loop cooling of EV and HEV electrical
systems and for the provision of environmental cabin comfort heat
• Investigate the efficacy of a 60oC microPCM suspension fluid consisting of microencapsulated octacosane capsules suspended in a 50/50 glycol/water carrier fluid
• Evaluate the effectiveness of the suspension as a heat transfer working fluid utilizing computational methods and
proof-of-concept experiments Approach • Development of octacosane-based microPCM suspension fluid (Triangle Research and Development Corp) • Development of computational heat transfer software for experiment design • Development of instrumented flow loop to determine the cooling performance of microPCM fluid Accomplishments • Prepared approximately two gallons of 23% (by mass) microencapsulated octacosane in a 50/50 glycol-water
carrier fluid for demonstration and testing – Small quantities of four different microPCM/glycol-water mixtures were also prepared for viscosity tests.
• Conducted differential scanning calorimeter (DSC) tests to determine the melting and freezing characteristics of
octacosane phase-change material
• Conducted viscosity tests of the 50/50 ethylene glycol/water baseline fluid and various mixture fractions of microPCM suspension fluids to determine flow characteristics
• Carried out computational analysis of heat transfer of baseline 50/50 ethylene glycol/water fluid and 23%
microPCM suspension fluid
• Constructed a bench scale pumped-loop demonstration to determine heat transfer and pumping characteristics of baseline and 23% microPCM suspension fluids
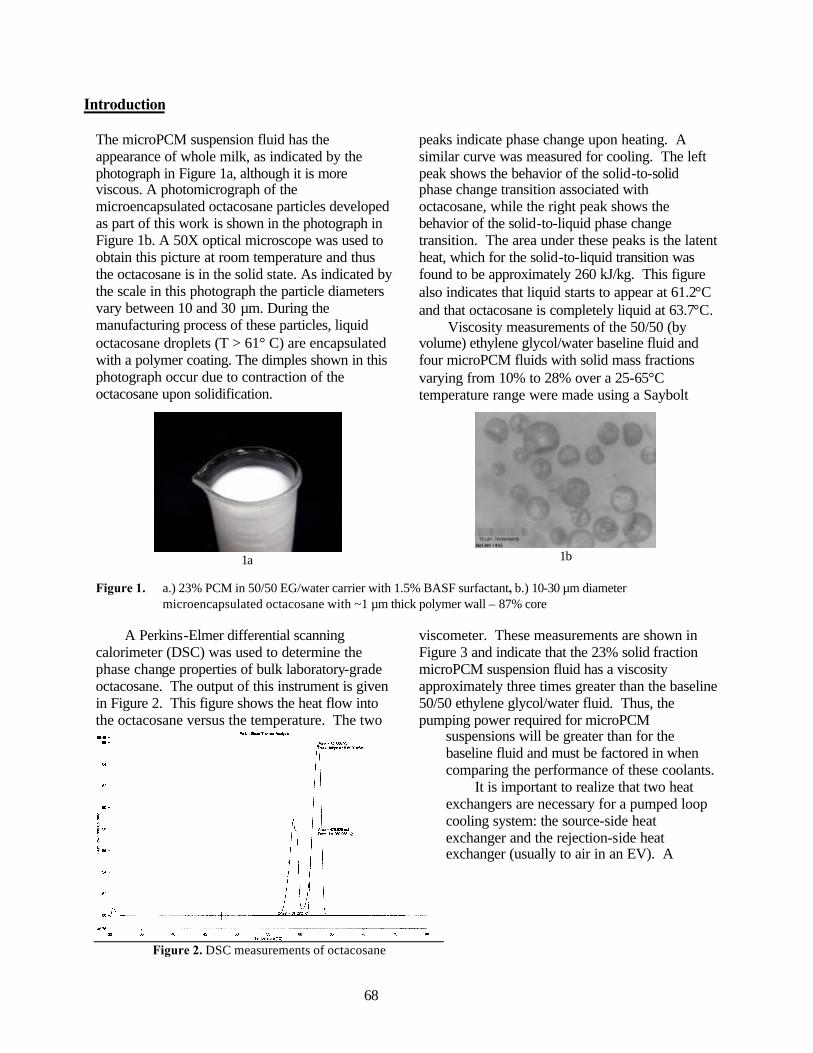
68
Introduction
The microPCM suspension fluid has the appearance of whole milk, as indicated by the photograph in Figure 1a, although it is more viscous. A photomicrograph of the microencapsulated octacosane particles developed as part of this work is shown in the photograph in Figure 1b. A 50X optical microscope was used to obtain this picture at room temperature and thus the octacosane is in the solid state. As indicated by the scale in this photograph the particle diameters vary between 10 and 30 µm. During the manufacturing process of these particles, liquid octacosane droplets (T > 61° C) are encapsulated with a polymer coating. The dimples shown in this photograph occur due to contraction of the octacosane upon solidification.
A Perkins-Elmer differential scanning calorimeter (DSC) was used to determine the phase change properties of bulk laboratory-grade octacosane. The output of this instrument is given in Figure 2. This figure shows the heat flow into the octacosane versus the temperature. The two
peaks indicate phase change upon heating. A similar curve was measured for cooling. The left peak shows the behavior of the solid-to-solid phase change transition associated with octacosane, while the right peak shows the behavior of the solid-to-liquid phase change transition. The area under these peaks is the latent heat, which for the solid-to-liquid transition was found to be approximately 260 kJ/kg. This figure also indicates that liquid starts to appear at 61.2°C and that octacosane is completely liquid at 63.7°C.
Viscosity measurements of the 50/50 (by volume) ethylene glycol/water baseline fluid and four microPCM fluids with solid mass fractions varying from 10% to 28% over a 25-65°C temperature range were made using a Saybolt
viscometer. These measurements are shown in Figure 3 and indicate that the 23% solid fraction microPCM suspension fluid has a viscosity approximately three times greater than the baseline 50/50 ethylene glycol/water fluid. Thus, the pumping power required for microPCM
suspensions will be greater than for the baseline fluid and must be factored in when comparing the performance of these coolants.
It is important to realize that two heat exchangers are necessary for a pumped loop cooling system: the source-side heat exchanger and the rejection-side heat exchanger (usually to air in an EV). A
1a
1b
Figure 1. a.) 23% PCM in 50/50 EG/water carrier with 1.5% BASF surfactant, b.) 10-30 µm diameter microencapsulated octacosane with ~1 µm thick polymer wall – 87% core
Figure 2. DSC measurements of octacosane
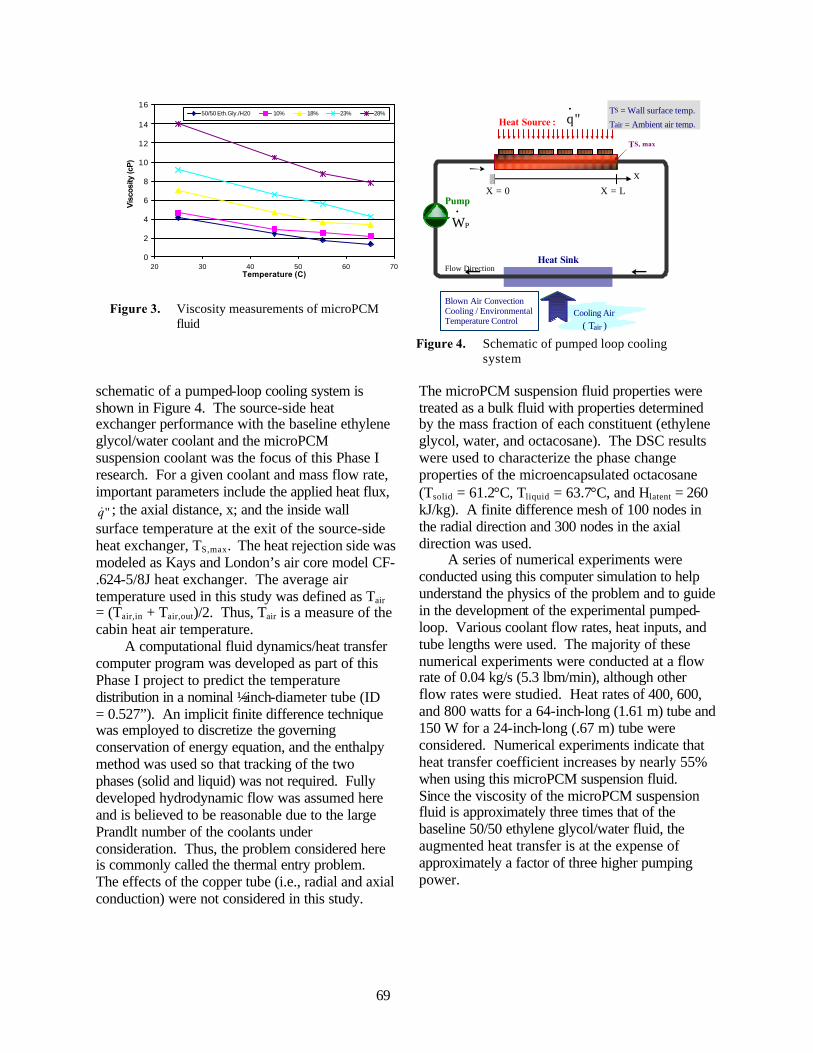
69
schematic of a pumped-loop cooling system is shown in Figure 4. The source-side heat exchanger performance with the baseline ethylene glycol/water coolant and the microPCM suspension coolant was the focus of this Phase I research. For a given coolant and mass flow rate, important parameters include the applied heat flux,
"q& ; the axial distance, x; and the inside wall surface temperature at the exit of the source-side heat exchanger, TS,max. The heat rejection side was modeled as Kays and London’s air core model CF-.624-5/8J heat exchanger. The average air temperature used in this study was defined as Tair = (Tair,in + Tair,out)/2. Thus, Tair is a measure of the cabin heat air temperature.
A computational fluid dynamics/heat transfer computer program was developed as part of this Phase I project to predict the temperature distribution in a nominal ½-inch-diameter tube (ID = 0.527”). An implicit finite difference technique was employed to discretize the governing conservation of energy equation, and the enthalpy method was used so that tracking of the two phases (solid and liquid) was not required. Fully developed hydrodynamic flow was assumed here and is believed to be reasonable due to the large Prandlt number of the coolants under consideration. Thus, the problem considered here is commonly called the thermal entry problem. The effects of the copper tube (i.e., radial and axial conduction) were not considered in this study.
The microPCM suspension fluid properties were treated as a bulk fluid with properties determined by the mass fraction of each constituent (ethylene glycol, water, and octacosane). The DSC results were used to characterize the phase change properties of the microencapsulated octacosane (Tsolid = 61.2°C, Tliquid = 63.7°C, and Hlatent = 260 kJ/kg). A finite difference mesh of 100 nodes in the radial direction and 300 nodes in the axial direction was used.
A series of numerical experiments were conducted using this computer simulation to help understand the physics of the problem and to guide in the development of the experimental pumped-loop. Various coolant flow rates, heat inputs, and tube lengths were used. The majority of these numerical experiments were conducted at a flow rate of 0.04 kg/s (5.3 lbm/min), although other flow rates were studied. Heat rates of 400, 600, and 800 watts for a 64-inch-long (1.61 m) tube and 150 W for a 24-inch-long (.67 m) tube were considered. Numerical experiments indicate that heat transfer coefficient increases by nearly 55% when using this microPCM suspension fluid. Since the viscosity of the microPCM suspension fluid is approximately three times that of the baseline 50/50 ethylene glycol/water fluid, the augmented heat transfer is at the expense of approximately a factor of three higher pumping power.
0
2
4
6
8
10
12
14
16
20 30 40 50 60 70Temperature (C)
Vis
cosi
ty (c
P)
50/50 Eth.Gly./H20 10% 18% 23% 28%
Figure 3. Viscosity measurements of microPCM
fluid
X
Flow Direction
Heat Source :
Heat Sink
Cooling Air
( Tair )
PW•
"q
•
Pump
TS, max
X = 0 X = L
Blown Air ConvectionCooling / EnvironmentalTemperature Control
TS = Wall surface temp.
Tair = Ambient air temp.
Figure 4. Schematic of pumped loop cooling
system
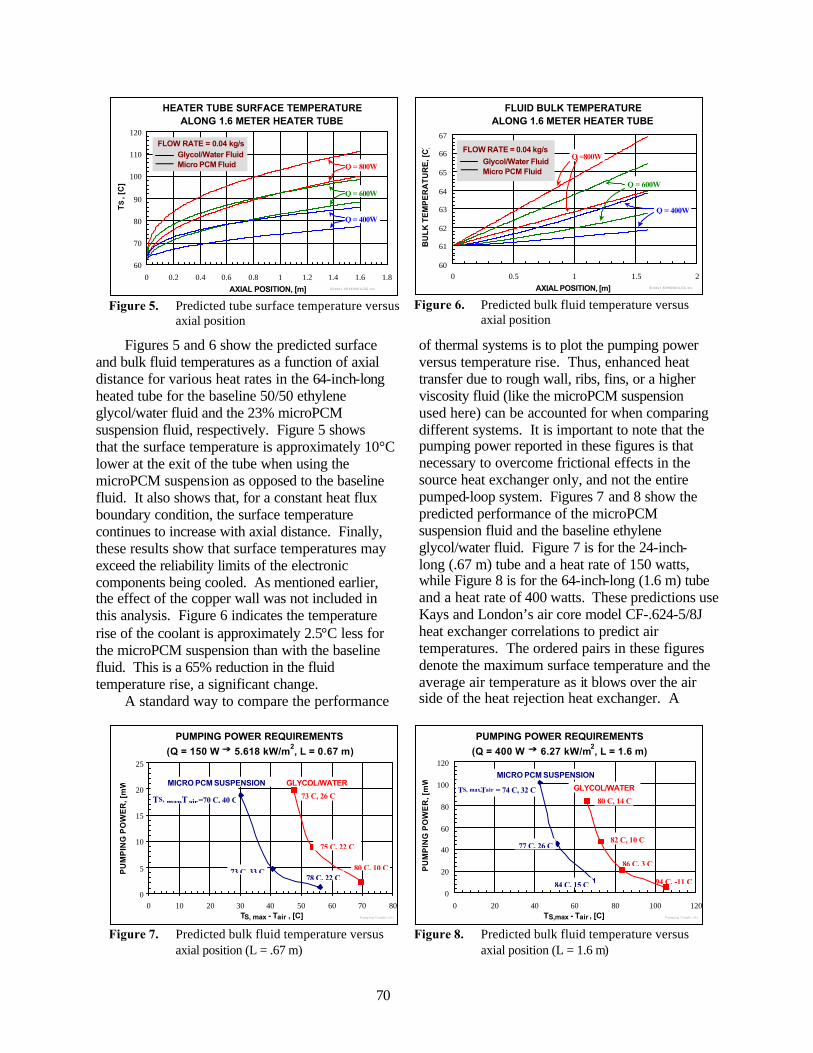
70
Figures 5 and 6 show the predicted surface and bulk fluid temperatures as a function of axial distance for various heat rates in the 64-inch-long heated tube for the baseline 50/50 ethylene glycol/water fluid and the 23% microPCM suspension fluid, respectively. Figure 5 shows that the surface temperature is approximately 10°C lower at the exit of the tube when using the microPCM suspension as opposed to the baseline fluid. It also shows that, for a constant heat flux boundary condition, the surface temperature continues to increase with axial distance. Finally, these results show that surface temperatures may exceed the reliability limits of the electronic components being cooled. As mentioned earlier, the effect of the copper wall was not included in this analysis. Figure 6 indicates the temperature rise of the coolant is approximately 2.5°C less for the microPCM suspension than with the baseline fluid. This is a 65% reduction in the fluid temperature rise, a significant change.
A standard way to compare the performance
of thermal systems is to plot the pumping power versus temperature rise. Thus, enhanced heat transfer due to rough wall, ribs, fins, or a higher viscosity fluid (like the microPCM suspension used here) can be accounted for when comparing different systems. It is important to note that the pumping power reported in these figures is that necessary to overcome frictional effects in the source heat exchanger only, and not the entire pumped-loop system. Figures 7 and 8 show the predicted performance of the microPCM suspension fluid and the baseline ethylene glycol/water fluid. Figure 7 is for the 24-inch-long (.67 m) tube and a heat rate of 150 watts, while Figure 8 is for the 64-inch-long (1.6 m) tube and a heat rate of 400 watts. These predictions use Kays and London’s air core model CF-.624-5/8J heat exchanger correlations to predict air temperatures. The ordered pairs in these figures denote the maximum surface temperature and the average air temperature as it blows over the air side of the heat rejection heat exchanger. A
HEATER TUBE SURFACE TEMPERATURE ALONG 1.6 METER HEATER TUBE
60
70
80
90
100
110
120
0 0.2 0.4 0.6 0.8 1 1.2 1.4 1.6 1.8
AXIAL POSITION, [m]
TS
, [C
]
Q = 800W
S l i d e s 1 . 6 0 4 8 0 0 6 1 L O G . x l s
Glycol/Water FluidMicro PCM Fluid
Q = 600W
Q = 400W
FLOW RATE = 0.04 kg/s
Figure 5. Predicted tube surface temperature versus
axial position
FLUID BULK TEMPERATURE ALONG 1.6 METER HEATER TUBE
60
61
62
63
64
65
66
67
0 0.5 1 1.5 2
AXIAL POSITION, [m]
BU
LK
TE
MP
ER
AT
UR
E, [
C]
Q =800W
Q = 600W
Q = 400W
FLOW RATE = 0.04 kg/s
S l i de s1 .60480061LOG.x l s
Glycol/Water FluidMicro PCM Fluid
Figure 6. Predicted bulk fluid temperature versus
axial position
PUMPING POWER REQUIREMENTS
(Q = 150 W gg 5.618 kW/m2, L = 0.67 m)
0
5
10
15
20
25
0 10 20 30 40 50 60 70 80TS, max - Tair , [C]
PU
MP
ING
PO
WE
R, [
mW
]
GLYCOL/WATERMICRO PCM SUSPENSION
73 C, 33 C78 C, 22 C
73 C, 26 C
75 C, 22 C
80 C, 10 C
TS, max,Tair =70 C, 40 C
P u m p i n g G r a p h s . x l s Figure 7. Predicted bulk fluid temperature versus
axial position (L = .67 m)
PUMPING POWER REQUIREMENTS
(Q = 400 W gg 6.27 kW/m2, L = 1.6 m)
0
20
40
60
80
100
120
0 20 40 60 80 100 120TS,max - Tair , [C]
PU
MP
ING
PO
WE
R, [
mW
]
80 C, 14 C
82 C, 10 C
86 C, 3 C
94 C, -11 C
TS, max,Tair = 74 C, 32 C
77 C, 26 C
84 C, 15 C
MICRO PCM SUSPENSION
GLYCOL/WATER
P u m p i n g G r a p h s . x l s Figure 8. Predicted bulk fluid temperature versus
axial position (L = 1.6 m)
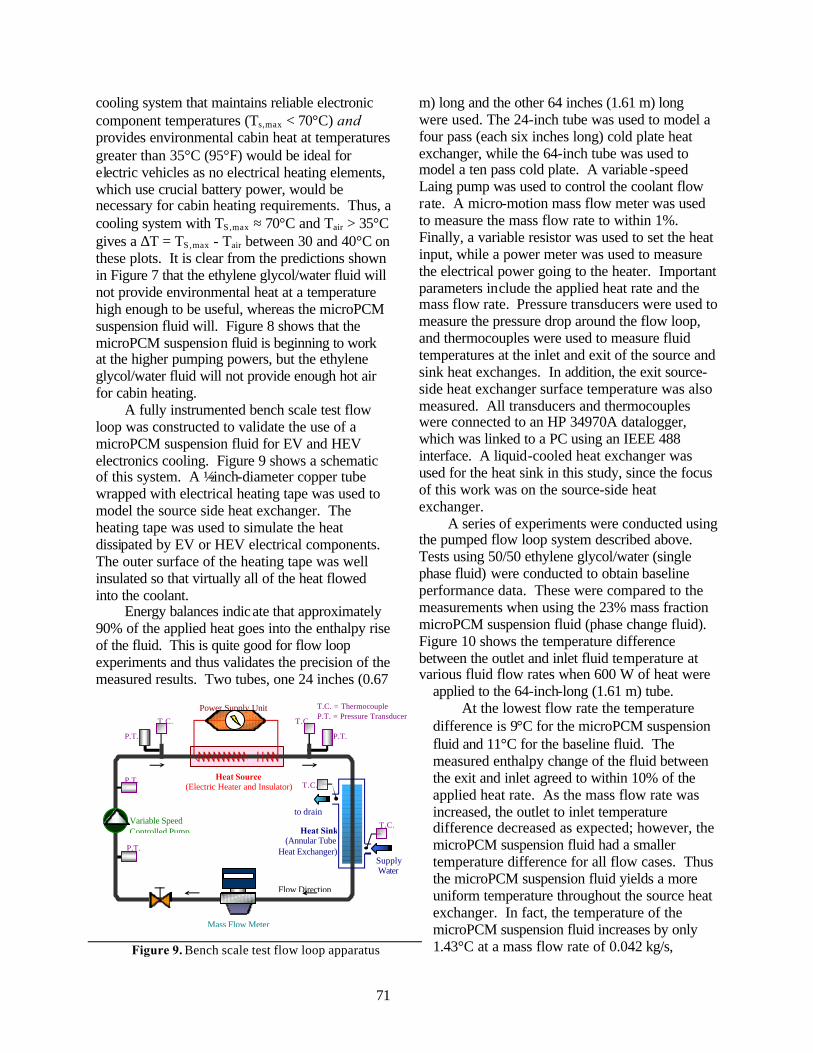
71
cooling system that maintains reliable electronic component temperatures (Ts,max < 70°C) and provides environmental cabin heat at temperatures greater than 35°C (95°F) would be ideal for electric vehicles as no electrical heating elements, which use crucial battery power, would be necessary for cabin heating requirements. Thus, a cooling system with TS,max ≈ 70°C and Tair > 35°C gives a ∆T = TS,max - Tair between 30 and 40°C on these plots. It is clear from the predictions shown in Figure 7 that the ethylene glycol/water fluid will not provide environmental heat at a temperature high enough to be useful, whereas the microPCM suspension fluid will. Figure 8 shows that the microPCM suspension fluid is beginning to work at the higher pumping powers, but the ethylene glycol/water fluid will not provide enough hot air for cabin heating.
A fully instrumented bench scale test flow loop was constructed to validate the use of a microPCM suspension fluid for EV and HEV electronics cooling. Figure 9 shows a schematic of this system. A ½-inch-diameter copper tube wrapped with electrical heating tape was used to model the source side heat exchanger. The heating tape was used to simulate the heat dissipated by EV or HEV electrical components. The outer surface of the heating tape was well insulated so that virtually all of the heat flowed into the coolant.
Energy balances indicate that approximately 90% of the applied heat goes into the enthalpy rise of the fluid. This is quite good for flow loop experiments and thus validates the precision of the measured results. Two tubes, one 24 inches (0.67
m) long and the other 64 inches (1.61 m) long were used. The 24-inch tube was used to model a four pass (each six inches long) cold plate heat exchanger, while the 64-inch tube was used to model a ten pass cold plate. A variable -speed Laing pump was used to control the coolant flow rate. A micro-motion mass flow meter was used to measure the mass flow rate to within 1%. Finally, a variable resistor was used to set the heat input, while a power meter was used to measure the electrical power going to the heater. Important parameters include the applied heat rate and the mass flow rate. Pressure transducers were used to measure the pressure drop around the flow loop, and thermocouples were used to measure fluid temperatures at the inlet and exit of the source and sink heat exchanges. In addition, the exit source-side heat exchanger surface temperature was also measured. All transducers and thermocouples were connected to an HP 34970A datalogger, which was linked to a PC using an IEEE 488 interface. A liquid-cooled heat exchanger was used for the heat sink in this study, since the focus of this work was on the source-side heat exchanger.
A series of experiments were conducted using the pumped flow loop system described above. Tests using 50/50 ethylene glycol/water (single phase fluid) were conducted to obtain baseline performance data. These were compared to the measurements when using the 23% mass fraction microPCM suspension fluid (phase change fluid). Figure 10 shows the temperature difference between the outlet and inlet fluid temperature at various fluid flow rates when 600 W of heat were
applied to the 64-inch-long (1.61 m) tube. At the lowest flow rate the temperature
difference is 9°C for the microPCM suspension fluid and 11°C for the baseline fluid. The measured enthalpy change of the fluid between the exit and inlet agreed to within 10% of the applied heat rate. As the mass flow rate was increased, the outlet to inlet temperature difference decreased as expected; however, the microPCM suspension fluid had a smaller temperature difference for all flow cases. Thus the microPCM suspension fluid yields a more uniform temperature throughout the source heat exchanger. In fact, the temperature of the microPCM suspension fluid increases by only 1.43°C at a mass flow rate of 0.042 kg/s,
Flow Direction
Heat Source(Electric Heater and Insulator)
Variable SpeedControlled Pump
T.C.
T.C.
Heat Sink(Annular Tube
Heat Exchanger)SupplyWater
Power Supply Unit
P.T.
T.C.T.C.
P.T.
P.T.
P.T.
to drain
Mass Flow Meter
T.C. = ThermocoupleP.T. = Pressure Transducer
Figure 9. Bench scale test flow loop apparatus
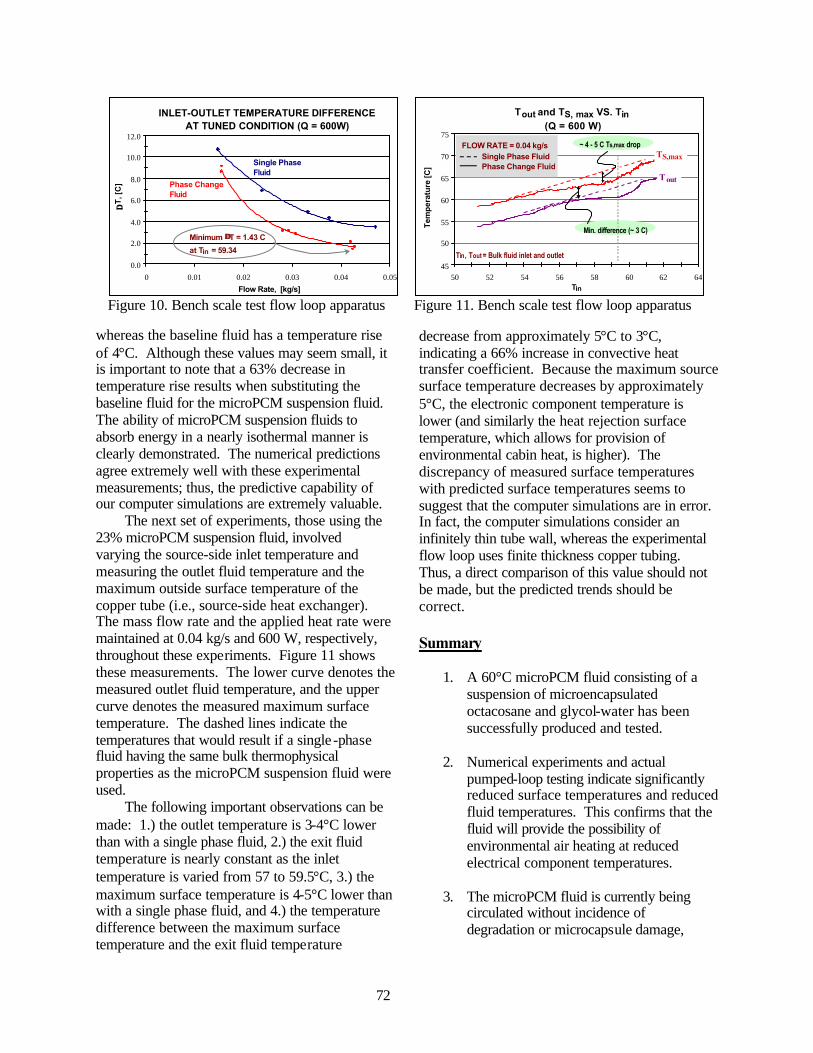
72
whereas the baseline fluid has a temperature rise of 4°C. Although these values may seem small, it is important to note that a 63% decrease in temperature rise results when substituting the baseline fluid for the microPCM suspension fluid. The ability of microPCM suspension fluids to absorb energy in a nearly isothermal manner is clearly demonstrated. The numerical predictions agree extremely well with these experimental measurements; thus, the predictive capability of our computer simulations are extremely valuable.
The next set of experiments, those using the 23% microPCM suspension fluid, involved varying the source-side inlet temperature and measuring the outlet fluid temperature and the maximum outside surface temperature of the copper tube (i.e., source-side heat exchanger). The mass flow rate and the applied heat rate were maintained at 0.04 kg/s and 600 W, respectively, throughout these experiments. Figure 11 shows these measurements. The lower curve denotes the measured outlet fluid temperature, and the upper curve denotes the measured maximum surface temperature. The dashed lines indicate the temperatures that would result if a single -phase fluid having the same bulk thermophysical properties as the microPCM suspension fluid were used.
The following important observations can be made: 1.) the outlet temperature is 3-4°C lower than with a single phase fluid, 2.) the exit fluid temperature is nearly constant as the inlet temperature is varied from 57 to 59.5°C, 3.) the maximum surface temperature is 4-5°C lower than with a single phase fluid, and 4.) the temperature difference between the maximum surface temperature and the exit fluid temperature
decrease from approximately 5°C to 3°C, indicating a 66% increase in convective heat transfer coefficient. Because the maximum source surface temperature decreases by approximately 5°C, the electronic component temperature is lower (and similarly the heat rejection surface temperature, which allows for provision of environmental cabin heat, is higher). The discrepancy of measured surface temperatures with predicted surface temperatures seems to suggest that the computer simulations are in error. In fact, the computer simulations consider an infinitely thin tube wall, whereas the experimental flow loop uses finite thickness copper tubing. Thus, a direct comparison of this value should not be made, but the predicted trends should be correct. Summary
1. A 60°C microPCM fluid consisting of a suspension of microencapsulated octacosane and glycol-water has been successfully produced and tested.
2. Numerical experiments and actual
pumped-loop testing indicate significantly reduced surface temperatures and reduced fluid temperatures. This confirms that the fluid will provide the possibility of environmental air heating at reduced electrical component temperatures.
3. The microPCM fluid is currently being
circulated without incidence of degradation or microcapsule damage,
INLET-OUTLET TEMPERATURE DIFFERENCE AT TUNED CONDITION (Q = 600W)
0.0
2.0
4.0
6.0
8.0
10.0
12.0
0 0.01 0.02 0.03 0.04 0.05
Flow Rate, [kg/s]
∆∆T
, [C
]
Minimum ∆∆T = 1.43 C
at Tin = 59.34
Single Phase Fluid
Phase Change Fluid
Figure 10. Bench scale test flow loop apparatus
Tout and TS, max VS. Tin(Q = 600 W)
45
50
55
60
65
70
75
50 52 54 56 58 60 62 64Tin
Tem
per
atu
re [C
]
TS,max
Tout
FLOW RATE = 0.04 kg/s Single Phase FluidPhase Change Fluid
Tin, Tout = Bulk fluid inlet and outlet temp.
~ 4 - 5 C Ts,max drop
Min. difference (~ 3 C)
Figure 11. Bench scale test flow loop apparatus
73
which can occur due to pumping stress and/or expansion and contraction fatigue.
4. The numerical experiments indicate the
fluid is a possible option for electric systems which need to be maintained below 70°C and which are the source of 35°C heat for environmental temperature control.
In summary, the octacosane-based microPCM
suspension fluid developed in this study accomplishes the dual technology goals of cooling EV electronic components and provision of environmental cabin heat. The major barriers to its adoption in EV and HEV cooling systems are cost and long-term durability. The small quantity cost of the octacosane-based microPCM suspension fluid developed here was approximately $630/gallon. It is believed that the prices will drop for large quantity purchases to approximately $9-12/gal for technical grade octacosane and to $10-17/gal for microencapsulation. This corresponds to approximately $19-29/gal for a technical grade octacosane-based microPCM suspension fluid. We have recently found a low-cost alternative to octacosane called Polywax polyethylenes. It is currently produced in large quantities and costs approximately $2/gal. A Polywax-based microPCM suspension produced in large quantities would cost approximately $12-19/gal. which we believe makes this suspension economically viable for large scale EV and HEV usage.
Future directions
Development of a low-cost microPCM
suspension fluid and long term durability studies will be the primary goal of future work. The goal is to develop a Polywax-based microPCM suspension fluid consisting of microencapsulated Polywax in an environmentally friendly propylene glycol/water carrier fluid at the extremely attractive cost of ~$12/gal is the goal. In addition, a long-term durability study will be conducted to determine when the microPCM fluid should be replaced. A user-friendly computer simulation design tool will be developed for
microPCM based cooling systems. Finally, a full-scale microPCM-based prototype cooling system, sized for the EV-1 (i.e., 5 gal/min, 2 kW steady state dissipation with 10 kW instantaneous heat dissipation) will be developed, tested, and delivered to an interested commercial entity. Publications
Mulligan, J.C., Gould, R.D., and Jackson, W.,
“Performance of an octacosane based microPCM suspension fluid for cooling of EV electronics,” Submitted to 8th Joint AIAA/ASME Thermophysics and Heat Transfer Conference, St. Louis, MO, June 24-27, 2002.
74
Carbon Foam for Electronics Cooling J. W. Klett, April McMillan, Lynn Klett, Nidia Gallego Carbon and Insulation Materials Technology Group Oak Ridge National Laboratory, P.O. Box 2008, MS 6087, Bldg. 4508 Oak Ridge, TN 37831-6087 (865) 574-5220; fax: (865) 576-8424; e-mail: [email protected] DOE Program Manager: Patrick Davis (202) 586-8061; fax: (202) 586-9811; e-mail: [email protected]
ORNL Technical Advisor: David Stinton (865) 574-4556; fax: (865) 241-0411; e-mail: [email protected]
Contractor: Oak Ridge National Laboratory, Oak Ridge, Tennessee Prime Contract No.: DE-AC05-00OR22725
Objectives
• Coordinate with automotive partners to develop carbon foam heat exchanger and heat sink designs to dissipate 30 W/cm2 using current cooling fluids, achieving a targeted heat flux/weight ratio of >30% over current standards
• Conduct additional processing studies to increase understanding of the effects of processing conditions on foam microstructure that affect thermal properties, as well as the strength, durability, and toughness of the foam
Approach
• Study fundamental mechanisms of heat transfer using the carbon foam
• Develop a testing method to evaluate the foams in addition to designs using the foams
• Compare results with existing data on heat sinks and current heat exchanger designs
• Collaborate with original equipment manufacturers (OEMs) on designs and explore options together
• Begin development of a low-cost fabrication method for the graphite foam
Accomplishments
• Demonstrated superb heat transfer (35 W/cm2) at temperatures of less than 60°C with a reduction in cooling flow rates of 62% compared with current designs
• Collaborated with Anteon for design optimization – Studies showed blind holes successfully reduce the pumping power required while maintaining high heat transfer.
• Collaborated with the National Security Agency (NSA) on a novel passive cooling system that utilizes evaporative cooling
• Performed several extrusion runs yielding foam
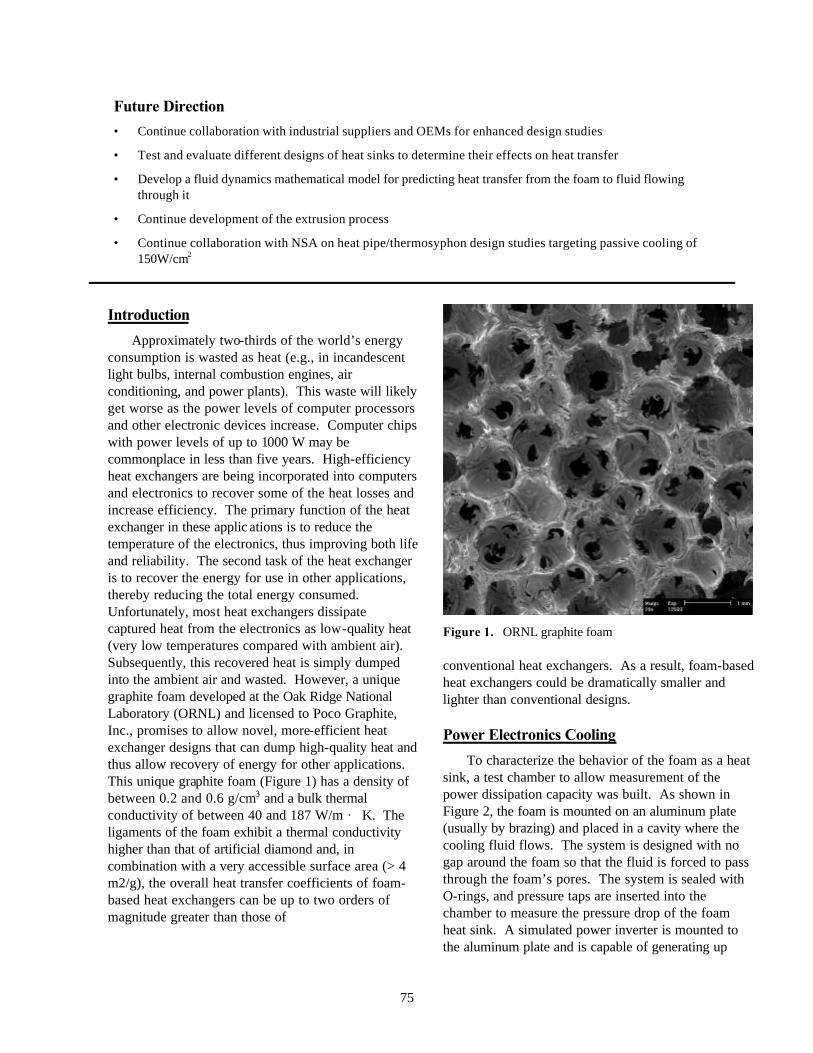
75
Future Direction
• Continue collaboration with industrial suppliers and OEMs for enhanced design studies
• Test and evaluate different designs of heat sinks to determine their effects on heat transfer
• Develop a fluid dynamics mathematical model for predicting heat transfer from the foam to fluid flowing through it
• Continue development of the extrusion process
• Continue collaboration with NSA on heat pipe/thermosyphon design studies targeting passive cooling of 150W/cm2
Introduction
Approximately two-thirds of the world’s energy consumption is wasted as heat (e.g., in incandescent light bulbs, internal combustion engines, air conditioning, and power plants). This waste will likely get worse as the power levels of computer processors and other electronic devices increase. Computer chips with power levels of up to 1000 W may be commonplace in less than five years. High-efficiency heat exchangers are being incorporated into computers and electronics to recover some of the heat losses and increase efficiency. The primary function of the heat exchanger in these applic ations is to reduce the temperature of the electronics, thus improving both life and reliability. The second task of the heat exchanger is to recover the energy for use in other applications, thereby reducing the total energy consumed. Unfortunately, most heat exchangers dissipate captured heat from the electronics as low-quality heat (very low temperatures compared with ambient air). Subsequently, this recovered heat is simply dumped into the ambient air and wasted. However, a unique graphite foam developed at the Oak Ridge National Laboratory (ORNL) and licensed to Poco Graphite, Inc., promises to allow novel, more-efficient heat exchanger designs that can dump high-quality heat and thus allow recovery of energy for other applications. This unique graphite foam (Figure 1) has a density of between 0.2 and 0.6 g/cm3 and a bulk thermal conductivity of between 40 and 187 W/m · K. The ligaments of the foam exhibit a thermal conductivity higher than that of artificial diamond and, in combination with a very accessible surface area (> 4 m2/g), the overall heat transfer coefficients of foam-based heat exchangers can be up to two orders of magnitude greater than those of
Figure 1. ORNL graphite foam
conventional heat exchangers. As a result, foam-based heat exchangers could be dramatically smaller and lighter than conventional designs. Power Electronics Cooling
To characterize the behavior of the foam as a heat sink, a test chamber to allow measurement of the power dissipation capacity was built. As shown in Figure 2, the foam is mounted on an aluminum plate (usually by brazing) and placed in a cavity where the cooling fluid flows. The system is designed with no gap around the foam so that the fluid is forced to pass through the foam’s pores. The system is sealed with O-rings, and pressure taps are inserted into the chamber to measure the pressure drop of the foam heat sink. A simulated power inverter is mounted to the aluminum plate and is capable of generating up
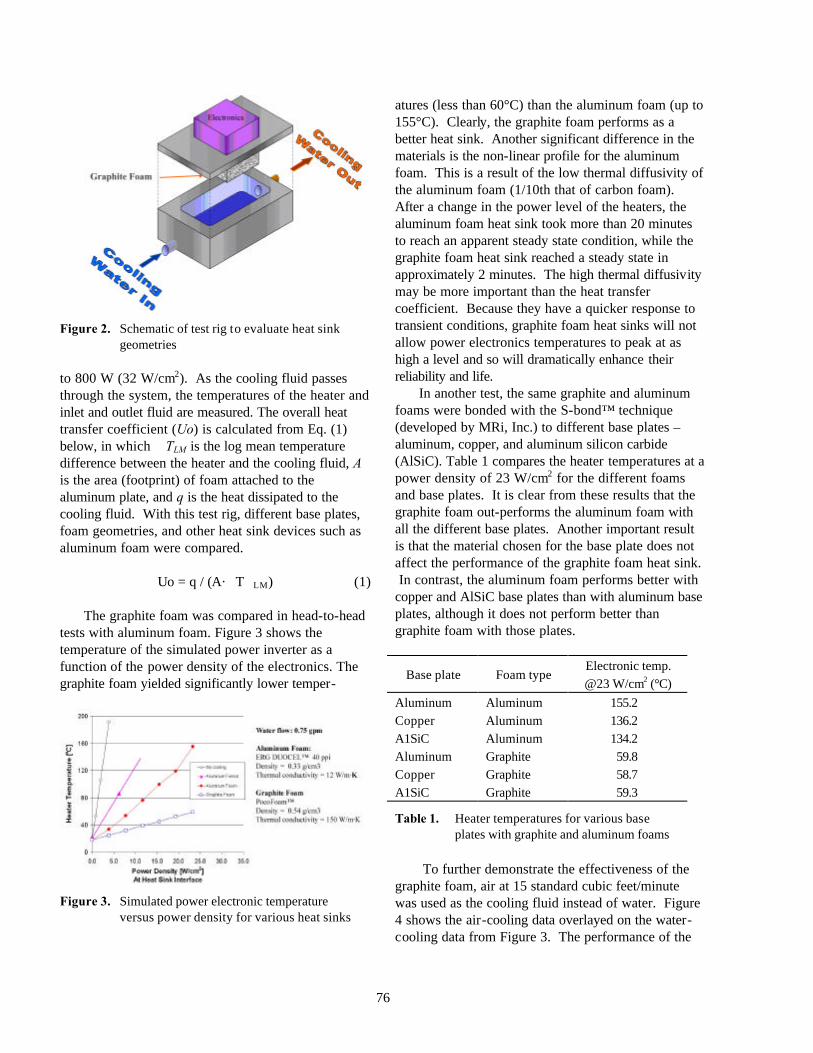
76
Figure 2. Schematic of test rig to evaluate heat sink geometries
to 800 W (32 W/cm2). As the cooling fluid passes through the system, the temperatures of the heater and inlet and outlet fluid are measured. The overall heat transfer coefficient (Uo) is calculated from Eq. (1) below, in which TLM is the log mean temperature difference between the heater and the cooling fluid, A is the area (footprint) of foam attached to the aluminum plate, and q is the heat dissipated to the cooling fluid. With this test rig, different base plates, foam geometries, and other heat sink devices such as aluminum foam were compared.
Uo = q / (A·T LM) (1)
The graphite foam was compared in head-to-head tests with aluminum foam. Figure 3 shows the temperature of the simulated power inverter as a function of the power density of the electronics. The graphite foam yielded significantly lower temper-
Figure 3. Simulated power electronic temperature versus power density for various heat sinks
atures (less than 60°C) than the aluminum foam (up to 155°C). Clearly, the graphite foam performs as a better heat sink. Another significant difference in the materials is the non-linear profile for the aluminum foam. This is a result of the low thermal diffusivity of the aluminum foam (1/10th that of carbon foam). After a change in the power level of the heaters, the aluminum foam heat sink took more than 20 minutes to reach an apparent steady state condition, while the graphite foam heat sink reached a steady state in approximately 2 minutes. The high thermal diffusivity may be more important than the heat transfer coefficient. Because they have a quicker response to transient conditions, graphite foam heat sinks will not allow power electronics temperatures to peak at as high a level and so will dramatically enhance their reliability and life.
In another test, the same graphite and aluminum foams were bonded with the S-bond™ technique (developed by MRi, Inc.) to different base plates – aluminum, copper, and aluminum silicon carbide (AlSiC). Table 1 compares the heater temperatures at a power density of 23 W/cm2 for the different foams and base plates. It is clear from these results that the graphite foam out-performs the aluminum foam with all the different base plates. Another important result is that the material chosen for the base plate does not affect the performance of the graphite foam heat sink. In contrast, the aluminum foam performs better with copper and AlSiC base plates than with aluminum base plates, although it does not perform better than graphite foam with those plates.
Base plate Foam type Electronic temp. @23 W/cm2 (°C)
Aluminum Aluminum 155.2 Copper Aluminum 136.2 A1SiC Aluminum 134.2 Aluminum Graphite 59.8 Copper Graphite 58.7 A1SiC Graphite 59.3
Table 1. Heater temperatures for various base plates with graphite and aluminum foams
To further demonstrate the effectiveness of the
graphite foam, air at 15 standard cubic feet/minute was used as the cooling fluid instead of water. Figure 4 shows the air-cooling data overlayed on the water-cooling data from Figure 3. The performance of the
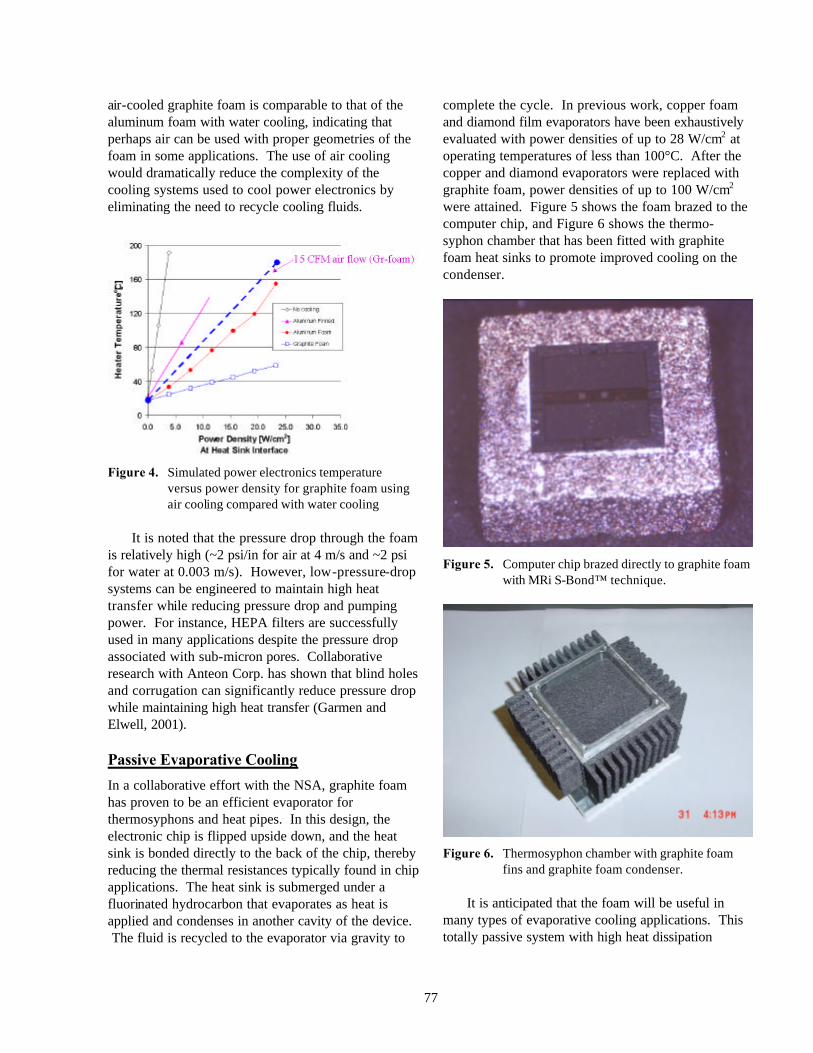
77
air-cooled graphite foam is comparable to that of the aluminum foam with water cooling, indicating that perhaps air can be used with proper geometries of the foam in some applications. The use of air cooling would dramatically reduce the complexity of the cooling systems used to cool power electronics by eliminating the need to recycle cooling fluids.
Figure 4. Simulated power electronics temperature versus power density for graphite foam using air cooling compared with water cooling
It is noted that the pressure drop through the foam
is relatively high (~2 psi/in for air at 4 m/s and ~2 psi for water at 0.003 m/s). However, low-pressure-drop systems can be engineered to maintain high heat transfer while reducing pressure drop and pumping power. For instance, HEPA filters are successfully used in many applications despite the pressure drop associated with sub-micron pores. Collaborative research with Anteon Corp. has shown that blind holes and corrugation can significantly reduce pressure drop while maintaining high heat transfer (Garmen and Elwell, 2001). Passive Evaporative Cooling
In a collaborative effort with the NSA, graphite foam has proven to be an efficient evaporator for thermosyphons and heat pipes. In this design, the electronic chip is flipped upside down, and the heat sink is bonded directly to the back of the chip, thereby reducing the thermal resistances typically found in chip applications. The heat sink is submerged under a fluorinated hydrocarbon that evaporates as heat is applied and condenses in another cavity of the device. The fluid is recycled to the evaporator via gravity to
complete the cycle. In previous work, copper foam and diamond film evaporators have been exhaustively evaluated with power densities of up to 28 W/cm2 at operating temperatures of less than 100°C. After the copper and diamond evaporators were replaced with graphite foam, power densities of up to 100 W/cm2 were attained. Figure 5 shows the foam brazed to the computer chip, and Figure 6 shows the thermo- syphon chamber that has been fitted with graphite foam heat sinks to promote improved cooling on the condenser.
Figure 5. Computer chip brazed directly to graphite foam with MRi S-Bond™ technique.
Figure 6. Thermosyphon chamber with graphite foam fins and graphite foam condenser.
It is anticipated that the foam will be useful in
many types of evaporative cooling applications. This totally passive system with high heat dissipation
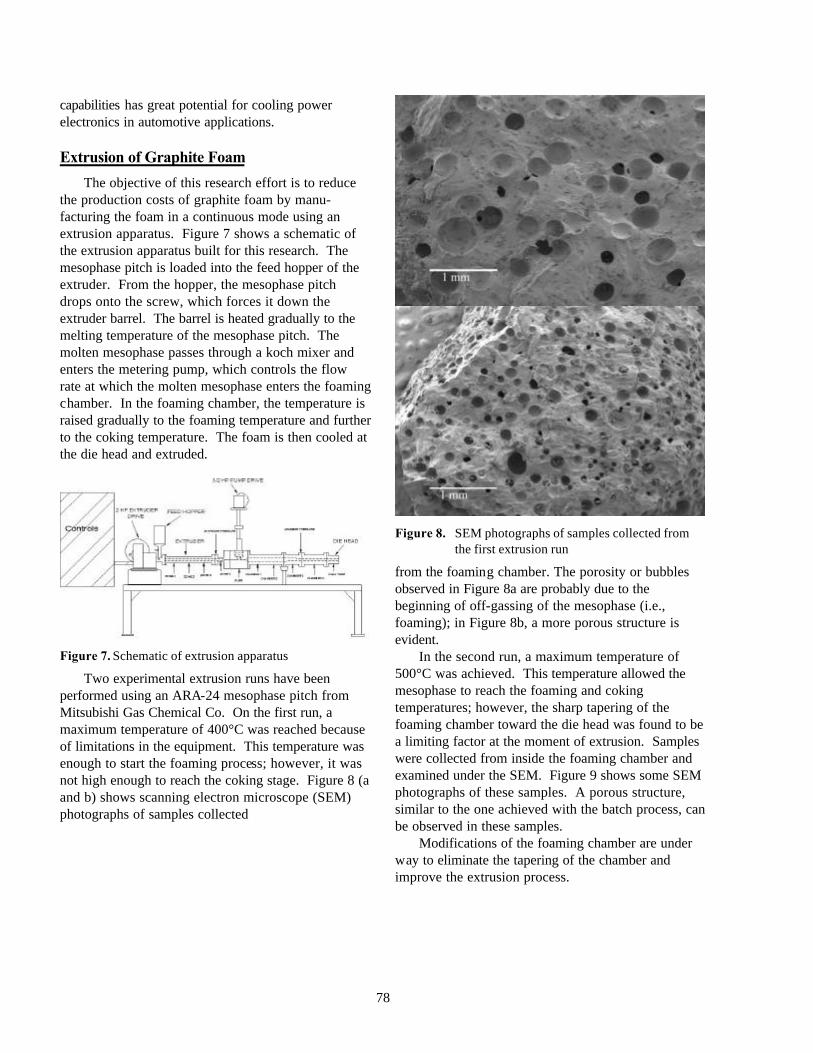
78
capabilities has great potential for cooling power electronics in automotive applications. Extrusion of Graphite Foam
The objective of this research effort is to reduce the production costs of graphite foam by manu-facturing the foam in a continuous mode using an extrusion apparatus. Figure 7 shows a schematic of the extrusion apparatus built for this research. The mesophase pitch is loaded into the feed hopper of the extruder. From the hopper, the mesophase pitch drops onto the screw, which forces it down the extruder barrel. The barrel is heated gradually to the melting temperature of the mesophase pitch. The molten mesophase passes through a koch mixer and enters the metering pump, which controls the flow rate at which the molten mesophase enters the foaming chamber. In the foaming chamber, the temperature is raised gradually to the foaming temperature and further to the coking temperature. The foam is then cooled at the die head and extruded.
Figure 7. Schematic of extrusion apparatus
Two experimental extrusion runs have been performed using an ARA-24 mesophase pitch from Mitsubishi Gas Chemical Co. On the first run, a maximum temperature of 400°C was reached because of limitations in the equipment. This temperature was enough to start the foaming process; however, it was not high enough to reach the coking stage. Figure 8 (a and b) shows scanning electron microscope (SEM) photographs of samples collected
Figure 8. SEM photographs of samples collected from the first extrusion run
from the foaming chamber. The porosity or bubbles observed in Figure 8a are probably due to the beginning of off-gassing of the mesophase (i.e., foaming); in Figure 8b, a more porous structure is evident.
In the second run, a maximum temperature of 500°C was achieved. This temperature allowed the mesophase to reach the foaming and coking temperatures; however, the sharp tapering of the foaming chamber toward the die head was found to be a limiting factor at the moment of extrusion. Samples were collected from inside the foaming chamber and examined under the SEM. Figure 9 shows some SEM photographs of these samples. A porous structure, similar to the one achieved with the batch process, can be observed in these samples.
Modifications of the foaming chamber are under way to eliminate the tapering of the chamber and improve the extrusion process.
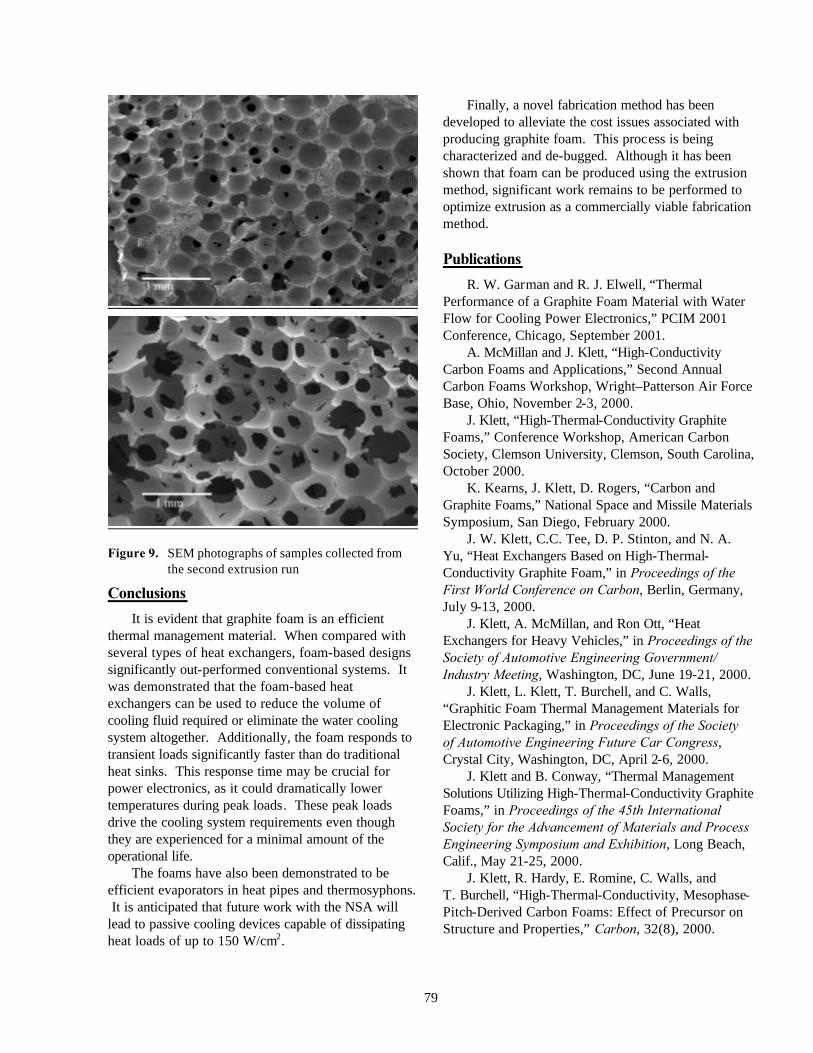
79
Figure 9. SEM photographs of samples collected from the second extrusion run
Conclusions
It is evident that graphite foam is an efficient thermal management material. When compared with several types of heat exchangers, foam-based designs significantly out-performed conventional systems. It was demonstrated that the foam-based heat exchangers can be used to reduce the volume of cooling fluid required or eliminate the water cooling system altogether. Additionally, the foam responds to transient loads significantly faster than do traditional heat sinks. This response time may be crucial for power electronics, as it could dramatically lower temperatures during peak loads. These peak loads drive the cooling system requirements even though they are experienced for a minimal amount of the operational life.
The foams have also been demonstrated to be efficient evaporators in heat pipes and thermosyphons. It is anticipated that future work with the NSA will lead to passive cooling devices capable of dissipating heat loads of up to 150 W/cm2.
Finally, a novel fabrication method has been developed to alleviate the cost issues associated with producing graphite foam. This process is being characterized and de-bugged. Although it has been shown that foam can be produced using the extrusion method, significant work remains to be performed to optimize extrusion as a commercially viable fabrication method. Publications
R. W. Garman and R. J. Elwell, “Thermal Performance of a Graphite Foam Material with Water Flow for Cooling Power Electronics,” PCIM 2001 Conference, Chicago, September 2001.
A. McMillan and J. Klett, “High-Conductivity Carbon Foams and Applications,” Second Annual Carbon Foams Workshop, Wright–Patterson Air Force Base, Ohio, November 2-3, 2000.
J. Klett, “High-Thermal-Conductivity Graphite Foams,” Conference Workshop, American Carbon Society, Clemson University, Clemson, South Carolina, October 2000.
K. Kearns, J. Klett, D. Rogers, “Carbon and Graphite Foams,” National Space and Missile Materials Symposium, San Diego, February 2000.
J. W. Klett, C.C. Tee, D. P. Stinton, and N. A. Yu, “Heat Exchangers Based on High-Thermal-Conductivity Graphite Foam,” in Proceedings of the First World Conference on Carbon, Berlin, Germany, July 9-13, 2000.
J. Klett, A. McMillan, and Ron Ott, “Heat Exchangers for Heavy Vehicles,” in Proceedings of the Society of Automotive Engineering Government/ Industry Meeting, Washington, DC, June 19-21, 2000.
J. Klett, L. Klett, T. Burchell, and C. Walls, “Graphitic Foam Thermal Management Materials for Electronic Packaging,” in Proceedings of the Society of Automotive Engineering Future Car Congress, Crystal City, Washington, DC, April 2-6, 2000.
J. Klett and B. Conway, “Thermal Management Solutions Utilizing High-Thermal-Conductivity Graphite Foams,” in Proceedings of the 45th International Society for the Advancement of Materials and Process Engineering Symposium and Exhibition, Long Beach, Calif., May 21-25, 2000.
J. Klett, R. Hardy, E. Romine, C. Walls, and T. Burchell, “High-Thermal-Conductivity, Mesophase-Pitch-Derived Carbon Foams: Effect of Precursor on Structure and Properties,” Carbon, 32(8), 2000.

80
Patents Issued
“Process for Making Carbon Foam,” U.S. Serial Number 6,033,506, Oak Ridge National Laboratory, March 7, 2000.
“Pitch-Based Carbon Foam Heat Sink with Phase Change Material,” U.S. Serial Number 6,037,032, Oak Ridge National Laboratory, March 14, 2000.
“Pitch-Based Carbon Foam and Composites,” U.S. Serial Number 6, 261,485, Oak Ridge National Laboratory, July 17, 2001.
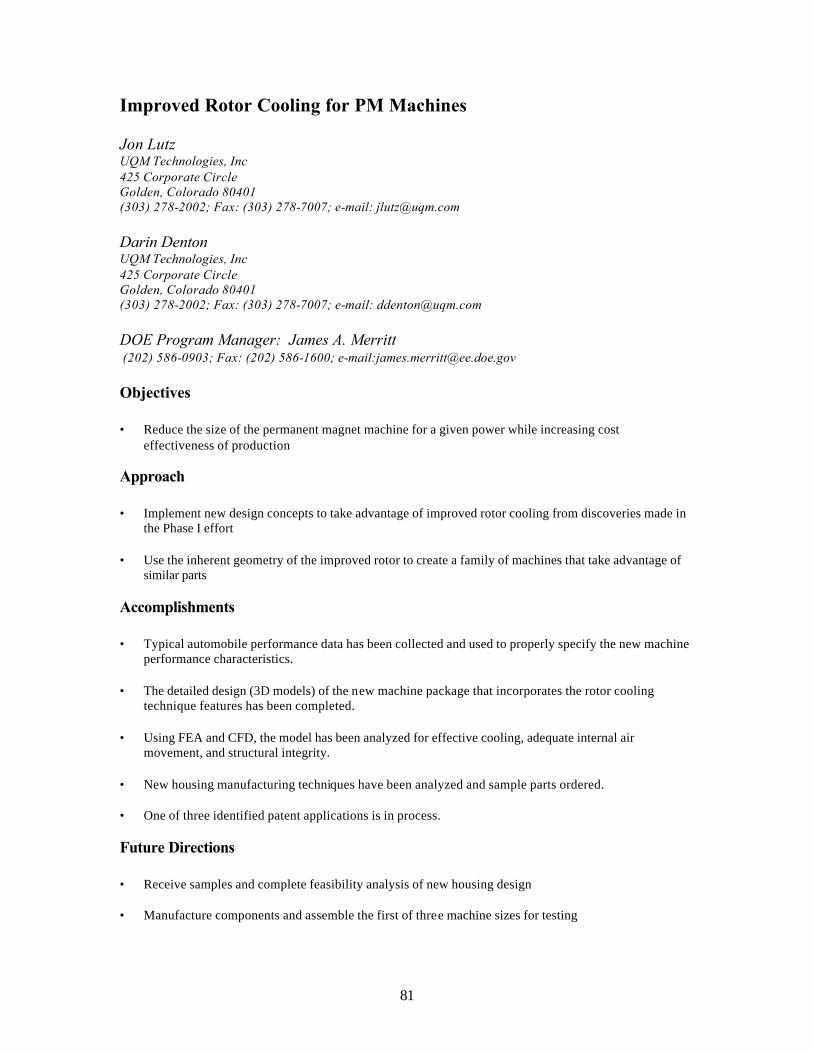
81
Improved Rotor Cooling for PM Machines Jon Lutz UQM Technologies, Inc 425 Corporate Circle Golden, Colorado 80401 (303) 278-2002; Fax: (303) 278-7007; e-mail: [email protected] Darin Denton UQM Technologies, Inc 425 Corporate Circle Golden, Colorado 80401 (303) 278-2002; Fax: (303) 278-7007; e-mail: [email protected] DOE Program Manager: James A. Merritt (202) 586-0903; Fax: (202) 586-1600; e-mail:[email protected] Objectives • Reduce the size of the permanent magnet machine for a given power while increasing cost
effectiveness of production Approach • Implement new design concepts to take advantage of improved rotor cooling from discoveries made in
the Phase I effort • Use the inherent geometry of the improved rotor to create a family of machines that take advantage of
similar parts Accomplishments • Typical automobile performance data has been collected and used to properly specify the new machine
performance characteristics. • The detailed design (3D models) of the new machine package that incorporates the rotor cooling
technique features has been completed. • Using FEA and CFD, the model has been analyzed for effective cooling, adequate internal air
movement, and structural integrity. • New housing manufacturing techniques have been analyzed and sample parts ordered. • One of three identified patent applications is in process. Future Directions • Receive samples and complete feasibility analysis of new housing design • Manufacture components and assemble the first of three machine sizes for testing
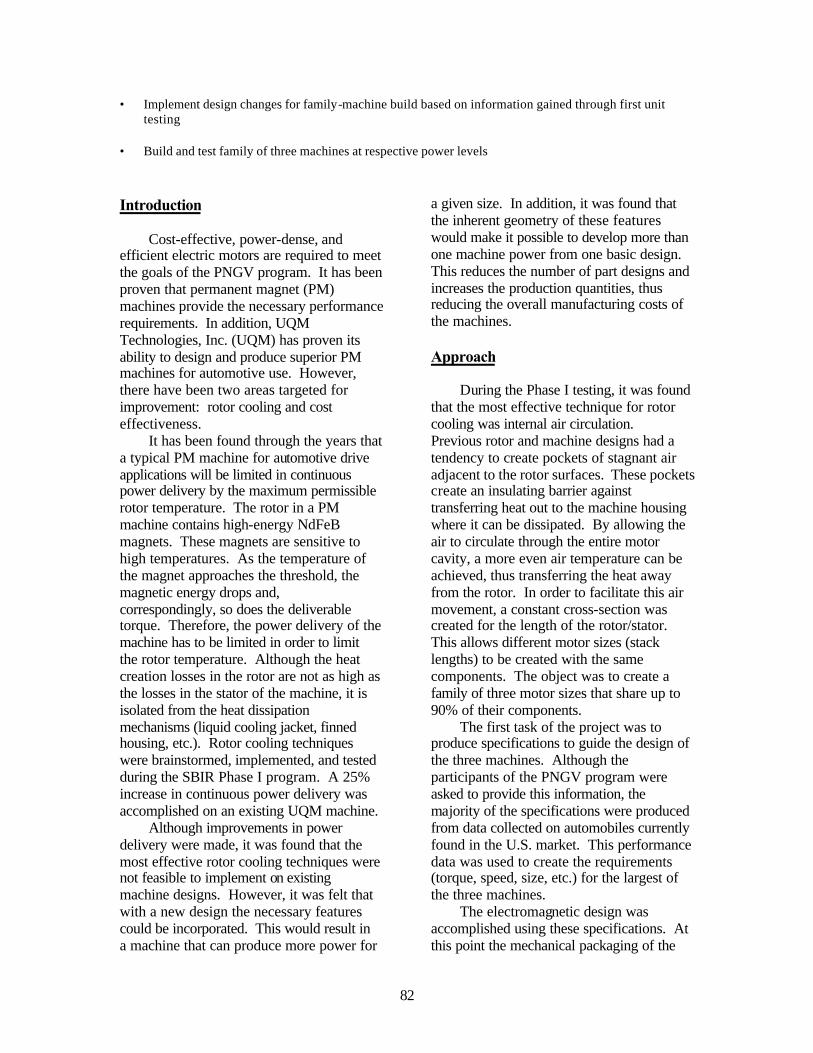
82
• Implement design changes for family-machine build based on information gained through first unit testing
• Build and test family of three machines at respective power levels Introduction
Cost-effective, power-dense, and efficient electric motors are required to meet the goals of the PNGV program. It has been proven that permanent magnet (PM) machines provide the necessary performance requirements. In addition, UQM Technologies, Inc. (UQM) has proven its ability to design and produce superior PM machines for automotive use. However, there have been two areas targeted for improvement: rotor cooling and cost effectiveness.
It has been found through the years that a typical PM machine for automotive drive applications will be limited in continuous power delivery by the maximum permissible rotor temperature. The rotor in a PM machine contains high-energy NdFeB magnets. These magnets are sensitive to high temperatures. As the temperature of the magnet approaches the threshold, the magnetic energy drops and, correspondingly, so does the deliverable torque. Therefore, the power delivery of the machine has to be limited in order to limit the rotor temperature. Although the heat creation losses in the rotor are not as high as the losses in the stator of the machine, it is isolated from the heat dissipation mechanisms (liquid cooling jacket, finned housing, etc.). Rotor cooling techniques were brainstormed, implemented, and tested during the SBIR Phase I program. A 25% increase in continuous power delivery was accomplished on an existing UQM machine.
Although improvements in power delivery were made, it was found that the most effective rotor cooling techniques were not feasible to implement on existing machine designs. However, it was felt that with a new design the necessary features could be incorporated. This would result in a machine that can produce more power for
a given size. In addition, it was found that the inherent geometry of these features would make it possible to develop more than one machine power from one basic design. This reduces the number of part designs and increases the production quantities, thus reducing the overall manufacturing costs of the machines. Approach
During the Phase I testing, it was found that the most effective technique for rotor cooling was internal air circulation. Previous rotor and machine designs had a tendency to create pockets of stagnant air adjacent to the rotor surfaces. These pockets create an insulating barrier against transferring heat out to the machine housing where it can be dissipated. By allowing the air to circulate through the entire motor cavity, a more even air temperature can be achieved, thus transferring the heat away from the rotor. In order to facilitate this air movement, a constant cross-section was created for the length of the rotor/stator. This allows different motor sizes (stack lengths) to be created with the same components. The object was to create a family of three motor sizes that share up to 90% of their components.
The first task of the project was to produce specifications to guide the design of the three machines. Although the participants of the PNGV program were asked to provide this information, the majority of the specifications were produced from data collected on automobiles currently found in the U.S. market. This performance data was used to create the requirements (torque, speed, size, etc.) for the largest of the three machines.
The electromagnetic design was accomplished using these specifications. At this point the mechanical packaging of the
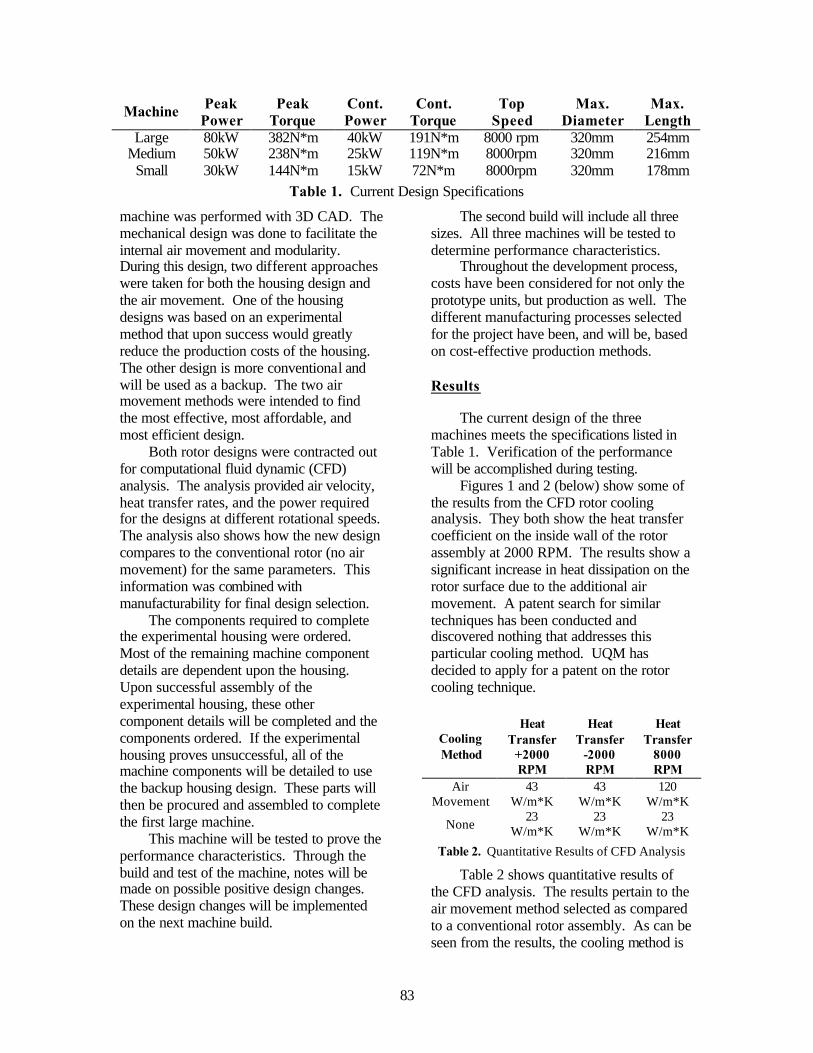
83
machine was performed with 3D CAD. The mechanical design was done to facilitate the internal air movement and modularity. During this design, two different approaches were taken for both the housing design and the air movement. One of the housing designs was based on an experimental method that upon success would greatly reduce the production costs of the housing. The other design is more conventional and will be used as a backup. The two air movement methods were intended to find the most effective, most affordable, and most efficient design.
Both rotor designs were contracted out for computational fluid dynamic (CFD) analysis. The analysis provided air velocity, heat transfer rates, and the power required for the designs at different rotational speeds. The analysis also shows how the new design compares to the conventional rotor (no air movement) for the same parameters. This information was combined with manufacturability for final design selection.
The components required to complete the experimental housing were ordered. Most of the remaining machine component details are dependent upon the housing. Upon successful assembly of the experimental housing, these other component details will be completed and the components ordered. If the experimental housing proves unsuccessful, all of the machine components will be detailed to use the backup housing design. These parts will then be procured and assembled to complete the first large machine.
This machine will be tested to prove the performance characteristics. Through the build and test of the machine, notes will be made on possible positive design changes. These design changes will be implemented on the next machine build.
The second build will include all three sizes. All three machines will be tested to determine performance characteristics.
Throughout the development process, costs have been considered for not only the prototype units, but production as well. The different manufacturing processes selected for the project have been, and will be, based on cost-effective production methods. Results
The current design of the three machines meets the specifications listed in Table 1. Verification of the performance will be accomplished during testing.
Figures 1 and 2 (below) show some of the results from the CFD rotor cooling analysis. They both show the heat transfer coefficient on the inside wall of the rotor assembly at 2000 RPM. The results show a significant increase in heat dissipation on the rotor surface due to the additional air movement. A patent search for similar techniques has been conducted and discovered nothing that addresses this particular cooling method. UQM has decided to apply for a patent on the rotor cooling technique.
Table 2 shows quantitative results of the CFD analysis. The results pertain to the air movement method selected as compared to a conventional rotor assembly. As can be seen from the results, the cooling method is
Machine Peak Power
Peak Torque
Cont. Power
Cont. Torque
Top Speed
Max. Diameter
Max. Length
Large 80kW 382N*m 40kW 191N*m 8000 rpm 320mm 254mm Medium 50kW 238N*m 25kW 119N*m 8000rpm 320mm 216mm
Small 30kW 144N*m 15kW 72N*m 8000rpm 320mm 178mm Table 1. Current Design Specifications
Cooling Method
Heat Transfer
+2000 RPM
Heat Transfer
-2000 RPM
Heat Transfer
8000 RPM
Air Movement
43 W/m*K
43 W/m*K
120 W/m*K
None 23
W/m*K 23
W/m*K 23
W/m*K
Table 2. Quantitative Results of CFD Analysis
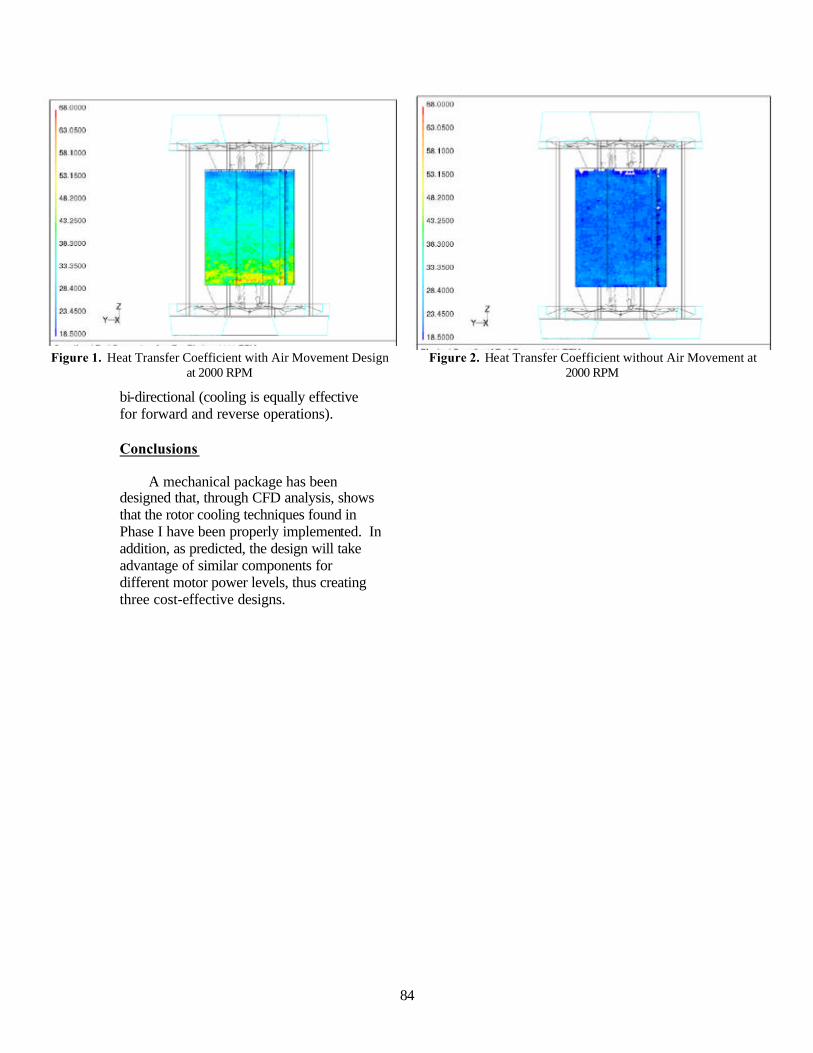
84
bi-directional (cooling is equally effective for forward and reverse operations). Conclusions
A mechanical package has been designed that, through CFD analysis, shows that the rotor cooling techniques found in Phase I have been properly implemented. In addition, as predicted, the design will take advantage of similar components for different motor power levels, thus creating three cost-effective designs.
Figure 1. Heat Transfer Coefficient with Air Movement Design
at 2000 RPM Figure 2. Heat Transfer Coefficient without Air Movement at
2000 RPM

85
Fiberoptic Microsensors for Automotive Power Electronics
Steve Allison Oak Ridge National Laboratory National Transportation Research Center 2360 Cherahala Boulevard Knoxville, Tennessee 37932 Voice: (865)-946-1287; Fax: (865)-946-1262; E-mail [email protected] DOE Program Manager: David Hamilton Voice: (202) 586-2314; Fax: (202) 586-1600; E-mail: [email protected] ORNL Technical Advisor: Donald J. Adams Voice: (865) 946-1321; Fax (865) 946-1262; E-mail: [email protected]
Objectives
• Develop an effective means for measuring current and voltages in the power electronics inverter drive package.
Approach The approach is to combine fiber optics with micro-electromechanical machines (MEMS) technology. This will lead to sensors that are
• lightweight, • small, • energy efficient, • inexpensive, • accurate, and • responsive
These sensor characteristics will improve the performance of inverters by enabling precise switching. In addition, such sensors will aid development and test engineers in optimizing designs. Present sensor technology uses significant drive current, takes up space, is heavy, and is too expensive for inclusion in consumer drive packages. The high currents and voltages involved with inverter operation, in conjunction with the extremely fast switching speeds, provide a challenging diagnostic environment. Sensors are required which are immune to electromagnetic interference (EMI) as well as accurate. Our approach is to combine two technologies, fiber optics and MEMS. For current measurement, microcantilevers are coated with a magnetic material. When placed close to a current source, the cantilever will flex in proportion to the induced magnetic field that accompanies the current. The cantilever motion is sensed optically with an optical fiber in close proximity to the microcantilever. The target range for current sensing is 1 to 600 amps.
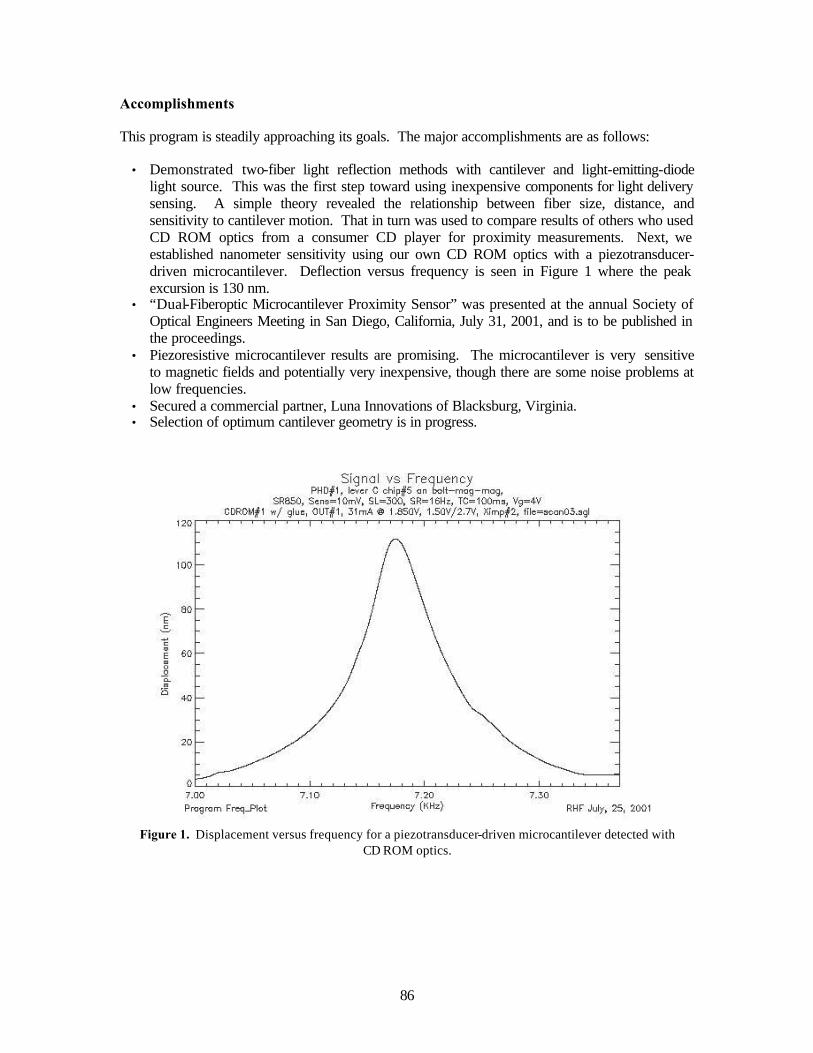
86
Accomplishments This program is steadily approaching its goals. The major accomplishments are as follows:
• Demonstrated two-fiber light reflection methods with cantilever and light-emitting-diode light source. This was the first step toward using inexpensive components for light delivery sensing. A simple theory revealed the relationship between fiber size, distance, and sensitivity to cantilever motion. That in turn was used to compare results of others who used CD ROM optics from a consumer CD player for proximity measurements. Next, we established nanometer sensitivity using our own CD ROM optics with a piezotransducer-driven microcantilever. Deflection versus frequency is seen in Figure 1 where the peak excursion is 130 nm.
• “Dual-Fiberoptic Microcantilever Proximity Sensor” was presented at the annual Society of Optical Engineers Meeting in San Diego, California, July 31, 2001, and is to be published in the proceedings.
• Piezoresistive microcantilever results are promising. The microcantilever is very sensitive to magnetic fields and potentially very inexpensive, though there are some noise problems at low frequencies.
• Secured a commercial partner, Luna Innovations of Blacksburg, Virginia. • Selection of optimum cantilever geometry is in progress.
Figure 1. Displacement versus frequency for a piezotransducer-driven microcantilever detected with CD ROM optics.
87
Silicon Carbide (SiC) Modeling Tool for Transportation Applications Leon Tolbert Oak Ridge National Laboratory National Transportation Research Center 2360 Cherahala Boulevard Knoxville, Tennessee 37932 Voice: (865) 946-1332; Fax: (865) 946-1262; E-mail: [email protected] Burak Ozpineci The University of Tennessee Knoxville, Tennessee 37996-2100 Voice: (865) 946-1329; Fax: (865) 946-1262; E-mail: [email protected] DOE Program Manager: David Hamilton Voice: (202) 586-2314; Fax: (202) 586-1600; E-mail: [email protected] ORNL Technical Advisor: Donald J. Adams Voice: (865) 946-1321; Fax (865) 946-1262; E-mail: [email protected]
Objectives
• Develop some reasonable simulation tools for silicon carbide (SiC) power electronics devices in relevant transportation applications. Once developed, these tools can be used to assess the impact of expected performance gains in SiC and determine areas of greatest impact.
Approach Presently, almost all the power electronics converter systems in automotive applications use silicon- (Si-) based power semiconductor switches. The performance of these systems is approaching the theoretical limits of the Si material. Another material, SiC, with its superior intrinsic properties compared with Si, is a good candidate to be used in the next-generation power devices. SiC-based power switches can be used in both electric traction drives and other automotive electrical subsystems with many benefits compared with Si based switches. With less than 1/100 conduction drop, SiC-based devices
have reduced conduction losses. Consequently, the efficiency of the power converter is higher. In addition, SiC-based semiconductor switches can operate at high temperatures (up to 600°C reported) without much change in their electrical properties. Thus the converter has a higher reliability. Reduced losses and allowable higher operating temperatures result in smaller heat-sink size. Moreover, the high frequency operating capability of SiC converters lowers the filtering requirement and the filter size. As a result, they are compact, light, reliable, efficient, and have a high power density. These qualities satisfy the requirements of the automotive industry for power converters.
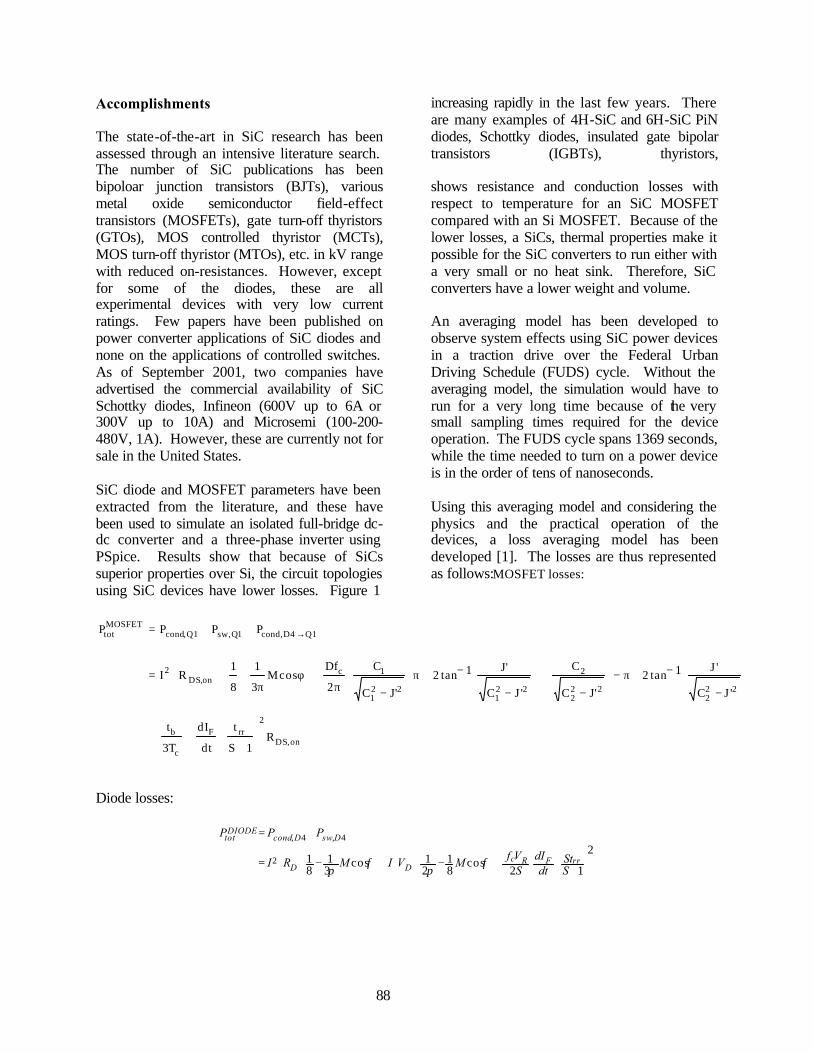
88
Accomplishments The state-of-the-art in SiC research has been assessed through an intensive literature search. The number of SiC publications has been
increasing rapidly in the last few years. There are many examples of 4H-SiC and 6H-SiC PiN diodes, Schottky diodes, insulated gate bipolar transistors (IGBTs), thyristors,
bipoloar junction transistors (BJTs), various metal oxide semiconductor field-effect transistors (MOSFETs), gate turn-off thyristors (GTOs), MOS controlled thyristor (MCTs), MOS turn-off thyristor (MTOs), etc. in kV range with reduced on-resistances. However, except for some of the diodes, these are all experimental devices with very low current ratings. Few papers have been published on power converter applications of SiC diodes and none on the applications of controlled switches. As of September 2001, two companies have advertised the commercial availability of SiC Schottky diodes, Infineon (600V up to 6A or 300V up to 10A) and Microsemi (100-200-480V, 1A). However, these are currently not for sale in the United States.
SiC diode and MOSFET parameters have been extracted from the literature, and these have been used to simulate an isolated full-bridge dc-dc converter and a three-phase inverter using PSpice. Results show that because of SiCs superior properties over Si, the circuit topologies using SiC devices have lower losses. Figure 1
shows resistance and conduction losses with respect to temperature for an SiC MOSFET compared with an Si MOSFET. Because of the lower losses, a SiCs, thermal properties make it possible for the SiC converters to run either with a very small or no heat sink. Therefore, SiC converters have a lower weight and volume. An averaging model has been developed to observe system effects using SiC power devices in a traction drive over the Federal Urban Driving Schedule (FUDS) cycle. Without the averaging model, the simulation would have to run for a very long time because of the very small sampling times required for the device operation. The FUDS cycle spans 1369 seconds, while the time needed to turn on a power device is in the order of tens of nanoseconds. Using this averaging model and considering the physics and the practical operation of the devices, a loss averaging model has been developed [1]. The losses are thus represented as follows:MOSFET losses:
on,DS
2rrF
c
b
222
222
2
221
221
1con,DS
2
1Q4D,cond1Q,sw1Q,condMOSFETtot
R1S
t
dt
dI
T3
t
'JC
'J1tan2
'JC
C
'JC
'J1tan2
'JC
C
2
DfcosM
3
1
8
1RI
PPPP
++
−
−+π−−
+
−
−+π−π
+φπ
+⋅⋅=
++= →
Diode losses:
2
12cos
81
21cos
31
812
4,4,
++−⋅⋅+−⋅⋅=
+=
SSt
dtdI
SVf
MVIMRI
PPP
rrFRcDD
DswDcondDIODE
tot
φπ
φπ
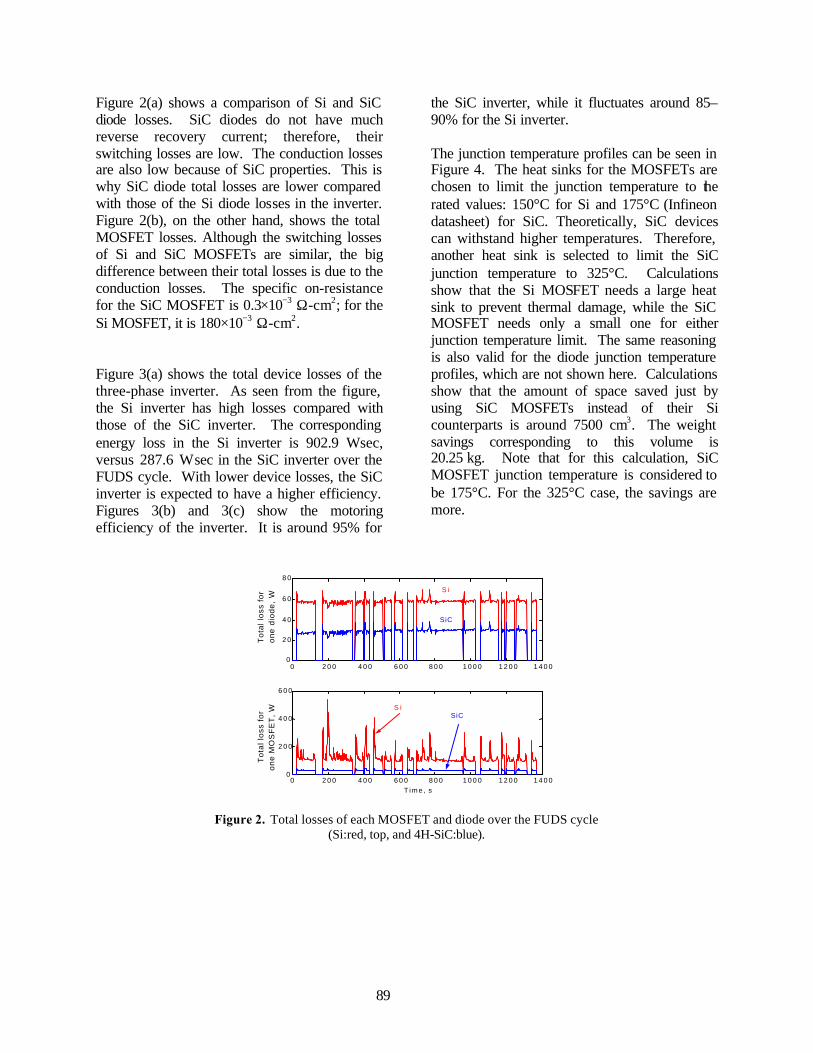
89
Figure 2(a) shows a comparison of Si and SiC diode losses. SiC diodes do not have much reverse recovery current; therefore, their switching losses are low. The conduction losses are also low because of SiC properties. This is why SiC diode total losses are lower compared with those of the Si diode losses in the inverter. Figure 2(b), on the other hand, shows the total MOSFET losses. Although the switching losses of Si and SiC MOSFETs are similar, the big difference between their total losses is due to the conduction losses. The specific on-resistance for the SiC MOSFET is 0.3×10⁻³ Ω-cm2; for the Si MOSFET, it is 180×10−3 Ω-cm2.
Figure 3(a) shows the total device losses of the three-phase inverter. As seen from the figure, the Si inverter has high losses compared with those of the SiC inverter. The corresponding energy loss in the Si inverter is 902.9 W⋅sec, versus 287.6 W⋅sec in the SiC inverter over the FUDS cycle. With lower device losses, the SiC inverter is expected to have a higher efficiency. Figures 3(b) and 3(c) show the motoring efficiency of the inverter. It is around 95% for
the SiC inverter, while it fluctuates around 85–90% for the Si inverter. The junction temperature profiles can be seen in Figure 4. The heat sinks for the MOSFETs are chosen to limit the junction temperature to the rated values: 150°C for Si and 175°C (Infineon datasheet) for SiC. Theoretically, SiC devices can withstand higher temperatures. Therefore, another heat sink is selected to limit the SiC junction temperature to 325°C. Calculations show that the Si MOSFET needs a large heat sink to prevent thermal damage, while the SiC MOSFET needs only a small one for either junction temperature limit. The same reasoning is also valid for the diode junction temperature profiles, which are not shown here. Calculations show that the amount of space saved just by using SiC MOSFETs instead of their Si counterparts is around 7500 cm3. The weight savings corresponding to this volume is 20.25 kg. Note that for this calculation, SiC MOSFET junction temperature is considered to be 175°C. For the 325°C case, the savings are more.
0 2 0 0 4 0 0 6 0 0 8 0 0 1 0 0 0 1 2 0 0 1 4 0 0 0
2 0
4 0
6 0
8 0
Tot
al lo
ss f
or
one
diod
e, W
0 2 0 0 4 0 0 6 0 0 8 0 0 1 0 0 0 1 2 0 0 1 4 0 0 0
2 0 0
4 0 0
6 0 0
Tot
al lo
ss f
or
one
MO
SF
ET
, W
T i m e , s
S i
SiC
S i SiC
Figure 2. Total losses of each MOSFET and diode over the FUDS cycle (Si:red, top, and 4H-SiC:blue).
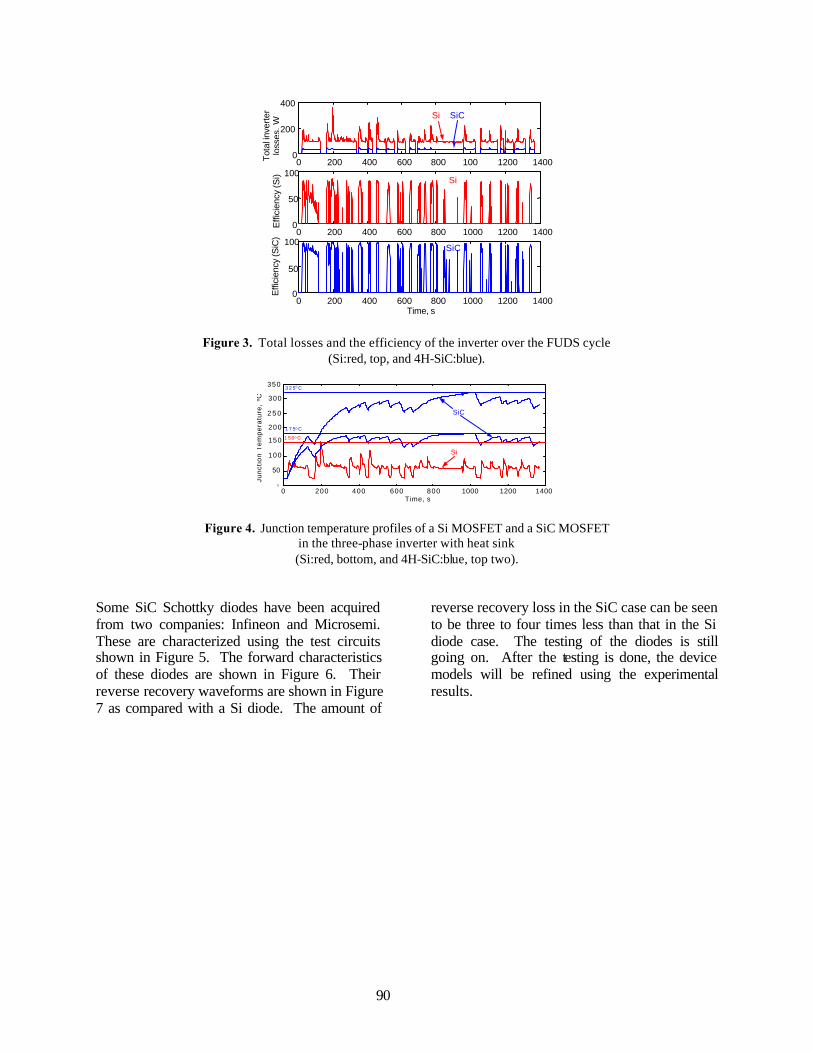
90
0 200 400 600 800 100 1200 14000
2000
400
Tota
l inv
erte
rlo
sses
, W
0 200 400 600 800 1000 1200 14000
50
100
Effi
cien
cy (S
i)
0 200 400 600 800 1000 1200 14000
50
100
Effi
cien
cy (S
iC)
Time, s
Si SiC
Si
SiC
Figure 3. Total losses and the efficiency of the inverter over the FUDS cycle (Si:red, top, and 4H-SiC:blue).
0 200 400 600 800 1000 1200 1400 0
50
100
150
200
2 5 0
300
350
Junc
tion
Tem
pera
ture
, °C
Time, s
SiC
3 2 5°C
1 7 5°C
1 5 0°C
Si
Figure 4. Junction temperature profiles of a Si MOSFET and a SiC MOSFET in the three-phase inverter with heat sink (Si:red, bottom, and 4H-SiC:blue, top two).
Some SiC Schottky diodes have been acquired from two companies: Infineon and Microsemi. These are characterized using the test circuits shown in Figure 5. The forward characteristics of these diodes are shown in Figure 6. Their reverse recovery waveforms are shown in Figure 7 as compared with a Si diode. The amount of
reverse recovery loss in the SiC case can be seen to be three to four times less than that in the Si diode case. The testing of the diodes is still going on. After the testing is done, the device models will be refined using the experimental results.
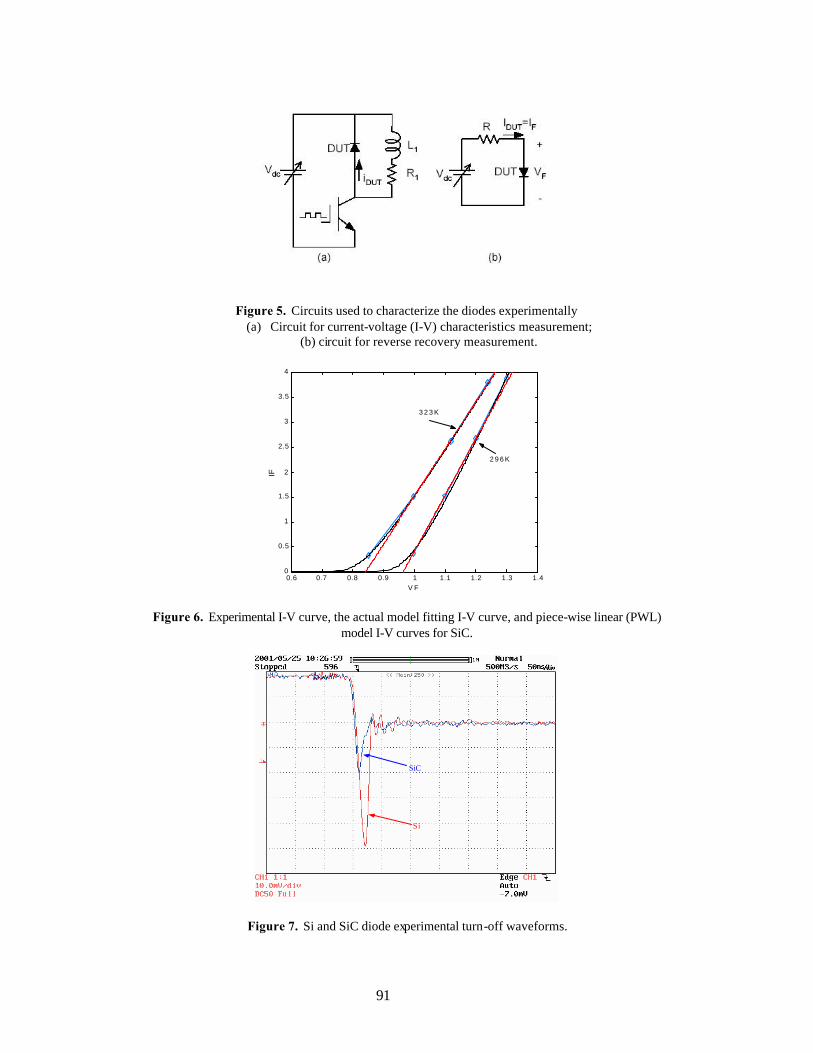
91
Figure 5. Circuits used to characterize the diodes experimentally
(a) Circuit for current-voltage (I-V) characteristics measurement; (b) circuit for reverse recovery measurement.
0.6 0.7 0.8 0.9 1 1.1 1.2 1.3 1.4 0
0.5
1
1.5
2
2.5
3
3.5
4
V F
IF
3 2 3 K
2 9 6 K
Figure 6. Experimental I-V curve, the actual model fitting I-V curve, and piece-wise linear (PWL) model I-V curves for SiC.
SiC
Si
Figure 7. Si and SiC diode experimental turn-off waveforms.
92
Summary In summary, different device and circuit models have been developed for SiC diodes and MOSFETs. These have been simulated in power electronics converters to show the effects of SiC. A traction drive for a HEV has been selected, and the main modeling studies are focused on this application. Some SiC diodes have been obtained, and these have been used to refine the theoretical model developed using the parameters from the literature. Future Directions Tests are under way to determine more accurate SiC diode models to better evaluate SiC effects. These tests will also be done at higher temperatures to include the thermal effects in the models. The diodes characterized are low-power diodes; therefore, the test results are scaled using device physics to obtain the characteristics of high-power devices. After the diode testing is done, more attention will be given to acquiring, testing, characterizing, and modeling SiC MOSFETs. Publication 1. Burak Ozpineci, Leon M. Tolbert, Syed K.
Islam, and Md. Hasanuzzaman, “Effects of Silicon Carbide (SiC) Power Devices on PWM Inverter Losses,” The 27th Annual Conference of the Institute of Electrical and Electronics Engineers, Inc. (IEEE) Industrial Electronics Society, Denver, Colorado, November 29–December 2, 2001.

93
Field Weakening and Magnet Retention for PM Machines John W. McKeever Oak Ridge National Laboratory National Transportation Research Center 2360 Cherahala Boulevard Knoxville, Tennessee 37932 Voice :( 865)-946-1316; Fax 865-946-1262; E-mail: [email protected] DOE Program Manager: David Hamilton Voice: (202) 586-2314; Fax (202) 586-1600; E-mail: [email protected] ORNL Technical Advisor: Donald J. Adams Voice: (865) 946-1321; Fax (865) 946-1262; E-mail: [email protected] Objectives
• Analyze known field-weakening methods for electronically switched permanent magnet (PM) type motors and identify deficiencies that may limit their use as a hybrid electric vehicles (HEV) drive system.
• Identify ways to mitigate the consequences of these deficiencies to produce a controller that is able to drive PM motors above base speed.
• Design, build, and demonstrate a PM motor/controller system that can meet HEV traction drive specifications, which, among other features, require that it deliver constant torque to base speed and constant power from base speed to four times base speed.
• Compare attributes of all PM-type motors that are Partnership for a New Generation of Vehicles (PNGV) HEV candidates and recommend one as the PM traction drive system of choice.
Approach
• Study and classify PM motors suitable for PNGV application by the shape of their back electromagnetic force (emf), which is sinusoidal for permanent magnet synchronous motor (PMSMs) and trapezoidal for brushless dc machines (BDCMs) and issue report (completed in 1999).
• Explore the ability of these motors to be driven above base speed (the speed at which their back-emf equals the bus voltage) to identify limiting deficiencies. It was found that low-inductance surface-mounted PM motors, which are PNGV traction drive candidates, incur excessive power losses beyond base speed (completed in 1999).
• Complete and publish theoretical development of the new dual mode inverter control (DMIC) method, which enables BDCMs to deliver constant power above base speed without exceeding current rating at base speed and submit a patent application (completed in 2000).
• Demonstrate the DMIC in the laboratory driving a derated PM axial gap motor to deliver 7.5 hp at a constant power speed ratio (CPSR) of 6 (completed in 2000).
• Design and assemble a DMIC and a 20-kW axial gap PM (AGPM) motor, which will be integrated to operate as an HEV direct traction drive system over a CPSR of 4 (completed in 2001).
• In 2002, demonstrate and characterize the operating performance and noise/vibration generation of the 20-kW HEV direct traction drive system for comparison with other traction drive candidates.
• In 2002, recommend the PM traction drive system (SRM, PMSM, or BDCM) with the best performance subject to HEV specification constraints.
94
• Build or obtain the recommended traction drive system and characterize its operating performance and noise/vibration generation (2003).
Accomplishments
• In April 2001, an ORNL report was issued describing the lab demonstration of the DMIC and highlighting the additional power that can be obtained at elevated speeds without exceeding the current specification [3].
• On March 19–20, 2001, the Power Electronics and Electric Machinery Research Center (PEEMRC) hosted a workshop requested by DOEs Office of Advanced Automotive Technologies (OAAT) during which researchers from DOE, ORNL, Argonne National Laboratory (ANL), and Ames Laboratory joined with representatives from Visual Computing Systems (VCS), Lynx Motion Technology, Delco Remy America, Advanced Materials Corporation, and Magna-Tech P/M Labs to explore problems that keep VCSs segmented electromagnetic array (SEMA) technology from meeting PNGV specifications and recommend steps to a solution. [Since ORNLs technology can solve several of the problems, and since no industrial funding is available for collaboration to apply this technology, OAAT suggested that the appropriate parties seek funding by responding to the Energy Efficiency and Renewable Energy Offfice (EERE) solicitation soon to be issued.]
• To seek funding to resolve issues hindering the application of SEMA technology in HEV traction drive systems, ORNL, with Electricore as lead, teamed with VCS, Lynx, and iPower Technologies to submit a proposal in response to EERE solicitation DE-PS36-01GO90010. The application is being evaluated by EERE.
• On May 22, 2001, the U.S. Patent Office issued Patent U.S. #6,236,179 B1, Constant Power Speed Range Extension of Surface Mounted PM Motors to two PEEMRC researchers [4].
• Designed and assembled both the 20-kW axial gap PM traction motor and its DMIC, which will be integrated and evaluated as a potential PNGV HEV traction drive candidate.
• Studies and inquiries were completed that strongly suggest that, since the CPSR of an IM is about 3.5 (4 is required by auto manufacturers to make the vehicle feel like todays automobiles), and a motor with interior-mounted PMs will have high manufacturing costs, the most attractive HEV traction drive motor candidate is the standard PM motor with exterior-mounted magnets.
• Advanced DMIC and axial gap motor theory. – Developed an equation for maximum power delivery of the DMIC. – Developed equations for minimum and maximum inductances that a DMIC can drive for a
given dc supply voltage. – Observed an enhanced inductance inherent in axial gap PM motors and confirmed calculated
inductance with measurements. • PEEMRC researchers completed three papers on DMIC technology for presentation in refereed
journals [5,6]. • Joao Onofre Pinto, a Ph.D. student working with Jack Lawler of the PEEMRC, completed and
defended a thesis on DMIC [7]. Future Direction
• Characterize the operational performance and noise/vibration generation of ORNL's 20-kW/DMIC traction drive (2002).
– Optimize the DMIC controller – Demonstrate regenerative braking – Measure torque/power of the motor and efficiencies of the inverter and motor as a function of
speed. – Quantify the sound energy flow out of the envelope of the motor

95
– Identify noise sources. • Incorporate torque ripple into a model and propose an acceptable da/dt boundary (2002). • Compare the performance above base speed of a doubly salient PM motor driven using Wisconsin
Electric Machines & Power Electronics Consortium’s (WEMPEC's) direct stator control with one driven using a DMIC controller (2002).
• Recommend the PM traction drive system (SRM, PMSM, or BDCM) that has best performance with respect to HEV constraints (2002).
• Build or obtain the PM traction drive system and characterize it in the laboratory (2003). Introduction The overarching research goal of this task has been to analyze known field-weakening methods for electronically switched PM type motors, to identify deficiencies that may limit their use in an HEV drive system, and possibly to develop means to remove the deficiencies. As part of this research, the latest phase advance techniques and field-weakening methods for electrically switched PM motors have been reviewed to determine how they can be generalized and applied to PNGV HEV traction motors. The ultimate research objective is completion of a comparison matrix with sufficient experimental and theoretical information to allow ORNL to recommend the best HEV PM traction/drive system. Because of their inherent high power density and efficiency, BDCMs with surface-mounted rare-earth PMs can provide the efficient traction drive system needed by HEVs. However, operation of these motors above base speed (the speed at which the back emf equals the driving voltage) requires special attention. Current technology for operating above base speed is the phase advance method (U.S. Patent #5,677,605, October 14, 1997). But if the motor inductance is low, the current at high speed may be several times greater than that at base because of uncontrolled conduction in the inverter's bypass diodes. Consequently, the inverter and motor must be over-designed, current ratings must be increased, and the motor requires more cooling. Identification of this deficiency, which impairs the effective design of a BDCM HEV traction drive system, led to the discovery of a new inverter topology and control scheme, which can
drive a low-inductance BDCM over the CPSR required to make electric vehicles "feel" like standard automobiles. The controller is called the DMIC. A patent for it was issued to ORNL on May 22, 2001. Laboratory experience had previously demonstrated delivery of 7.5 hp at a CPSR of 6 without exceeding the rated current at base speed. During the past year, a 20-kW axial-gap PM motor and DMIC inverter were designed and built as an HEV traction drive demonstration. It’s base speed is 1000 rpm, and the motor has been designed to deliver 20 kW at 4000 (CPSR = 4) without exceeding rated current at 1000 rpm. Final integration and assembly are in progress, and the actual demonstration testing has slipped to FY 2002. Theoretical Basis In addition to more-effective operation, the DMIC topology solves some safety problems. In the DMIC topology shown in Figure 1, the six thyristors prevent the detrimental mixture of motoring and regeneration during high-speed operation in the motoring mode. By control of these same thyristors, motor current can be stopped each time the vehicle coasts to eliminate stator copper losses. Since these thyristors block the highest back-emf (which occurs at maximum speed), the six full bridge transistors in the inverter; which see only the dc supply voltage – may have a lower voltage rating and corresponding lower cost. If the inverter's transistors lose their firing signals, the thyristors will extinguish motor current within one-half electrical cycle. Furthermore, the thyristors isolate the motor from faults in the transistors and dc voltage supply system.
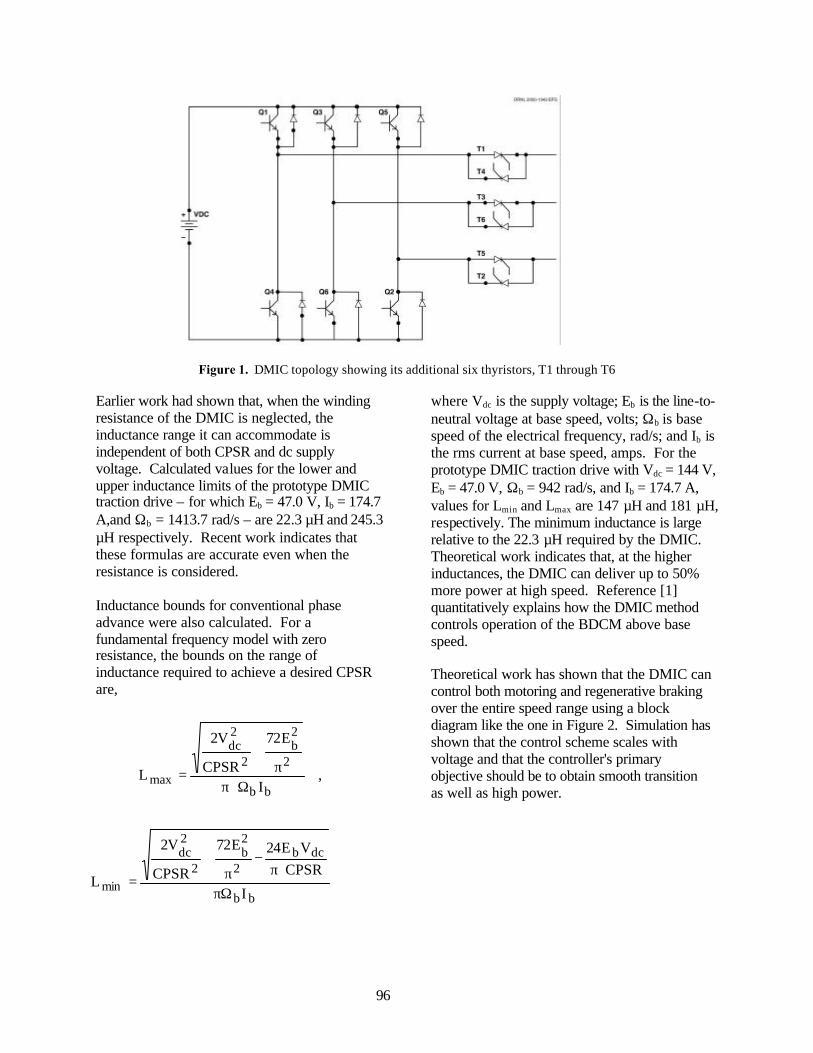
96
Figure 1. DMIC topology showing its additional six thyristors, T1 through T6
Earlier work had shown that, when the winding resistance of the DMIC is neglected, the inductance range it can accommodate is independent of both CPSR and dc supply voltage. Calculated values for the lower and upper inductance limits of the prototype DMIC traction drive – for which Eb = 47.0 V, Ib = 174.7 A,and Ωb = 1413.7 rad/s – are 22.3 µH and 245.3 µH respectively. Recent work indicates that these formulas are accurate even when the resistance is considered. Inductance bounds for conventional phase advance were also calculated. For a fundamental frequency model with zero resistance, the bounds on the range of inductance required to achieve a desired CPSR are,
where Vdc is the supply voltage; Eb is the line-to-neutral voltage at base speed, volts; Ωb is base speed of the electrical frequency, rad/s; and Ib is the rms current at base speed, amps. For the prototype DMIC traction drive with Vdc = 144 V, Eb = 47.0 V, Ωb = 942 rad/s, and Ib = 174.7 A, values for Lmin and Lmax are 147 µH and 181 µH, respectively. The minimum inductance is large relative to the 22.3 µH required by the DMIC. Theoretical work indicates that, at the higher inductances, the DMIC can deliver up to 50% more power at high speed. Reference [1] quantitatively explains how the DMIC method controls operation of the BDCM above base speed. Theoretical work has shown that the DMIC can control both motoring and regenerative braking over the entire speed range using a block diagram like the one in Figure 2. Simulation has shown that the control scheme scales with voltage and that the controller's primary objective should be to obtain smooth transition as well as high power.
bb
dcb2
2b
2
2dc
min I
CPSR
VE24E72
CPSR
V2
LΩπ
⋅π−
π+
=
, I
E72
CPSR
V2
Lbb
2
2b
2
2dc
max Ω⋅ππ
+
=
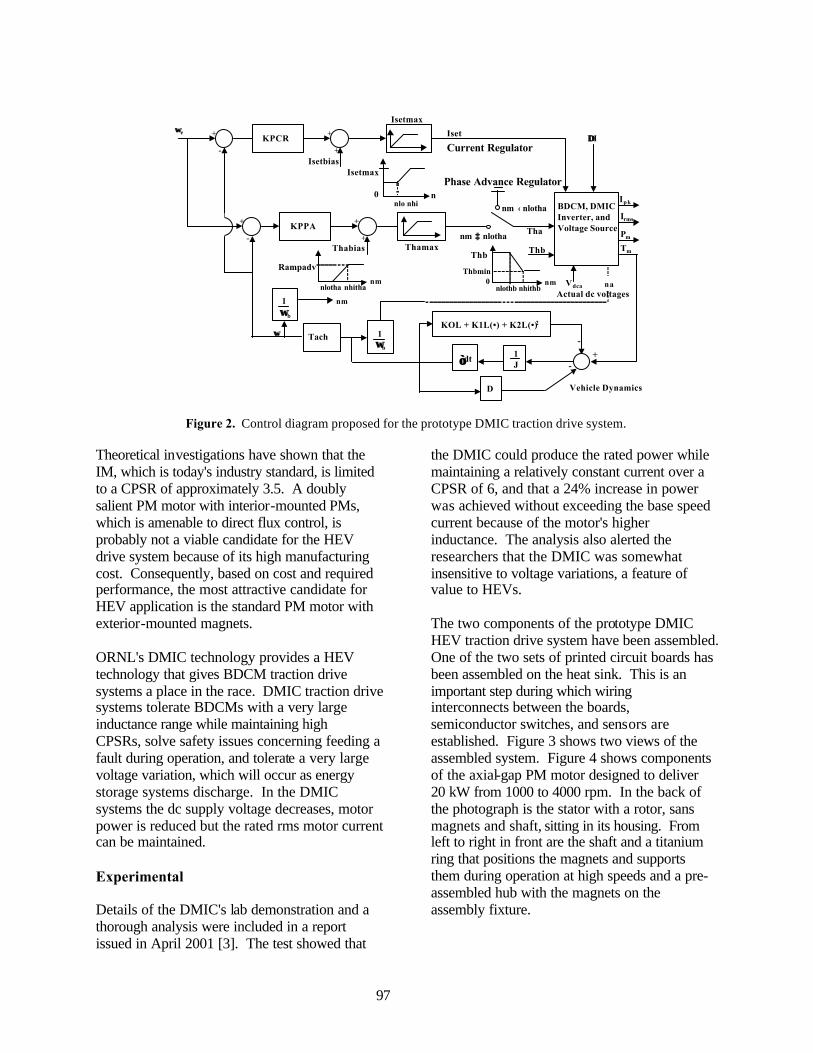
97
KPCR+
-
ωωe +
+
Isetmax
+
-KPPA +
+
IsetbiasCurrent RegulatorIset
Isetmax
0nlo nhi
nBDCM, DMICInverter, andVoltage Source
∆∆I
Thabias Thamaxnm ≥≥ nlotha Tha
nm ‹ nlotha
Phase Advance Regulator
KOL + K1L(•) + K2L(•)2
Rampadv
nlotha nhithanm
Thb
nlothb nhithb
Thbmin0 nm
Thb
Tach 1 ΩΩb
1 ΩΩ b
nm
ωω
na
Ipk
Irms
Pm
Tm
Vdca
Actual dc voltages
∫∫dt 1J
D
- +-
Vehicle Dynamics
Figure 2. Control diagram proposed for the prototype DMIC traction drive system.
Theoretical investigations have shown that the IM, which is today's industry standard, is limited to a CPSR of approximately 3.5. A doubly salient PM motor with interior-mounted PMs, which is amenable to direct flux control, is probably not a viable candidate for the HEV drive system because of its high manufacturing cost. Consequently, based on cost and required performance, the most attractive candidate for HEV application is the standard PM motor with exterior-mounted magnets. ORNL's DMIC technology provides a HEV technology that gives BDCM traction drive systems a place in the race. DMIC traction drive systems tolerate BDCMs with a very large inductance range while maintaining high CPSRs, solve safety issues concerning feeding a fault during operation, and tolerate a very large voltage variation, which will occur as energy storage systems discharge. In the DMIC systems the dc supply voltage decreases, motor power is reduced but the rated rms motor current can be maintained. Experimental Details of the DMIC's lab demonstration and a thorough analysis were included in a report issued in April 2001 [3]. The test showed that
the DMIC could produce the rated power while maintaining a relatively constant current over a CPSR of 6, and that a 24% increase in power was achieved without exceeding the base speed current because of the motor's higher inductance. The analysis also alerted the researchers that the DMIC was somewhat insensitive to voltage variations, a feature of value to HEVs. The two components of the prototype DMIC HEV traction drive system have been assembled. One of the two sets of printed circuit boards has been assembled on the heat sink. This is an important step during which wiring interconnects between the boards, semiconductor switches, and sensors are established. Figure 3 shows two views of the assembled system. Figure 4 shows components of the axial-gap PM motor designed to deliver 20 kW from 1000 to 4000 rpm. In the back of the photograph is the stator with a rotor, sans magnets and shaft, sitting in its housing. From left to right in front are the shaft and a titanium ring that positions the magnets and supports them during operation at high speeds and a pre-assembled hub with the magnets on the assembly fixture.
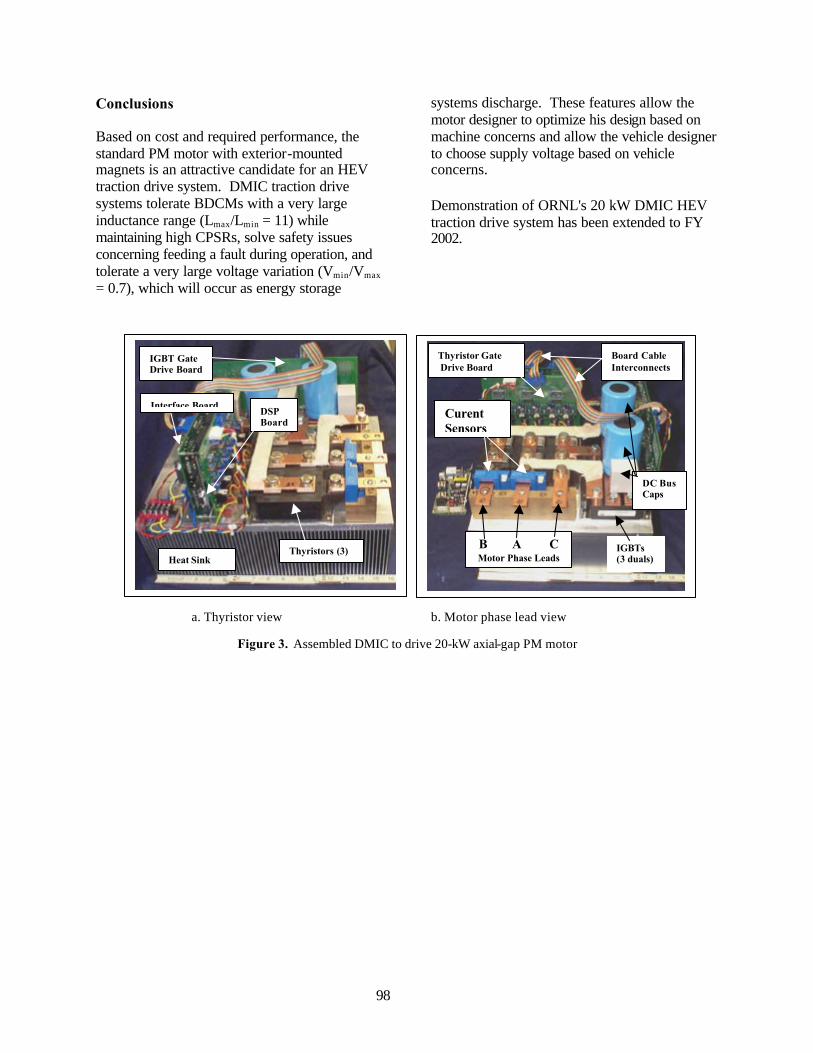
98
Conclusions Based on cost and required performance, the standard PM motor with exterior-mounted magnets is an attractive candidate for an HEV traction drive system. DMIC traction drive systems tolerate BDCMs with a very large inductance range (Lmax/Lmin = 11) while maintaining high CPSRs, solve safety issues concerning feeding a fault during operation, and tolerate a very large voltage variation (Vmin/Vmax
= 0.7), which will occur as energy storage
systems discharge. These features allow the motor designer to optimize his design based on machine concerns and allow the vehicle designer to choose supply voltage based on vehicle concerns. Demonstration of ORNL's 20 kW DMIC HEV traction drive system has been extended to FY 2002.
a. Thyristor view b. Motor phase lead view
Figure 3. Assembled DMIC to drive 20-kW axial-gap PM motor
IGBT GateDrive Board
Heat SinkThyristors (3)
B A CMotor Phase Leads
CurentSensors
IGBTs(3 duals)
DSPBoard
Board CableInterconnects
Thyristor Gate Drive Board
Interface Board
DC BusCaps
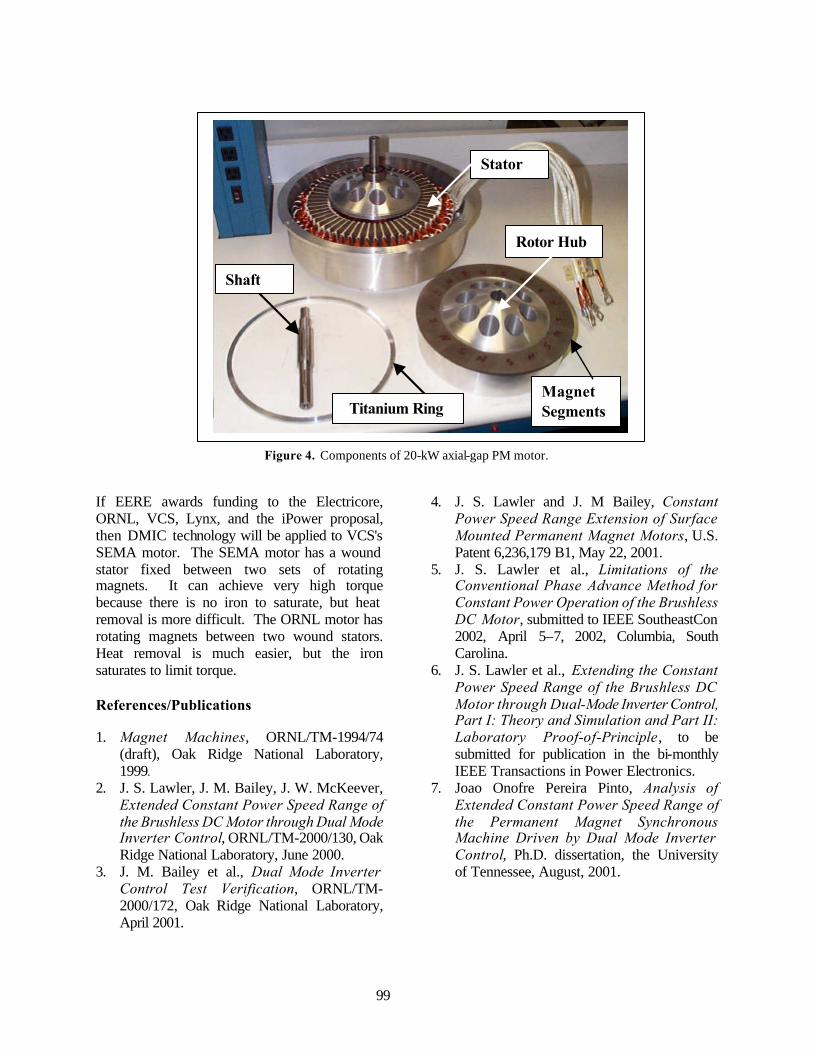
99
Figure 4. Components of 20-kW axial-gap PM motor. If EERE awards funding to the Electricore, ORNL, VCS, Lynx, and the iPower proposal, then DMIC technology will be applied to VCS's SEMA motor. The SEMA motor has a wound stator fixed between two sets of rotating magnets. It can achieve very high torque because there is no iron to saturate, but heat removal is more difficult. The ORNL motor has rotating magnets between two wound stators. Heat removal is much easier, but the iron saturates to limit torque. References/Publications 1. Magnet Machines, ORNL/TM-1994/74
(draft), Oak Ridge National Laboratory, 1999.
2. J. S. Lawler, J. M. Bailey, J. W. McKeever, Extended Constant Power Speed Range of the Brushless DC Motor through Dual Mode Inverter Control, ORNL/TM-2000/130, Oak Ridge National Laboratory, June 2000.
3. J. M. Bailey et al., Dual Mode Inverter Control Test Verification, ORNL/TM-2000/172, Oak Ridge National Laboratory, April 2001.
4. J. S. Lawler and J. M Bailey, Constant Power Speed Range Extension of Surface Mounted Permanent Magnet Motors, U.S. Patent 6,236,179 B1, May 22, 2001.
5. J. S. Lawler et al., Limitations of the Conventional Phase Advance Method for Constant Power Operation of the Brushless DC Motor, submitted to IEEE SoutheastCon 2002, April 5–7, 2002, Columbia, South Carolina.
6. J. S. Lawler et al., Extending the Constant Power Speed Range of the Brushless DC Motor through Dual-Mode Inverter Control, Part I: Theory and Simulation and Part II: Laboratory Proof-of-Principle, to be submitted for publication in the bi-monthly IEEE Transactions in Power Electronics.
7. Joao Onofre Pereira Pinto, Analysis of Extended Constant Power Speed Range of the Permanent Magnet Synchronous Machine Driven by Dual Mode Inverter Control, Ph.D. dissertation, the University of Tennessee, August, 2001.
Stator
Shaft
Rotor Hub
Magnet Segments Titanium Ring
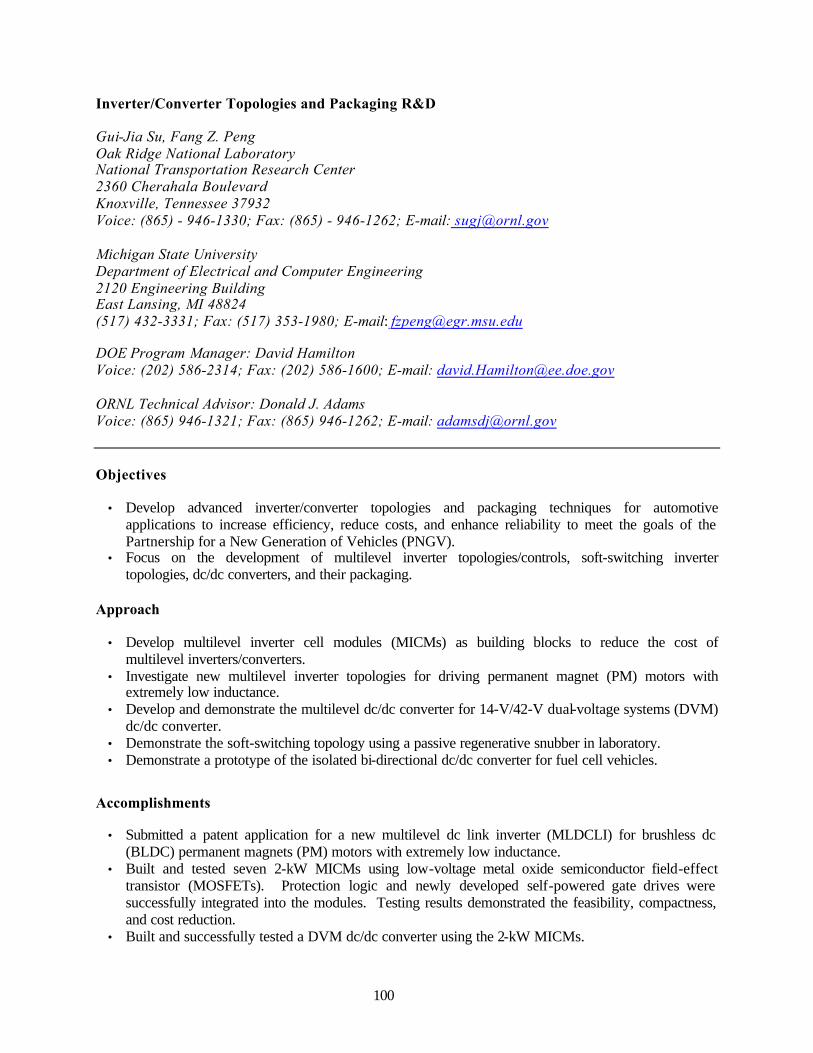
100
Inverter/Converter Topologies and Packaging R&D Gui-Jia Su, Fang Z. Peng Oak Ridge National Laboratory National Transportation Research Center 2360 Cherahala Boulevard Knoxville, Tennessee 37932 Voice: (865) - 946-1330; Fax: (865) - 946-1262; E-mail: [email protected] Michigan State University Department of Electrical and Computer Engineering 2120 Engineering Building East Lansing, MI 48824 (517) 432-3331; Fax: (517) 353-1980; E-mail: [email protected] DOE Program Manager: David Hamilton Voice: (202) 586-2314; Fax: (202) 586-1600; E-mail: [email protected] ORNL Technical Advisor: Donald J. Adams Voice: (865) 946-1321; Fax: (865) 946-1262; E-mail: [email protected] Objectives
• Develop advanced inverter/converter topologies and packaging techniques for automotive applications to increase efficiency, reduce costs, and enhance reliability to meet the goals of the Partnership for a New Generation of Vehicles (PNGV).
• Focus on the development of multilevel inverter topologies/controls, soft-switching inverter topologies, dc/dc converters, and their packaging.
Approach
• Develop multilevel inverter cell modules (MICMs) as building blocks to reduce the cost of
multilevel inverters/converters. • Investigate new multilevel inverter topologies for driving permanent magnet (PM) motors with
extremely low inductance. • Develop and demonstrate the multilevel dc/dc converter for 14-V/42-V dual-voltage systems (DVM)
dc/dc converter. • Demonstrate the soft-switching topology using a passive regenerative snubber in laboratory. • Demonstrate a prototype of the isolated bi-directional dc/dc converter for fuel cell vehicles.
Accomplishments
• Submitted a patent application for a new multilevel dc link inverter (MLDCLI) for brushless dc (BLDC) permanent magnets (PM) motors with extremely low inductance.
• Built and tested seven 2-kW MICMs using low-voltage metal oxide semiconductor field-effect transistor (MOSFETs). Protection logic and newly developed self-powered gate drives were successfully integrated into the modules. Testing results demonstrated the feasibility, compactness, and cost reduction.
• Built and successfully tested a DVM dc/dc converter using the 2-kW MICMs.

101
• Built and tested a 150-kVA passive soft-switching snubber (PSSS) inverter. Testing results confirmed the simulation studies performed in FY 2000 and showed the feasibility.
• Completed laboratory testing of the 5-kW prototype of the isolated bi-directional dc/dc converter for fuel cell vehicles. Testing results demonstrated the following features: (1) minimum number of switching devices (four) compared with the traditional bi-directional isolated power converters (eight or nine), (2) over 30% cost reduction, and (3) over 40% volume reduction.
Future Directions
• Optimize the circuit parameters and packaging for the MICMs. • Fabricate a 30-kW multilevel inverter using the optimized MICMs and demonstrate its feasibility for
HEV drives. • Cooperate with automotive industry to define specifications and requirements for 14-V/42-V dual-
voltage dc/dc converters and prepare a prototype of the DVM dc/dc converter that meets the specifications.
• Demonstrate the new MLDCLI for driving a PM motor with extremely low inductance. • Demonstrate a PSSS inverter specifically designed to drive a 30-kW HEV traction motor. • Field test and evaluate the performance of the 5-kW soft-switching dc/dc converter. • Investigate the possibility of the soft-switching dc/dc converter for 14-V/42-V DVM applications.
Introduction ORNL has developed a series of advanced soft-switching inverter topologies based on auxiliary resonant techniques. These topologies include the resonant snubber inverter (RSI) and auxiliary resonant tank (ART) inverter. ORNL has successfully applied the RSI technology into a super-conducting coil control system for medical applications. ART inverter prototypes (10 kW and 100 kW) have successfully demonstrated their superiority and have been applied to an electric bus drive application. However, because of increased costs, complexity, and decreased reliability resulting from the use of additional active devices to achieve soft-switching, existing soft-switching inverters, despite the gains in switching loss and EMI reduction, have not yet been accepted in mass HEV applications. To alleviate the cost and reliability penalties and to maintain the gains of soft switching, ORNL has developed a PSSS circuit for inverters. The PSSS inverter uses no extra active switches to achieve soft switching, thereby significantly reducing the added cost and control complexity.
A high-power bi-directional dc/dc converter with galvanic isolation is required to interconnect the low-voltage, 14-V/42-V system for accessories with the high-voltage (225 V–450 V) dc bus for traction drive in HEV applications, including fuel cell vehicles. Some of the drawbacks of existing dc/dc converters that meet the requirements for HEV applications are high cost, high component count, high EMI, and high dV/dt if using hard switching. ORNL has been working on a soft-switching dc/dc converter that uses only four switching devices to dramatically reduce the cost. The converter provides soft switching as a by-product of the topology, without any penalty. It is very well suited for dc/dc and dc/dc/ac power conversion applications where isolation, voltage boost, and bi-directional power flow are required, such as in fuel cell vehicle applications. ORNL has done much pioneering work on multilevel inverters. To reduce the cost and to further explore these topologies, an MICM has been developed as a building block. The MICMs have been used in a multilevel dc/dc converter for dual-voltage systems. The MICMs will be used to fabricate a 30-kW prototype to demonstrate cost reduction and the feasibility for low voltage (<50V) traction drives.

102
Because of their long effective air gaps, PM motors tend to have low inductance. The use of an ironless stator structure in present high-power PM motors (several tens of kWs) for HEV applications reduces the inductance even further (<100µH). This low inductance imposes stringent current regulation demands for the inverter to obtain acceptable current ripple. An analysis of the current ripple for these low inductance brushless PM motors shows that a standard inverter with the most commonly used IGBT switching devices cannot meet the current regulation demands and will produce unacceptable current ripples because of the IGBT’s limited switching frequency. A new MLDCLI is therefore developed, which can dramatically reduce the current ripple for brushless PM motor drives. MLCDLI Figure D1 shows the new inverter topology supplying a PM motor, which consists of a multilevel dc source and a standard bridge inverter. The dc source is formed by connecting a number of cells in series with each cell having a voltage source controlled by two switches. The two switches, Sa and Sb operate in a toggle fashion. The cell source is bypassed with Sa on and Sb off or adds to the dc bus voltage by reversing the switches. To control a PM motor in BLDC mode, the bridge inverter is used only to commutate the motor phase currents without conducting pulse width modulation (PWM) for current regulation. The current regulation is accomplished by the switches in the cells. For a given range of back electromotive force (EMF) defined by its minimum Ebemf_Peak(min) and maximum Ebemf_Peak(max), a portion of the cells are active; but only one of the cells performs PWM, while the rest of the active cells always add to the dc bus. The sources of the inactive cells are
bypassed. The required number of active cells, k , is determined by
1(min)_(max)_ +<<s
Peakbemf
s
Peakbemf
V
Ek
V
E,
where Vs is the source voltage of each cell. Since n cells cover the full voltage range, it is obvious that 1 < = k < = n and the number of active cells increases with motor speed. Alternatively, for a given number of cells, the controllable speed range, N, is defined by
bemf
s
bemf
sK
kVN
KVk <<− )1(
The current ripple at steady state and continuous conduction mode can be determined by
)1
)(1(4
2
_ kk
kV
NK
kV
NK
fLVk
Is
bemf
s
bemf
SWm
sripplem
−−−=
where: Lm : per-phase stator leakage inductance, fSW : inverter cell switching frequency, VS : inverter cell voltage, Kbemf : back EMF constant determined by the motor. The maximum current ripple can be determined by
bemf
s
SWm
sripplem
KVk
N
fLV
I
2)12(
at
16(max)_
−=
=
.
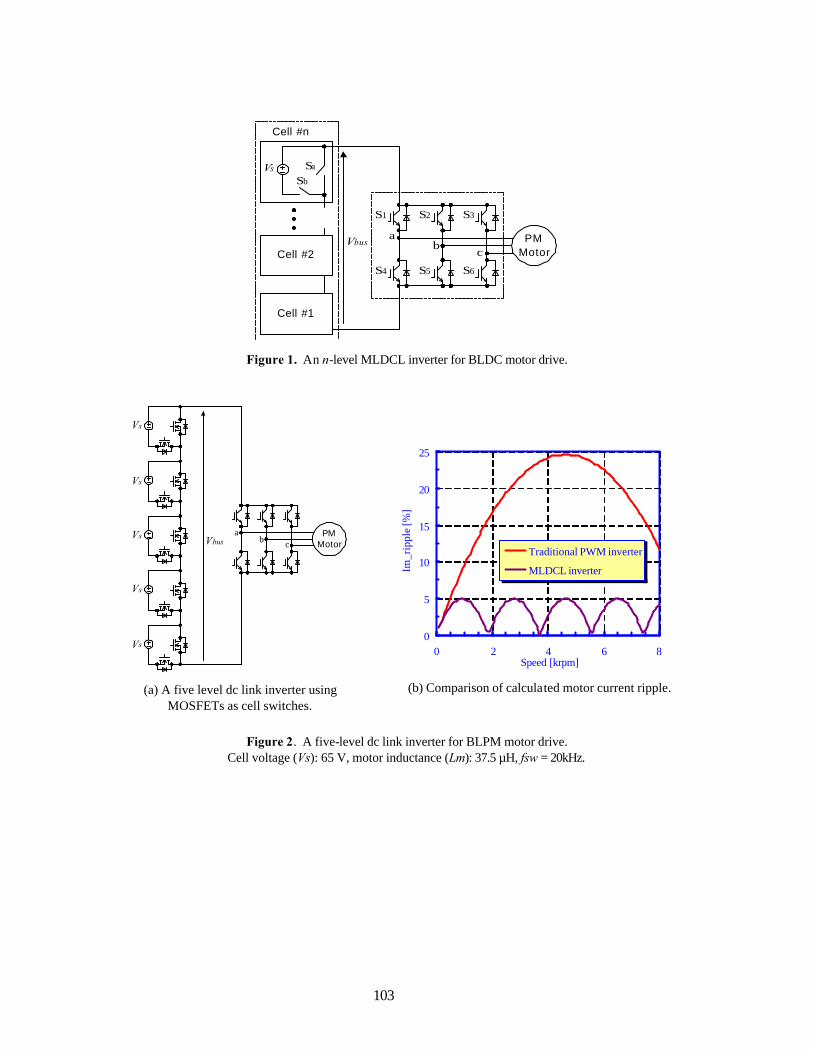
103
Cell #2PM
MotorVbus
Vs Sa
Sb
Cell #1
Cell #n
S1 S2
S6S5S4
S3
ab
c
Figure 1. An n-level MLDCL inverter for BLDC motor drive.
PMMotorVbus
Vs
Vs
Vs
Vs
Vs
ab c
(a) A five level dc link inverter using
MOSFETs as cell switches.
0
5
10
15
20
25
0 2 4 6 8Speed [krpm]
Im_r
ippl
e [%
]
Traditional PWM inverter
MLDCL inverter
(b) Comparison of calculated motor current ripple.
Figure 2. A five-level dc link inverter for BLPM motor drive. Cell voltage (Vs): 65 V, motor inductance (Lm): 37.5 µH, fsw = 20kHz.
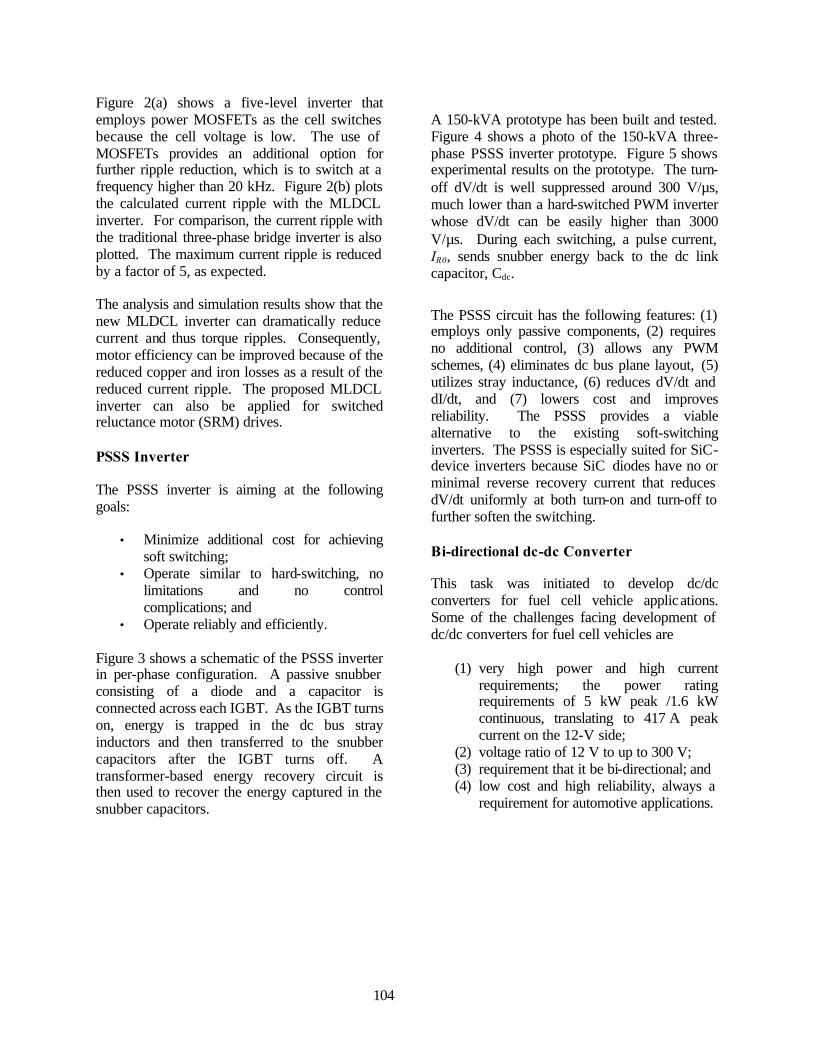
104
Figure 2(a) shows a five-level inverter that employs power MOSFETs as the cell switches because the cell voltage is low. The use of MOSFETs provides an additional option for further ripple reduction, which is to switch at a frequency higher than 20 kHz. Figure 2(b) plots the calculated current ripple with the MLDCL inverter. For comparison, the current ripple with the traditional three-phase bridge inverter is also plotted. The maximum current ripple is reduced by a factor of 5, as expected. The analysis and simulation results show that the new MLDCL inverter can dramatically reduce current and thus torque ripples. Consequently, motor efficiency can be improved because of the reduced copper and iron losses as a result of the reduced current ripple. The proposed MLDCL inverter can also be applied for switched reluctance motor (SRM) drives. PSSS Inverter The PSSS inverter is aiming at the following goals:
• Minimize additional cost for achieving soft switching;
• Operate similar to hard-switching, no limitations and no control complications; and
• Operate reliably and efficiently. Figure 3 shows a schematic of the PSSS inverter in per-phase configuration. A passive snubber consisting of a diode and a capacitor is connected across each IGBT. As the IGBT turns on, energy is trapped in the dc bus stray inductors and then transferred to the snubber capacitors after the IGBT turns off. A transformer-based energy recovery circuit is then used to recover the energy captured in the snubber capacitors.
A 150-kVA prototype has been built and tested. Figure 4 shows a photo of the 150-kVA three-phase PSSS inverter prototype. Figure 5 shows experimental results on the prototype. The turn-off dV/dt is well suppressed around 300 V/µs, much lower than a hard-switched PWM inverter whose dV/dt can be easily higher than 3000 V/µs. During each switching, a pulse current, IR0, sends snubber energy back to the dc link capacitor, Cdc.
The PSSS circuit has the following features: (1) employs only passive components, (2) requires no additional control, (3) allows any PWM schemes, (4) eliminates dc bus plane layout, (5) utilizes stray inductance, (6) reduces dV/dt and dI/dt, and (7) lowers cost and improves reliability. The PSSS provides a viable alternative to the existing soft-switching inverters. The PSSS is especially suited for SiC-device inverters because SiC diodes have no or minimal reverse recovery current that reduces dV/dt uniformly at both turn-on and turn-off to further soften the switching. Bi-directional dc-dc Converter This task was initiated to develop dc/dc converters for fuel cell vehicle applications. Some of the challenges facing development of dc/dc converters for fuel cell vehicles are
(1) very high power and high current requirements; the power rating requirements of 5 kW peak /1.6 kW continuous, translating to 417 A peak current on the 12-V side;
(2) voltage ratio of 12 V to up to 300 V; (3) requirement that it be bi-directional; and (4) low cost and high reliability, always a
requirement for automotive applications.
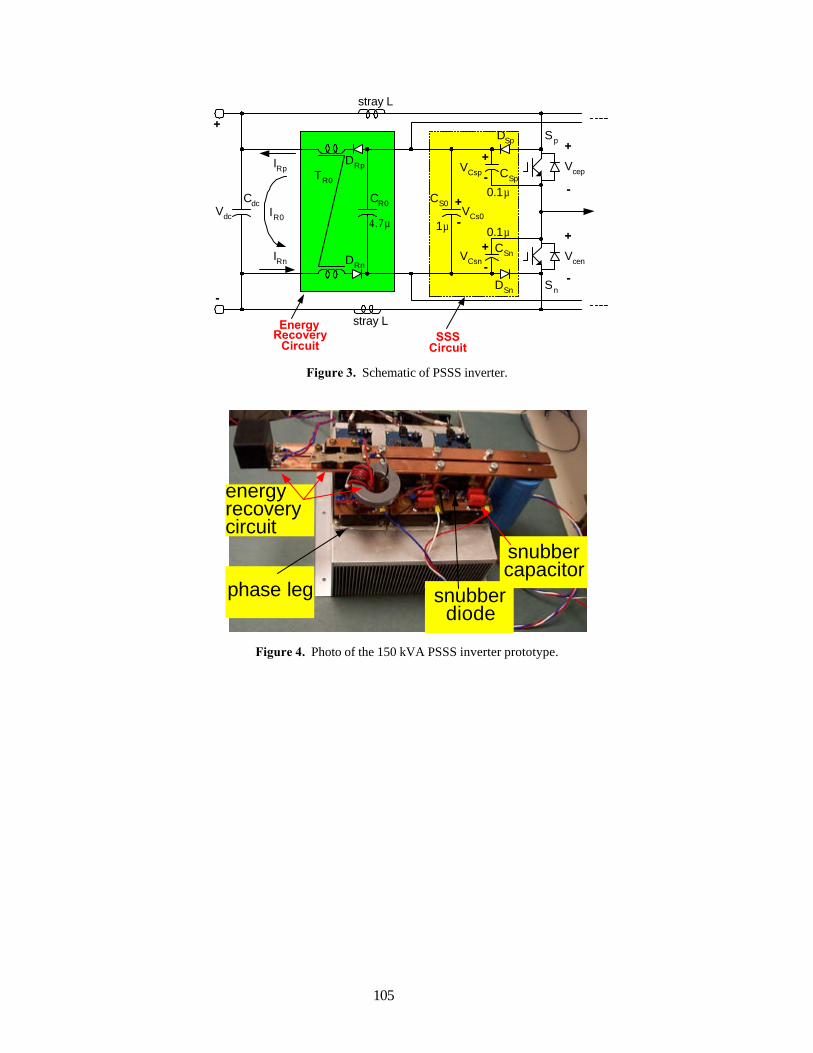
105
+
-
stray L
stray L
0.1µ
0.1µ4.7µ
SSSCircuit
EnergyRecovery
Circuit
+
-
Vcep
+
-
Vcen
IRp
IRn
Vdc1µ
DSp
DSn
CSn
CSp
CS0
TR0
CR0
Sp
Sn
DRp
DRn
CdcIR0
+
+
+
-
-
-
VCsp
VCsn
VCs0
Figure 3. Schematic of PSSS inverter.
snubbercapacitor
phase leg
energyrecoverycircuit
snubberdiode
Figure 4. Photo of the 150 kVA PSSS inverter prototype.
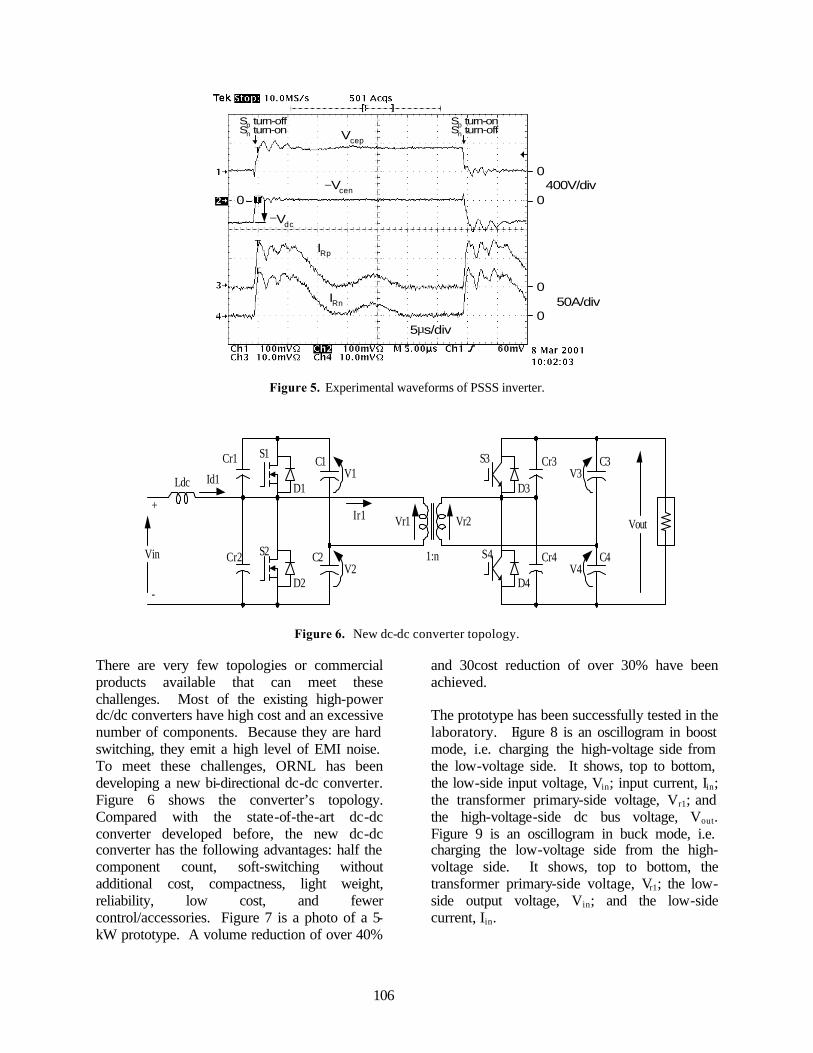
106
Vcep
−Vcen
0
0
IRp
IRn 50A/div
400V/div
0
0
Sp turn-offSn turn-on
Sp turn-onSn turn-off
5µs/div
0−Vdc
Figure 5. Experimental waveforms of PSSS inverter.
Vin
Ldc
+
1:n
-
Id1
Vr1 Vr2
Cr1
Cr2
Cr3
Cr4
C1
C2
C3
C4
V1
V2
V3
V4
S1
S2
S3
S4
D1
D2
D3
D4
Ir1Vout
Figure 6. New dc-dc converter topology. There are very few topologies or commercial products available that can meet these challenges. Most of the existing high-power dc/dc converters have high cost and an excessive number of components. Because they are hard switching, they emit a high level of EMI noise. To meet these challenges, ORNL has been developing a new bi-directional dc-dc converter. Figure 6 shows the converter’s topology. Compared with the state-of-the-art dc-dc converter developed before, the new dc-dc converter has the following advantages: half the component count, soft-switching without additional cost, compactness, light weight, reliability, low cost, and fewer control/accessories. Figure 7 is a photo of a 5-kW prototype. A volume reduction of over 40%
and 30cost reduction of over 30% have been achieved. The prototype has been successfully tested in the laboratory. Figure 8 is an oscillogram in boost mode, i.e. charging the high-voltage side from the low-voltage side. It shows, top to bottom, the low-side input voltage, Vin; input current, Iin; the transformer primary-side voltage, Vr1; and the high-voltage-side dc bus voltage, Vout. Figure 9 is an oscillogram in buck mode, i.e. charging the low-voltage side from the high-voltage side. It shows, top to bottom, the transformer primary-side voltage, Vr1; the low-side output voltage, Vin; and the low-side current, Iin.
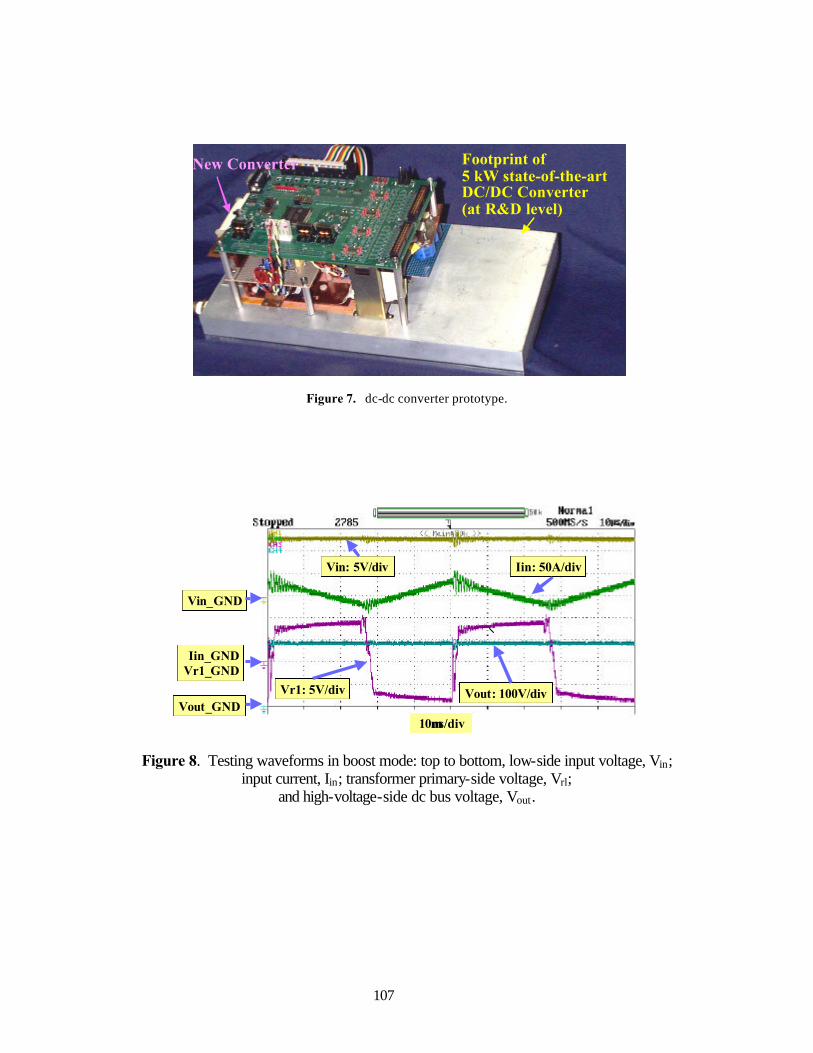
107
Footprint of5 kW state-of-the-artDC/DC Converter(at R&D level)
New Converter
Figure 7. dc-dc converter prototype.
Vin: 5V/div Iin: 50A/div
Vr1: 5V/div Vout: 100V/div
Vin_GND
Iin_GNDVr1_GND
Vout_GND10µµs/div
Figure 8. Testing waveforms in boost mode: top to bottom, low-side input voltage, Vin;
input current, Iin; transformer primary-side voltage, Vrl; and high-voltage-side dc bus voltage, Vout.
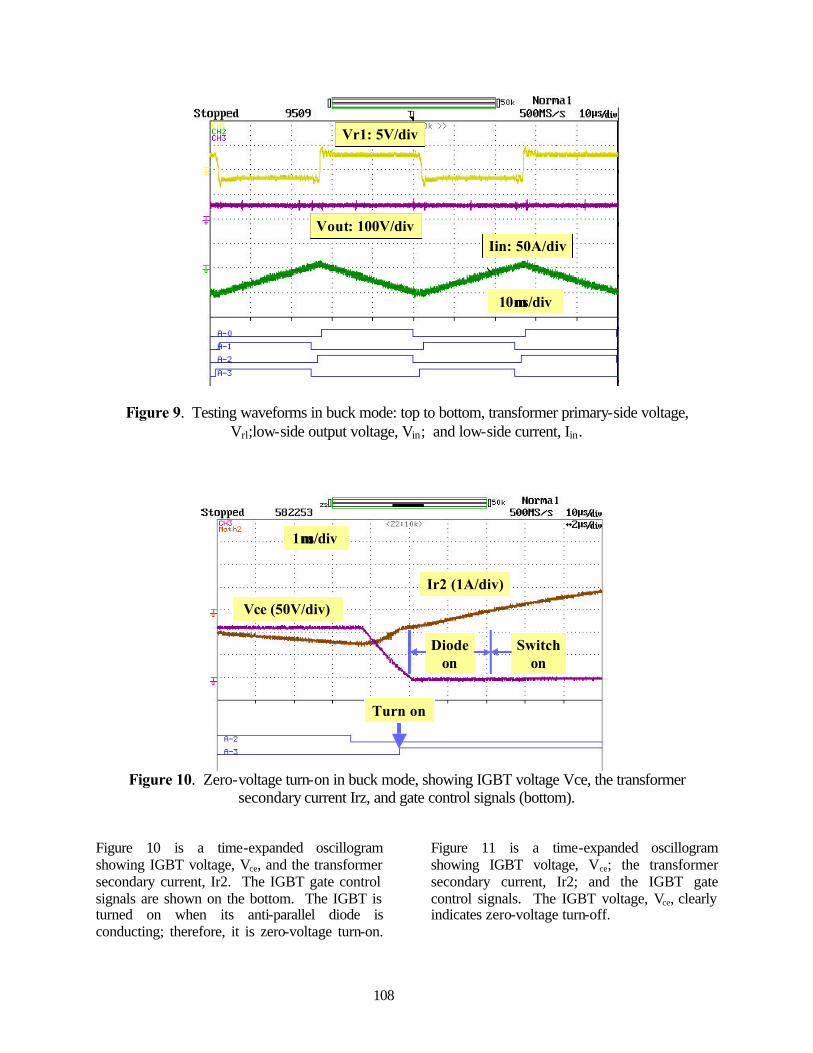
108
Iin: 50A/div
Vr1: 5V/div
Vout: 100V/div
10µµs/div
Figure 9. Testing waveforms in buck mode: top to bottom, transformer primary-side voltage, Vrl;low-side output voltage, Vin; and low-side current, Iin.
Vce (50V/div)
Ir2 (1A/div)
Diodeon
Switchon
Turn on
1µµs/div
Figure 10. Zero-voltage turn-on in buck mode, showing IGBT voltage Vce, the transformer
secondary current Irz, and gate control signals (bottom).
Figure 10 is a time-expanded oscillogram showing IGBT voltage, Vce, and the transformer secondary current, Ir2. The IGBT gate control signals are shown on the bottom. The IGBT is turned on when its anti-parallel diode is conducting; therefore, it is zero-voltage turn-on.
Figure 11 is a time-expanded oscillogram showing IGBT voltage, Vce; the transformer secondary current, Ir2; and the IGBT gate control signals. The IGBT voltage, Vce, clearly indicates zero-voltage turn-off.
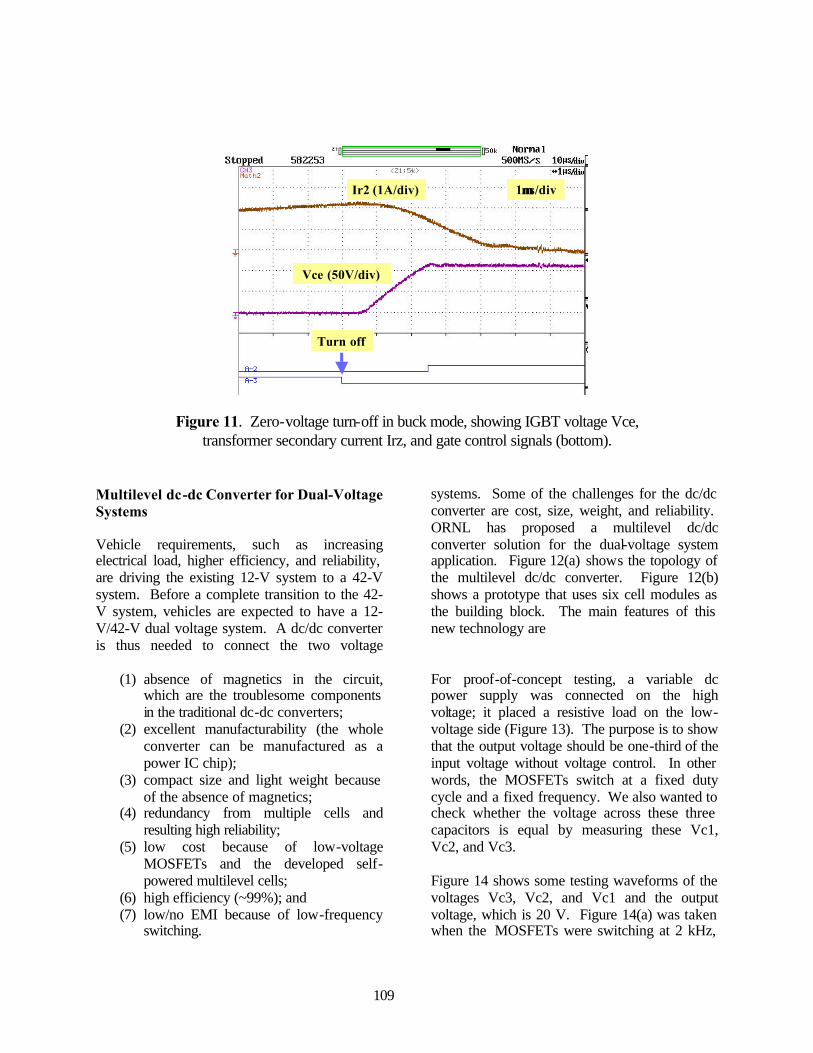
109
Vce (50V/div)
Ir2 (1A/div)
Turn off
1µµs/div
Figure 11. Zero-voltage turn-off in buck mode, showing IGBT voltage Vce, transformer secondary current Irz, and gate control signals (bottom).
Multilevel dc-dc Converter for Dual-Voltage Systems Vehicle requirements, such as increasing electrical load, higher efficiency, and reliability, are driving the existing 12-V system to a 42-V system. Before a complete transition to the 42-V system, vehicles are expected to have a 12-V/42-V dual voltage system. A dc/dc converter is thus needed to connect the two voltage
systems. Some of the challenges for the dc/dc converter are cost, size, weight, and reliability. ORNL has proposed a multilevel dc/dc converter solution for the dual-voltage system application. Figure 12(a) shows the topology of the multilevel dc/dc converter. Figure 12(b) shows a prototype that uses six cell modules as the building block. The main features of this new technology are
(1) absence of magnetics in the circuit,
which are the troublesome components in the traditional dc-dc converters;
(2) excellent manufacturability (the whole converter can be manufactured as a power IC chip);
(3) compact size and light weight because of the absence of magnetics;
(4) redundancy from multiple cells and resulting high reliability;
(5) low cost because of low-voltage MOSFETs and the developed self-powered multilevel cells;
(6) high efficiency (~99%); and (7) low/no EMI because of low-frequency
switching.
For proof-of-concept testing, a variable dc power supply was connected on the high voltage; it placed a resistive load on the low-voltage side (Figure 13). The purpose is to show that the output voltage should be one-third of the input voltage without voltage control. In other words, the MOSFETs switch at a fixed duty cycle and a fixed frequency. We also wanted to check whether the voltage across these three capacitors is equal by measuring these Vc1, Vc2, and Vc3. Figure 14 shows some testing waveforms of the voltages Vc3, Vc2, and Vc1 and the output voltage, which is 20 V. Figure 14(a) was taken when the MOSFETs were switching at 2 kHz,
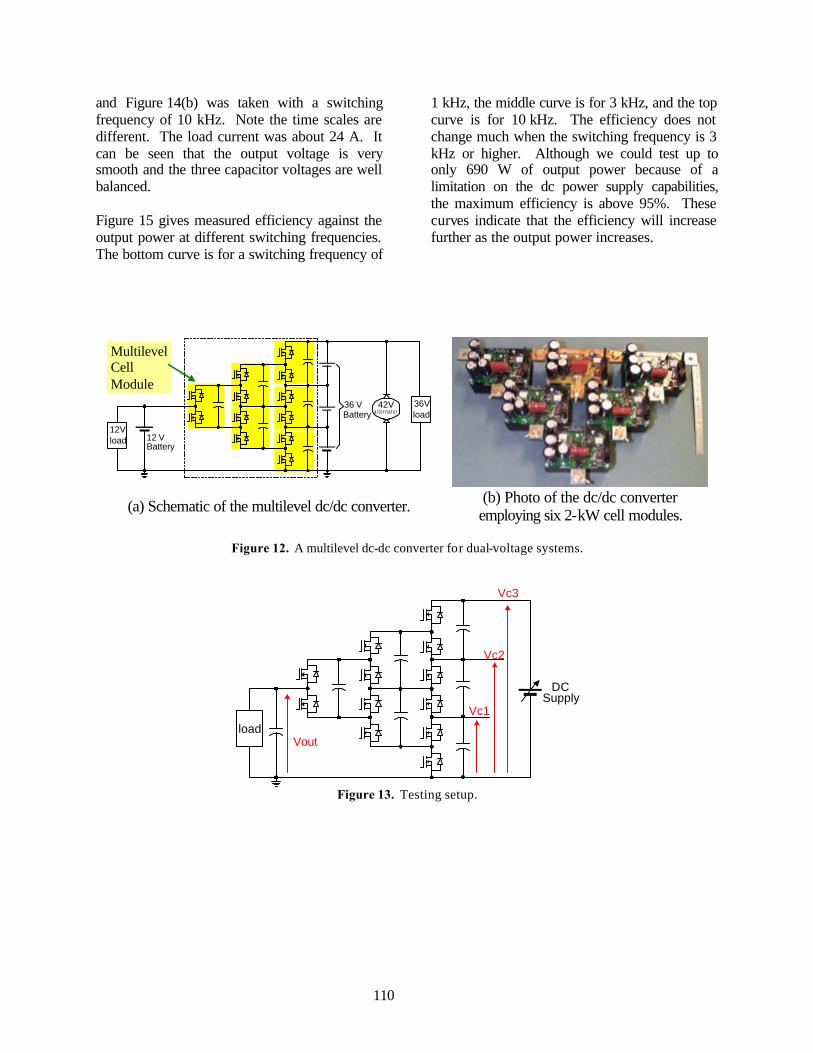
110
and Figure 14(b) was taken with a switching frequency of 10 kHz. Note the time scales are different. The load current was about 24 A. It can be seen that the output voltage is very smooth and the three capacitor voltages are well balanced. Figure 15 gives measured efficiency against the output power at different switching frequencies. The bottom curve is for a switching frequency of
1 kHz, the middle curve is for 3 kHz, and the top curve is for 10 kHz. The efficiency does not change much when the switching frequency is 3 kHz or higher. Although we could test up to only 690 W of output power because of a limitation on the dc power supply capabilities, the maximum efficiency is above 95%. These curves indicate that the efficiency will increase further as the output power increases.
MultilevelCellModule
12 VBattery
36 VBattery
12Vload
42Va l t e r n a t o r
36Vload
(a) Schematic of the multilevel dc/dc converter.
(b) Photo of the dc/dc converter employing six 2-kW cell modules.
Figure 12. A multilevel dc-dc converter for dual-voltage systems.
DCSupply
loadVout
Vc1
Vc2
Vc3
Figure 13. Testing setup.
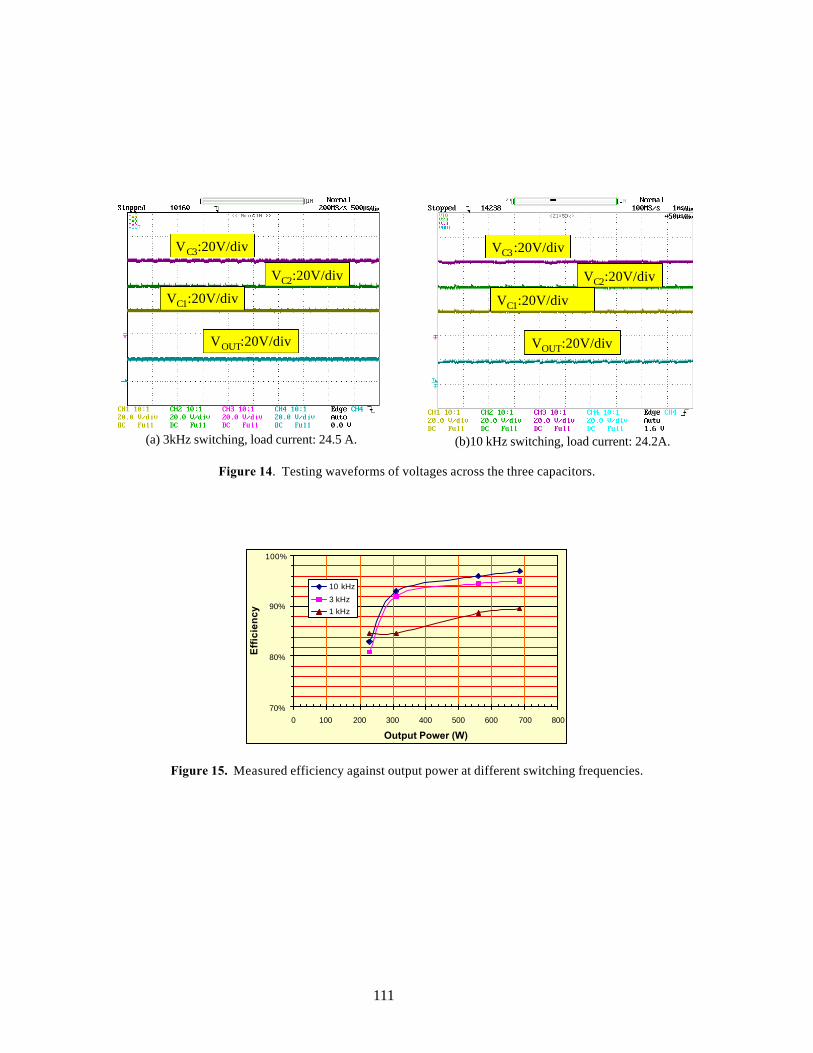
111
VC1:20V/div
VC2:20V/div
VC3:20V/div
VOUT:20V/div
(a) 3kHz switching, load current: 24.5 A.
VC1:20V/div
VC2:20V/div
VC3:20V/div
VOUT:20V/div
(b)10 kHz switching, load current: 24.2A.
Figure 14. Testing waveforms of voltages across the three capacitors.
70%
80%
90%
100%
0 100 200 300 400 500 600 700 800
Output Power (W)
Eff
icie
ncy
10 kHz
3 kHz1 kHz
Figure 15. Measured efficiency against output power at different switching frequencies.
112
Publications During FY 2001 1. G. J. Su and D. J. Adams, “Multilevel DC Link Inverter for Brushless Permanent Magnet
Motors with Very Low Inductance,” pp. 829–34 in IEEE Industry Applications Society 36th Annual Meeting (IAS’01), 2, Chicago, Illinois, September 30–October 5, 2001.
2. G. J. Su, D. J. Adams, and L. M. Tolbert, “Comparative Study of Power Factor Correction
Converters For Single-Phase Half-Bridge Inverters,” pp. 995–1000 in 2001 IEEE Power Electronics Specialist Conference (PESC’01), 2, Vancouver, Canada, June 17–22, 2001.
3. G. J. Su, “Design and Analysis of a Low Cost, High Performance Single Phase UPS System,”
pp. 900–90 in 2001 Applied Power Electronics Conference (APEC’01), 2 (6), Anaheim, California, March 4–8, 2001.
4. G. J. Su, Multilevel DC Link Inverter, ORNL Invention Disclosure–ID 0906, S-96658, U.S.
Patent pending, application 09/853133. 5. G. J. Su, F. Z. Peng and D. J. Adams, Soft Switching Inverter and DC/DC Converter Soft
Switching Inverter and DC/DC Converter, Draft Report, 2000. 6. F. Z. Peng and D. J. Adams, “An Auxiliary Quasi-Resonant Tank Soft-Switching Inverter,”
presented at the IEEE IAS Annual Meeting, Rome, Italy, 2000. 7. F. Z. Peng, “A Generalized Multilevel Inverter Topology with Self Voltage Balancing,”
presented at the IEEE IAS Annual Meeting, Rome, Italy, 2000.
113
Electric Machinery Research & Development John S. Hsu Oak Ridge National Laboratory National Transportation Research Center 2360 Cherahala Boulevard Knoxville, Tennessee 37932 Voice: 865-946-1325; Fax: 865-946-1262; E-mail: [email protected] DOE Program Manager: David Hamilton Voice: (202) 586-2314; Fax(202) 586-1600; E-mail: [email protected] ORNL Technical Advisor: Donald J. Adams Voice: (865) 946-1321; Fax (865) 946-1262; E-mail: [email protected] Objectives
• Reduce cost, weight, and volume. • Improve performance. • Simplify the system. • Optimize thermal management. • Increase reliability.
Approach
• Develop a new type of motor to lower both the motor and inverter costs. • Pursue cooperation with industry.
Accomplishments
• Seven patents have been granted to Oak Ridge National Laboratory (ORNL) through this project. • A prototype of a new motor is being built. • Injected permanent magnet (PM) samples have been produced. • Magnetization equipment has been built.
Future Direction
• Conduct detailed tests on the prototype motor. • Work closely with industry to use the technologies.
114
Introduction The partnership for a new generation of vehicles (PNGV) 2004 cost and weight goals for electric machinery are $4/kW and 2kW/kg, and for inverters, $7/kW and 5kW/kg. The total cost target for both electric machinery and inverters is $11/kW. The development of the motor must consider both the motor and the inverter as one unit to prevent improvement of the motor with an added cost to the inverter. An example of this undesirable situation is the PM motor that has a high power density but also F that adds cost to the inverter. A review of the three types of motors, induction, PM, and switched reluctance, can be used for vehicle drives may help in understanding the ideal properties for motor development. The induction motor (IM) and its inverter make up the best-known drive system. It has the advantage of robustness with a simple field weakening. The drawbacks are the rotor copper loss produced by the rotor current, which makes the direct cooling of the rotor difficult, and the possibility of a lower power factor than that of a PM motor. The PM motor has a relatively high power density, no rotor copper loss, and high efficiency. The undesirable property is its fixed air-gap flux density, which causes it to require more costly power electronics for field weakening. The SRM has a simple and robust structure and no rotor copper loss. However, it is known to have higher vibration and noise levels. The cost of its power electronics is not low because of the duty-cycle nature of its current. In view of these comparisons of existing motors, the desirable properties of a motor are as follows: no rotor copper loss, easy field weakening, robustness, no vibration and noise problems, simple inverter and sensor requirements, adjustable air-gap flux density with an upper limit higher than that of the conventional PM motors, and good cooling accessibility for thermal management. The electric machinery research and development (R&D) in this project focuses on the high-strength undiffused brushless (HSU-B) motor that is expected to provide the desirable properties listed. In addition, advanced copper rotor manufacturing technology is being investigated with a relatively lower priority. HSU-B Motor (patent pending) The HSU-B technology is being developed at ORNL to reduce the total cost of the motor and inverter by incorporating field weakening into the motor. The HSU-B motor uses injected PMs that are made of PM powders mixed with a small portion of epoxy to produce a fixed field. The injected PM reduces the manufacturing cost by eliminating the expensive fabrication process. The fixed PM field can be either enhanced or weakened through a controllable dc field incorporated into the motor. Consequently, the power density is increased when the field is enhanced and fie ld weakening is achieved when the field is reduced. Principle of HSU-B Motor Figure 1 shows two experimental arrangements with different excitation coil locations. The excitation coil in Figure 1(a) is located next to the main air gap. In Figure 1(b), the coil is located
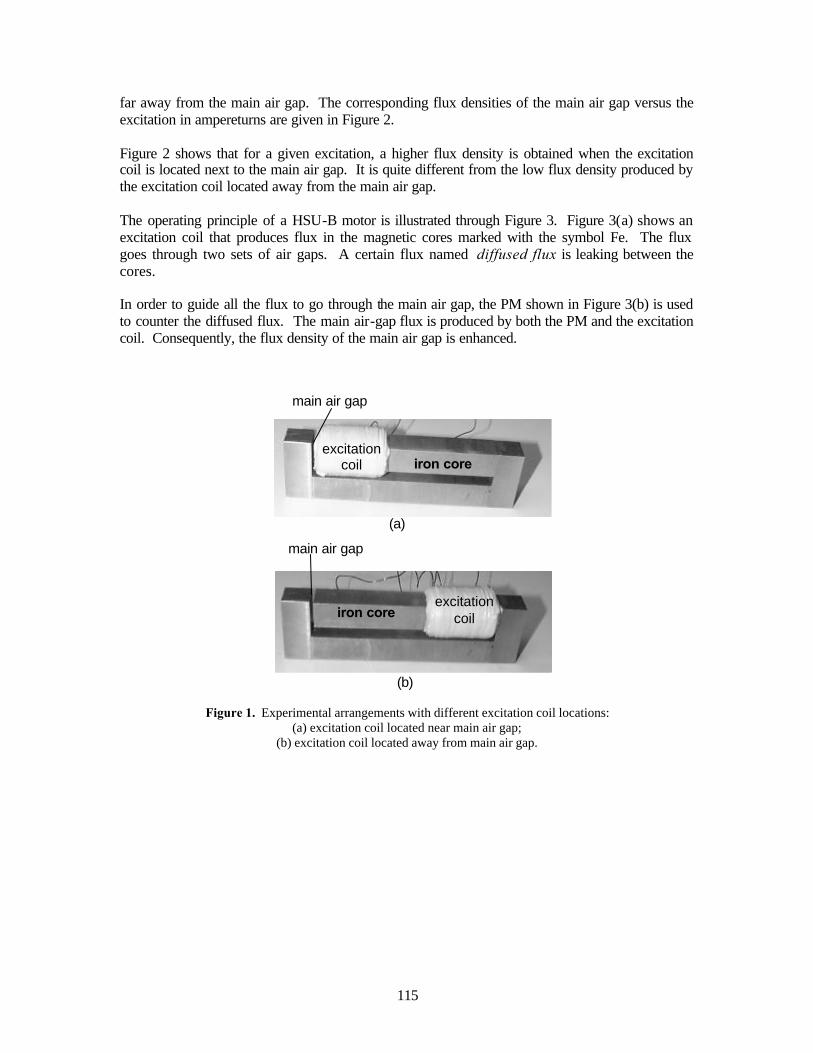
115
far away from the main air gap. The corresponding flux densities of the main air gap versus the excitation in ampereturns are given in Figure 2. Figure 2 shows that for a given excitation, a higher flux density is obtained when the excitation coil is located next to the main air gap. It is quite different from the low flux density produced by the excitation coil located away from the main air gap. The operating principle of a HSU-B motor is illustrated through Figure 3. Figure 3(a) shows an excitation coil that produces flux in the magnetic cores marked with the symbol Fe. The flux goes through two sets of air gaps. A certain flux named diffused flux is leaking between the cores. In order to guide all the flux to go through the main air gap, the PM shown in Figure 3(b) is used to counter the diffused flux. The main air-gap flux is produced by both the PM and the excitation coil. Consequently, the flux density of the main air gap is enhanced.
main air gap
excitationcoiliron core
main air gap
(a)
(b)
excitationcoil iron core
Figure 1. Experimental arrangements with different excitation coil locations:
(a) excitation coil located near main air gap; (b) excitation coil located away from main air gap.
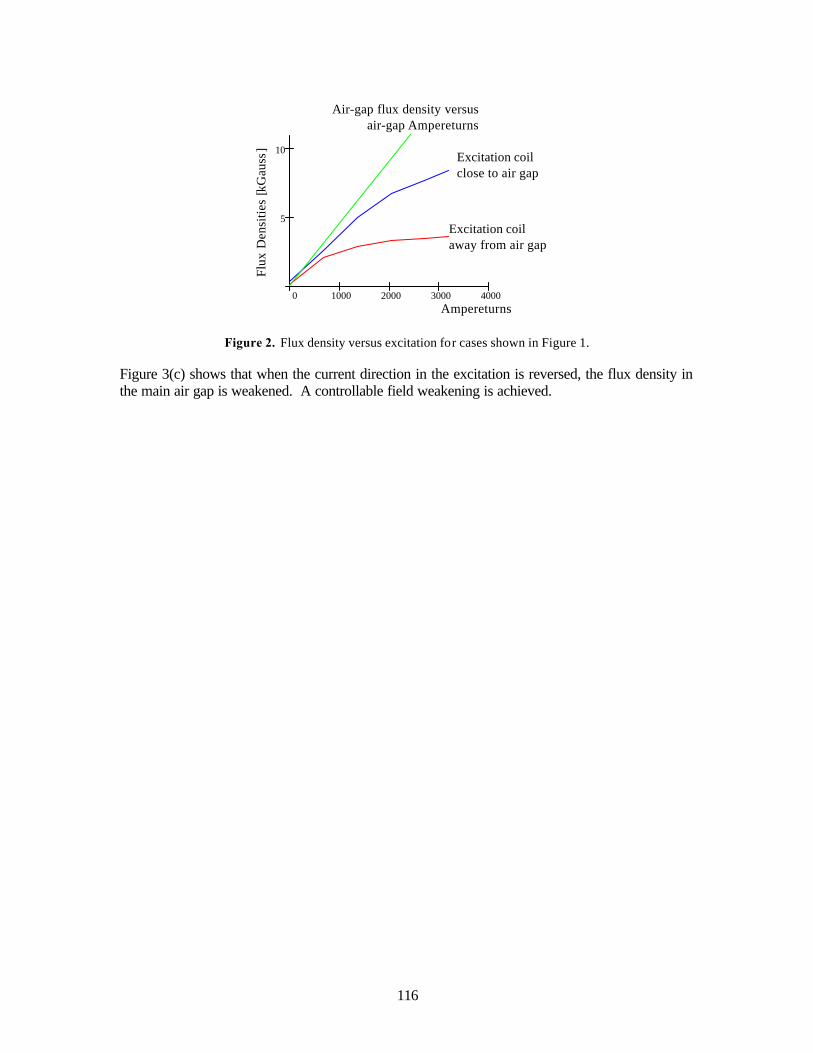
116
0 1000 2000 3000 4000
5
10
Ampereturns
Flux
Den
siti
es [
kGau
ss]
Air-gap flux density versusair-gap Ampereturns
Excitation coilclose to air gap
Excitation coilaway from air gap
Figure 2. Flux density versus excitation for cases shown in Figure 1.
Figure 3(c) shows that when the current direction in the excitation is reversed, the flux density in the main air gap is weakened. A controllable field weakening is achieved.
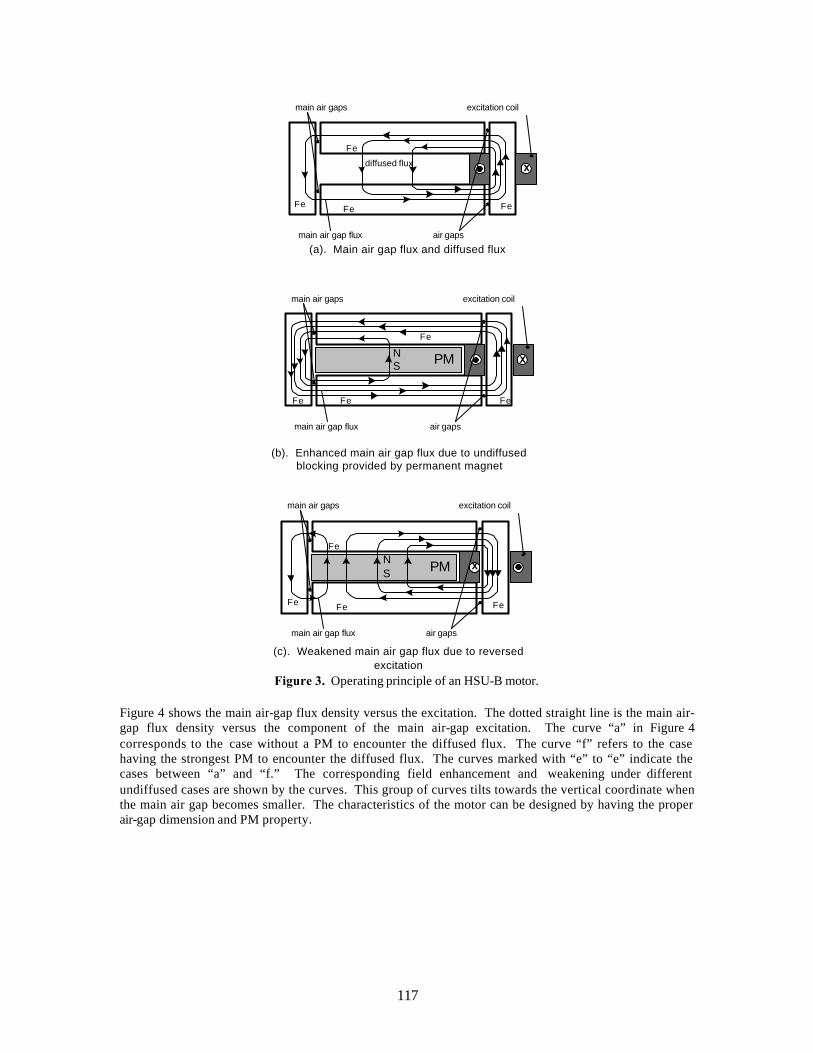
117
X
main air gaps
air gaps
excitation coil
Fe FeFe
Fe
(a). Main air gap flux and diffused flux
diffused flux
main air gap flux
X
main air gaps
air gaps
excitation coil
Fe FeFe
Fe
(b). Enhanced main air gap flux due to undiffusedblocking provided by permanent magnet
main air gap flux
NS PM
X
main air gaps
air gaps
excitation coil
Fe FeFe
Fe
(c). Weakened main air gap flux due to reversedexcitation
main air gap flux
NS PM
Figure 3. Operating principle of an HSU-B motor.
Figure 4 shows the main air-gap flux density versus the excitation. The dotted straight line is the main air-gap flux density versus the component of the main air-gap excitation. The curve “a” in Figure 4 corresponds to the case without a PM to encounter the diffused flux. The curve “f” refers to the case having the strongest PM to encounter the diffused flux. The curves marked with “e” to “e” indicate the cases between “a” and “f.” The corresponding field enhancement and weakening under different undiffused cases are shown by the curves. This group of curves tilts towards the vertical coordinate when the main air gap becomes smaller. The characteristics of the motor can be designed by having the proper air-gap dimension and PM property.
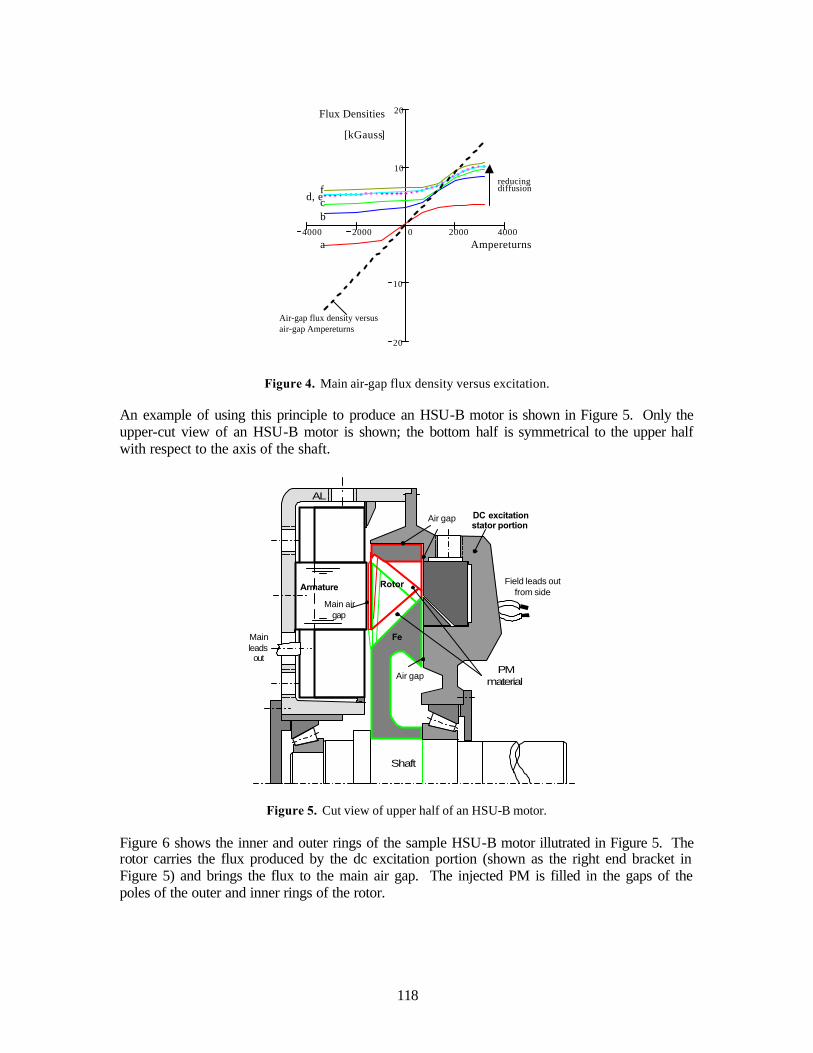
118
4000 2000 0 2000 4000
20
10
10
20
Ampereturns
Flux Densities
[kGauss]
Air-gap flux density versusair-gap Ampereturns
reducingdiffusion
a
bcd, ef
Figure 4. Main air-gap flux density versus excitation.
An example of using this principle to produce an HSU-B motor is shown in Figure 5. Only the upper-cut view of an HSU-B motor is shown; the bottom half is symmetrical to the upper half with respect to the axis of the shaft.
AL
Mainleadsout
Field leads outfrom side
Air gap
Main airgap
Air gap
FeFe
Armature Rotor
DC excitationstator portion
PMmaterial
Shaft
Figure 5. Cut view of upper half of an HSU-B motor. Figure 6 shows the inner and outer rings of the sample HSU-B motor illutrated in Figure 5. The rotor carries the flux produced by the dc excitation portion (shown as the right end bracket in Figure 5) and brings the flux to the main air gap. The injected PM is filled in the gaps of the poles of the outer and inner rings of the rotor.
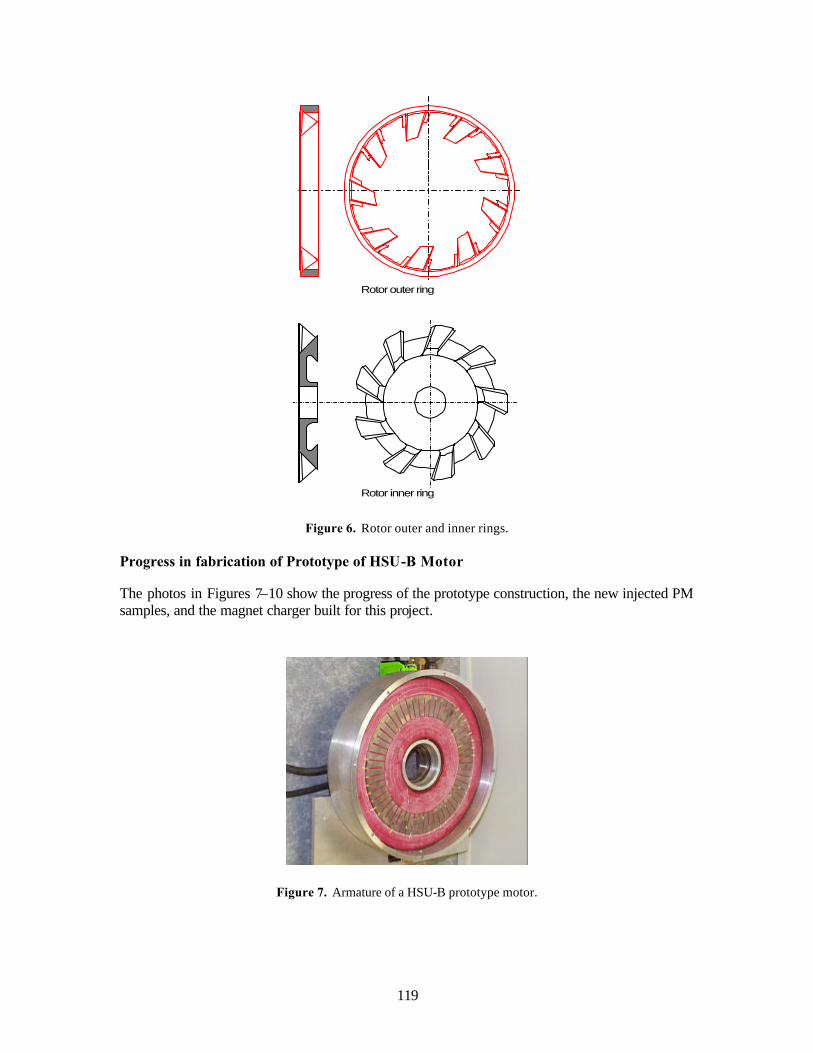
119
Rotor outer ring
Rotor inner ring
Figure 6. Rotor outer and inner rings.
Progress in fabrication of Prototype of HSU-B Motor The photos in Figures 7–10 show the progress of the prototype construction, the new injected PM samples, and the magnet charger built for this project.
Figure 7. Armature of a HSU-B prototype motor.
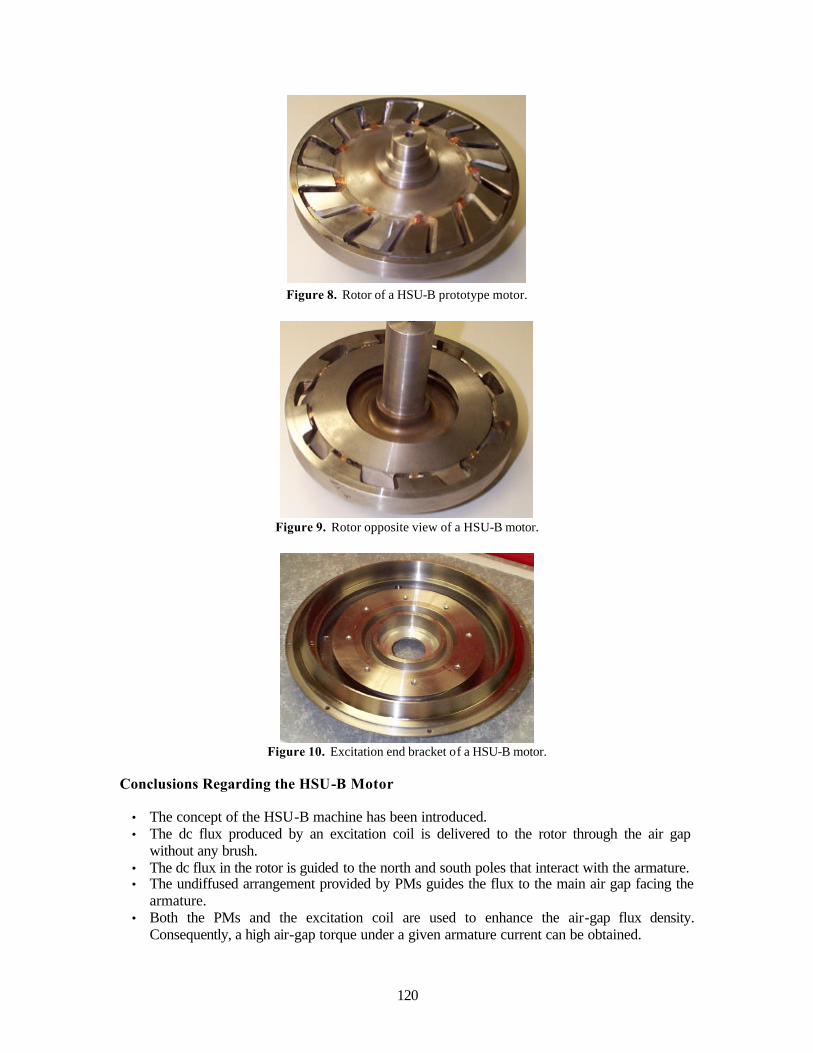
120
Figure 8. Rotor of a HSU-B prototype motor.
Figure 9. Rotor opposite view of a HSU-B motor.
Figure 10. Excitation end bracket of a HSU-B motor.
Conclusions Regarding the HSU-B Motor
• The concept of the HSU-B machine has been introduced. • The dc flux produced by an excitation coil is delivered to the rotor through the air gap
without any brush. • The dc flux in the rotor is guided to the north and south poles that interact with the armature. • The undiffused arrangement provided by PMs guides the flux to the main air gap facing the
armature. • Both the PMs and the excitation coil are used to enhance the air-gap flux density.
Consequently, a high air-gap torque under a given armature current can be obtained.
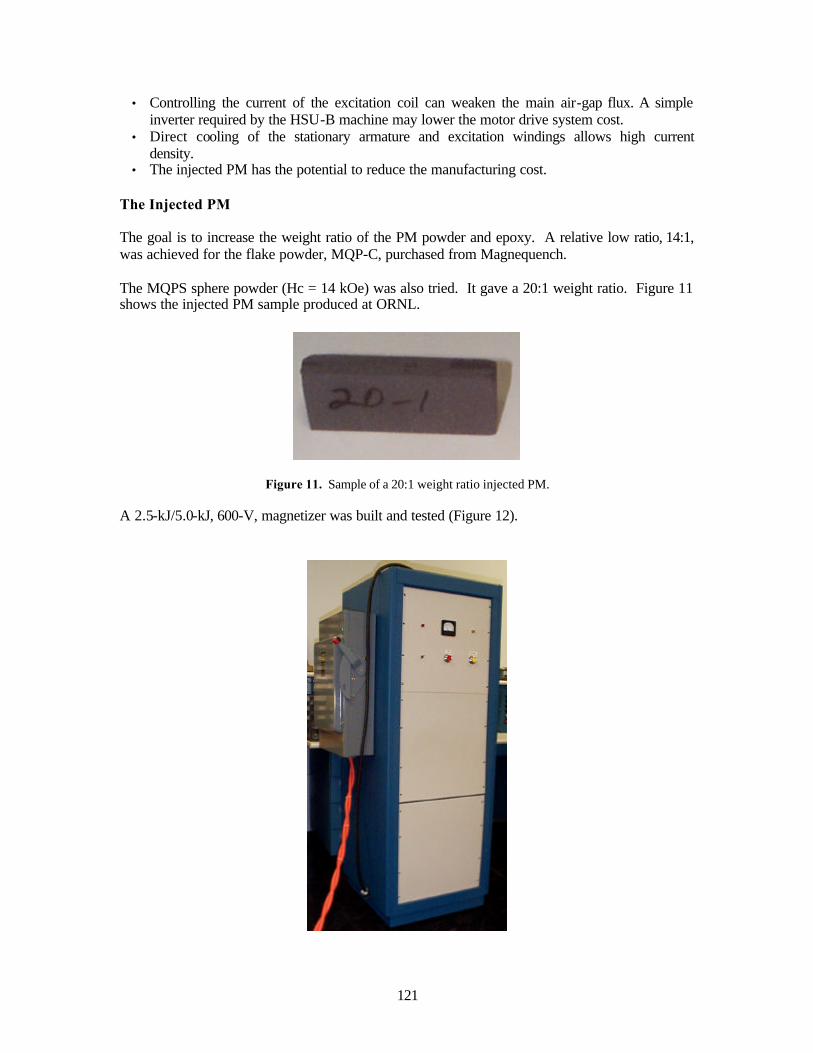
121
• Controlling the current of the excitation coil can weaken the main air-gap flux. A simple inverter required by the HSU-B machine may lower the motor drive system cost.
• Direct cooling of the stationary armature and excitation windings allows high current density.
• The injected PM has the potential to reduce the manufacturing cost. The Injected PM The goal is to increase the weight ratio of the PM powder and epoxy. A relative low ratio, 14:1, was achieved for the flake powder, MQP-C, purchased from Magnequench. The MQPS sphere powder (Hc = 14 kOe) was also tried. It gave a 20:1 weight ratio. Figure 11 shows the injected PM sample produced at ORNL.
Figure 11. Sample of a 20:1 weight ratio injected PM. A 2.5-kJ/5.0-kJ, 600-V, magnetizer was built and tested (Figure 12).

122
Figure 12. A 2.5-kJ/5.0-kJ, 600-V magnetizer. Progress in Copper Rotor Task For the friction-weld method, we have developed a method of manufacturing squirrel cage rotors, (U.S. Patent No. 6,088,906). Figure 13 shows the rotor core with the copper bars inserted in the slots. The aluminum end rings are welded to the copper bars through new methods developed at ORNL. The completed prototype rotor is shown in Figure 14.
Figure 13. Copper bars are inserted into a rotor core.
Laminatedrotor core with
copper bars
Aluminumend ring
Figure 14. A copper-bar rotor with aluminum end rings.
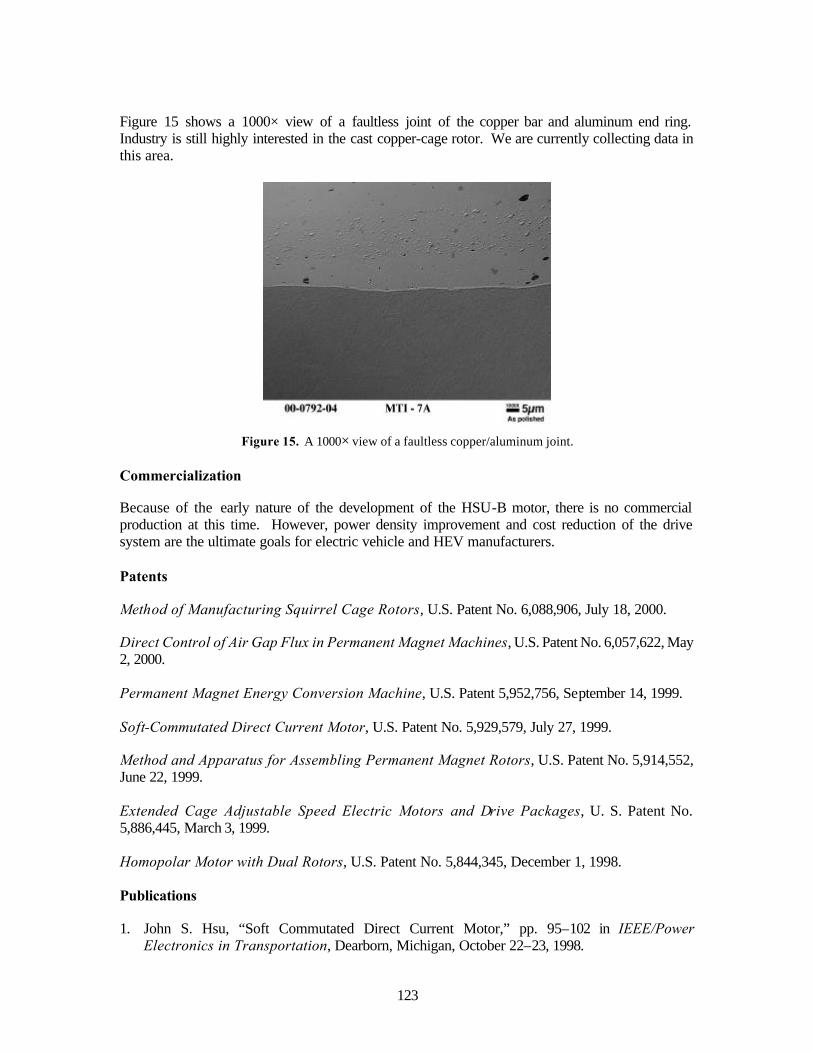
123
Figure 15 shows a 1000× view of a faultless joint of the copper bar and aluminum end ring. Industry is still highly interested in the cast copper-cage rotor. We are currently collecting data in this area.
Figure 15. A 1000× view of a faultless copper/aluminum joint.
Commercialization Because of the early nature of the development of the HSU-B motor, there is no commercial production at this time. However, power density improvement and cost reduction of the drive system are the ultimate goals for electric vehicle and HEV manufacturers. Patents Method of Manufacturing Squirrel Cage Rotors, U.S. Patent No. 6,088,906, July 18, 2000. Direct Control of Air Gap Flux in Permanent Magnet Machines, U.S. Patent No. 6,057,622, May 2, 2000. Permanent Magnet Energy Conversion Machine, U.S. Patent 5,952,756, September 14, 1999. Soft-Commutated Direct Current Motor, U.S. Patent No. 5,929,579, July 27, 1999. Method and Apparatus for Assembling Permanent Magnet Rotors, U.S. Patent No. 5,914,552, June 22, 1999. Extended Cage Adjustable Speed Electric Motors and Drive Packages, U. S. Patent No. 5,886,445, March 3, 1999. Homopolar Motor with Dual Rotors, U.S. Patent No. 5,844,345, December 1, 1998. Publications 1. John S. Hsu, “Soft Commutated Direct Current Motor,” pp. 95–102 in IEEE/Power
Electronics in Transportation, Dearborn, Michigan, October 22–23, 1998.
124
2. John S. Hsu, “Hybrid-Secondary Uncluttered Induction (HSU-I) Machines,” pp. 361–365 in
IEEE Transactions on Energy Conversion, 16 (2), ITCNE4, (ISSN 0885-8969), June 2001. 3. John S. Hsu, “Direct Control of Air-Gap Flux in Permanent-Magnet Machines,” pp. 361–365
in PES/IEEE Transactions on Energy Conversions, 15 (4), December 2000. 4. John S. Hsu, “A Machine Approach for Field Weakening of Permanent-Magnet Motors,”
2000 Future Car Congress, Paper No. 2000-01-1549, Society of Automotive Engineers, April 2–6, 2000.
5. John S. Hsu, “Flux Guides for Permanent-Magnet Machines,” pp. 186–191 in IEEE
Transactions on Energy Conversion, 16 (2), ITCNE4, (ISSN 0885-8969), June 2001.
125
Real-Time Platform for the Evaluation of Electric Machinery Control Algorithms John Chiasson The University of Tennessee Knoxville, Tennessee 37996-2100 Voice: (865)-974-0627; Fax: (865)-974-5483; E-mail: chiasson@utk .edu Leon Tolbert Oak Ridge National Laboratory National Transportation Research Center 2360 Cherahala Boulevard Knoxville, Tennessee 37932 Voice: (865)-946-1332; Fax: (865)-946-1262; E-mail: [email protected] DOE Program Manager: David Hamilton Voice: (202) 586-2314; Fax: (202) 586-1600; E-mail: [email protected] ORNL Technical Advisor: Donald J. Adams Voice: (865) 946-1321; Fax (865) 946-1262; E-mail: [email protected] Objective
• Develop and test advanced control and modeling algorithms for the various types of motor drives considered for hybrid electric vehicles (HEVs).
Approach
• Prepare a library of SIMULINK control/modeling algorithm blocks that can be easily implemented in a real-time test environment for induction motors (IMs), switched dc reluctance motors (SRMs), and permanent magnet synchronous motors (PMSMs).
• Bypass the need for specialized programming in C or assembly languages so that investigators can spend their time intensively studying proposed control algorithms.
Accomplishments
• Set up computer control and data acquisition hardware. Assembled motor drive (current sensors, power supply, and amplifier) and motor test stand (test motor, torque sensor, and load motor).
• Developed a library of SIMULINK files for the feedback control of SRMs and PMSMs. Future Directions
• Develop a set of sophisticated computer algorithms (SIMULINK files) that include sensorless techniques for IM drives, automatic machine parameter identification, and automatic tuning of controller parameters.
Introduction This paper describes the development of a
SIMULINK library of control and modeling algorithms for the various types of motor drives considered for HEVs. The algorithms are given
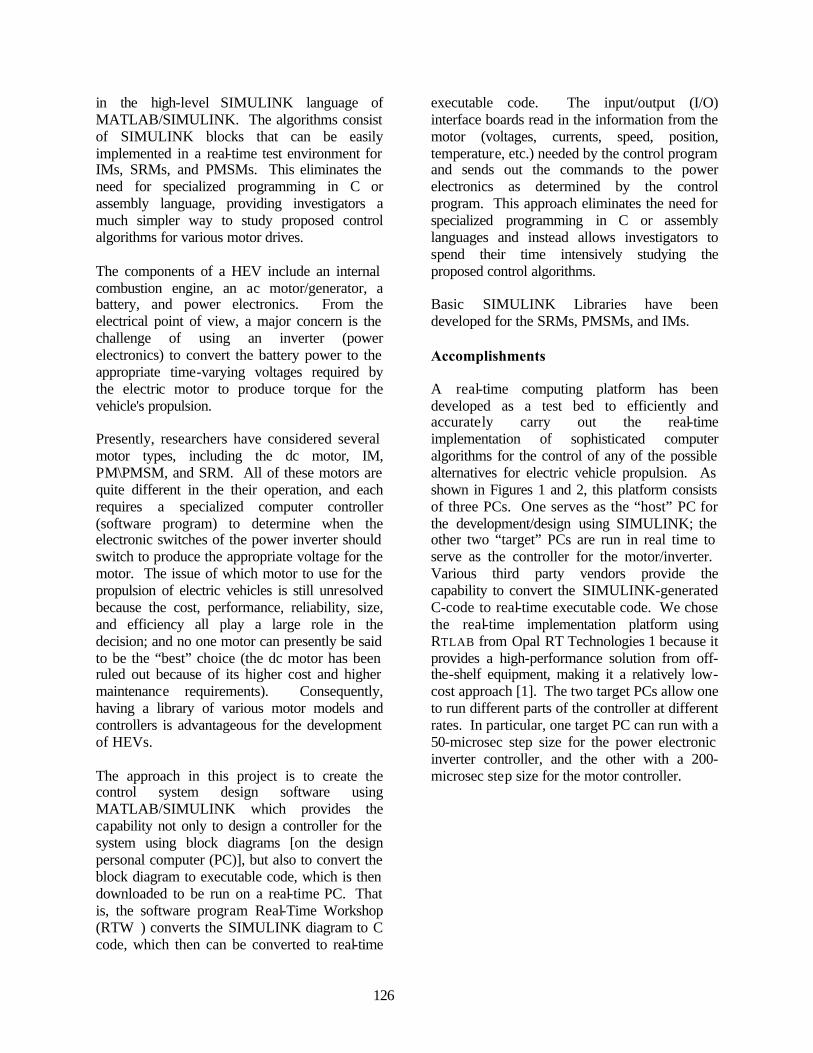
126
in the high-level SIMULINK language of MATLAB/SIMULINK. The algorithms consist of SIMULINK blocks that can be easily implemented in a real-time test environment for IMs, SRMs, and PMSMs. This eliminates the need for specialized programming in C or assembly language, providing investigators a much simpler way to study proposed control algorithms for various motor drives. The components of a HEV include an internal combustion engine, an ac motor/generator, a battery, and power electronics. From the electrical point of view, a major concern is the challenge of using an inverter (power electronics) to convert the battery power to the appropriate time-varying voltages required by the electric motor to produce torque for the vehicle's propulsion. Presently, researchers have considered several motor types, including the dc motor, IM, PM\PMSM, and SRM. All of these motors are quite different in the their operation, and each requires a specialized computer controller (software program) to determine when the electronic switches of the power inverter should switch to produce the appropriate voltage for the motor. The issue of which motor to use for the propulsion of electric vehicles is still unresolved because the cost, performance, reliability, size, and efficiency all play a large role in the decision; and no one motor can presently be said to be the “best” choice (the dc motor has been ruled out because of its higher cost and higher maintenance requirements). Consequently, having a library of various motor models and controllers is advantageous for the development of HEVs. The approach in this project is to create the control system design software using MATLAB/SIMULINK which provides the capability not only to design a controller for the system using block diagrams [on the design personal computer (PC)], but also to convert the block diagram to executable code, which is then downloaded to be run on a real-time PC. That is, the software program Real-Time Workshop (RTW) converts the SIMULINK diagram to C code, which then can be converted to real-time
executable code. The input/output (I/O) interface boards read in the information from the motor (voltages, currents, speed, position, temperature, etc.) needed by the control program and sends out the commands to the power electronics as determined by the control program. This approach eliminates the need for specialized programming in C or assembly languages and instead allows investigators to spend their time intensively studying the proposed control algorithms. Basic SIMULINK Libraries have been developed for the SRMs, PMSMs, and IMs. Accomplishments A real-time computing platform has been developed as a test bed to efficiently and accurately carry out the real-time implementation of sophisticated computer algorithms for the control of any of the possible alternatives for electric vehicle propulsion. As shown in Figures 1 and 2, this platform consists of three PCs. One serves as the “host” PC for the development/design using SIMULINK; the other two “target” PCs are run in real time to serve as the controller for the motor/inverter. Various third party vendors provide the capability to convert the SIMULINK-generated C-code to real-time executable code. We chose the real-time implementation platform using RTLAB from Opal RT Technologies 1 because it provides a high-performance solution from off-the-shelf equipment, making it a relatively low-cost approach [1]. The two target PCs allow one to run different parts of the controller at different rates. In particular, one target PC can run with a 50-microsec step size for the power electronic inverter controller, and the other with a 200-microsec step size for the motor controller.

127
Figure 1.
Figure 2. The SRM The SRM has been proposed as an alternative for electrical vehicle propulsion because its simple structure makes it not only cheap to manufacture, but also rugged and durable. However, this advantage is currently overshadowed by the difficulty in controlling it. The SRM is unlike induction, synchronous, and dc motors, in that its characterization (mathematical model) is quite difficult to determine and work with to develop control
algorithms. This is because its flux/torque model is a non-parametric nonlinear function of the motor current and position. Consequently, this function must be determined in tabular form.
The evaluation platform can be a powerful tool to automatically characterize (model) and control SRM drive system for HEVs. The basic library consists of computer algorithms (SIMULINK programs) that provide
Host PCwith
SimulationSoftware
Target #2ConverterController
DCPowerSupply
Inverter
MotorTestI/O
+ -
a
cb
MotorLoad
Target #1Motor
Controller

128
• Automatic identification of the ith phase torque function τi(nRθ, i);
• Automatic identification of Rs, J; and • A motor controller (software algorithm)
that determines the currents ia, ib, ic needed at each instant in time so that the motor produces the requisite torque.
The algorithms in the SIMULINK library used to specify torque and current are those described in Refs. [2 and 3]. The top level of the SIMULINK blocks used for the SRM is shown in the Figure 3. In this figure, the SR_motorSR_motor
block represents the simulation of the motor itself. The ControllerController block uses the feedback from the currents and position to compute the voltage to the amplifier. For real-time implementation, the SR_motorSR_motor block is deleted and replaced with appropriate I/O blocks from the Opal RT library. (This will be illustrated in the section on PMSMs). To illustrate the complexity of the controller for the SRM, a series of inner blocks are shown.
Figure 3. Clicking on the ControllerController block opens it up to give the set of blocks
shown below in Figure 4.
Figure 4. Second level of the SIMULINK model of the SRM.
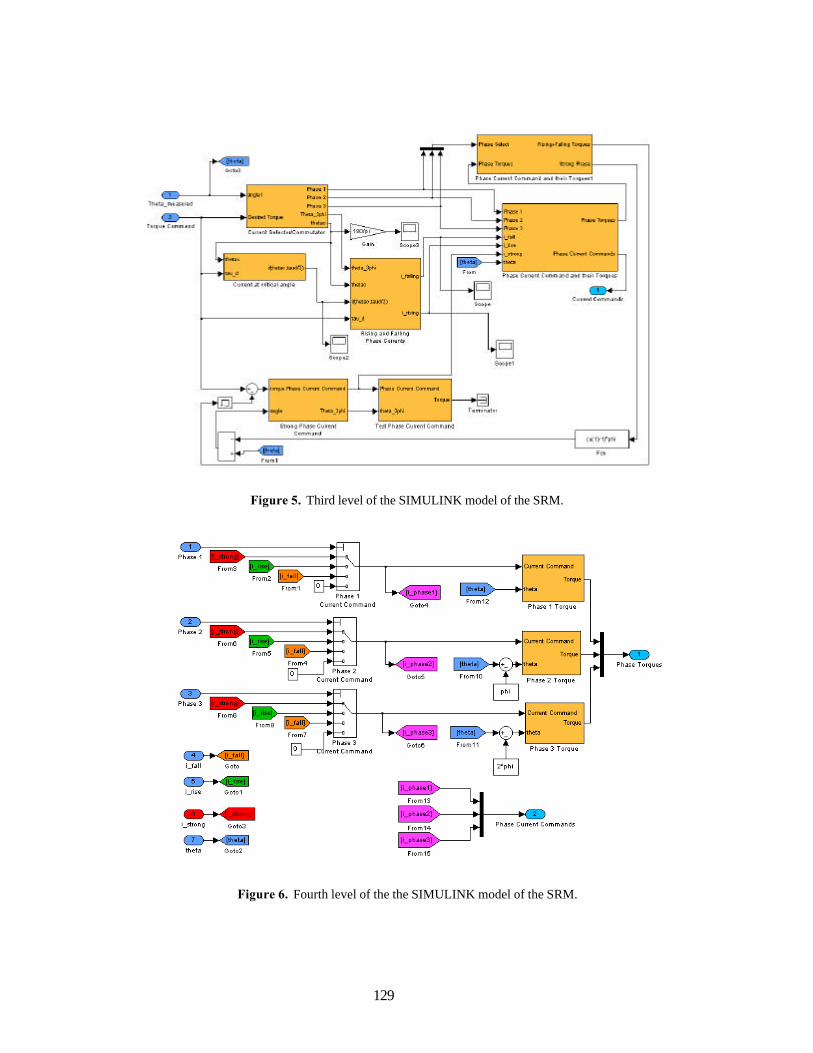
129
Figure 5. Third level of the SIMULINK model of the SRM.
Figure 6. Fourth level of the the SIMULINK model of the SRM.
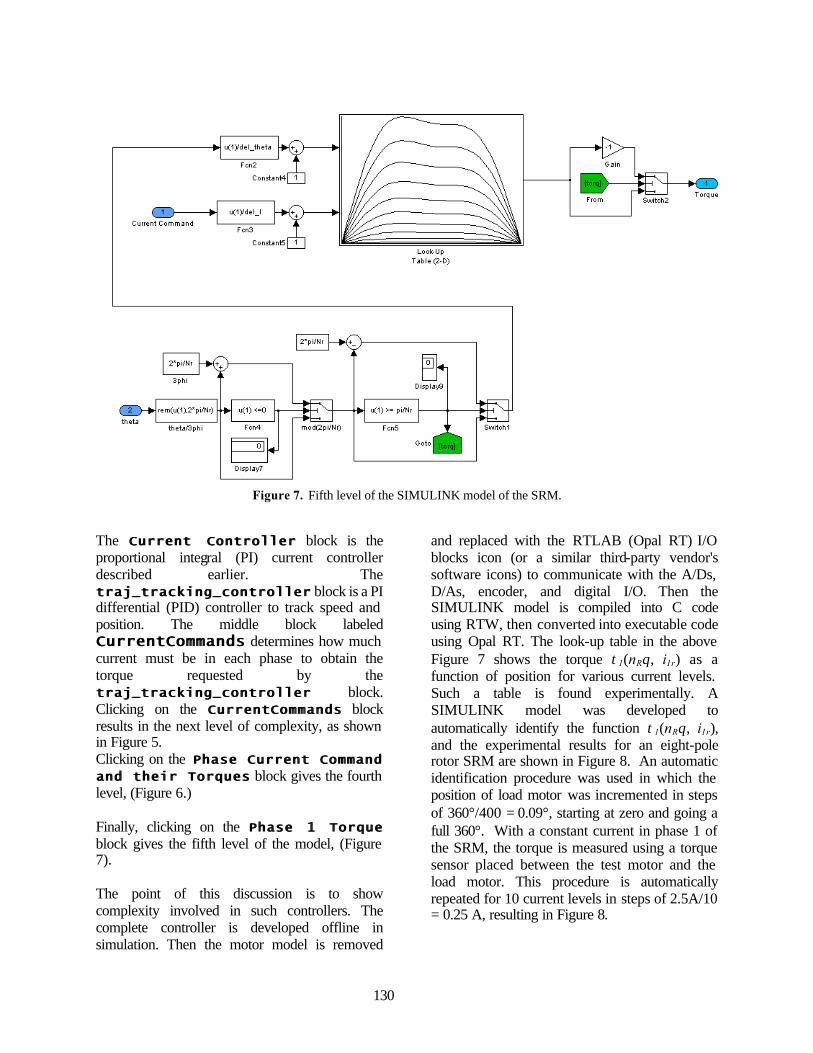
130
Figure 7. Fifth level of the SIMULINK model of the SRM.
The Current ControllerCurrent Controller block is the proportional integral (PI) current controller described earlier. The traj_tracking_controllertraj_tracking_controller block is a PI differential (PID) controller to track speed and position. The middle block labeled CurrentCommandsCurrentCommands determines how much current must be in each phase to obtain the torque requested by the traj_tracking_controllertraj_tracking_controller block. Clicking on the CurrentCommandsCurrentCommands block results in the next level of complexity, as shown in Figure 5. Clicking on the Phase Current Command Phase Current Command
and their Torquesand their Torques block gives the fourth level, (Figure 6.) Finally, clicking on the Phase 1 TorquePhase 1 Torque block gives the fifth level of the model, (Figure 7). The point of this discussion is to show complexity involved in such controllers. The complete controller is developed offline in simulation. Then the motor model is removed
and replaced with the RTLAB (Opal RT) I/O blocks icon (or a similar third-party vendor's software icons) to communicate with the A/Ds, D/As, encoder, and digital I/O. Then the SIMULINK model is compiled into C code using RTW, then converted into executable code using Opal RT. The look-up table in the above Figure 7 shows the torque τ1(nRθ, i1r) as a function of position for various current levels. Such a table is found experimentally. A SIMULINK model was developed to automatically identify the function τ1(nRθ, i1r), and the experimental results for an eight-pole rotor SRM are shown in Figure 8. An automatic identification procedure was used in which the position of load motor was incremented in steps of 360°/400 = 0.09°, starting at zero and going a full 360°. With a constant current in phase 1 of the SRM, the torque is measured using a torque sensor placed between the test motor and the load motor. This procedure is automatically repeated for 10 current levels in steps of 2.5A/10 = 0.25 A, resulting in Figure 8.
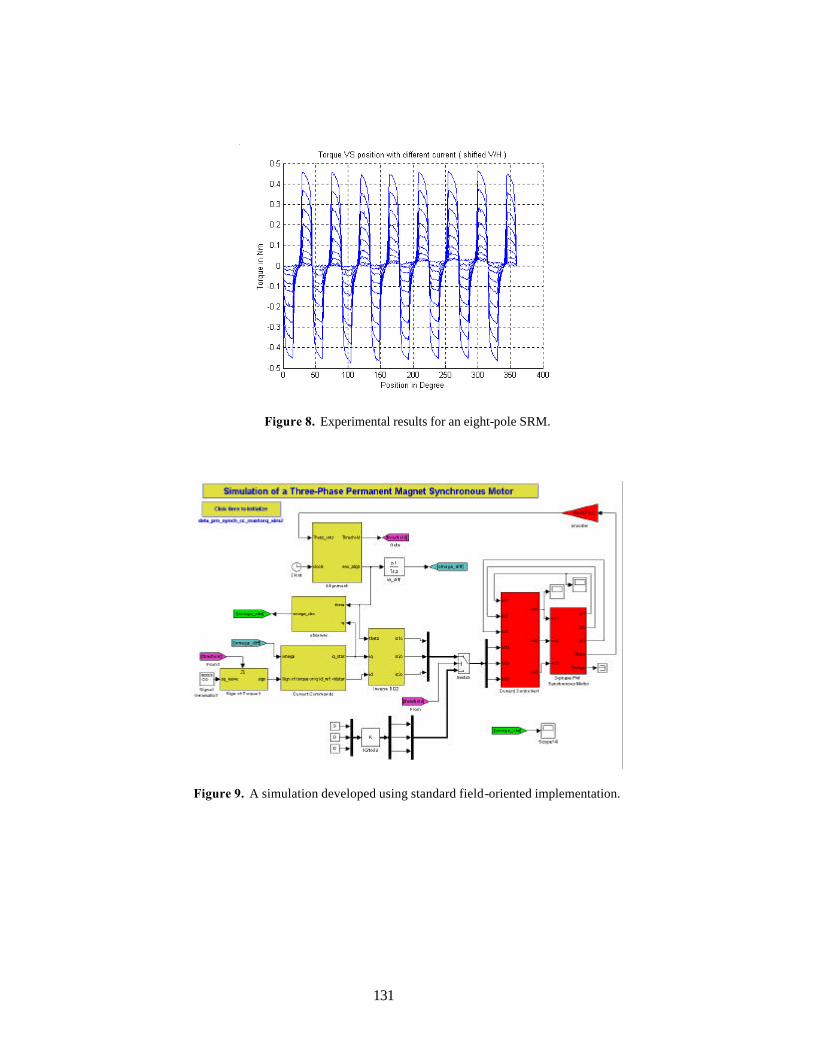
131
Figure 8. Experimental results for an eight-pole SRM.
Figure 9. A simulation developed using standard field-oriented implementation.

132
Figure 10. First level in converting a SIMULINK simulation to real time.
Figure 11. Second level in converting a SIMULINK simulation to real time.
PMSM A basic library of SIMULINK blocks has also been developed for the PMSM. Figure 9 shows a simulation that was developed using standard field-oriented implementation. The simulation of the motor is shown on the right side while the simulation of the controller is shown on the left side. Figure 10 shows the first step in converting such a standard offline SIMULINK simulation to real time. The block labeled SM_MasterSM_Master contains the controller blocks from Figure 9.
Clicking on this SM-Master gives the block diagram in Figure 11. This should be compared with Figure 9, as appropriate I/O blocks have replaced the SIMULINK blocks of the motor/amplifier. An experimental run in which the speed was brought up from zero to 600 rads/sec and back to zero is shown in Figure 12. The speed was computed by differentiating the feedback from the optical encoder. Figures 13 and 14 show, respectively, the speed computed using a speed observer and the current required for the experimental runs.
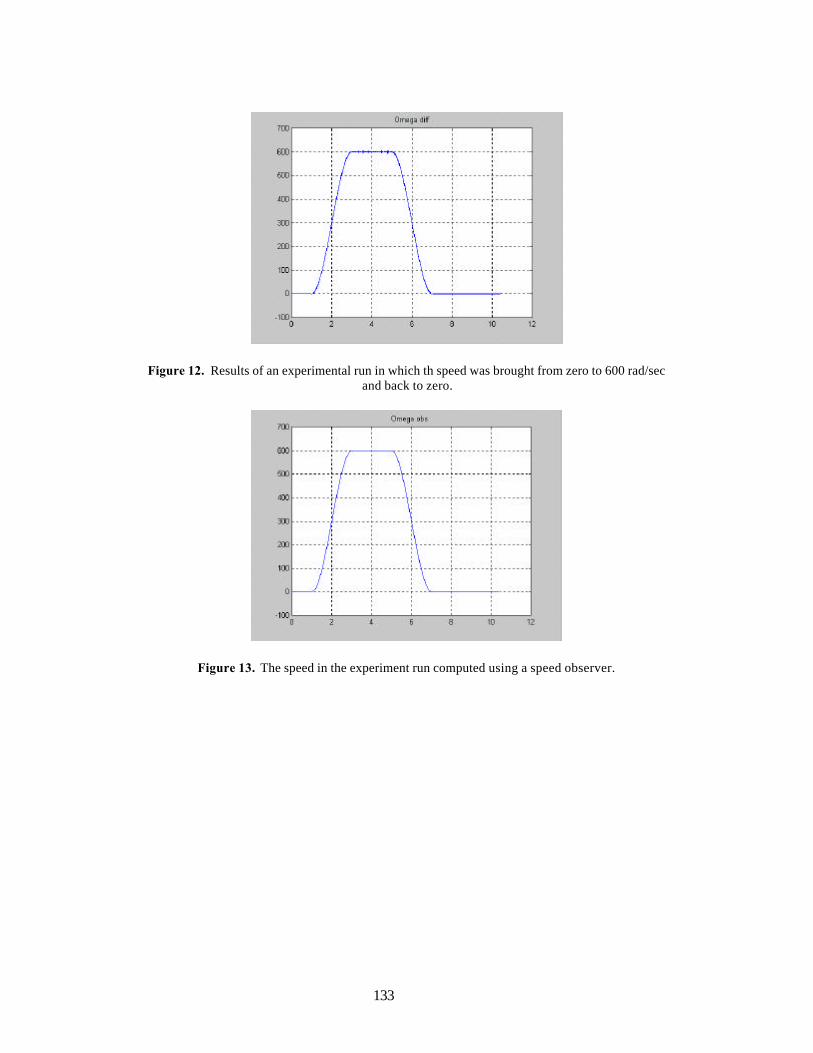
133
Figure 12. Results of an experimental run in which th speed was brought from zero to 600 rad/sec and back to zero.
Figure 13. The speed in the experiment run computed using a speed observer.
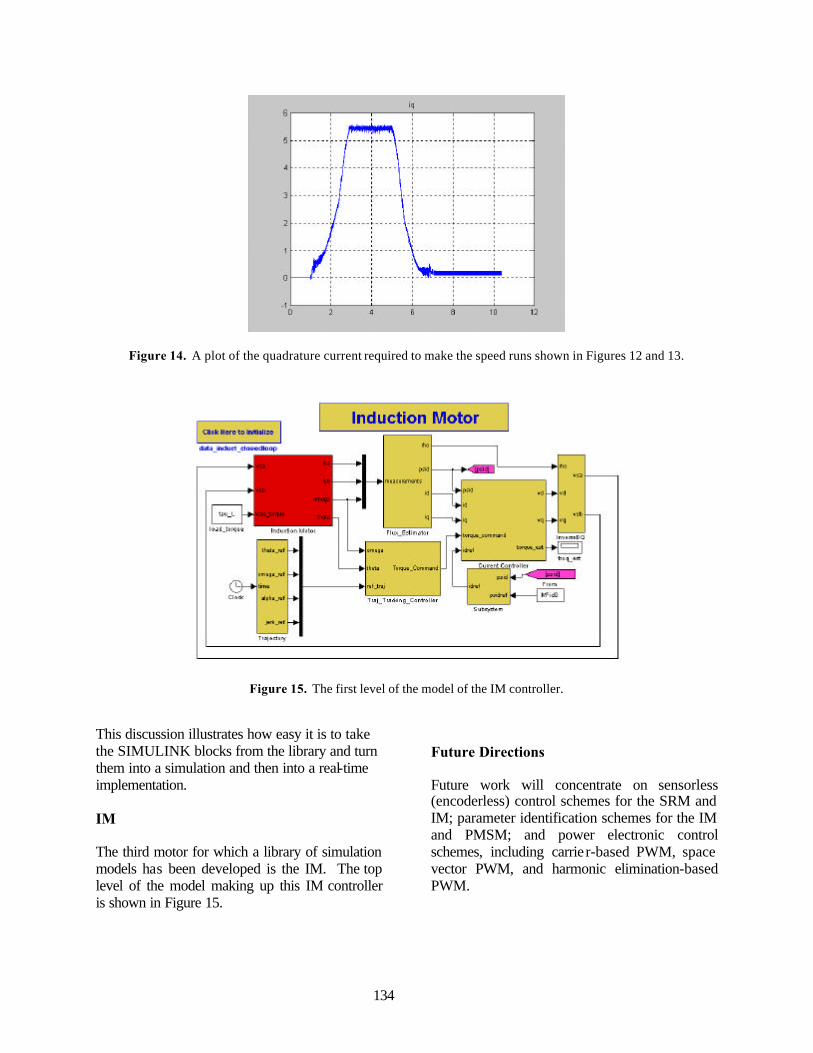
134
Figure 14. A plot of the quadrature current required to make the speed runs shown in Figures 12 and 13.
Figure 15. The first level of the model of the IM controller.
This discussion illustrates how easy it is to take the SIMULINK blocks from the library and turn them into a simulation and then into a real-time implementation. IM The third motor for which a library of simulation models has been developed is the IM. The top level of the model making up this IM controller is shown in Figure 15.
Future Directions Future work will concentrate on sensorless (encoderless) control schemes for the SRM and IM; parameter identification schemes for the IM and PMSM; and power electronic control schemes, including carrie r-based PWM, space vector PWM, and harmonic elimination-based PWM.
135
Publications/References 1. Opal RT Technologies, RT-LAB Real Time
Laboratory Users Manual Ver 3.4, Montreal, Canada, February 14, 2000.
2. D. G. Taylor, “An Experimental Study on
Composite Control of Switched Reluctance Motors,” IEEE Control Systems, February 1991.
3. R. S. Wallace and D. G. Taylor, “A
Balanced Commutator for Switched Reluctance Motors to Reduce Torque Ripple,” IEEE Transactions on Power Electronics, 7(4), October 1992.
4. W. Leonhard, Control of Electrical Drives,
Second Edition, Springer Verlag, Berlin, 1990.
5. M. Bodson, J. N. Chiasson, R. T.
Novotnak, and R. B. Rekowski, “High-Performance Nonlinear Feedback Control of a Permanent Magnet Stepper Motor,” pp. 5–14 in IEEE Trans. on Control Systems Technology, 1(1), 1993.
6. W. Leonhard, Control of Electrical Drives,
Springer Verlag, Berlin, 1990. 7. A. Blauch, M. Bodson, and J. Chiasson,
“High-Speed Parameter Estimation of Stepper Motors,” pp. 270–279 in IEEE Trans. on Control Systems Technology, 1(4), 1993.
8. M. Bodson, J. Chiasson and R. T.
Novotnak, “A Systematic Approach to Selecting Optimal Flux References in Induction Motors,” pp. 388–397 in IEEE Trans. Control Systems Technology, 3(4), 1995.
9. J. S. Lawler, J. M. Bailey, and J. W.
McKeever, Extended Constant Power Speed Range of the Brushless DC\ Motor Through Dual Mode Inverter Control, Report ORNL/TM-2000/130, Oak Ridge National Laboratory, 2000.
10. A. Verl and M. Bodson, “Torque
Maximization for Permanent Magnet Synchronous Motors,” pp. 740–745 in IEEE Trans. on Control Systems Technology, 6(6), 1998.
11. M. Bodson, J. N. Chiasson, and L. M.
Tolbert, "A Complete Characterization of Torque Maximization of Permanent Magnet Non-Salient Synchronous Motors," IEEE American Controls Conference, June 25–27, 2001, Arlington, Virginia.
12. J. N. Chiasson and L. M. Tolbert, "High
Performance Motion Control of a Switched Reluctance Motor," pp. 425–429 in IEEE International Electric Machine Drives Conference, June 17–20, 2001, Cambridge, Massachusetts.
136
HEV Motor Inverter Modeling John W. McKeever Oak Ridge National Laboratory National Transportation Research Center 2360 Cherahala Boulevard Knoxville, Tennessee 37932 Voice: (865)-946-1316; Fax (865)-946-1262; E-mail:[email protected] DOE Program Manager: David Hamilton Voice: (202) 586-2314; Fax: (202) 586-1600; E-mail: [email protected] ORNL Technical Advisor: Donald J. Adams Voice: (865) 946-1321; Fax (865) 946-1262; E-mail: [email protected] Objectives
• Provide an interactive, physics-based methodology to evaluate hybrid electric vehicle (HEV) drive system candidates, in the form of interactive application independent computer models.
• Using that methodology, develop models to simulate performance and interaction between the environment, the inverter, and either an induction motor (IM), permanent magnet (PM) motor, or switched reluctance motor (SRM) as a user-friendly tool for HEV drive system research and development at Oak Ridge National Laboratory's (ORNL) Power Electronics and Electric Machinery Research Center (PEEMRC) and within the HEV development community.
Approach
• Develop a tool to – Enable the PEEMRC to evaluate proposed basic HEV drive system designs; – Support the PEEMRC's quantification of HEV drive system improvements; – Expose dangerous or unacceptable operating conditions; – Support analysis of HEV drive system test results and diagnosis of test problems in the
PEEMRC's internal motor development program and during ORNL's independent evaluation of automotive integrated power module (AIPM) and automotive electric motor drive (AEMD) components;
– Be application-independent and executable on PCs or Macintosh computers; – Be capable of generating data in a form that may be used to represent the drive system in
Department of Energy's (DOE) full-vehicle simulation codes; – Be available to the PNGV and HEV developers.
• Build models around LabVIEW's Application Builder and provide them as a user-interactive file containing performance evaluation modules that can be run independently or in conjunction with design modules (methodology established in 1999).
• Design and refine modules for the HEV drive systems to – perform parametric studies and optimization, to calculate performance curves, – evaluate driving cycles such as Federal Urban Driving Schedule (FUDS), FHDS, NYC
Truck…etc.; – draw the rotor/stator geometry for visualization; – study the motor's control time response to variations in load and motor inertia; – explore the motor's load test time response to variations in speed, load, and ambient temperature;
137
– to generate performance map module files that may be used by DOE's detailed HEV simulation codes [methodology augmented in 2000 and applied to the radial gap permanent magnet (RGPM) motor and to a no-frills Axial Gap Permanent Magnet (AGPM) motor].
• For each model, secure DOE's approval to declare copyright, document the model sufficiently for use by an engineer, and transfer the model to a CD so it may be available to the PNGV and HEV developers.
Accomplishments
• During the first quarter, an interactive program to design and simulate an SRM was structured on a LabVIEW platform.
• An internal report describing the program flow, entitled Design and Simulation Program for Switched Reluctance Motors, was completed in January 2001.
• An internal report entitled Analysis of a 12 kW 8/6 Pole SRM (1st Test Model) was completed in March 2001. In the report was a comparison of the calculated relation of flux linkages and locked rotor torque to current with experimental values provided by the vendor. Calculated performance data were also compared with experimental vendor data. This report will be very helpful during testing of the motor at ORNL.
• A report entitled Analysis of Test Model 2 (35-kW 24/16 Poles Dual SRM) was completed in July 2001. This report contains a comparison of performance data calculated using the model with experimental performance data supplied by the vendor.
• During the third quarter, the internal report describing the SRM model, which was drafted in January, was restructured for publication as an ORNL report. Publication as ORNL/TM-2001/132 awaits comparison of calculated data and test data measured at ORNL, further restructuring, and document review.
• A paper entitled, "Interactive Design and Analysis Program for Switched Reluctance Motor using an Analytical Method," was completed.
• During the fourth quarter, comparison of calculated vs. measured performance data for the UQM radial-gap motor tested by ANL was initiated. The goal is to verify the core of the design and performance modules of ORNL's RGPM motor model. Unexpected incompatibilities of the original code with a new release of the programming environment (LabVIEW 6) have been resolved, and the validation is in progress.
Future Direction
• Continue comparison of ORNL's RGPM model with data measured on the UQM RGPM motor at ANL.
• When ORNL tests its 20-kW AGPM motor, compare the experimental data with values calculated using ORNL's axial-gap PM model.
• Compare flux linkage, locked rotor torque, and performance calculations from ORNL's SRM model with experimental data measured at ORNL on the two available SRMs.
• Complete and publish the report entitled Design and Simulation of Switched Reluctance Motors. • Secure DOE approval to declare copyright on the AGPM motor and SRM models. • Prepare user's manuals and documentation for the models that have been completed and burn the
model and documentation onto a CD so it may be given to HEV drive system designers. • Identify potentially effective HEV motors, such as the switched reluctance PM motor or AGPM
motor with field weakening, to which the modeling methodology could be applied.
138
Introduction Application-specific computer models are especially critical during the design and evaluation of new technologies competing for implementation as consumer products. The physics and mechanics of each application are usually sufficiently known well to provide a basis for the models. Their usefulness skyrockets if they can be made user-friendly. Consequently, ORNL views as essential the development of such physics-based tools for simulation of electric motors and drives to guide configuration of HEVs. ORNL has been tasked by the U.S. DOE's OAAT to develop such models as part of the HEV research program. The models are used to evaluate performance and to formulate scaling algorithms for the efficiency, weight, cost, specific power, etc. of IMs, PM motors, and reluctance motors. These tools have great internal benefit to ORNL during motor design and evaluation of HEV drive systems, but ORNL wishes to see that these tools have a wider field of use. To this end, ORNL obtained approval from DOE in 2000 to copyright its RGPM Motor Interactive Design Tool; ORNL plans to do the same for its other models so they can be transferred via CDs to HEV developers. SRM Model An interactive program to design and simulate an SRM was structured on a LabVIEW platform. An internal draft report describing the program flow and entitled Design and Simulation Program for Switched Reluctance Motors is being prepared for publication in 2002. The program's design algorithm follows a five-step approach. • Step 1 accepts input of the primary
performance (mean torque, revolutions per minute) and system (supply voltage, number of phases, number of stator poles and number of rotor poles) specifications.
• Step 2 accepts input of the dimensions of the rotor and stator.
• Step 3 accepts internal dimensions such as pole and slot depths and widths.
• Step 4 makes a drawing of the motor; computes estimates of the motor parameters, such as inductance and resistance; and calculates the performance parameters, such as current, power output, efficiency, and motor weight using rms values in the algorithms.
• Steps 1 through 4 are interactive, causing any change of input value to automatically redraw and recalculate the performance parameters.
• Step 5 provides a more detailed analysis based on waveforms instead of rms values. This waveform-based simulation algorithm performs a position-dependent flux-linkage analysis for the source voltage, current control, firing angle, and turn-off angle. The angles are specified by the user. Phase current, back emf, inductance, average torque, and output power are computed for one phase and cloned for the rest of the phases. As an example, the report provides steps to design a three-phase SRM with six stator poles and four rotor poles (6/4) capable of producing a 10 in-lbf torque when driven by a 24-V source at 2000 rpm. This corresponds to a power of 267 W.
8/6 Model Affirmation To affirm the model calculations, experimental values provided by a vendor were compared with model values for a 4-phase, 8/6 SRM designed to deliver 12 kW at 6000 rpm when driven with a 220 V source. An internal report entitled Analysis of a 12 kW 8/6 Pole SRM (1st Test Model) describes the results. First, the relationships between flux linkages and current and between torque and current were compared with the experimental values. Measured flux linkages versus current are obtained by integrating over time the transient voltage across the pure inductance (V-I*R) from 0 to the time at which the current reaches the value of interest. This information is extracted from the current and voltage waveforms captured on a digital storage scope as the stator pole is charged with the rotor locked. A set of waveforms is captured for rotor angular
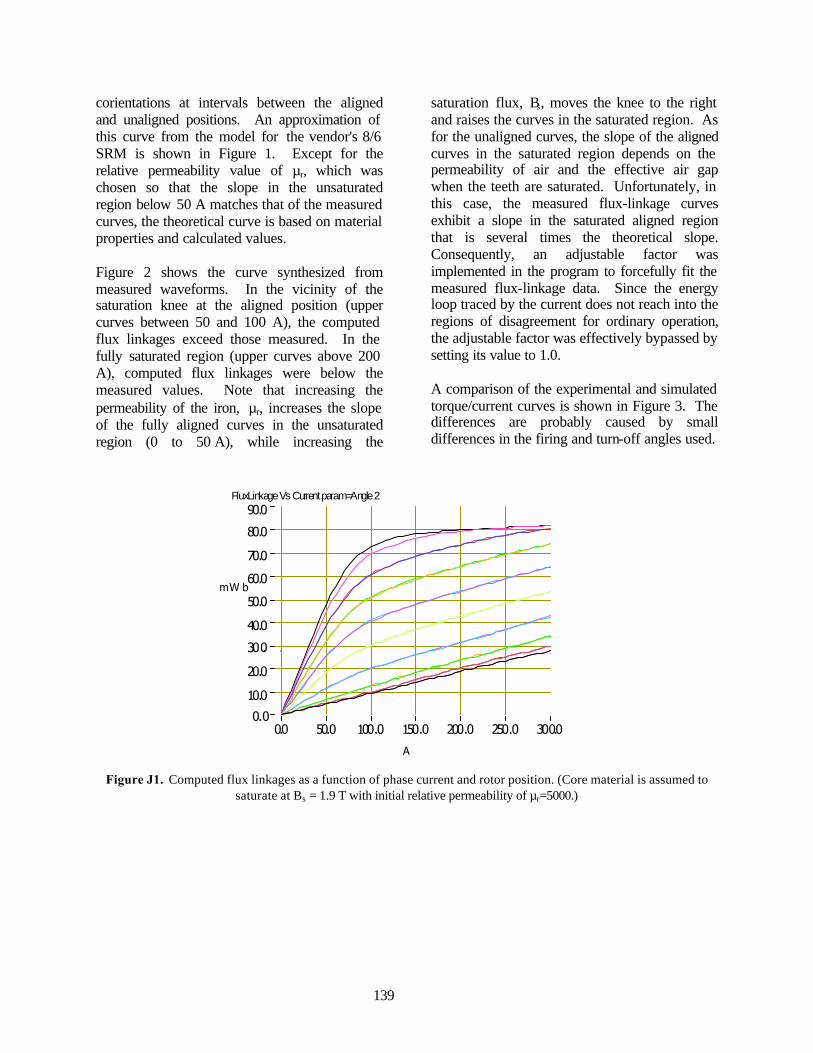
139
corientations at intervals between the aligned and unaligned positions. An approximation of this curve from the model for the vendor's 8/6 SRM is shown in Figure 1. Except for the relative permeability value of µr, which was chosen so that the slope in the unsaturated region below 50 A matches that of the measured curves, the theoretical curve is based on material properties and calculated values. Figure 2 shows the curve synthesized from measured waveforms. In the vicinity of the saturation knee at the aligned position (upper curves between 50 and 100 A), the computed flux linkages exceed those measured. In the fully saturated region (upper curves above 200 A), computed flux linkages were below the measured values. Note that increasing the permeability of the iron, µr, increases the slope of the fully aligned curves in the unsaturated region (0 to 50 A), while increasing the
saturation flux, Bs, moves the knee to the right and raises the curves in the saturated region. As for the unaligned curves, the slope of the aligned curves in the saturated region depends on the permeability of air and the effective air gap when the teeth are saturated. Unfortunately, in this case, the measured flux-linkage curves exhibit a slope in the saturated aligned region that is several times the theoretical slope. Consequently, an adjustable factor was implemented in the program to forcefully fit the measured flux-linkage data. Since the energy loop traced by the current does not reach into the regions of disagreement for ordinary operation, the adjustable factor was effectively bypassed by setting its value to 1.0. A comparison of the experimental and simulated torque/current curves is shown in Figure 3. The differences are probably caused by small differences in the firing and turn-off angles used.
Figure J1. Computed flux linkages as a function of phase current and rotor position. (Core material is assumed to saturate at Bs = 1.9 T with initial relative permeability of µr=5000.)
90.0
0.010.0
20.0
30 ..0
40.0
50.0
60.0
70.0
80.0
300.00.0 50.0 100.0 150.0 200.0 250.0
FluxLinkageVsCurrentparam=Angle2
A
mW b
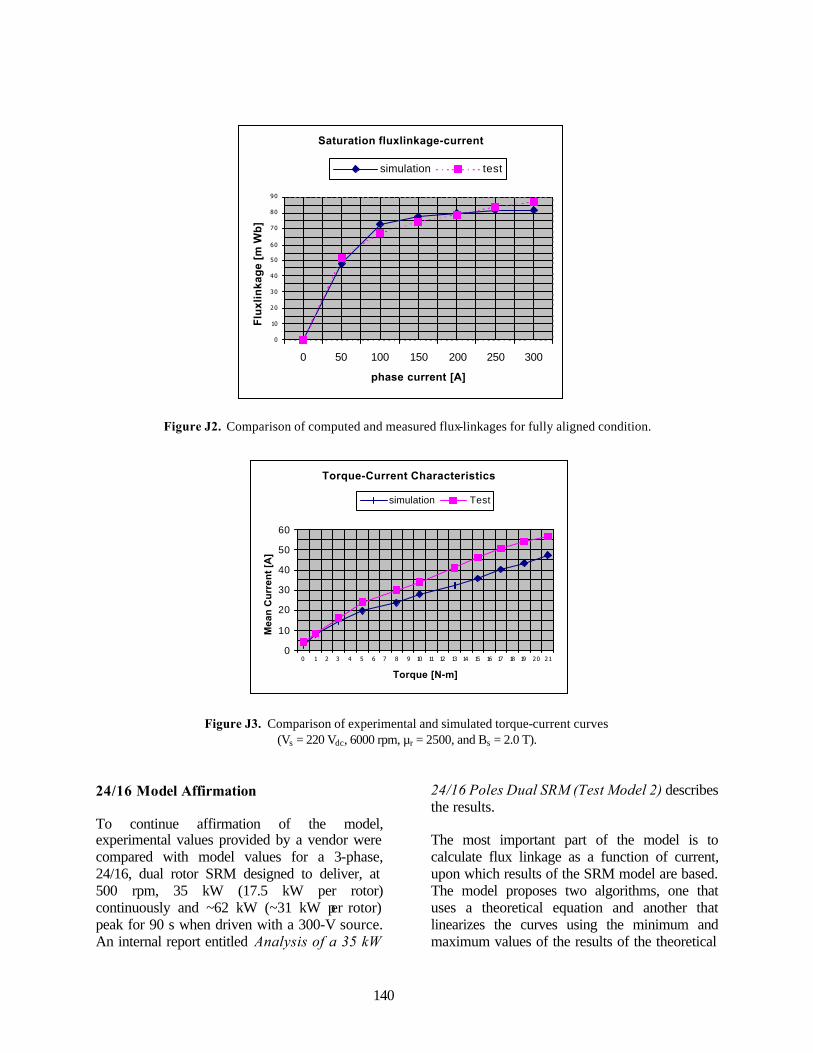
140
Figure J2. Comparison of computed and measured flux-linkages for fully aligned condition.
Figure J3. Comparison of experimental and simulated torque-current curves
(Vs = 220 Vdc, 6000 rpm, µr = 2500, and Bs = 2.0 T). 24/16 Model Affirmation To continue affirmation of the model, experimental values provided by a vendor were compared with model values for a 3-phase, 24/16, dual rotor SRM designed to deliver, at 500 rpm, 35 kW (17.5 kW per rotor) continuously and ~62 kW (~31 kW per rotor) peak for 90 s when driven with a 300-V source. An internal report entitled Analysis of a 35 kW
24/16 Poles Dual SRM (Test Model 2) describes the results. The most important part of the model is to calculate flux linkage as a function of current, upon which results of the SRM model are based. The model proposes two algorithms, one that uses a theoretical equation and another that linearizes the curves using the minimum and maximum values of the results of the theoretical
Saturation fluxlinkage-current
0
10
20
30
40
50
60
70
80
90
0 50 100 150 200 250 300
phase current [A]
Flu
xlin
kag
e [m
Wb
]
simulation test
Torque-Current Characteristics
0
10
20
30
40
50
60
0 1 2 3 4 5 6 7 8 9 10 11 12 13 14 15 16 17 18 19 20 21
Torque [N-m]
Mea
n C
urr
ent
[A]
simulation Test
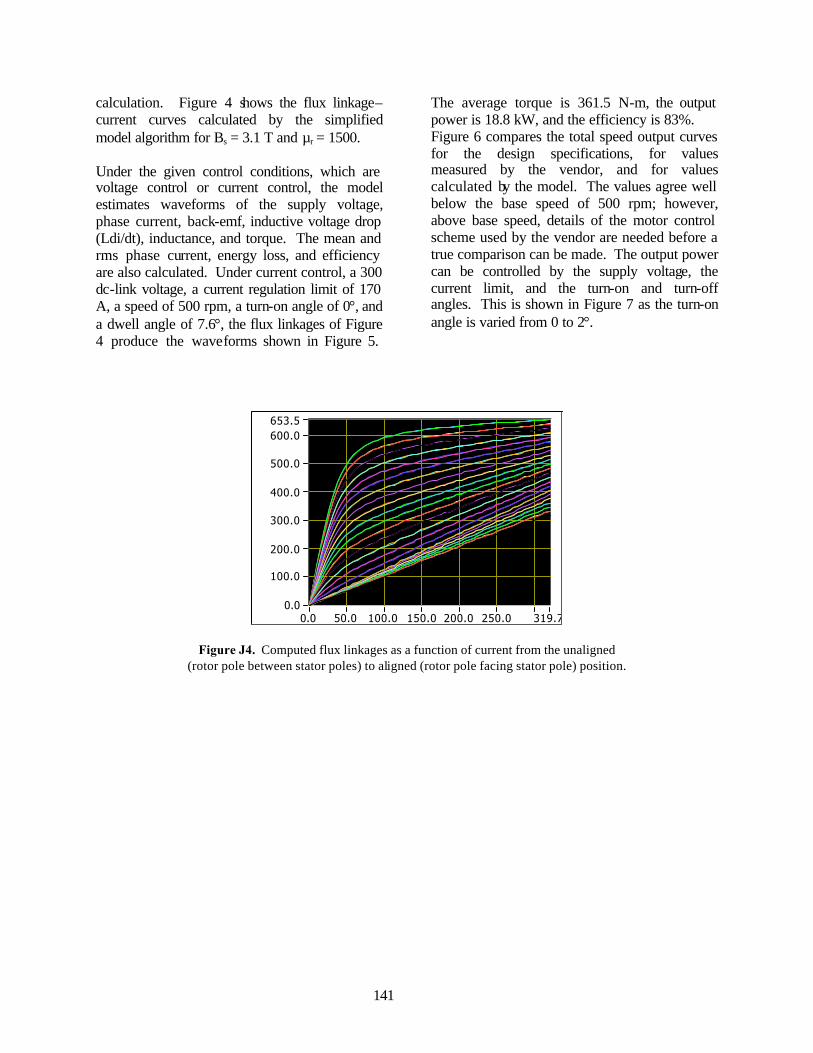
141
calculation. Figure 4 shows the flux linkage–current curves calculated by the simplified model algorithm for Bs = 3.1 T and µr = 1500. Under the given control conditions, which are voltage control or current control, the model estimates waveforms of the supply voltage, phase current, back-emf, inductive voltage drop (Ldi/dt), inductance, and torque. The mean and rms phase current, energy loss, and efficiency are also calculated. Under current control, a 300 dc-link voltage, a current regulation limit of 170 A, a speed of 500 rpm, a turn-on angle of 0°, and a dwell angle of 7.6°, the flux linkages of Figure 4 produce the waveforms shown in Figure 5.
The average torque is 361.5 N-m, the output power is 18.8 kW, and the efficiency is 83%. Figure 6 compares the total speed output curves for the design specifications, for values measured by the vendor, and for values calculated by the model. The values agree well below the base speed of 500 rpm; however, above base speed, details of the motor control scheme used by the vendor are needed before a true comparison can be made. The output power can be controlled by the supply voltage, the current limit, and the turn-on and turn-off angles. This is shown in Figure 7 as the turn-on angle is varied from 0 to 2°.
Figure J4. Computed flux linkages as a function of current from the unaligned
(rotor pole between stator poles) to aligned (rotor pole facing stator pole) position.
653.5
0.0
100.0
200.0
300.0
400.0
500.0
600.0
319.70.0 50.0 100.0 150.0 200.0 250.0
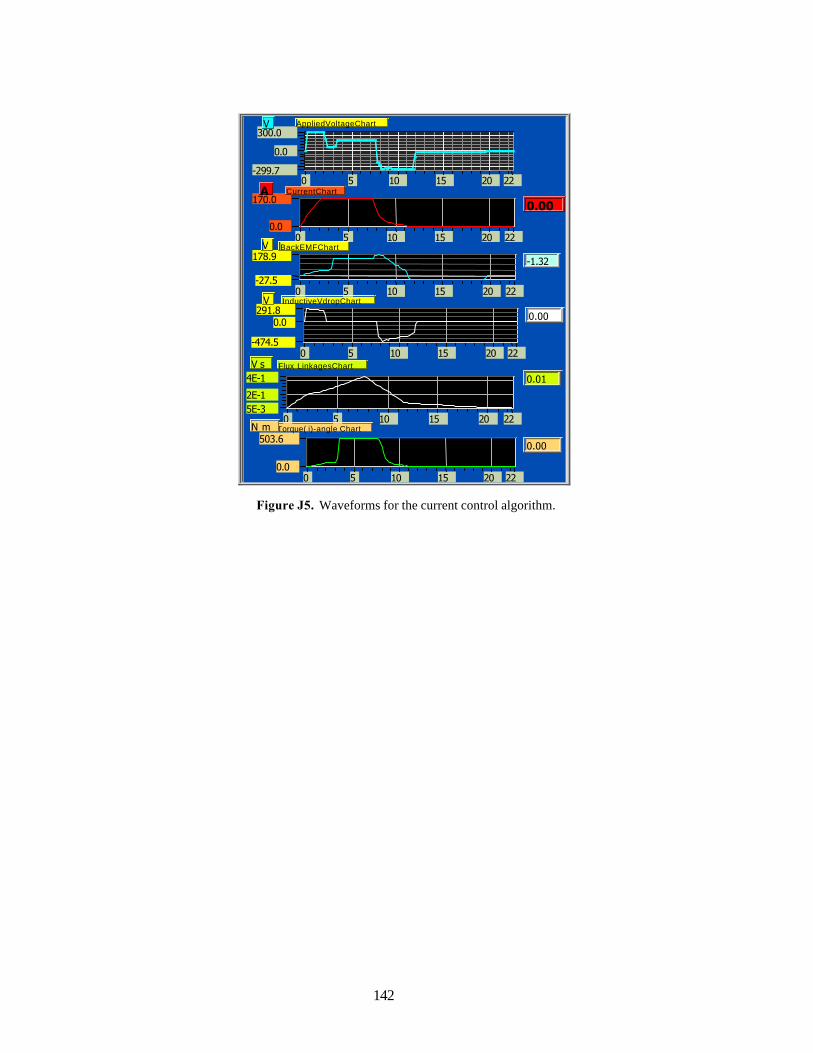
142
Figure J5. Waveforms for the current control algorithm.
170.0
0.0220 5 10 15 20
0.00CurrentChartA
300.0
-299.7
0.0
220 5 10 15 20
AppliedVoltageChartV
178.9
-27.5220 5 10 15 20
-1.32BackEMFChartV
291.8
-474.5
0.0
220 5 10 15 20
0.00InductiveVdropChartV
4E-1
5E-32E-1
220 5 10 15 20
0.01Flux LinkagesChartV s
503.6
0.0220 5 10 15 20
0.00
Torque( i)-angle ChartN m
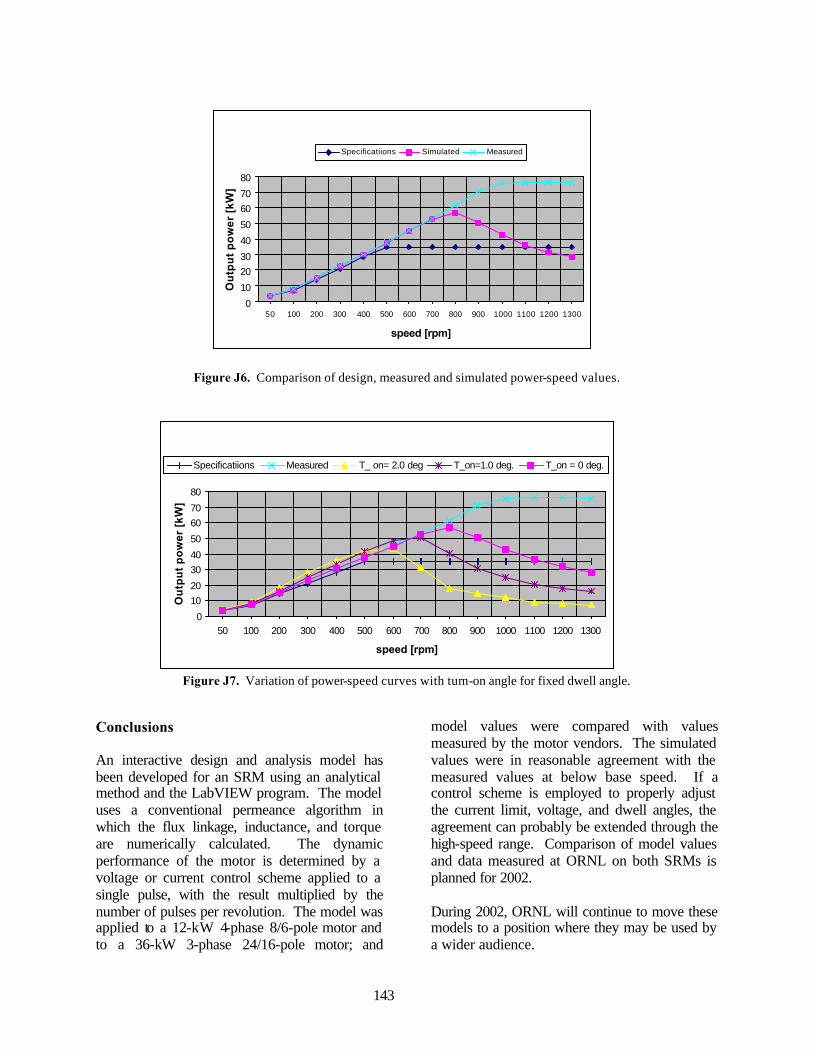
143
Figure J6. Comparison of design, measured and simulated power-speed values.
Figure J7. Variation of power-speed curves with turn-on angle for fixed dwell angle. Conclusions An interactive design and analysis model has been developed for an SRM using an analytical method and the LabVIEW program. The model uses a conventional permeance algorithm in which the flux linkage, inductance, and torque are numerically calculated. The dynamic performance of the motor is determined by a voltage or current control scheme applied to a single pulse, with the result multiplied by the number of pulses per revolution. The model was applied to a 12-kW 4-phase 8/6-pole motor and to a 36-kW 3-phase 24/16-pole motor; and
model values were compared with values measured by the motor vendors. The simulated values were in reasonable agreement with the measured values at below base speed. If a control scheme is employed to properly adjust the current limit, voltage, and dwell angles, the agreement can probably be extended through the high-speed range. Comparison of model values and data measured at ORNL on both SRMs is planned for 2002. During 2002, ORNL will continue to move these models to a position where they may be used by a wider audience.
Power-speed curevs
0
1020
3040
50
6070
80
50 100 200 300 400 500 600 700 800 900 1000 1100 1200 1300
speed [rpm]
Ou
tpu
t p
ow
er
[kW
]
Specificatiions Measured T_ on= 2.0 deg T_on=1.0 deg. T_on = 0 deg.
Power-speed curevs
0
10
2030
40
50
6070
80
50 100 200 300 400 500 600 700 800 900 1000 1100 1200 1300
speed [rpm]
Ou
tpu
t p
ow
er
[kW
]
Specificatiions Simulated Measured
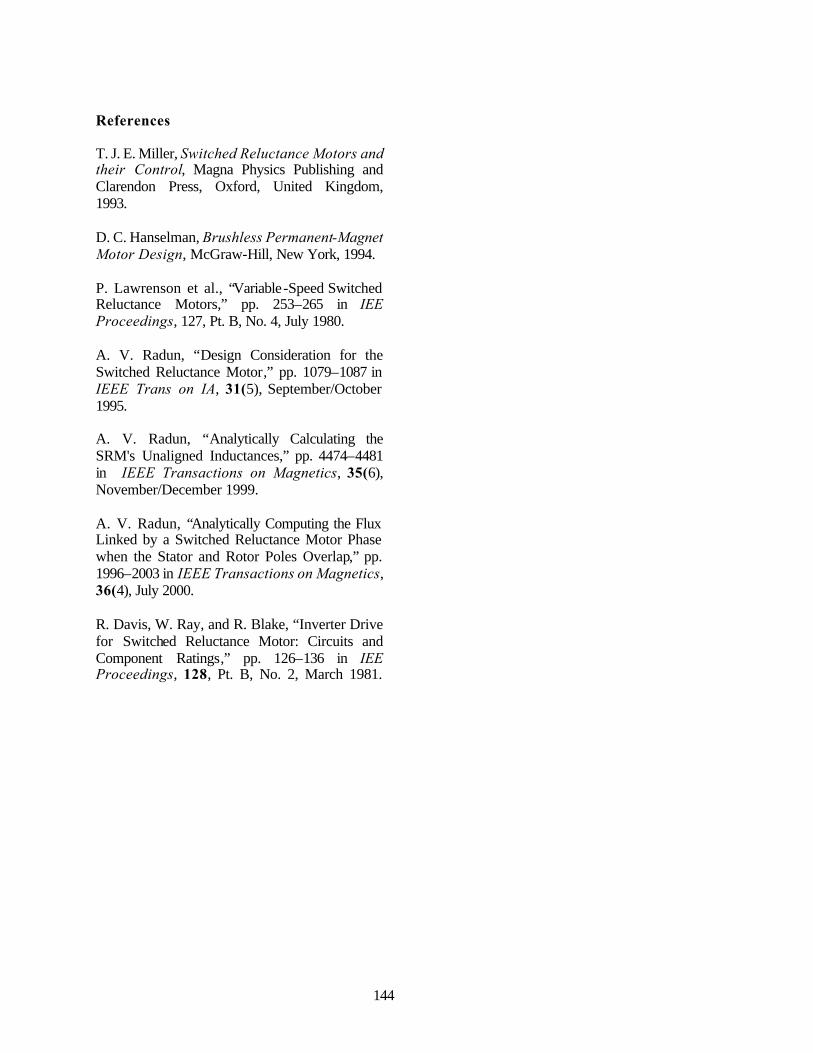
144
References T. J. E. Miller, Switched Reluctance Motors and their Control, Magna Physics Publishing and Clarendon Press, Oxford, United Kingdom, 1993. D. C. Hanselman, Brushless Permanent-Magnet Motor Design, McGraw-Hill, New York, 1994. P. Lawrenson et al., “Variable-Speed Switched Reluctance Motors,” pp. 253–265 in IEE Proceedings, 127, Pt. B, No. 4, July 1980. A. V. Radun, “Design Consideration for the Switched Reluctance Motor,” pp. 1079–1087 in IEEE Trans on IA, 31(5), September/October 1995. A. V. Radun, “Analytically Calculating the SRM's Unaligned Inductances,” pp. 4474–4481 in IEEE Transactions on Magnetics, 35(6), November/December 1999. A. V. Radun, “Analytically Computing the Flux Linked by a Switched Reluctance Motor Phase when the Stator and Rotor Poles Overlap,” pp. 1996–2003 in IEEE Transactions on Magnetics, 36(4), July 2000. R. Davis, W. Ray, and R. Blake, “Inverter Drive for Switched Reluctance Motor: Circuits and Component Ratings,” pp. 126–136 in IEE Proceedings, 128, Pt. B, No. 2, March 1981.

145
Exploration of Advanced Propulsion Concepts and Control John W. McKeever Oak Ridge National Laboratory National Transportation Research Center 2360 Cherahala Boulevard Knoxville, Tennessee 37932 Voice:(865)-946-1316; Fax( 865)-946-1262; E-mail:[email protected] DOE Program Manager: David Hamilton Voice: (202) 586-2314; Fax: (202) 586-1600; E-mail: [email protected] ORNL Technical Advisor: Donald J. Adams Voice: (865) 946-1321; Fax (865) 946-1262; E-mail: [email protected] Objectives
• Explore the theory, design, fabrication, integration, control, and testing of novel advanced propulsion schemes that might have a potential to greatly reduce the need for onboard energy or thermal sources typically required for transportation purposes.
Approach
• Apply fundamental physics to each advanced concept and perform an evaluation of the feasibility of each new concept.
• Coordinate an Advanced Propulsion Concept Team with other Oak Ridge National Laboratory (ORNL) experts when their disciplines are related to concepts being evaluated.
• Attend meetings to view demonstrations of new propulsion concepts and conferences where new propulsion concepts are being discussed.
• When "advanced" physical ideas are proposed, inquire into the background of the proposer and attempt to tie the advanced ideas back to basics.
• Interface with proposers who want a national laboratory to reproduce their work to give it credibility, to explain what is involved when the national labs are involved in collaborative research.
Accomplishments
• Attended a demonstration in Huntsville, Alabama, of the motionless electromagnetic generator in November 2000. Those who demonstrated the device would not allow ORNL to test it further (November 2000).
• Met with David Hamilton, a team from Integrity Research, Russian researchers, Sergei Godin and Vladimir Roschin, and an interpreter in Washington, D.C., to hear and discuss the results of the Russian's experimental tests on a magnetic energy generator (MEG) (January 2001).
• Identified re-energization of the nuclei to the excited state as the main problem associated with storing energy in and extracting energy from Hafnium 178 (third quarter 2001).
• Attended the 37th American Institute of Aeronautics and Astronautics (AIAA)/American Society of Mechanical Engineers (ASME)/Society of American Engineers (SAE)/American Society for Engineering Education (ASEE) Joint Propulsion Conference (JPC) and Exhibit at Salt Lake City, Utah, to hear about new propulsion ideas (July 8–11, 2001)
146
– At the request of Marc Millis, then the head of the National Aeronautics and Space Administration’s (NASA's) Breakthrough Physics Program, delivered a copy of the latest draft of ORNL's report refuting Jim Woodward's theory, interpretation, and experimental conclusions about the mass transient effect that he claims to have discovered.
– Attended a presentation by Sergei Godin on the MEG mentioned earlier. It was not well received because the audience felt it violated the second law of thermodynamics and because Godin could or would not explain what had happened to the equipment (July 6-9).
– Met with Jeff Hamstra from Lockheed Martin Aeronautics (LMA), to discuss the possibility of collaboration on work associated the Russian device. LMA does not have much funding for this work and the results of the meeting were negative.
• Further refined the draft refuting the transient mass effect (final quarter, 2001). Future Direction
• Submit the ORNL paper evaluating Woodward's mass transient effect to Foundations of Physics for publication during the first quarter of FY 2002.
• Explore old advanced propulsion concepts and new concepts as they are proposed. • Continue MEG building-block experiments designed to develop an understanding of the theory. • Continue to examine the practicality of energy retrieval through isomeric decay of HF-178 and of
overcoming the difficulty of energy storage by re-exciting it. Introduction This task began in 1999 when ORNL was tasked with scaling up a device that would use Jim Woodward's transient mass effect to produce a measurable unidirectional force. Modeling the device led to an immeasurable force, this was finally explained as a violation of conservation of momentum. Further inquiry identified a classical Newtonian mechanism that could produce the measured results. Theoretical examination then revealed that there was no basis for the claim of a transient mass deviation from a special relativity approach. Recognizing the impact that would result if DOE could identify an advanced propulsion scheme that would not involve an onboard energy or thermal source, OAAT saw a potential for using ORNL researchers to evaluate advanced propulsion concepts. In 2001 ORNL embarked officially on the task of Exploration of Advanced Propulsion Concepts and Control and conducted the inquiries and evaluations discussed in this report. In the past few years, several events have been reported suggesting that a method for controlling
gravity is close. For example, a recent Chinese newspaper listed control over gravity as one of China's ten greatest discoveries in the past year. Work such as this reported Chinese discovery will be evaluated to support OAAT and its Breakthrough Exploratory Physics Research Program. ORNL will examine novel advanced propulsion schemes that are touted to reduce the need for onboard energy or thermal sources required for transportation and that are presented to DOE for research funding. Each examination may involve up to five steps:
1. Visit a proposed demonstration of the novel propulsion scheme with a measuring apparatus (e.g., the visit to Huntsville to evaluate a motionless electromagnetic generator);
2. Evaluate the scheme to ensure that it does not violate Millis' Criteria (J. Prop. And Power, 13, 1997);
3. Determine the prospects for scaling the scheme to achieve terrestrial transportation, as was done in the 1999 attempt to scale up Woodward's unidirectional force generator;
147
4. Expose and appraise related or new schemes suggested by the proposed scheme; and
5. Conduct lab tests to explore the theory behind a proposed scheme and to investigate the techniques being used to demonstrate or evaluate it.
An example of step 5 is ORNL seeking a basis for results reported by Roschin and Godin. Based on such examinations, ORNL will recommend the schemes that appear to have greatest potential for overall success, especially those that apply to transportation technology. Rebuttal of the Mass Transient Effect During the second quarter, ORNL discussed the results of ORNL's findings regarding the Woodward transient mass fluctuation theory in a teleconference with Marc Millis, manager of NASA's Breakthrough Physics Program. Because there was not time to submit a paper for delivery, Millis requested that ORNL researchers gave him a written description of their findings when they attended the 37th AIAA/ASME/SAE/ASEE JPC at Salt Lake City, Utah, on July 8–11, 2001. Millis originally planned to publish papers of this type along with the proceedings of the conference. ORNL drafted and delivered a paper entitled "Revised Theory of Transient Mass Fluctuations" into Millis' hands at the JPC. The ORNL paper refutes Woodward's theory, interpretation, and experimental conclusions. Furthermore, the ORNL team reproduced a version of the Woodward torsional pendulum experiment and found an effect similar to the “Woodward effect,” but 100 times greater, that can be explained using classical 19th Century physics. At the end of Woodward's talk, ORNL revisited its thermal acceleration explanation of what Woodward and Mahood had actually been measuring with their torsional pendulum. The ORNL objections were not addressed by Woodward because he has not yet grasped that the classical phenomenon of accelerated thermal expansion is what produces the so-called Woodward drive. Those present at the interchange did not seem to grasp the
significance of ORNL's objections, so it is important that the paper be published for wider review. Woodward is now measuring what he claims is a mass transient effect on a linear system. ORNL has not yet been invited to apply the thermal acceleration correction to the analysis of his new data. Woodward sent a videotape and pictures of his experiment to ORNL, but although there is much depiction, not enough information is available to carry out such an analysis. Marc Millis has taken a new job and will be replaced as manager of NASA's Breakthrough Physics Program. He will not publish the paper ORNL delivered to him as originally planned, but he encouraged ORNL to submit it to a journal so that others may review its contents. ORNL has revised that paper and plans to submit it to the journal Foundations of Physics. MEG On January 31, 2001, John McKeever traveled to Washington, D.C., to meet with David Hamilton, a team from Integrity Research Institute, Russian researchers Sergei Godin and Vladimir Roschin, and an interpreter. Roschin discussed his experimental tests on a MEG he built based on information he gathered about John R. Searl's generator. Early in the third quarter, McKeever had two teleconferences with Tom Valone of Integrity Research Institute about likely conditions and elements of a contract for replicating the Russian version of Searl's MEG in the United States at ORNL. The ORNL team has serious reservations about proceeding with such a grand-scale activity. There has been no further contact. Sergei Godin presented the observations of the MEG at the 37th JPC. The presentation was not well received because the audience felt it violated the second law of thermodynamics and because Godin could or would not explain what had happened to the equipment.
148
At the 37th JPC, ORNL met with Jeff Hamstra LMA in Fort Worth, Texas, to discuss the possibility of collaboration on work associated with the Russian MEG. LMA does not have much funding for this work, and the results of the meeting were not encouraging. In the process of seeking funding to build a scale model of the Russian device during the first quarter, ORNL found that existing theory is inadequate to direct the scaling process. This finding was confirmed by some of Roschin's findings reported at the January 31 meeting. ORNL is conducting some basic building-block experiments to investigate phenomena that may lead to understanding of the reported phenomena. Further internal funding is contingent upon this understanding. In the third quarter, ORNL's first MEG building-block experiment encountered vibration problems associated with eccentricity. The experiment rotates one set of magnets past a fixed set of magnets at high rpm to study potential differences. Work is proceeding as time allows. During the fourth quarter, the first experimental system's geo-center was aligned with the axis of rotation within 0.001 in. The system is ready to run. If vibration problems remain, the system will be dynamically balanced. Evaluation of the Practicality of Isomeric Energy Storage Brian D. Murphy, an ORNL nuclear physicist, contacted C. B. Collins of the University of Texas in Austin to discuss isomeric energy storage from an engineering perspective. The idea is to cause 178 Hf, which normally has a 31-year half-life, to decay quickly by exciting it, using X-ray photons, to another level from which it can cascade to the ground state. Assuming that the 178 Hf will decay as rapidly as Collin's work indicates, the main problem is re-exciting the isomer that is, recharging the nuclear battery. There is a very large angular momentum difference between the excited state (J = 16) and the ground state (J = 0). In fact, this is the primary reason why the state has such a
small decay probability. Populating the J = 16 level using protons is not practical because it doesn't work readily in reverse during de-excitation. Neutron capture is not likely to work because most neutron capture cross sections are only significant for s-wave neutrons. It is difficult to conceive of a simple nuclear reaction that might successfully populate this state with a significant probability. Most reactions would not transfer the large angular momentum required. Collins and Murphy feel that the process might occur in the target of a spallation neutron source. Collins claims to have had some success with high-energy accelerator beams impinging on heavy-metal targets. An obvious question, then, is the nuclide species breakdown among spallation products. This is probably not well understood, but a starting point might be our understanding of the distribution of fission products resulting from various forms of fission. At this point, no solution for re-energizing a decayed Hafnium isomer has been generated. Inability to re-energize the energy source is a showstopper. Conclusions Many new advanced propulsion concepts will be evaluated before one is found that is successful. Several successful concepts will be examined before a practical one is found. The importance of such a research oversight activity and the romance of success easily justify the effort; consequently, interest in advanced propulsion continues to be an important part of DOE research.
DISTRIBUTION
1. D. J. Adams 2. S. W. Allison 3. C. W. Ayers 4. J. M. Bailey 5. J. N. Chiasson, The University of
Tennessee-Knoxville, 414 Ferris Hall, Knoxville, Tennessee 37996-2100
6. C. L. Coomer 7. E. C. Fox
149
8. E. T. Grostick 9. D. B. Hamilton, DOE/OAAT, 1000
Independence Avenue, FORS, EE-32, Rm. 5G-023, Washington, DC 20585
10. J. S. Hsu 11. S. M. Jenkins 12. R. S. Kirk, DOE/OAAT, 1000
Independence Avenue, FORS, EE-32, Rm. 5G-046, Washington, DC 20585
13. R. A. Kost, DOE/OAAT, 1000 Independence Avenue, FORS, EE-32, Rm. 5G-045, Washington, DC 20585
14. L. D. Marlino 15. J. W. McKeever 16. J. A. Merritt, DOE/OAAT, 1000
Independence Avenue, FORS, EE-32, Rm. 5G-064, Washington, DC 20585
17. S. C. Nelson 18. G. W. Ott, Jr. 19. F. Z. Peng 20. R. M. Schilling 21. L. E. Seiber 22. M. B. Scudiere 23. G. J. Su 24. R. A. Sutula, DOE/OAAT, 1000
Independence Avenue, FORS, EE-32, Rm. 5G-046, Washington, DC 20585
25. L. M. Tolbert 26. C. P. White 27. R. E. Ziegler
150
Hybrid Electric Vehicle Switched Reluctance Machines John W. McKeever Oak Ridge National Laboratory National Transportation Research Center 2360 Cherahala Boulevard Knoxville, Tennessee 37932 Voice: (865)-946-1316; Fax (865)-946-1262; E-mail: [email protected] DOE Program Manager: David Hamilton Voice: (202) 586-2314; Fax (202) 586-1600; E-mail: [email protected] ORNL Technical Advisor: Donald J. Adams Voice: (865) 946-1321; Fax (865) 946-1262; E-mail: [email protected] Objectives
• Assess the potential for state-of-the-art switched reluctance motor (SRM) drive technology to provide traction in hybrid electric vehicle (HEV) drive systems.
• Favorable features of the SRM are the cheap, robust, easy-to-make ferromagnetic rotor and an inverter whose semiconductor device count may be reduced. Unfavorable features are the low fraction of each revolution when a set of poles is active and the noise, vibration, and torque roughness inherently produced by the motor. The objective is to determine if the benefits outweigh the problems from a commercial perspective.
Approach
• Acquire SRM drive systems designed for HEVs from vendors for evaluation. • Verify that these SRM drive systems meet HEV performance specifications. Verification will
require locked-rotor measurements and dynamometer testing as both a motor and generator. • Measure the amount of sound power generated over the audible spectrum by the SRM drive system.
A directional sound measuring method and a PC-based multi-analyzer system will be used to quantify audible sound energy passing through a fixed boundary around the drive system.
• Compare power generated by the SRM drive system with that generated by competing induction and permanent magnet (PM) drive systems.
• Identify the SRM components that are generating noise and vibration. Doing so will involve locating vibrating surfaces with transducers to separate rotating and translating motion. It may also involve the use of Oak Ridge National Laboratory’s (ORNL) SRM model.
• Collaborate, when appropriate, with the SRM vendors to explore how motor or inverter designs may be changed to reduce the generated noise. This effort will require modeling the SRM drive system with ORNL's SRM motor model
Accomplishments
• A 12-kW, 4-phase 8/6 pole SRM drive system and a 35-kW, 4-phase 24/16 pole SRM drive system were acquired from two vendors (completed in 2000).
• Characterization and performance data were obtained from each vendor for the two SRM drive systems.
151
• A goniometer was designed and fabricated that could lock the rotor at a known angle during measurement of flux linkages and of torque.
• The 12-kW SRM and the goniometer were anchored in Power Electronics and Electric Machinery Research Center (PEEMRC) Test Cell 2 for locked rotor testing.
• A procedure was created and tested to determine the flux linkages as a function of current, based on the voltage and current waveforms generated and stored on a Yokogawa PZ4000 digital storage scope as one pole pair of the SRM is charged by a dc power supply.
• The test plan moved close to the form that will be required for the readiness review that will take place in the first quarter of FY 2002.
Future Direction
• Complete the readiness review for locked-rotor testing and for dynamometer testing of the 12-kW SRM drive system.
• Measure the flux linkage as a function of current with the rotor and stator aligned (0o) and with the rotor fixed at angles from ±3o to ±30o in steps of 3o as a stator is charged to maximum current, 216 A. Repeat for the remaining three stators.
• Measure the torque induced by one set of poles for the current of 60, 90, 120, 150, 180, and 210 A at each of the angular positions for which the flux linkages were measured.
• Mount the 12-kW SRM on the dynamometer and drive the system as a motor and a generator to check the turn-on and turn-off controls.
• Complete a set of performance characterization measurements and compare them with the values obtained from the vendor.
• Develop the methodology that will be used to measure the audible sound power generated by the SRM traction motor.
Introduction The switched reluctance drive system with its cheaper, more-robust traction motor may be able to meet the cost goals of the Office of Advanced Automotive Technology’s (OAAT) Research & Development plan for the HEV. To resolve this uncertainty, ORNL has been given the responsibility to characterize HEV-size switched reluctance units. Few commercially available units can deliver between 30 and 70 kW of peak power, which is the range required by the HEV. This limitation posed an additional hindrance to locating eligible units. In an attempt to remedy this situation, ORNL is promoting the development of viable commercial switched reluctance drive systems by providing independent evaluation of such commercial or prototype systems obtained from
industry. The purpose of the evaluation is to determine whether the systems meet the HEV standards for performance, noise, and vibration. ORNL is also prepared to collaborate with SRM vendors to guide innovations and development of SRM technology. The simplicity of the SRM, which makes it attractive as an HEV traction motor, also results in features that require complex special equipment to gather data to compare with data from other HEV drive system candidates. These features include harsh waveforms, torsional vibration caused by high torque ripple, and torque/speed curves different from those of its IM counterparts. If these undesirable features can be moderated or eliminated, the simplicity of the motor makes it an excellent candidate to meet cost, volume, weight, and reliability goals.
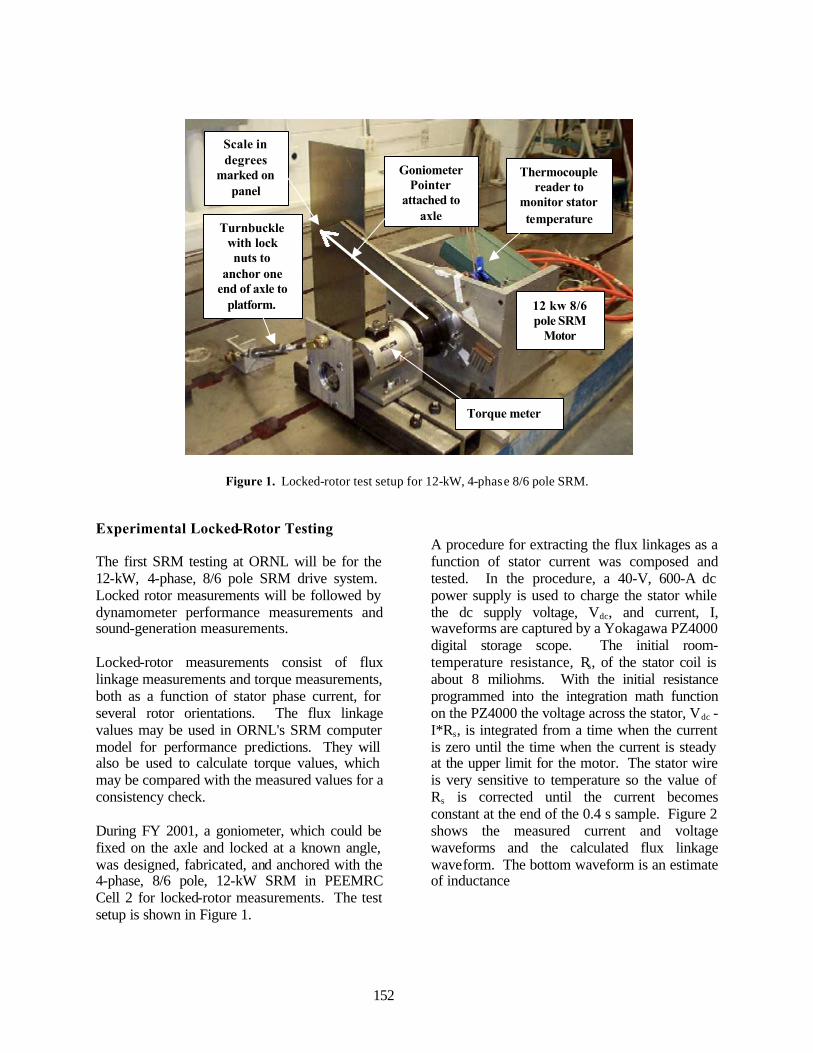
152
Figure 1. Locked-rotor test setup for 12-kW, 4-phase 8/6 pole SRM.
Experimental Locked-Rotor Testing The first SRM testing at ORNL will be for the 12-kW, 4-phase, 8/6 pole SRM drive system. Locked rotor measurements will be followed by dynamometer performance measurements and sound-generation measurements. Locked-rotor measurements consist of flux linkage measurements and torque measurements, both as a function of stator phase current, for several rotor orientations. The flux linkage values may be used in ORNL's SRM computer model for performance predictions. They will also be used to calculate torque values, which may be compared with the measured values for a consistency check. During FY 2001, a goniometer, which could be fixed on the axle and locked at a known angle, was designed, fabricated, and anchored with the 4-phase, 8/6 pole, 12-kW SRM in PEEMRC Cell 2 for locked-rotor measurements. The test setup is shown in Figure 1.
A procedure for extracting the flux linkages as a function of stator current was composed and tested. In the procedure, a 40-V, 600-A dc power supply is used to charge the stator while the dc supply voltage, Vdc, and current, I, waveforms are captured by a Yokagawa PZ4000 digital storage scope. The initial room-temperature resistance, Rs, of the stator coil is about 8 miliohms. With the initial resistance programmed into the integration math function on the PZ4000 the voltage across the stator, Vdc - I*Rs, is integrated from a time when the current is zero until the time when the current is steady at the upper limit for the motor. The stator wire is very sensitive to temperature so the value of Rs is corrected until the current becomes constant at the end of the 0.4 s sample. Figure 2 shows the measured current and voltage waveforms and the calculated flux linkage waveform. The bottom waveform is an estimate of inductance
Scale in degrees
marked on panel
Goniometer Pointer
attached to axle
Torque meter
Turnbuckle with lock nuts to
anchor one end of axle to
platform. 12 kw 8/6 pole SRM
Motor
Thermocouple reader to
monitor stator temperature
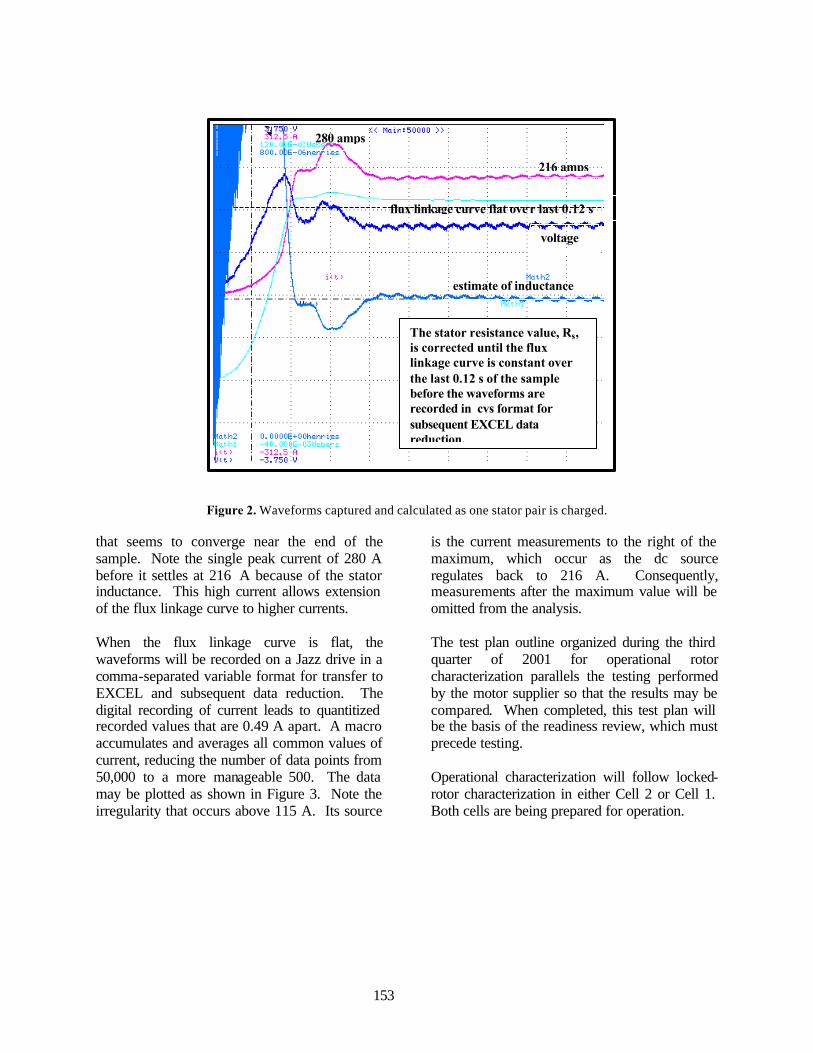
153
Figure 2. Waveforms captured and calculated as one stator pair is charged. that seems to converge near the end of the sample. Note the single peak current of 280 A before it settles at 216 A because of the stator inductance. This high current allows extension of the flux linkage curve to higher currents. When the flux linkage curve is flat, the waveforms will be recorded on a Jazz drive in a comma-separated variable format for transfer to EXCEL and subsequent data reduction. The digital recording of current leads to quantitized recorded values that are 0.49 A apart. A macro accumulates and averages all common values of current, reducing the number of data points from 50,000 to a more manageable 500. The data may be plotted as shown in Figure 3. Note the irregularity that occurs above 115 A. Its source
is the current measurements to the right of the maximum, which occur as the dc source regulates back to 216 A. Consequently, measurements after the maximum value will be omitted from the analysis. The test plan outline organized during the third quarter of 2001 for operational rotor characterization parallels the testing performed by the motor supplier so that the results may be compared. When completed, this test plan will be the basis of the readiness review, which must precede testing. Operational characterization will follow locked-rotor characterization in either Cell 2 or Cell 1. Both cells are being prepared for operation.
The stator resistance value, Rs, is corrected until the flux linkage curve is constant over the last 0.12 s of the sample before the waveforms are recorded in cvs format for subsequent EXCEL data reduction.
voltage
flux linkage curve flat ove r last 0.12 s
216 amps
280 amps
estimate of inductance
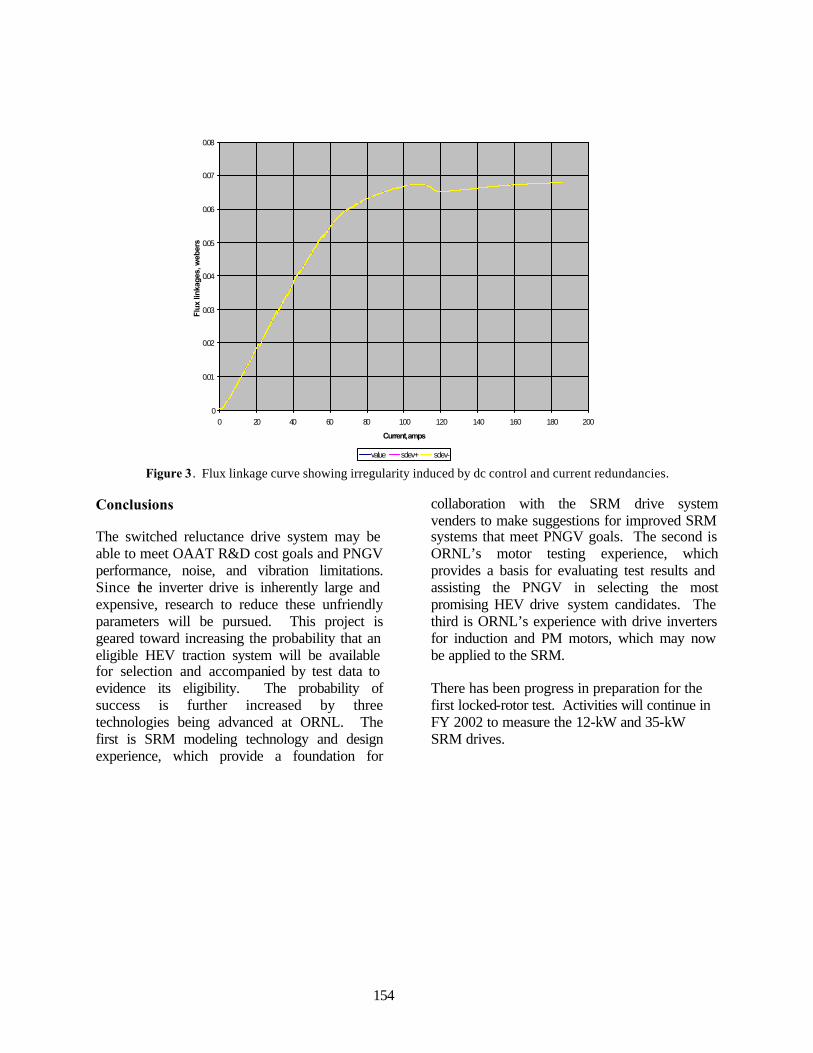
154
Figure 3. Flux linkage curve showing irregularity induced by dc control and current redundancies.
Conclusions The switched reluctance drive system may be able to meet OAAT R&D cost goals and PNGV performance, noise, and vibration limitations. Since the inverter drive is inherently large and expensive, research to reduce these unfriendly parameters will be pursued. This project is geared toward increasing the probability that an eligible HEV traction system will be available for selection and accompanied by test data to evidence its eligibility. The probability of success is further increased by three technologies being advanced at ORNL. The first is SRM modeling technology and design experience, which provide a foundation for
collaboration with the SRM drive system venders to make suggestions for improved SRM systems that meet PNGV goals. The second is ORNL’s motor testing experience, which provides a basis for evaluating test results and assisting the PNGV in selecting the most promising HEV drive system candidates. The third is ORNL’s experience with drive inverters for induction and PM motors, which may now be applied to the SRM. There has been progress in preparation for the first locked-rotor test. Activities will continue in FY 2002 to measure the 12-kW and 35-kW SRM drives.
B-H Curve of 8/6 SR Motor
0
0.01
0.02
0.03
0.04
0.05
0.06
0.07
0.08
0 20 40 60 80 100 120 140 160 180 200
Current, amps
Flux
link
ages
, web
ers
value sdev+ sdev-

155
Integrated Electric Traction System Jon Lutz UQM Technologies, Inc 425 Corporate Circle Golden, Colorado 80401 (303) 278-2002; Fax: (303) 278-7007; e-mail: [email protected] DOE Program Manager: James A. Merritt (202) 586-0903; Fax: (202) 586-1600; e-mail:[email protected]
Objectives
• Develop a complete electric transaxle drive system capable of propelling a mid-sized passenger vehicle, utilizing a geometry that is small, lightweight, and demonstrates reduced part count.
Approach
• Integrate the gearbox and differential into the motor and utilize one coolant path to cool both the motor and the electronic controller. The sharing of componentry that is inherent to the design approach results in a minimized number of parts and reduces the production cost.
• A high torque brushless permanent magnet motor, combined with an embedded single-stage planetary reduction, results in a compact drive system that can be located between the wheels of a passenger vehicle (series hybrid, fuel cell electric, battery electric) or truck (through-the-road hybrid, multiple-axle series hybrid, fuel cell electric, battery electric).
• The system includes all componentry necessary to drive a vehicle, except for the power source. This includes the motor, gear reduction, differential, parking pawl, and inverter.
• The approach also lends itself to possible design modifications, including a remote (non-integrated) inverter, elimination of the differential for wheel motor applications, and shortened stack length for lower power requirements.
Accomplishments
• The design is complete, parts have been fabricated, and testing has begun.
• Testing without the gearbox, primarily for controller tuning, is complete.
• Testing with the gearbox is now occurring.
• Alternative embodiments have been modeled, including a version of the system without the integrated controller and another version that uses cased housing components (rather than machined components).
Future Directions
• Complete characterization testing with the gearbox. Maximum power profile, continuous power profile, and efficiency mapping will be among the attributes determined through testing.
• Publish the system datasheet and take orders for the second batch build. Interest has been expressed from several potential users of the drive system.
• Complete the final report, documenting the accomplishments of the Phase II project.
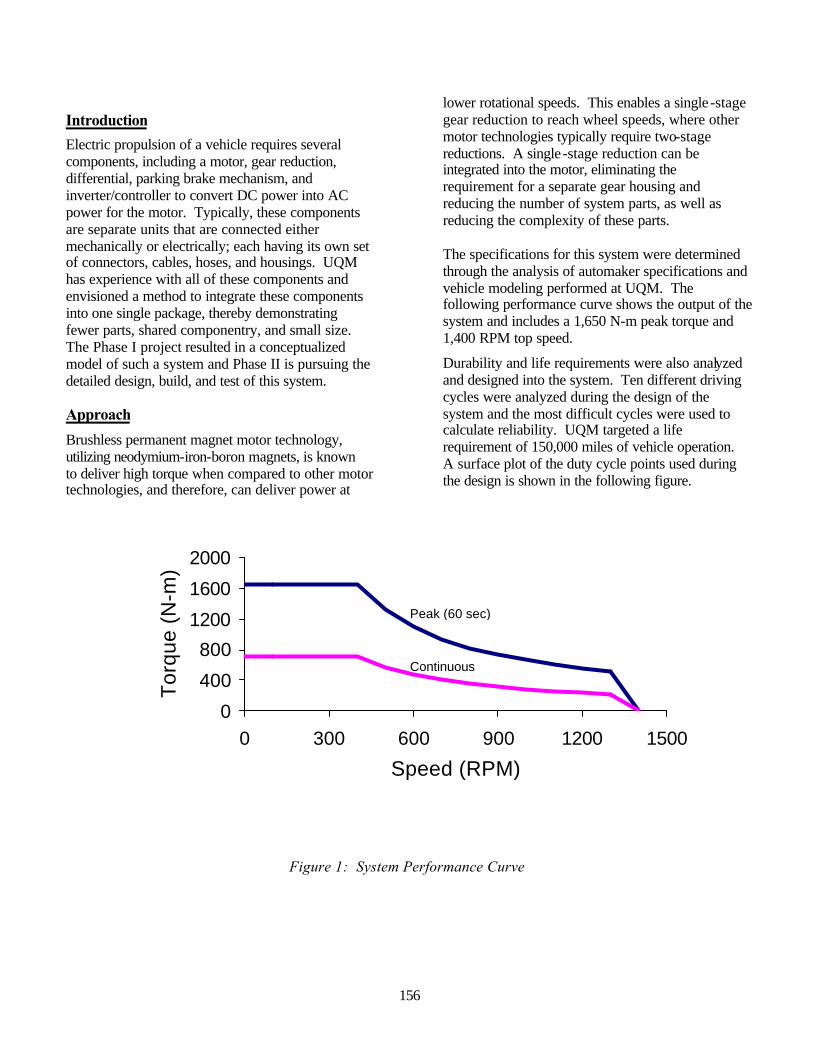
156
Introduction
Electric propulsion of a vehicle requires several components, including a motor, gear reduction, differential, parking brake mechanism, and inverter/controller to convert DC power into AC power for the motor. Typically, these components are separate units that are connected either mechanically or electrically; each having its own set of connectors, cables, hoses, and housings. UQM has experience with all of these components and envisioned a method to integrate these components into one single package, thereby demonstrating fewer parts, shared componentry, and small size. The Phase I project resulted in a conceptualized model of such a system and Phase II is pursuing the detailed design, build, and test of this system.
Approach
Brushless permanent magnet motor technology, utilizing neodymium-iron-boron magnets, is known to deliver high torque when compared to other motor technologies, and therefore, can deliver power at
lower rotational speeds. This enables a single -stage gear reduction to reach wheel speeds, where other motor technologies typically require two-stage reductions. A single-stage reduction can be integrated into the motor, eliminating the requirement for a separate gear housing and reducing the number of system parts, as well as reducing the complexity of these parts. The specifications for this system were determined through the analysis of automaker specifications and vehicle modeling performed at UQM. The following performance curve shows the output of the system and includes a 1,650 N-m peak torque and 1,400 RPM top speed.
Durability and life requirements were also analyzed and designed into the system. Ten different driving cycles were analyzed during the design of the system and the most difficult cycles were used to calculate reliability. UQM targeted a life requirement of 150,000 miles of vehicle operation. A surface plot of the duty cycle points used during the design is shown in the following figure.
Figure 1: System Performance Curve
0
400
800
1200
1600
2000
0 300 600 900 1200 1500
Speed (RPM)
Torq
ue (
N-m
)
Peak (60 sec)
Continuous
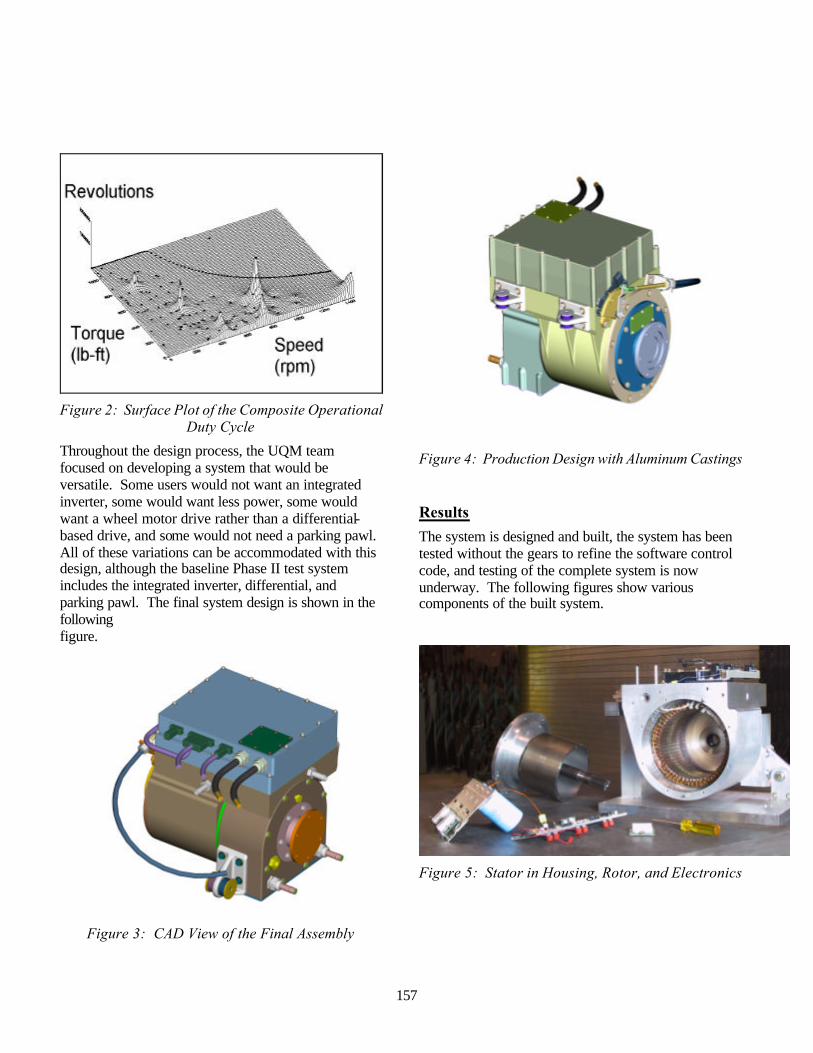
157
Figure 2: Surface Plot of the Composite Operational
Duty Cycle
Throughout the design process, the UQM team focused on developing a system that would be versatile. Some users would not want an integrated inverter, some would want less power, some would want a wheel motor drive rather than a differential-based drive, and some would not need a parking pawl. All of these variations can be accommodated with this design, although the baseline Phase II test system includes the integrated inverter, differential, and parking pawl. The final system design is shown in the following figure.
Figure 3: CAD View of the Final Assembly
Figure 4: Production Design with Aluminum Castings
Results
The system is designed and built, the system has been tested without the gears to refine the software control code, and testing of the complete system is now underway. The following figures show various components of the built system.
Figure 5: Stator in Housing, Rotor, and Electronics
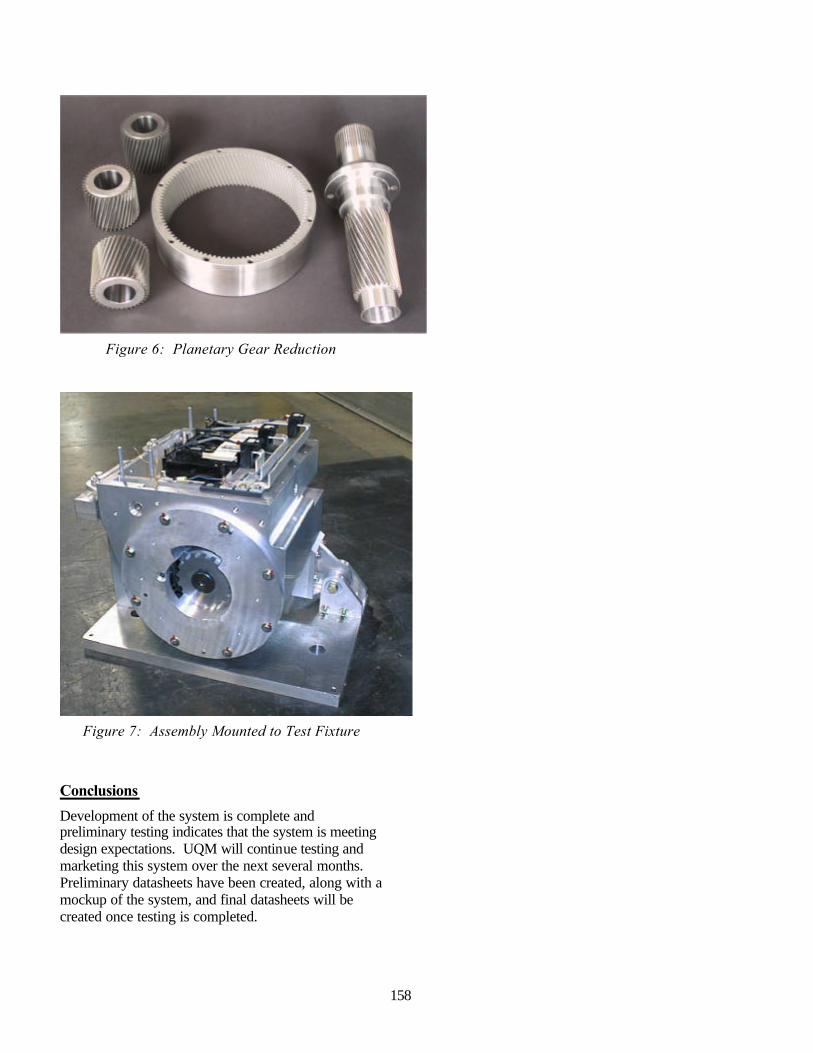
158
Figure 6: Planetary Gear Reduction
Figure 7: Assembly Mounted to Test Fixture
Conclusions
Development of the system is complete and preliminary testing indicates that the system is meeting design expectations. UQM will continue testing and marketing this system over the next several months. Preliminary datasheets have been created, along with a mockup of the system, and final datasheets will be created once testing is completed.
159
ACRONYMS
ac Alternating current AEMD Automotive electric motor drive AGPM Axial gap permanent magnet AIAA American Institute of Aeronautics and Astronautics AIPM Automotive integrated power module ANL Argonne National Laboratory ART Auxiliary resonant tank ASME American Society for Mechanical Education ASEE American Society for Engineering Education BDCM Brushless dc machine BJT Bipolar junction transistor BLDC Brushless dc CPSR Constant power speed ratio dc Direct current DOE Department of Energy DMIC Dual mode inverter control DVM Dual-voltage systems EMF Electromotive force EMI Electromagnetic interference FUDS Federal Urban Driving Schedule GTO Gate turn-off thyristor HEV Hybrid electric vehicle HSU-B High-strength undiffused brushless IGBT Insulated gate bipolar transistor IEEE Institute of Electrical and Electronics Engineers, Inc. I/O Input/output IM Induction motor I-V Current-voltage JPC Joint Propulsion Conference LMA Lockheed Martin Aeronautics MCT MOS controlled thyristor MEG Magnetic energy generator
160
MEMS Micro-electromechanical machines MICM Multilevel inverter cell module MLDCLI Multilevel dc link inverter MOSFET Metal oxide semiconductor field-effect transistor MTO MOS turn-off thyristor NASA National Aeronautics and Space Administration OAAT Office of Advanced Automotive Technologies ORNL Oak Ridge National Laboratory PC Personal computer PEEMRC Power Electronics and Electric Machinery Research Center PI Proportional integral PID Proportional integral differential PM Permanent magnet PMSM Permanent magnet synchronous motor PNGV Partnership for a New Generation of Vehicles PSSS Passive soft-switching snubber PWL Piece-wise linear PWM Pulse width modulation R&D Research and development RGPM Radial gap permanent magnet RSI Resonant snubber inverter RTW Real-Time Workshop SAE Society of American Engineers SEMA Segmented electromagnetic array Si Silicon SiC Silicon carbide SRM Switched reluctance motor VCS Visual Computing Systems WEMPEC Wisconsin Electric Machines & Power Electronics Consortium

This document highlights work sponsored by agencies of the U.S. Government. Neither the U.S.Government nor any agency thereof, nor any of their employees, makes any warranty, express or implied,or assumes any legal liability or responsibility for the accuracy, completeness, or usefulness of any infor-mation, apparatus, product, or process disclosed, or represents that its use would not infringe privatelyowned rights. Reference herein to any specific commercial product, process, or service by trade name,trademark, manufacturer, or otherwise does not necessarily constitute or imply its endorsement, recom-mendation, or favoring by the U.S. Government or any agency thereof. The views and opinions of authorsexpressed herein do not necessarily state or reflect those of the U.S. Government or any agency thereof.
Printed on recycled paper
www.cartech.doe.gov
DOE/EERE/OTT/OAAT - 2001/011
Office of Transportation TechnologiesSeries of 2001 Annual Progress Reports
• Office of Advanced Automotive Technologies FY 2001 Program Highlights
• Vehicle Propulsion and Ancillary Subsystems
• Automotive Lightweighting Materials
• Automotive Propulsion Materials
• Fuels for Advanced CIDI Engines and Fuel Cells
• Spark Ignition, Direct Injection Engine R&D
• Combustion and Emission Control for Advanced CIDI Engines
• Fuel Cells for Transportation
• Advanced Technology Development (High-Power Battery)
• Batteries for Advanced Transportation Technologies (High-Energy Battery)
• Vehicle Power Electronics and Electric Machines
• Vehicle High-Power Energy Storage
• Electric Vehicle Batteries R&D