Embed Size (px)
Citation preview
Cancer Biology and Signal Transduction
Vemurafenib Resistance Signature by ProteomeAnalysis Offers New Strategies and RationalTherapeutic ConceptsVerena Paulitschke1,Walter Berger2, Philipp Paulitschke3, Elisabeth Hofst€atter1,Bernhard Knapp4, Ruth Dingelmaier-Hovorka1, Dagmar F€odinger1,Walter J€ager5,Thomas Szekeres6, Anastasia Meshcheryakova7, Andrea Bileck8, Christine Pirker2,Hubert Pehamberger1, Christopher Gerner8, and Rainer Kunstfeld1
Abstract
The FDA-approved BRAF inhibitor vemurafenib achieves out-standing clinical response rates in patients with melanoma, butearly resistance is common. Understanding the pathologicmechanisms of drug resistance and identification of effectivetherapeutic alternatives are key scientific challenges in the mela-noma setting. Using proteomic techniques, including shotgunanalysis and 2D-gel electrophoresis, we identified a comprehen-sive signature of the vemurafenib-resistant M24met in compar-ison with the vemurafenib-sensitive A375 melanoma cell line.The resistant cells were characterized by loss of differentiation,induction of transformation, enhanced expression of the lyso-somal compartment, increased potential for metastasis, migra-tion, adherence and Ca2þ ion binding, enhanced expression of
the MAPK pathway and extracellular matrix proteins, and epithe-lial–mesenchymal transformation. The main features were veri-fied by shotgun analysis with QEXACTIVE orbitrap MS, electronmicroscopy, lysosomal staining, Western blotting, and adherenceassay in a VM-1 melanoma cell line with acquired vemurafenibresistance. On the basis of the resistance profile, we were able tosuccessfully predict that a novel resveratrol-derived COX-2 inhib-itor, M8, would be active against the vemurafenib-resistant butnot the vemurafenib-sensitive melanoma cells. Using high-throughput methods for cell line and drug characterization maythus offer a new way to identify key features of vemurafenibresistance, facilitating the design of effective rational therapeuticalternatives. Mol Cancer Ther; 14(3); 757–68. �2015 AACR.
IntroductionDuring the past 10 years, the incidence of melanoma has
increased more rapidly than that of any other cancer type. Up toone fifth of patients develop metastatic disease, which is associ-ated with poor prognosis and a median survival of 7.5 months.Dacarbazine, the mainstay of treatment for metastatic melanomaover the last 30 years, achieves response rates of 22%but does notimprove survival (1). After decades of failed attempts to improve
treatment outcomes, two new drugs, ipilimumab and vemurafe-nib (PLX4032), were shown in randomized phase III clinical trialsto significantly enhance overall survival (2, 3). Vemurafenib, anovel small-molecule BRAF inhibitor, was approved by the FDAin August 2011 for the treatment of metastatic or inoperablemelanoma harboring a BRAF V600E mutation (4).
Mutational activation of BRAF V600E is one of the most prev-alent genetic alterations in human melanoma (50% of all mela-nomas). Clinical responses, including complete remissions, wereachieved with vemurafenib in 80% of patients with BRAF V600E-mutated melanomas. However, acquired drug resistance frequent-ly emerged after 2 to 18 months (5). Despite intensive efforts, anunderstanding of resistance to BRAF inhibitors has yet to beachieved. The plasticity andheterogeneity ofmelanoma cells couldpotentially allow multiple adaptive mechanisms [e.g., epithelial–mesenchymal transition (EMT), and differences in proliferation,motility, or stem cell-like characteristics; ref. 6]. Thus, it is unlikelythat a single biomarker would serve to indicate drug resistance.
Proteomics facilitates the most comprehensive insight into thepathophysiological conditions derived from protein expressionprofiles and enables detection of distinct protein signatures ofdifferent cells. In a recent feasibility study, we explored thecharacteristics of cisplatin resistance in melanoma cell lines andconfirmed that proteome profiling and bioinformatics can sup-port the understanding of drug resistance mechanisms, with thepotential to guide individually tailored therapy (7).
In the present study, we sought to extend our earlier work (7),using high-throughput techniques such as shotgun analysis and
1Department of Dermatology, Medical University of Vienna, Vienna,Austria. 2Institute of Cancer Research and Comprehensive CancerCenter Vienna, Medical University Vienna, Vienna, Austria. 3Instituteof Physics, Center for NanoScience, Ludwig-Maximilians-University,Munich, Germany. 4Protein Informatics Group, Department of Statis-tics, University of Oxford, Oxford, United Kingdom. 5Department ofClinical Pharmacy and Diagnostics, University of Vienna,Vienna, Aus-tria. 6Department of Medical and Chemical Laboratory Diagnostics,Medical University of Vienna,Vienna, Austria. 7Institute of Pathophys-iology andAllergyResearch,Center for Pathophysiology, Infectiologyand Immunology, Medical University of Vienna,Vienna, Austria. 8Insti-tute of Analytical Chemistry, University of Vienna, Vienna, Austria.
Note: Supplementary data for this article are available at Molecular CancerTherapeutics Online (http://mct.aacrjournals.org/).
Corresponding Author: Rainer Kunstfeld, Division of General Dermatology,Department of Dermatology, Medical University Vienna, Waehringerguertel18-20, 1090 Vienna, Austria. Phone: 43-1-40400-62620; Fax: 43-1-40400-78500; E-mail: [email protected]
doi: 10.1158/1535-7163.MCT-14-0701
�2015 American Association for Cancer Research.
MolecularCancerTherapeutics
www.aacrjournals.org 757
on August 6, 2020. © 2015 American Association for Cancer Research. mct.aacrjournals.org Downloaded from
Published OnlineFirst January 22, 2015; DOI: 10.1158/1535-7163.MCT-14-0701
2D-gel electrophoresis to compare the features of vemurafenib-sensitive with -resistant melanoma cell lines and identify a com-prehensive signature of vemurafenib resistance. On the basis ofthese findings, we aimed to explore whether proteome analysiscould be used to predict sensitivity to a rationally chosen agent,based on its mechanism of action.
Materials and MethodsCell line and chemicals
The A375 melanoma cell line (ATCC) harbors a mutation inBRAFV600E, whereas the metastatic M24met line harbors amutation in NRAS, a deletion in p16, and amplification inEGFR. Melanoma cells expressing the BRAF mutation arereported to be vemurafenib sensitive, while resistance may beassociated with NRAS mutation or activation (8, 9). TheM24met cell line was previously found to be resistant tocisplatin, whereas the A375 was sensitive (7). M24met andA375 melanoma cells were described previously (7, 10) andwhere obtained in 2005.
M24met cells (kindly provided by Dr. R.A. Reisfeld, Depart-ment of Immunology, Scripps Research Institute, La Jolla,CA) were grown in RPMI-1640 supplemented with 10% FBS, 2mmol/L glutamine, and 50 mg/mL gentamycin sulfate. A375weregrown inD-MEM tissue culturemedium supplemented with 10%FBS, 2 mmol/L glutamine, and 50 mg/mL gentamycin sulphate asdescribed previously.
We studied these two cell lines to gain an initial understandingof vemurafenib sensitivity and resistance and subsequentlyattempted to verify these changes in an established melanomamodel with acquired vemurafenib resistance.
For this purpose, we used a vemurafenib-sensitive cell line VM-1, which harbors themutation BRAF V600E (11). VM-1 cells havebeen established at the Institute of Cancer Research (Vienna,Austria) from a lymph node metastasis (primary tumor: super-ficial spreading melanoma) from a female patient in 1978 andwere obtained by us in 2012. The cell lines were authenticated atthe Institute of Cancer Research in all cases by array comparativegenomic hybridization (Agilent; 44 k human whole-genomeDNA arrays) as published previously (12) and STR fingerprintingduring this study in June 2014.
We generated a series of melanoma cell lines with increasingvemurafenib resistance, by exposing a vemurafenib-sensitive cellline VM-1 (V0) to increasing concentrations of the drug: 0.5, 1,and 10 mmol/L. The resultant cell lines were termed V0.5, V1, andV10, respectively: V0 is the sensitive parent cell line.
3,30,4,40,5,50-hexahydroxystilbene (M8) was provided by theDepartment of Pharmaceutical Chemistry, University ofVienna, Austria, frozen as 50 or 10 mmol/L stock solutionsin DMSO (Sigma-Aldrich) and diluted in RPMI as required(13). Vemurafenib, diluted in DMSO, was purchased from Fa.Eubio.
Cell proliferation assayThe CellTiter 96 AQueous Non-Radioactive Cell Proliferation
Assay (Promega)was used according tomanufacturer's guidelinesas described previously (10). In brief, cells are plated in 96-wellplates (1,500 cells/well). After 24 hours, increasing concentra-tions of vemurafenib,M8or a solvent control (DMSOalone)wereadded. After 48 hours, proliferation is measured at 490 nm withan ELISA plate reader.
FACS analysisFACS analysis of A375 and M24met melanoma cells was
performed as described previously (14).
Lysosomal stainingLysosomal staining of vemurafenib-sensitive and -resistant
cells was performed as described previously (7) using LysotrackerRed DND-99 (Molecular Probes; L7528). Cells were seeded oncoverslips, treated with DMSO or vemurafenib for 48 hours, andincubated with Lysotracker Red for 1 hour at 37�C. Images werecaptured by a Zeiss confocal microscope.
Scanning electron microscopyScanning electron microscopy (SEM) with V0, V0.5, V1, and
V10 was performed as described previously (15). Critical pointdryingwas applied. The SEM imageswere taken at amagnificationbetween 500 and 6,000 using a Leo DSM 982 field emissionscanning electron microscope at 4 kV.
CytoSelect 48-well cell adhesion assay (ECMarray, colorimetricformat)
The ECM Array was performed as described previously (7).Vemurafenib-resistant and -sensitive cells were allowed to attachto ECM-coated well plates for 1 hour at 100,000 cells/well.Unbound cells were washed away and the adherent cells stainedand quantified calorimetrically.
IHC staining of the primary melanoma cellsM24met and A375 melanoma cells were grown on tissue
culture chamber slides (Nalge Nunc) and fixed in 4% formalde-hyde then stained with the primary antibodies HMB45, Melan A,S100 (Dako, Corporation), Nestin (IBL), and p75NTR (Sigma), asdescribed previously (13).
Western blot analysisCells (A375, M24met, vemurafenib-sensitive, and -resistant
melanoma cells) were frozen in liquid nitrogen and lysed withlysis buffer containing phosphatase and protease inhibitors asdescribed previously (10, 16). Membranes were incubated withthe following primary antibodies: monoclonal mouse anti-human Vimentin Clone V9 (Dako), N-cadherin, or E-cadherin(Cell Signaling Technology).
Zymography assayZymography Assay was performed as described previously
(10). The supernatant of V0, V0.5, V1, and V10 was collected.The SDS gel contained gelatine (1 mg/mL), was stained inCoomassie solution for 30 minutes, and stripped with an iso-propanol-acetic acid solution (BioTeZ Berlin-Buch GmbH).
Proteome analysisProteome analysis was performed as described previously
(7, 10).
Subcellular fractionation and 1D PAGE. All fractionation stepswere performed on ice. To obtain the cytoplasmic fraction, A375,M24met, V0, and V1 cells were lysed in isotonic lysis buffer (10mmol/L HEPES/NaOH, pH 7.4, 0.25 mol/L sucrose, 10 mmol/LNaCl, 3 mmol/L MgCl2, 0.5% Triton X-100) supplemented withprotease inhibitors (pepstatin, leupeptin, and aprotinin, each at 1
Paulitschke et al.
Mol Cancer Ther; 14(3) March 2015 Molecular Cancer Therapeutics758
on August 6, 2020. © 2015 American Association for Cancer Research. mct.aacrjournals.org Downloaded from
Published OnlineFirst January 22, 2015; DOI: 10.1158/1535-7163.MCT-14-0701
mg/mL; 1mmol/L PMSF) andmechanical shear stress. In addition,we performed nuclear fractionation of V0 and V1 cells. By centri-fugation at 2,300 � g and 4�C for 5 minutes, the cytoplasmicproteinswere separated from the nuclei and precipitated overnightwith ice-cold ethanol at �20�C. After precipitation, proteins weredissolved in sample buffer (7.5mol/Lurea, 1.5mol/L thiourea, 4%CHAPS, 0.05% SDS, 100 mmol/L DTT); the determination ofprotein concentration was carried out using a Bradford assay(Bio-Rad). For gaining nuclear proteins, pellets were swelled upfor 10 minutes in extraction buffer (500 mmol/L NaCl) and 1:10diluted with NP-40 buffer for another 15 minutes. To obtain thenuclear fraction, centrifugation at 2,300 g and 4�C for 5 minuteswas performed. The extracted proteins were then precipitatedovernight with ice-cold ethanol at �20�C. After precipitation, allsamplesweredissolved in samplebuffer (7.5mol/Lurea, 1.5mol/Lthiourea, 4% CHAPS, 0.05% SDS, 100 mmol/L DDT) and theprotein concentrations were determined by means of Bradfordassay (Bio-RadLaboratories).MS-samplepreparation20mgof eachsample was loaded on SDS-PAGE. The different protein fractionswere loadedseparatelyon12%polyacrylamidgels. Electrophoresiswasperformeduntil complete separationof aprestainedmolecularmarker (DualColor,Bio-Rad).Proteins in the gelswere stainedbyaMS-compatible silver staining. After fixation with 50%methanol/10% acetic acid, the gels were washed by bi-distilled water and theproteins inside the gel were sensitized with 0.02%Na2S2O3. Gelswere then stained with ice-cold 0.1% AgNO3 for 10 minutes,rinsed by bi-distilled water, and subsequently developed with3%Na2CO3/0.05% formaldehyde. Afterwards, each protein bandwas cut into eight slices and destained. Upon reduction with DTT(dithiothreitol) and alkylation with IAA (iodoacetamide), theproteins were digested enzymatically overnight at 37�C usingtrypsin (Roche Diagnostics). The peptides were eluted, dried, andstored at �20�C until LC/MS analysis.
2D-gel electrophoresis. 2D-gel electrophoresis was performed asdescribed previously (17). The cytosolic protein extracts of A375andM24met cells used aswell for shotgun analysiswere loadedbypassive rehydration of IPG strips pH 5–8, 17 cm at room tem-perature followed by isoelectric focusing which was performed ina stepwise fashion (1 hour 0–500 V linear; 5 hours 500 V; 5 hours500–3,500 V linear; 12 hours 3,500 V). Equilibration was per-formed with 100mmol/L DTT and 2.5% iodacetamide accordingto the manufacturer's instructions (Bio-Rad). For SDS-PAGE, theIPG strips were placed on top of 1.5mm12%polyacrylamide slabgels and overlaid with 0.5% low-melting agarose. Gels werestained with a 400 nmol/L solution of Ruthenium II tris (bath-ophenanthroline disulfonate; RuBPS; ref. 18) and scanned withthe FluorImager 595 (Amersham Biosciences) at a resolution of100 mm. The gels were dried and storage phosphor screens(Molecular Dynamics) were exposed at room temperature for24 hours. Screens were subsequently scanned using the Phos-phorimager SI (Molecular Dynamics) at a resolution of 100 mm.Gels were adjusted to a reference gel with the TT900 S2S software(version 2006.0.2389, Nonlinear Dynamics) and evaluated withthe Progenesis software PG200 (version 2006, Nonlinear) usingthe "same spot" algorithm. Spot assignment, background correc-tion, normalization, and statistical calculations (ANOVA) wereperformed using this software package. For protein identification,peptides were isolated as described above and separated by nano-flow liquid chromatography (1100 Series LC system, Agilent) asdescribed below.
Shotgun analysis using Agilent nanoflow LC. Peptides of thecytoplasmic fraction of A375 and M24met were separated bynano-flow LC using the HPLC-Chip technology from Agilent,equipped with a 40 nL Zorbax 300SB-C18 trapping column and a75 mm � 150 mm Zorbax 300SB-C18 separation column. Forpeptide elution, we applied a gradient from 0.2% formic acid and3% ACN to 0.2% formic acid and 40% ACN over 60 minutes at aflow rate of 400 nL/minute. Peptide identification was accom-plished by MS–MS fragmentation analysis with an iontrap massspectrometer (XCT-Ultra, Agilent) equipped with an orthogonalnanospray ion source. The MS–MS data were interpreted by theSpectrum Mill MS Proteomics Workbench software (VersionA.03.03, Agilent) searching against the SwissProt/UniProtKB pro-tein database for human proteins (Version 12/2010 containing20328 entries). Capillary voltagewas set to 1.75 kV, peptides weresearched within a m/z range from 400 to 1,400, fragmentationwas triggered for the four highest peptide candidates, allowing forthree independent fragmentations and using a dynamic exclusionlist lasting for 1minute. Precursormass deviationwas limited to amaximum of 1.5 Da, the product mass tolerance to maximal 0.7Da and the minimum matched peak intensity (%SPI) to 70%. Apeptide was included in the result files when its SpectrumMillscore was above. Peptides scoring between 9 and 13 were onlyincluded if precursor m/z value, retention time, and MS2 patternmatched to a reference spectrum scoring above. Concerningprotein inference, we chose the smallest number of proteinsnecessary to explain all observed peptides as described for Pro-teinProphet. Furthermore, only proteins identified with at leasttwo distinct peptides were included. Selection of protein identi-fication was also based on robustness. Only peptide identifica-tions reproduced in at least two different samples were included.The FDR was determined by searching against the correspondingreversed database.Ourfiltering steps led to peptide identificationswith consistently less than 1% apparent identifications whensearching against the reversed database compared with the searchagainst the true database, demonstrating high data accuracy.
Identification details for each protein including all identifiedpeptides, sequence coverage, peptide scores, and MS2 spectra arefully accessible via the PRIDE database (http://www.ebi.ac.uk/pride/).
Shotgun analysis using QEXACTIVE orbitrap MS. Peptides of thecytoplasmic and nuclear fraction V0 and V1 were separated usingnanoflowUHPLC (DionexUltimate 3000) with a 50 cm� 75 mm2 mmparticle size Pepmap100 column (Thermo Fisher Scientific)and a flow rate of 300 nL/minute, using 100% mobile phase A(98.8%H2O, 1%ACN, 0.2%FA) and a gradient ofmobile phase B(80% ACN, 19.8% H2O, 0.2% FA) from 8% to 40% solvent Bwithin 240 minutes. Peptides are analyzed in positive ionizationmode at a resolution of 70,000 (at m/z ¼ 200) in the range fromm/z 400 to 1,400 and fragmented using HCD in a QEXACTIVEorbitrap MS (Thermo) in a data-dependent mode upon fragmen-tation at 30% normalized collision energy (isolation width ofDm/z ¼ 2, 150 ms collection time, fragmention at 30 eV, reso-lution 17500 at m/z ¼ 200, top 10 method). All samples wereanalyzed by LC/MS-MS as duplicates. Data were analyzed usingProteome Discoverer 1.4 equipped with Mascot 2.2 and filtered,allowing a maximum of 5 ppm initial mass deviation for precur-sor ion spectra and 20 ppm for MS/MS spectra, and only peptideswith a FDR less than 0.01 (validation based on q-value). The MS-MS data analysis, including peak list-generation and spectrum
Vemurafenib Resistance Signature in Melanoma
www.aacrjournals.org Mol Cancer Ther; 14(3) March 2015 759
on August 6, 2020. © 2015 American Association for Cancer Research. mct.aacrjournals.org Downloaded from
Published OnlineFirst January 22, 2015; DOI: 10.1158/1535-7163.MCT-14-0701

identification, was done using the Spectrum Mill MS ProteomicsWorkbench software (Version A.03.03, Agilent). We allowed fortwo missed cleavages and searched against the SwissProt/Uni-ProtKB protein database (Version 12/2010 containing 20328entries) for human proteins, allowing for precursor mass devia-tion of 1.5 Da, product mass tolerance of 0.7 Da, and aminimummatched peak intensity (% SPI) of 70%. Because of previouschemical modification, carbamidomethylation of cysteines wasset as a fixedmodification. Oxidation of methionine was the onlyposttranslational modification considered.
As described in ref. (19), label-free quantitative data analysiswas supported by MaxQuant 1.3.0.5 including the Andromedasearch engine and the integrated statistical analysis package Per-seus (20, 21). Protein identification was achieved searchingagainst the SwissProt Database (version 012013 with 20 264entries) allowing amass tolerance of 5 ppm forMS spectra and 20ppm for MS-MS spectra. Furthermore, search criteria included amaximum of two missed cleavages, a minimum of two peptideidentifications per protein, at least one of themunique, and a FDRless than 0.01 for both, peptide identification as well as proteinidentification. Again carbamidomethylation of cysteine residueswas set as a fixed modification and oxidation of methionineresidues and N-terminal protein acetylation as variable modifica-tions. Obtained protein identifications were further analyzedusing Perseus (version 1.3.0.4), therefore proteins were filteredfor reversed sequences and contaminants as well as aminimumofthree independent identifications per protein. Significantly up-and downregulated proteins were determined applying a two-sided t test with significance level of P < 0.05 (permutation-basedcorrection). In addition, hierarchical clustering was achievedusing euclidean distance and average linkage clustering of Z-scored expression values as well as 2D Annotation enrichmentanalysis was performed based on gene ontology cellular com-partment, molecular function, and biologic process terms andKyoto Encyclopedia of Genes and Genomes pathways accordingto Geiger and colleagues (22).
ResultsInteraction of vemurafenib with the kinase domain of BRAF(V600E)
Vemurafenib is a small-molecule BRAF inhibitor active againstV600E-mutated melanoma. Three-dimensional modeling ofBRAF bound by vemurafenib and non-liganded BRAF (Fig. 1)shows that vemurafenib may hamper E600 from forming a saltbridge with K507.
Characterization of A375 and M24metThe cisplatin-resistant M24met cell line was found to also be
resistant to vemurafenib, whereas the cisplatin-sensitive A375wasalso sensitive to vemurafenib (Supplementary Table S1).
IHC and FACS analysis revealed that A375 cells exhibited asmall rounded cell shape, whereas M24met were characterized bysprouted cells with a larger cytoplasmic compartment. These cellsformed tubes, a characteristic feature of endothelial cells (Sup-plementary Fig. S1A). M24met and A375 expressed the melano-mamarker proteins S100, p75NTR, and nestin, but were negativefor the fibroblast cell marker protein CD90, the endothelialmarker proteins CD31 and CD34, and the leukocyte markerprotein CD45 (Supplementary Fig. S1C and S1D). A375 cellsalso showed a higher proliferation rate than M24met.
Protein expression pattern2D gel electrophoresis (2D-PAGE) of the cytoplasmic fraction
of A375 and M24met was then performed. Of 750 spots indi-vidually cut from the gel, digested and analyzed by nano-LC MS-MS, a total of 588 distinct proteins were successfully identified. Incase of 58 spots, no successful identification was achieved, 86proteins were identified in two different spots, and 18 proteinswere identified in three different spots. Three hundred and fiftyfour of the 588 identified proteins were common or ubiquitouslyexpressed proteins that canbe found in a great number of differentcell types (23).
Figure 2A and B depicts the high similarity of the protein spotpatterns of the melanoma cells (differentially expressed proteins
Figure 1.Three-dimensional representation of the non-crystallographic-symmetrydimer of the kinase domain of BRAF (V600E). A, BRAFboundby vemurafenibis shown in blue and unliganded BRAF in green. The rendering is based onProtein Data Base (PDB; ref. 46) accession code 3OG7 (30). In this structure,several key residues are missing (including E600 of the vemurafenib-liganded B-RAF). These residues were computationally modeled using theFREADmodule (47) of MEDELLER (48) and are shown in white. Vemurafenibis colored according to its atom types. For clarity of the orientation, thebinding site of vemurafenib in the unliganded BRAF is indicated by atransparent superimposition of vemurafenib. The side–chain interactionsbetween the key residues E600 and K507 for the liganded and unligandedBRAF are highlighted in yellow. B, the identical data as inA are shownwith theviewing angle rotated by 180� .
Paulitschke et al.
Mol Cancer Ther; 14(3) March 2015 Molecular Cancer Therapeutics760
on August 6, 2020. © 2015 American Association for Cancer Research. mct.aacrjournals.org Downloaded from
Published OnlineFirst January 22, 2015; DOI: 10.1158/1535-7163.MCT-14-0701
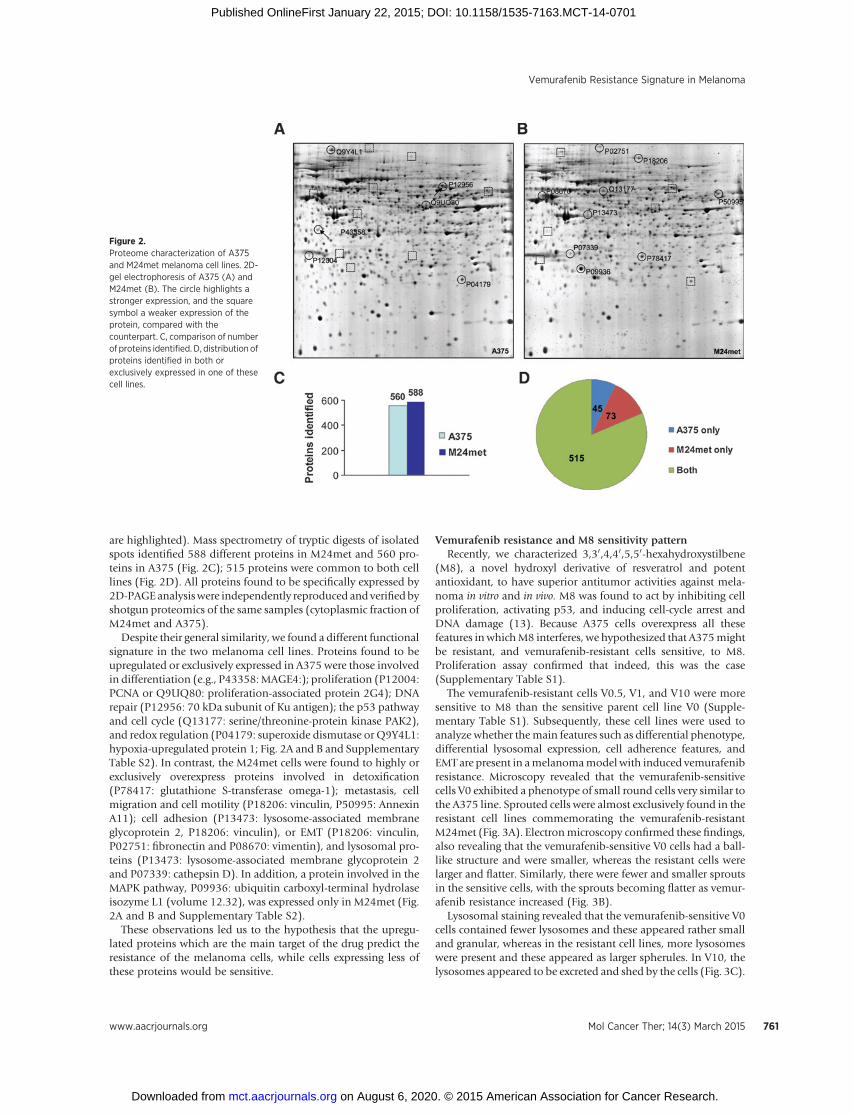
are highlighted). Mass spectrometry of tryptic digests of isolatedspots identified 588 different proteins in M24met and 560 pro-teins in A375 (Fig. 2C); 515 proteins were common to both celllines (Fig. 2D). All proteins found to be specifically expressed by2D-PAGEanalysiswere independently reproduced andverifiedbyshotgun proteomics of the same samples (cytoplasmic fraction ofM24met and A375).
Despite their general similarity, we found a different functionalsignature in the two melanoma cell lines. Proteins found to beupregulated or exclusively expressed in A375 were those involvedin differentiation (e.g., P43358:MAGE4:); proliferation (P12004:PCNA or Q9UQ80: proliferation-associated protein 2G4); DNArepair (P12956: 70 kDa subunit of Ku antigen); the p53 pathwayand cell cycle (Q13177: serine/threonine-protein kinase PAK2),and redox regulation (P04179: superoxide dismutase or Q9Y4L1:hypoxia-upregulated protein 1; Fig. 2A and B and SupplementaryTable S2). In contrast, the M24met cells were found to highly orexclusively overexpress proteins involved in detoxification(P78417: glutathione S-transferase omega-1); metastasis, cellmigration and cell motility (P18206: vinculin, P50995: AnnexinA11); cell adhesion (P13473: lysosome-associated membraneglycoprotein 2, P18206: vinculin), or EMT (P18206: vinculin,P02751: fibronectin and P08670: vimentin), and lysosomal pro-teins (P13473: lysosome-associated membrane glycoprotein 2and P07339: cathepsin D). In addition, a protein involved in theMAPK pathway, P09936: ubiquitin carboxyl-terminal hydrolaseisozyme L1 (volume 12.32), was expressed only in M24met (Fig.2A and B and Supplementary Table S2).
These observations led us to the hypothesis that the upregu-lated proteins which are the main target of the drug predict theresistance of the melanoma cells, while cells expressing less ofthese proteins would be sensitive.
Vemurafenib resistance and M8 sensitivity patternRecently, we characterized 3,30,4,40,5,50-hexahydroxystilbene
(M8), a novel hydroxyl derivative of resveratrol and potentantioxidant, to have superior antitumor activities against mela-noma in vitro and in vivo. M8 was found to act by inhibiting cellproliferation, activating p53, and inducing cell-cycle arrest andDNA damage (13). Because A375 cells overexpress all thesefeatures in whichM8 interferes, we hypothesized that A375mightbe resistant, and vemurafenib-resistant cells sensitive, to M8.Proliferation assay confirmed that indeed, this was the case(Supplementary Table S1).
The vemurafenib-resistant cells V0.5, V1, and V10 were moresensitive to M8 than the sensitive parent cell line V0 (Supple-mentary Table S1). Subsequently, these cell lines were used toanalyze whether themain features such as differential phenotype,differential lysosomal expression, cell adherence features, andEMT are present in amelanomamodel with induced vemurafenibresistance. Microscopy revealed that the vemurafenib-sensitivecells V0 exhibited a phenotype of small round cells very similar tothe A375 line. Sprouted cells were almost exclusively found in theresistant cell lines commemorating the vemurafenib-resistantM24met (Fig. 3A). Electronmicroscopy confirmed these findings,also revealing that the vemurafenib-sensitive V0 cells had a ball-like structure and were smaller, whereas the resistant cells werelarger and flatter. Similarly, there were fewer and smaller sproutsin the sensitive cells, with the sprouts becoming flatter as vemur-afenib resistance increased (Fig. 3B).
Lysosomal staining revealed that the vemurafenib-sensitive V0cells contained fewer lysosomes and these appeared rather smalland granular, whereas in the resistant cell lines, more lysosomeswere present and these appeared as larger spherules. In V10, thelysosomes appeared to be excreted and shed by the cells (Fig. 3C).
Figure 2.Proteome characterization of A375and M24met melanoma cell lines. 2D-gel electrophoresis of A375 (A) andM24met (B). The circle highlights astronger expression, and the squaresymbol a weaker expression of theprotein, compared with thecounterpart. C, comparison of numberof proteins identified. D, distribution ofproteins identified in both orexclusively expressed in one of thesecell lines.
Vemurafenib Resistance Signature in Melanoma
www.aacrjournals.org Mol Cancer Ther; 14(3) March 2015 761
on August 6, 2020. © 2015 American Association for Cancer Research. mct.aacrjournals.org Downloaded from
Published OnlineFirst January 22, 2015; DOI: 10.1158/1535-7163.MCT-14-0701

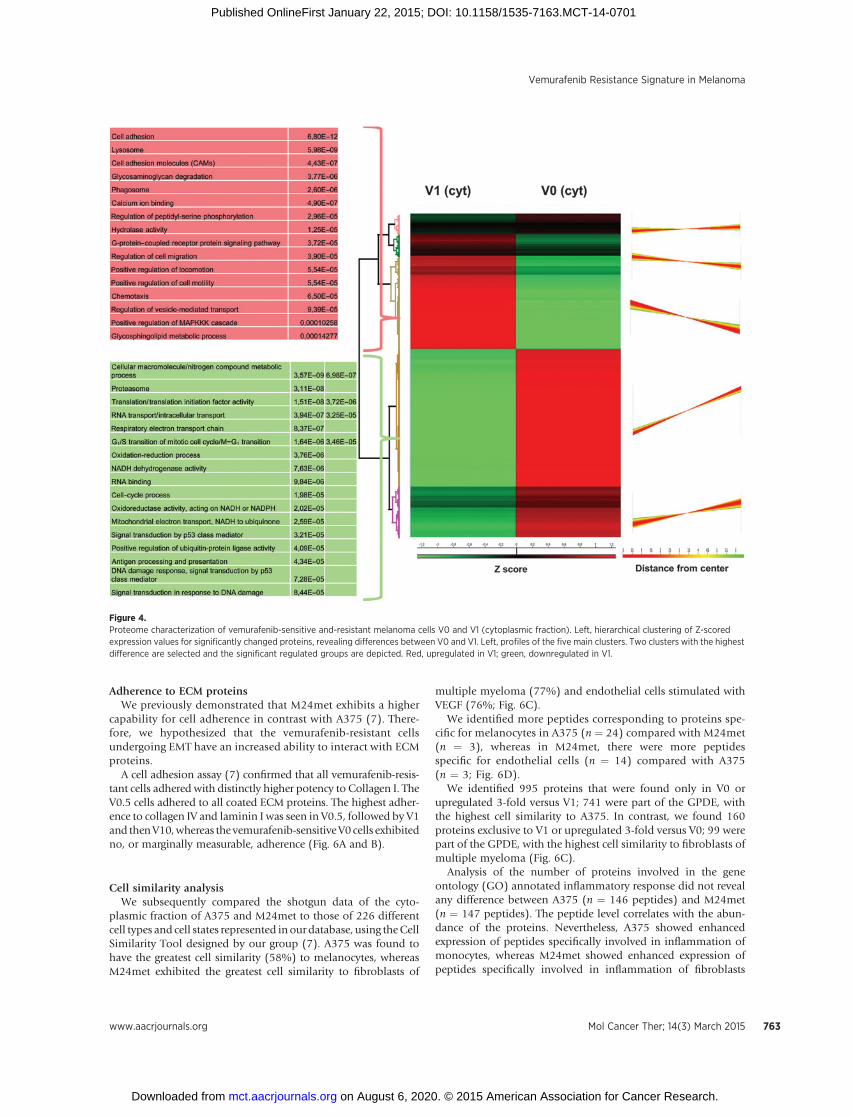
To verify our observed signature in A375 and M24met mela-noma cell lines, we performed shotgun analysis with the well-defined acquired resistancemodel V0 and V1. Shotgun analysis ofthe cytoplasmic andnuclear fractions ofV0andV1wasdoneusingQEXACTIVE orbitrap MS. In the cytoplasmic fraction, we identi-fied 5,069 of 48,261 (number of proteins/peptides) in V0 and4078/34904 in V1. In the nuclear fraction, we identified 4,484 of41,824 in V0 and 4,029 of 36,322 in V1. Using MaxQuantanalysis, we generated heatmaps of the cytoplasmic and nuclearfractions of V0 and V1. Unsupervised hierarchical clustering of Z-scored protein abundances of the cytoplasmic fraction yieldedcomparable results to the nuclear fraction. Themain differences inthe cytoplasmic fraction were found in clusters 3 and 4 (Fig. 4),whereas in the nuclear fraction the main differences were inclusters 1 and 5 (Supplementary Fig. S2).
The groups significantly upregulated in V1 were cell adhesion;the lysosomal compartment; cell adhesionmolecules; glycosami-noglycan degradation; phagosomes; calcium ion binding; regu-lation of peptidyl-serine phosphorylation; hydrolase activity; G-protein coupled receptor protein signaling pathway; cell migra-tion; locomotion; chemotaxis; positive regulation of MAPKKcascade, and glycosphingolipid metabolic process. Some of thesegroupswere also found tobeupregulated in thenuclear fractionofV1 in addition to, for example, antigen processing and presenta-tion. In comparison, the significant upregulated groups in V0weredifferent metabolic processes; translational processes; RNA trans-port and binding; cell cycle processes; NADH dehydrogenase,oxireductase andmitochondrial activity; DNAdamage and repair,and signal transduction by p53 (Fig. 4 and Supplementary Fig.S2). Interestingly, the main differences were also detectable bycomparing the shotgun data for A375 (comparable with V0)versus M24met (comparable with V1), as presented in Fig. 2 andalso reported recently (7). The main differences are summarizedin Table 1.
Expression of EMT markersBecause the observed morphologic changes in resistant cells
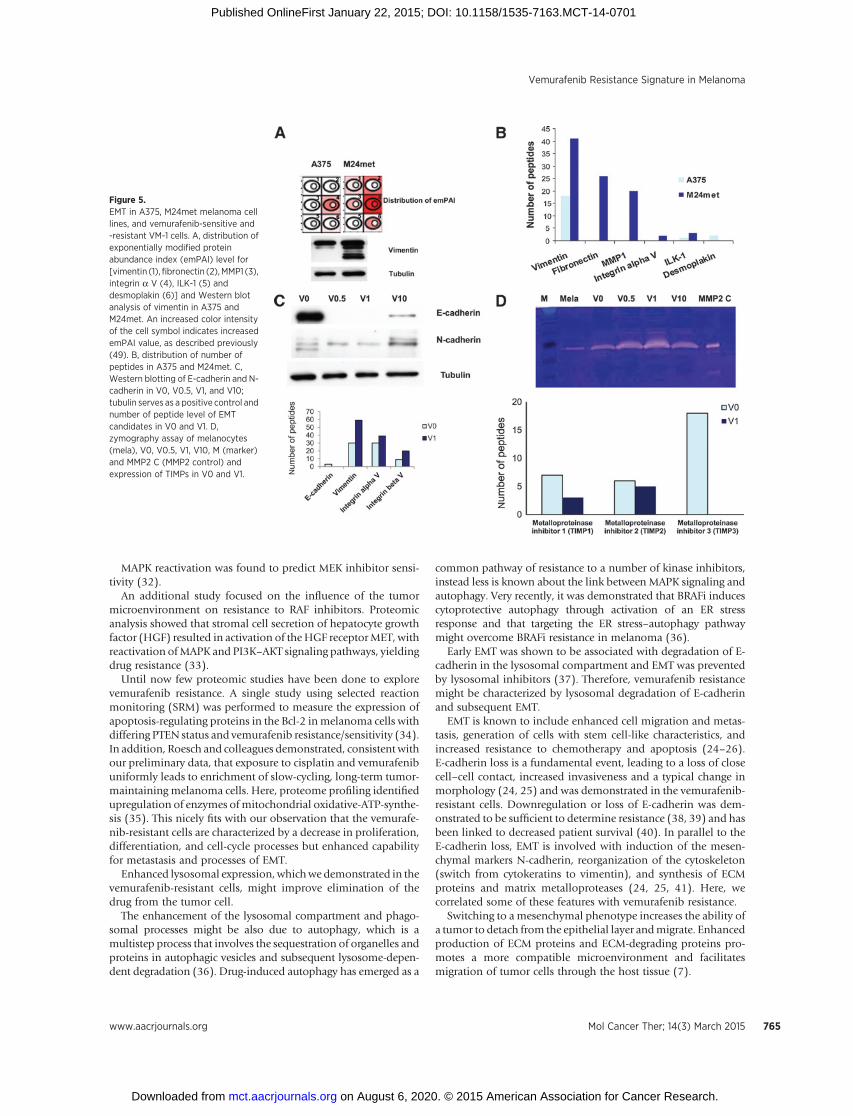
might be due to EMT and EMT markers such as vimentin andfibronectin, shown to be enhanced in the M24met cells (Fig. 5B,Supplementary Table S2), we investigated the different EMTmarkers. Comparison of shotgun proteome profiles of A375 andM24met was in line with the 2D-gel electrophoresis data. Asdemonstrated by emPAI values and peptide counts, M24met cellshighly expressed mesenchymal proteins such as vimentin, fibro-nectin,MMP1 (matrixmetalloproteinase 1), integrinaV, and ILK-1, whereas A375 exhibited higher expression of the epithelialmarker desmoplakin, which is associatedwith cell adherence (Fig.5A and B). The most prominent difference was seen in thevimentin expression and thiswas verified byWestern blot analysis(Fig. 5A).
Because EMT is associated with induction of resistance andmetastasis (24–26), we performed Western blot analysis of keyEMT markers in the vemurafenib-sensitive and -resistant cells.Loss of E-cadherin accompanied by a gain in N-cadherin isconsidered to be a fundamental event in EMT (25). An E-cad-herin/N-cadherin switchwas evident in the vemurafenib-resistantcell line, with a total loss of E-cadherin in V0.5 and V1, and lowexpression of E-cadherin in V10 (Fig. 5C). In the proteome data,we identified only E cadherin in V0, whereas vimentin and furtherEMTmarkers such as integrina and b Vwere identified withmorepeptides in V1 (Fig. 5C).
EMT is also associated with a higher expression of MMPs.Zymography Assay confirmed lower expression of MMP-2 inmelanocytes than in V0, which in turn showed higher MMP-2expression than all resistant cell lines. The V0.5 line showed thehighest expression of MMPs (Fig. 5D). This is in line withthe lower expression of the metalloproteinase inhibitors(TIMPs) 1, 2, and 3 in V1 in comparison with V0 at a peptidelevel (Fig. 5D).
Figure 3.Microscopic characterization ofvemurafenib-sensitive and-resistantmelanoma cells V0, V0.5, V1, V10. A,microscopy; B, electron microscopy;C, lysosomal staining.
Paulitschke et al.
Mol Cancer Ther; 14(3) March 2015 Molecular Cancer Therapeutics762
on August 6, 2020. © 2015 American Association for Cancer Research. mct.aacrjournals.org Downloaded from
Published OnlineFirst January 22, 2015; DOI: 10.1158/1535-7163.MCT-14-0701
Adherence to ECM proteinsWe previously demonstrated that M24met exhibits a higher
capability for cell adherence in contrast with A375 (7). There-fore, we hypothesized that the vemurafenib-resistant cellsundergoing EMT have an increased ability to interact with ECMproteins.
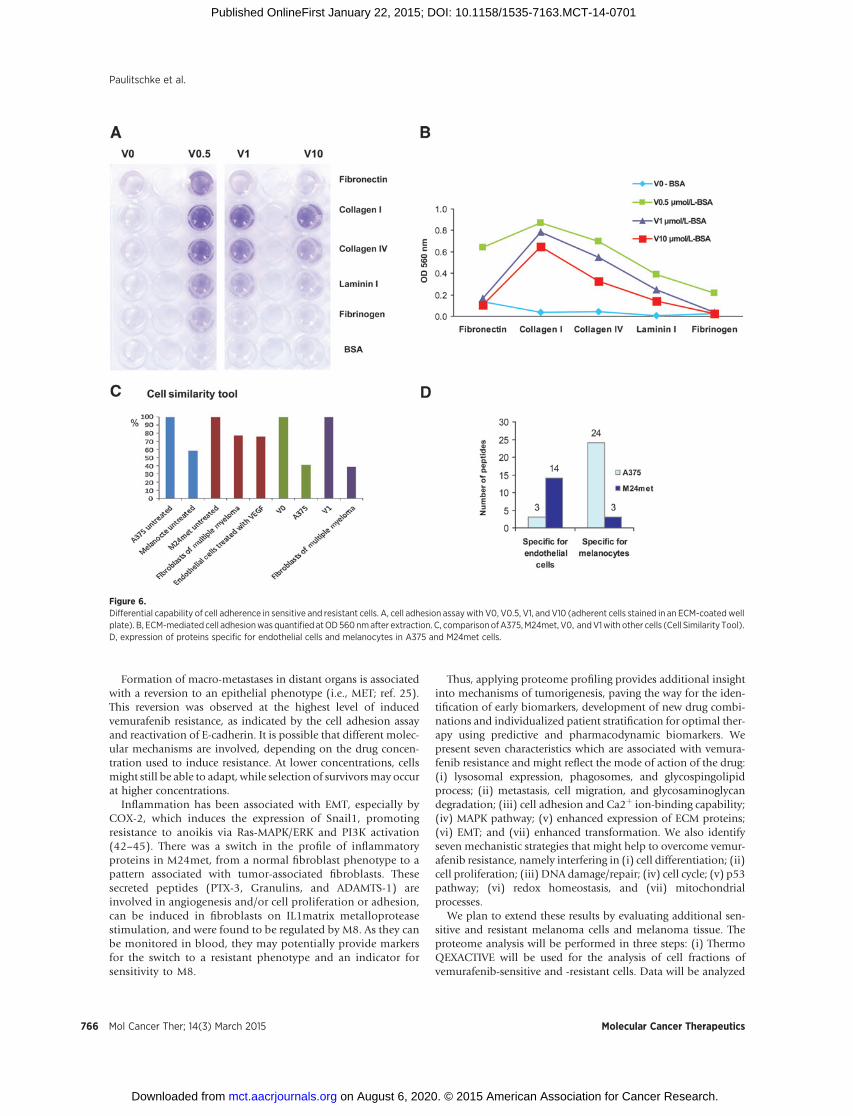
A cell adhesion assay (7) confirmed that all vemurafenib-resis-tant cells adhered with distinctly higher potency to Collagen I. TheV0.5 cells adhered to all coated ECM proteins. The highest adher-ence to collagen IV and laminin I was seen in V0.5, followed by V1and thenV10,whereas the vemurafenib-sensitiveV0 cells exhibitedno, or marginally measurable, adherence (Fig. 6A and B).
Cell similarity analysisWe subsequently compared the shotgun data of the cyto-
plasmic fraction of A375 and M24met to those of 226 differentcell types and cell states represented inour database, using theCellSimilarity Tool designed by our group (7). A375 was found tohave the greatest cell similarity (58%) to melanocytes, whereasM24met exhibited the greatest cell similarity to fibroblasts of
multiple myeloma (77%) and endothelial cells stimulated withVEGF (76%; Fig. 6C).
We identified more peptides corresponding to proteins spe-cific for melanocytes in A375 (n ¼ 24) compared with M24met(n ¼ 3), whereas in M24met, there were more peptidesspecific for endothelial cells (n ¼ 14) compared with A375(n ¼ 3; Fig. 6D).
We identified 995 proteins that were found only in V0 orupregulated 3-fold versus V1; 741 were part of the GPDE, withthe highest cell similarity to A375. In contrast, we found 160proteins exclusive to V1 or upregulated 3-fold versus V0; 99 werepart of the GPDE, with the highest cell similarity to fibroblasts ofmultiple myeloma (Fig. 6C).
Analysis of the number of proteins involved in the geneontology (GO) annotated inflammatory response did not revealany difference between A375 (n ¼ 146 peptides) and M24met(n ¼ 147 peptides). The peptide level correlates with the abun-dance of the proteins. Nevertheless, A375 showed enhancedexpression of peptides specifically involved in inflammation ofmonocytes, whereas M24met showed enhanced expression ofpeptides specifically involved in inflammation of fibroblasts
Figure 4.Proteome characterization of vemurafenib-sensitive and-resistant melanoma cells V0 and V1 (cytoplasmic fraction). Left, hierarchical clustering of Z-scoredexpression values for significantly changed proteins, revealing differences between V0 and V1. Left, profiles of the five main clusters. Two clusters with the highestdifference are selected and the significant regulated groups are depicted. Red, upregulated in V1; green, downregulated in V1.
Vemurafenib Resistance Signature in Melanoma
www.aacrjournals.org Mol Cancer Ther; 14(3) March 2015 763
on August 6, 2020. © 2015 American Association for Cancer Research. mct.aacrjournals.org Downloaded from
Published OnlineFirst January 22, 2015; DOI: 10.1158/1535-7163.MCT-14-0701
(Supplementary Fig. S3a). M8 was found to inhibit the inflam-matory proteins upregulated in M24met, including lysyl oxidasehomolog, plasminogen activator inhibitor 1, ADAMTS-1, pen-traxin-related protein (PTX3), and granulins (Supplementary Fig.S3B and S3C). These proteins are all induced by IL1b, whileseveral are induced by VEGF stimulation and/or upregulated intumor-associated fibroblasts (Supplementary Fig. S3D).
DiscussionVemurafenib resistance is a key problem for melanoma
treatment and an understanding of the underlying mechan-isms may help to develop not only predictive and pharmaco-dynamic biomarkers, but also individualized targeted thera-peutic interventions.
Recently, we used proteomics to define the characteristics ofcisplatin resistance in melanoma cells (7). Using proteomicmethods, we have now extended this profile to further features.The BRAF-mutated A375 is sensitive to both vemurafenib andcisplatin, whereas the NRAS-mutated M24met is resistant. Thispattern of sensitivity can be correlated to a distinct morphologicphenotype, genetic background, proteome profile, and cell biol-ogy. In addition, we performed proteome analysis of amelanomamodel with acquired vemurafenib resistance.
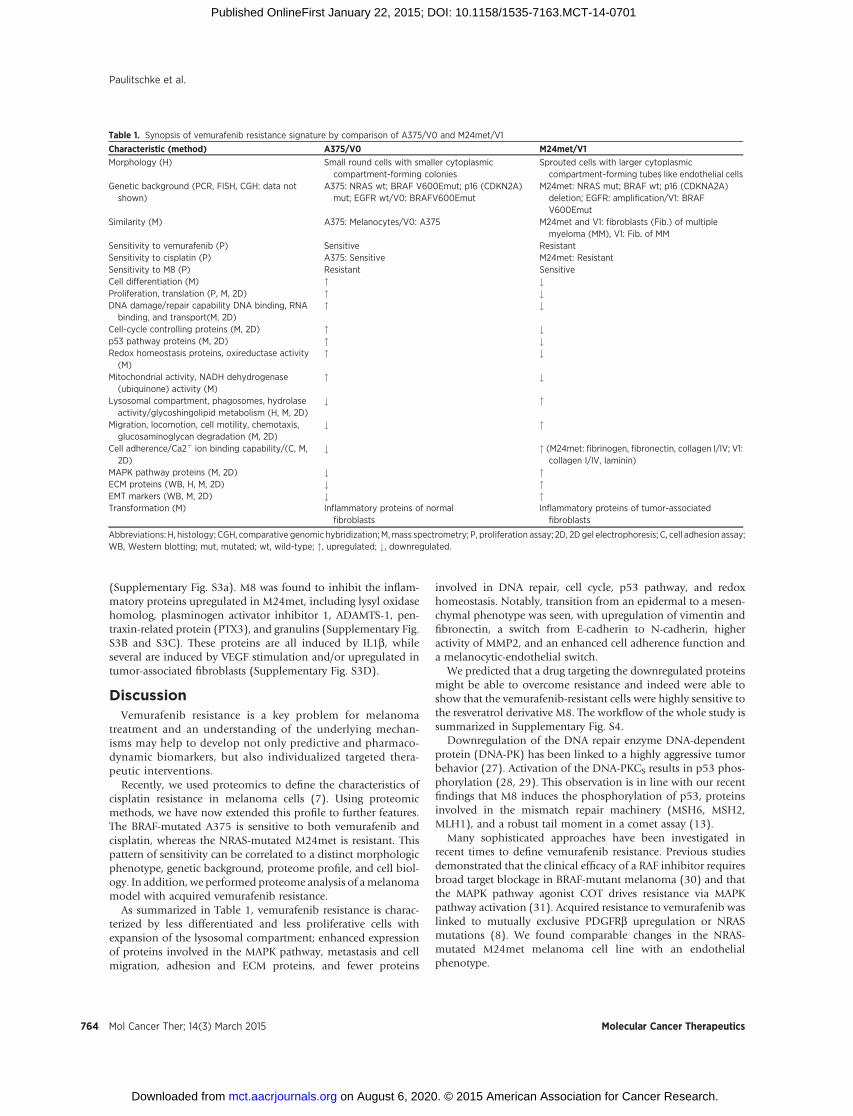
As summarized in Table 1, vemurafenib resistance is charac-terized by less differentiated and less proliferative cells withexpansion of the lysosomal compartment; enhanced expressionof proteins involved in the MAPK pathway, metastasis and cellmigration, adhesion and ECM proteins, and fewer proteins
involved in DNA repair, cell cycle, p53 pathway, and redoxhomeostasis. Notably, transition from an epidermal to a mesen-chymal phenotype was seen, with upregulation of vimentin andfibronectin, a switch from E-cadherin to N-cadherin, higheractivity of MMP2, and an enhanced cell adherence function anda melanocytic-endothelial switch.
We predicted that a drug targeting the downregulated proteinsmight be able to overcome resistance and indeed were able toshow that the vemurafenib-resistant cells were highly sensitive tothe resveratrol derivative M8. The workflow of the whole study issummarized in Supplementary Fig. S4.
Downregulation of the DNA repair enzyme DNA-dependentprotein (DNA-PK) has been linked to a highly aggressive tumorbehavior (27). Activation of the DNA-PKCS results in p53 phos-phorylation (28, 29). This observation is in line with our recentfindings that M8 induces the phosphorylation of p53, proteinsinvolved in the mismatch repair machinery (MSH6, MSH2,MLH1), and a robust tail moment in a comet assay (13).
Many sophisticated approaches have been investigated inrecent times to define vemurafenib resistance. Previous studiesdemonstrated that the clinical efficacy of a RAF inhibitor requiresbroad target blockage in BRAF-mutant melanoma (30) and thatthe MAPK pathway agonist COT drives resistance via MAPKpathway activation (31). Acquired resistance to vemurafenib waslinked to mutually exclusive PDGFRb upregulation or NRASmutations (8). We found comparable changes in the NRAS-mutated M24met melanoma cell line with an endothelialphenotype.
Table 1. Synopsis of vemurafenib resistance signature by comparison of A375/V0 and M24met/V1
Characteristic (method) A375/V0 M24met/V1
Morphology (H) Small round cells with smaller cytoplasmiccompartment-forming colonies
Sprouted cells with larger cytoplasmiccompartment-forming tubes like endothelial cells
Genetic background (PCR, FISH, CGH: data notshown)
A375: NRAS wt; BRAF V600Emut; p16 (CDKN2A)mut; EGFR wt/V0: BRAFV600Emut
M24met: NRAS mut; BRAF wt; p16 (CDKNA2A)deletion; EGFR: amplification/V1: BRAFV600Emut
Similarity (M) A375: Melanocytes/V0: A375 M24met and V1: fibroblasts (Fib.) of multiplemyeloma (MM), V1: Fib. of MM
Sensitivity to vemurafenib (P) Sensitive ResistantSensitivity to cisplatin (P) A375: Sensitive M24met: ResistantSensitivity to M8 (P) Resistant SensitiveCell differentiation (M) " #Proliferation, translation (P, M, 2D) " #DNA damage/repair capability DNA binding, RNAbinding, and transport(M, 2D)
" #
Cell-cycle controlling proteins (M, 2D) " #p53 pathway proteins (M, 2D) " #Redox homeostasis proteins, oxireductase activity(M)
" #
Mitochondrial activity, NADH dehydrogenase(ubiquinone) activity (M)
" #
Lysosomal compartment, phagosomes, hydrolaseactivity/glycoshingolipid metabolism (H, M, 2D)
# "
Migration, locomotion, cell motility, chemotaxis,glucosaminoglycan degradation (M, 2D)
# "
Cell adherence/Ca2þ ion binding capability/(C, M,2D)
# " (M24met: fibrinogen, fibronectin, collagen I/IV; V1:collagen I/IV, laminin)
MAPK pathway proteins (M, 2D) # "ECM proteins (WB, H, M, 2D) # "EMT markers (WB, M, 2D) # "Transformation (M) Inflammatory proteins of normal
fibroblastsInflammatory proteins of tumor-associatedfibroblasts
Abbreviations: H, histology; CGH, comparative genomic hybridization;M,mass spectrometry; P, proliferation assay; 2D, 2Dgel electrophoresis; C, cell adhesion assay;WB, Western blotting; mut, mutated; wt, wild-type; ", upregulated; #, downregulated.
Paulitschke et al.
Mol Cancer Ther; 14(3) March 2015 Molecular Cancer Therapeutics764
on August 6, 2020. © 2015 American Association for Cancer Research. mct.aacrjournals.org Downloaded from
Published OnlineFirst January 22, 2015; DOI: 10.1158/1535-7163.MCT-14-0701
MAPK reactivation was found to predict MEK inhibitor sensi-tivity (32).
An additional study focused on the influence of the tumormicroenvironment on resistance to RAF inhibitors. Proteomicanalysis showed that stromal cell secretion of hepatocyte growthfactor (HGF) resulted in activation of theHGF receptorMET, withreactivation ofMAPK and PI3K–AKT signaling pathways, yieldingdrug resistance (33).
Until now few proteomic studies have been done to explorevemurafenib resistance. A single study using selected reactionmonitoring (SRM) was performed to measure the expression ofapoptosis-regulating proteins in the Bcl-2 inmelanoma cells withdiffering PTEN status and vemurafenib resistance/sensitivity (34).In addition, Roesch and colleagues demonstrated, consistent withour preliminary data, that exposure to cisplatin and vemurafenibuniformly leads to enrichment of slow-cycling, long-term tumor-maintaining melanoma cells. Here, proteome profiling identifiedupregulation of enzymes ofmitochondrial oxidative-ATP-synthe-sis (35). This nicely fits with our observation that the vemurafe-nib-resistant cells are characterized by a decrease in proliferation,differentiation, and cell-cycle processes but enhanced capabilityfor metastasis and processes of EMT.
Enhanced lysosomal expression, whichwe demonstrated in thevemurafenib-resistant cells, might improve elimination of thedrug from the tumor cell.
The enhancement of the lysosomal compartment and phago-somal processes might be also due to autophagy, which is amultistep process that involves the sequestration of organelles andproteins in autophagic vesicles and subsequent lysosome-depen-dent degradation (36). Drug-induced autophagy has emerged as a
common pathway of resistance to a number of kinase inhibitors,instead less is known about the link between MAPK signaling andautophagy. Very recently, it was demonstrated that BRAFi inducescytoprotective autophagy through activation of an ER stressresponse and that targeting the ER stress–autophagy pathwaymight overcome BRAFi resistance in melanoma (36).
Early EMT was shown to be associated with degradation of E-cadherin in the lysosomal compartment and EMT was preventedby lysosomal inhibitors (37). Therefore, vemurafenib resistancemight be characterized by lysosomal degradation of E-cadherinand subsequent EMT.
EMT is known to include enhanced cell migration and metas-tasis, generation of cells with stem cell-like characteristics, andincreased resistance to chemotherapy and apoptosis (24–26).E-cadherin loss is a fundamental event, leading to a loss of closecell–cell contact, increased invasiveness and a typical change inmorphology (24, 25) and was demonstrated in the vemurafenib-resistant cells. Downregulation or loss of E-cadherin was dem-onstrated to be sufficient to determine resistance (38, 39) and hasbeen linked to decreased patient survival (40). In parallel to theE-cadherin loss, EMT is involved with induction of the mesen-chymal markers N-cadherin, reorganization of the cytoskeleton(switch from cytokeratins to vimentin), and synthesis of ECMproteins and matrix metalloproteases (24, 25, 41). Here, wecorrelated some of these features with vemurafenib resistance.
Switching to amesenchymal phenotype increases the ability ofa tumor to detach from the epithelial layer andmigrate. Enhancedproduction of ECM proteins and ECM-degrading proteins pro-motes a more compatible microenvironment and facilitatesmigration of tumor cells through the host tissue (7).
Figure 5.EMT in A375, M24met melanoma celllines, and vemurafenib-sensitive and-resistant VM-1 cells. A, distribution ofexponentially modified proteinabundance index (emPAI) level for[vimentin (1),fibronectin (2),MMP1 (3),integrin a V (4), ILK-1 (5) anddesmoplakin (6)] and Western blotanalysis of vimentin in A375 andM24met. An increased color intensityof the cell symbol indicates increasedemPAI value, as described previously(49). B, distribution of number ofpeptides in A375 and M24met. C,Western blotting of E-cadherin and N-cadherin in V0, V0.5, V1, and V10;tubulin serves as a positive control andnumber of peptide level of EMTcandidates in V0 and V1. D,zymography assay of melanocytes(mela), V0, V0.5, V1, V10, M (marker)and MMP2 C (MMP2 control) andexpression of TIMPs in V0 and V1.
Vemurafenib Resistance Signature in Melanoma
www.aacrjournals.org Mol Cancer Ther; 14(3) March 2015 765
on August 6, 2020. © 2015 American Association for Cancer Research. mct.aacrjournals.org Downloaded from
Published OnlineFirst January 22, 2015; DOI: 10.1158/1535-7163.MCT-14-0701
Formation of macro-metastases in distant organs is associatedwith a reversion to an epithelial phenotype (i.e., MET; ref. 25).This reversion was observed at the highest level of inducedvemurafenib resistance, as indicated by the cell adhesion assayand reactivation of E-cadherin. It is possible that different molec-ular mechanisms are involved, depending on the drug concen-tration used to induce resistance. At lower concentrations, cellsmight still be able to adapt, while selection of survivorsmay occurat higher concentrations.
Inflammation has been associated with EMT, especially byCOX-2, which induces the expression of Snail1, promotingresistance to anoikis via Ras-MAPK/ERK and PI3K activation(42–45). There was a switch in the profile of inflammatoryproteins in M24met, from a normal fibroblast phenotype to apattern associated with tumor-associated fibroblasts. Thesesecreted peptides (PTX-3, Granulins, and ADAMTS-1) areinvolved in angiogenesis and/or cell proliferation or adhesion,can be induced in fibroblasts on IL1matrix metalloproteasestimulation, and were found to be regulated by M8. As they canbe monitored in blood, they may potentially provide markersfor the switch to a resistant phenotype and an indicator forsensitivity to M8.
Thus, applying proteome profiling provides additional insightinto mechanisms of tumorigenesis, paving the way for the iden-tification of early biomarkers, development of new drug combi-nations and individualized patient stratification for optimal ther-apy using predictive and pharmacodynamic biomarkers. Wepresent seven characteristics which are associated with vemura-fenib resistance and might reflect the mode of action of the drug:(i) lysosomal expression, phagosomes, and glycospingolipidprocess; (ii) metastasis, cell migration, and glycosaminoglycandegradation; (iii) cell adhesion and Ca2þ ion-binding capability;(iv) MAPK pathway; (v) enhanced expression of ECM proteins;(vi) EMT; and (vii) enhanced transformation. We also identifyseven mechanistic strategies that might help to overcome vemur-afenib resistance, namely interfering in (i) cell differentiation; (ii)cell proliferation; (iii) DNA damage/repair; (iv) cell cycle; (v) p53pathway; (vi) redox homeostasis, and (vii) mitochondrialprocesses.
We plan to extend these results by evaluating additional sen-sitive and resistant melanoma cells and melanoma tissue. Theproteome analysis will be performed in three steps: (i) ThermoQEXACTIVE will be used for the analysis of cell fractions ofvemurafenib-sensitive and -resistant cells. Data will be analyzed
Figure 6.Differential capability of cell adherence in sensitive and resistant cells. A, cell adhesion assaywith V0, V0.5, V1, and V10 (adherent cells stained in an ECM-coatedwellplate). B, ECM-mediated cell adhesionwas quantified atOD560nmafter extraction. C, comparisonofA375,M24met, V0, andV1with other cells (Cell Similarity Tool).D, expression of proteins specific for endothelial cells and melanocytes in A375 and M24met cells.
Paulitschke et al.
Mol Cancer Ther; 14(3) March 2015 Molecular Cancer Therapeutics766
on August 6, 2020. © 2015 American Association for Cancer Research. mct.aacrjournals.org Downloaded from
Published OnlineFirst January 22, 2015; DOI: 10.1158/1535-7163.MCT-14-0701
by MaxQuant. (ii) Pressure cycling technology (PCT) SWATH isused for melanoma tissue and offers an optimized protein lysisand extraction by the PCT. Data analysis will be performed byOpenSWATH. (iii) To evaluate the predictive power ofmarkers inblood, SRM is the method of choice. Bioinformatic analysis willbe performed by mProphet.
This may offer additional understanding of the underlyingmechanisms and new insights for rational therapeutic conceptspreventing lethal drug resistance.
Disclosure of Potential Conflicts of InterestNo potential conflicts of interest were disclosed.
DisclaimerThe funders had no role in study design, data collection and analysis,
decision to publish, or preparation of the article.
Authors' ContributionsConception and design:V. Paulitschke, T. Szekeres, H. Pehamberger, C. Gerner,R. KunstfeldDevelopment of methodology: V. Paulitschke, W. Berger, P. Paulitschke,T. Szekeres, A. Meshcheryakova, C. Pirker, C. GernerAcquisition of data (provided animals, acquired and managed patients,provided facilities, etc.): V. Paulitschke, E. Hofstaetter, R. Dingelmaier-Hovorka, D. F€odinger, W. J€ager, A. Meshcheryakova, A. Bileck, C. GernerAnalysis and interpretation of data (e.g., statistical analysis, biostatistics,computational analysis): V. Paulitschke, W. Berger, E. Hofstaetter, B. Knapp,A. Meshcheryakova, A. Bileck, C. Gerner
Writing, review, and/or revision of the manuscript: V. Paulitschke, W. Berger,P. Paulitschke, B. Knapp, W. J€ager, A. Meshcheryakova, C. Pirker, H. Peham-berger, R. KunstfeldAdministrative, technical, or material support (i.e., reporting or organizingdata, constructing databases): V. Paulitschke, B. Knapp, R. Dingelmaier-Hovorka, D. F€odinger, C. Gerner, R. KunstfeldStudy supervision: V. Paulitschke, R. Kunstfeld
AcknowledgmentsThe authors thank Julia Balfour (Dundee, Scotland) for editorial assistance,
Rosa-Maria Weiss for establishing the vemurafenib-resistant VM-1 cells, andJohannes Griss M.D., Ph.D. for bioinformatic assistance.
Grant SupportThis work was supported by the following grants of the "Austrian Federal
Reserve Bank": Project No. 12215 (to V. Paulitschke) and No. 11425 (toR. Kunstfeld), No. 12747 (to A.B. Riemer and R. Kunstfeld), the "Interdiszi-plin€arer Krebsforschungsfond" (to V. Paulitschke), "Hans und Blanca MoserStipendium" (to V. Paulitschke), and "Medical Scientific Fund of the Mayor ofthe City of Vienna" (to V. Paulitschke).
The costs of publication of this article were defrayed in part by thepayment of page charges. This article must therefore be hereby markedadvertisement in accordance with 18 U.S.C. Section 1734 solely to indicatethis fact.
Received August 19, 2014; revised December 22, 2014; accepted January 8,2015; published OnlineFirst January 22, 2015.
References1. Markovic SN, Erickson LA, Rao RD, Weenig RH, Pockaj BA, Bardia A, et al.
Malignant melanoma in the 21st century, part 2: staging, prognosis, andtreatment. Mayo Clin Proc 2007;82:490–513.
2. Bhatia S, Thompson JA. Systemic therapy formetastaticmelanoma in2012:dawn of a new era. J Natl Compr Canc Netw 2012;10:403–12.
3. Hodi FS,O'Day SJ,McDermott DF,Weber RW, Sosman JA,Haanen JB, et al.Improved survivalwith ipilimumab in patients withmetastaticmelanoma.N Engl J Med 2010;363:711–23.
4. Chapman PB, Hauschild A, Robert C, Haanen JB, Ascierto P, Larkin J, et al.Improved Survival with Vemurafenib in Melanoma with BRAF V600EMutation. N Engl J Med 2011;364:2507–16.
5. Wagle N, Emery C, Berger MF, Davis MJ, Sawyer A, Pochanard P, et al.Dissecting therapeutic resistance to RAF inhibition in melanoma by tumorgenomic profiling. J Clin Oncol 2011;29:3085–96.
6. Dummer R, Flaherty KT. Resistance patterns with tyrosine kinase inhibitorsin melanoma: new insights. Curr Opin Oncol 2012;24:150–4.
7. Paulitschke V, Haudek-Prinz V, Griss J, Berger W, Mohr T, Pehamberger H,et al. Functional classification of cellular proteome profiles support theidentification of drug resistance signatures in melanoma cells. J ProteomeRes 2013;12:3264–76.
8. Nazarian R, Shi H, Wang Q, Kong X, Koya RC, Lee H, et al. Melanomasacquire resistance to B-RAF(V600E) inhibition by RTK or N-RAS upregula-tion. Nature 2010;468:973–7.
9. Trunzer K, Pavlick AC, Schuchter L, Gonzalez R, McArthur GA, HutsonTE, et al. Pharmacodynamic effects and mechanisms of resistance tovemurafenib in patients with metastatic melanoma. J Clin Oncol2013;31:1767–74.
10. Paulitschke V, Gruber S, Hofstatter E, Haudek-Prinz V, Klepeisz P, SchicherN, et al. Proteome analysis identified thePPARgamma ligand15d-PGJ2 as anovel drug inhibiting melanoma progression and interfering with tumor-stroma interaction. PLoS ONE 2012;7:e46103.
11. Heffeter P, Atil B, KryeziuK,GrozaD,KoellenspergerG, KornerW, et al. Theruthenium compound KP1339 potentiates the anticancer activity of sor-afenib in vitro and in vivo. Eur J Cancer 2013;49:3366–75.
12. Mathieu V, Pirker C, Schmidt WM, Spiegl-Kreinecker S, Lotsch D, HeffeterP, et al. Aggressiveness of humanmelanoma xenograftmodels is promoted
by aneuploidy-driven gene expression deregulation. Oncotarget 2012;3:399–413.
13. Paulitschke V, Schicher N, Szekeres T, Jager W, Elbling L, Riemer AB, et al.3,30,4,40,5,50-hexahydroxystilbene impairs melanoma progression in ametastatic mouse model. J Invest Dermatol 2010;130:1668–79.
14. Slany A, Haudek-Prinz V, Meshcheryakova A, Bileck A, LammW, ZielinskiC, et al. Extracellular matrix remodeling by bone marrow fibroblast-likecells correlates with disease progression in multiple myeloma. J ProteomeRes 2014;13:844–54.
15. BrayDF, Bagu J, Koegler P. Comparison of hexamethyldisilazane (HMDS),Peldri II, and critical-point drying methods for scanning electron micros-copy of biological specimens. Microsc Res Tech 1993;26:489–95.
16. Hoeller C, Thallinger C, Pratscher B, Bister MD, Schicher N, Loewe R,et al. The non-receptor-associated tyrosine kinase Syk is a regulator ofmetastatic behavior in human melanoma cells. J Invest Dermatol2005;124:1293–9.
17. Slany A, Haudek-Prinz V, Zwickl H, Stattner S, Grasl-Kraupp B, Gerner C.Myofibroblasts are important contributors to human hepatocellular car-cinoma: evidence for tumor promotion by proteome profiling. Electro-phoresis 2013;34:3315–25.
18. Rabilloud T, Strub JM, Luche S, van Dorsselaer A, Lunardi J. A comparisonbetween Sypro Ruby and ruthenium II tris (bathophenanthroline disulfo-nate) as fluorescent stains for protein detection in gels. Proteomics2001;1:699–704.
19. Bileck A, Kreutz D, Muqaku B, Slany A, Gerner C. Comprehensive assess-ment of proteins regulated by dexamethasone reveals novel effects inprimary human peripheral blood mononuclear cells. J Proteome Res2014;13:5989–6000.
20. Cox J, Mann M. MaxQuant enables high peptide identification rates,individualized p.p.b.-range mass accuracies and proteome-wide proteinquantification. Nat Biotechnol 2008;26:1367–72.
21. Cox J, Mann M. 1D and 2D annotation enrichment: a statistical methodintegrating quantitative proteomics with complementary high-throughputdata. BMC Bioinformatics 2012;13 Suppl 16:S12.
22. Geiger T, Cox J, Mann M. Proteomic changes resulting from gene copynumber variations in cancer cells. PLoS Genet 2010;6:e1001090.
www.aacrjournals.org Mol Cancer Ther; 14(3) March 2015 767
Vemurafenib Resistance Signature in Melanoma
on August 6, 2020. © 2015 American Association for Cancer Research. mct.aacrjournals.org Downloaded from
Published OnlineFirst January 22, 2015; DOI: 10.1158/1535-7163.MCT-14-0701
23. Slany A, Haudek VJ, Gundacker NC, Griss J, Mohr T, Wimmer H, et al.Introducing a new parameter for quality control of proteome profiles:consideration of commonly expressed proteins. Electrophoresis 2009;30:1306–28.
24. Thiery JP, Acloque H, Huang RY, Nieto MA. Epithelial-mesenchymaltransitions in development and disease. Cell 2009;139:871–90.
25. Kalluri R, Weinberg RA. The basics of epithelial-mesenchymal transition.J Clin Invest 2009;119:1420–8.
26. Gao D, Vahdat LT, Wong S, Chang JC, Mittal V. Microenvironmentalregulation of epithelial-mesenchymal transitions in cancer. Cancer Res2012;72:4883–9.
27. Korabiowska M, Quentin T, Schlott T, Bauer H, Kunze E. Down-regulationof Ku 70 and Ku 80 mRNA expression in transitional cell carcinomas ofthe urinary bladder related to tumor progression. World J Urol 2004;22:431–40.
28. Shieh SY, Ikeda M, Taya Y, Prives C. DNA damage-induced phos-phorylation of p53 alleviates inhibition by MDM2. Cell 1997;91:325–34.
29. Tibbetts RS, BrumbaughKM,Williams JM, Sarkaria JN, ClibyWA, Shieh SY,et al. A role for ATR in the DNA damage-induced phosphorylation of p53.Genes Dev 1999;13:152–7.
30. Bollag G, Hirth P, Tsai J, Zhang J, Ibrahim PN, ChoH, et al. Clinical efficacyof aRAF inhibitor needsbroad target blockade inBRAF-mutantmelanoma.Nature 2010;467:596–9.
31. Johannessen CM, Boehm JS, Kim SY, Thomas SR, Wardwell L, Johnson LA,et al. COT drives resistance to RAF inhibition throughMAP kinase pathwayreactivation. Nature 2010;468:968–72.
32. Poulikakos PI, Persaud Y, JanakiramanM, Kong X, Ng C,Moriceau G, et al.RAF inhibitor resistance is mediated by dimerization of aberrantly splicedBRAF(V600E). Nature 2011;480:387–90.
33. Straussman R, Morikawa T, Shee K, Barzily-Rokni M, Qian ZR, Du J, et al.Tumour micro-environment elicits innate resistance to RAF inhibitorsthrough HGF secretion. Nature 2012;487:500–4.
34. Koomen JM, Smalley KS. Using quantitative proteomic analysis to under-stand genotype specific intrinsic drug resistance in melanoma. Oncotarget2011;2:329–35.
35. Roesch A, Vultur A, Bogeski I,WangH, ZimmermannKM, Speicher D, et al.Overcoming intrinsic multidrug resistance in melanoma by blocking themitochondrial respiratory chain of slow-cycling JARID1B(high) cells.Cancer Cell 2013;23:811–25.
36. Ma XH, Piao SF, Dey S, McAfee Q, Karakousis G, Villanueva J, et al.Targeting ER stress-induced autophagy overcomes BRAF inhibitor resis-tance in melanoma. J Clin Invest 2014;124:1406–17.
37. Janda E, Nevolo M, Lehmann K, Downward J, Beug H, Grieco M. Raf plusTGFbeta-dependent EMT is initiated by endocytosis and lysosomal deg-radation of E-cadherin. Oncogene 2006;25:7117–30.
38. Onder TT, Gupta PB, Mani SA, Yang J, Lander ES, Weinberg RA. Loss of E-cadherin promotes metastasis via multiple downstream transcriptionalpathways. Cancer Res 2008;68:3645–54.
39. Derksen PW, Liu X, Saridin F, van der Gulden H, Zevenhoven J, Evers B,et al. Somatic inactivationof E-cadherin andp53 inmice leads tometastaticlobular mammary carcinoma through induction of anoikis resistance andangiogenesis. Cancer Cell 2006;10:437–49.
40. Hirohashi S. Inactivation of the E-cadherin-mediated cell adhesion systemin human cancers. Am J Pathol 1998;153:333–9.
41. Sanchez-Tillo E, Liu Y, de Barrios O, Siles L, Fanlo L, Cuatrecasas M, et al.EMT-activating transcription factors in cancer: beyond EMT and tumorinvasiveness. Cell Mol Life Sci 2012;69:3429–56.
42. Dohadwala M, Yang SC, Luo J, Sharma S, Batra RK, Huang M, et al.Cyclooxygenase-2-dependent regulation of E-cadherin: prostaglandin E(2) induces transcriptional repressors ZEB1 and snail in non-small cell lungcancer. Cancer Res 2006;66:5338–45.
43. Vega S, Morales AV, Ocana OH, Valdes F, Fabregat I, Nieto MA. Snailblocks the cell cycle and confers resistance to cell death. Genes Dev2004;18:1131–43.
44. Neil JR, Johnson KM, Nemenoff RA, Schiemann WP. Cox-2 inactiva-tes Smad signaling and enhances EMT stimulated by TGF-betathrough a PGE2-dependent mechanisms. Carcinogenesis 2008;29:2227–35.
45. Greenhough A, Smartt HJ, Moore AE, Roberts HR, Williams AC, ParaskevaC, et al. TheCOX-2/PGE2 pathway: key roles in the hallmarks of cancer andadaptation to the tumour microenvironment. Carcinogenesis 2009;30:377–86.
46. Berman HM, Westbrook J, Feng Z, Gilliland G, Bhat TN, Weissig H, et al.The protein data bank. Nucleic Acids Res 2000;28:235–42.
47. Choi Y, Deane CM. FREAD revisited: Accurate loop structure predictionusing a database search algorithm. Proteins 2010;78:1431–40.
48. Kelm S, Shi J, Deane CM. MEDELLER: homology-based coordinategeneration for membrane proteins. Bioinformatics 2010;26:2833–40.
49. Ishihama Y, Oda Y, Tabata T, Sato T, Nagasu T, Rappsilber J, et al.Exponentially modified protein abundance index (emPAI) for estima-tion of absolute protein amount in proteomics by the numberof sequenced peptides per protein. Mol Cell Proteomics 2005;4:1265–72.
Mol Cancer Ther; 14(3) March 2015 Molecular Cancer Therapeutics768
Paulitschke et al.
on August 6, 2020. © 2015 American Association for Cancer Research. mct.aacrjournals.org Downloaded from
Published OnlineFirst January 22, 2015; DOI: 10.1158/1535-7163.MCT-14-0701
2015;14:757-768. Published OnlineFirst January 22, 2015.Mol Cancer Ther Verena Paulitschke, Walter Berger, Philipp Paulitschke, et al. New Strategies and Rational Therapeutic ConceptsVemurafenib Resistance Signature by Proteome Analysis Offers
Updated version
10.1158/1535-7163.MCT-14-0701doi:
Access the most recent version of this article at:
Material
Supplementary
http://mct.aacrjournals.org/content/suppl/2015/01/22/1535-7163.MCT-14-0701.DC1
Access the most recent supplemental material at:
Cited articles
http://mct.aacrjournals.org/content/14/3/757.full#ref-list-1
This article cites 49 articles, 9 of which you can access for free at:
Citing articles
http://mct.aacrjournals.org/content/14/3/757.full#related-urls
This article has been cited by 2 HighWire-hosted articles. Access the articles at:
E-mail alerts related to this article or journal.Sign up to receive free email-alerts
Subscriptions
Reprints and
To order reprints of this article or to subscribe to the journal, contact the AACR Publications Department at
Permissions
Rightslink site. Click on "Request Permissions" which will take you to the Copyright Clearance Center's (CCC)
.http://mct.aacrjournals.org/content/14/3/757To request permission to re-use all or part of this article, use this link
on August 6, 2020. © 2015 American Association for Cancer Research. mct.aacrjournals.org Downloaded from
Published OnlineFirst January 22, 2015; DOI: 10.1158/1535-7163.MCT-14-0701