Embed Size (px)
DESCRIPTION
power point
Citation preview

VENTILATOR GRAPHICS

Purpose
• Graphics are waveforms that reflect the patient-ventilator system and their interaction
• Purpose of monitoring graphics includes– Monitors the patients disease status (C and Raw)– Calculates respiratory mechanics– Assesses patient response to therapy– Monitors ventilator function– Allows fine tuning of ventilator to decrease WOB and
optimize ventilation– Allows user to interpret, evaluate, and troubleshoot
ventilator and patients’ response to ventilator

Types of waveforms
• Scalars: plot pressure/volume/flow against time…time is the x axis
• Loops: plot pressure/volume/flow against each other…there is no time component
• Six basic waveforms:– Rectangular: AKA swuare wave– Descending ramp: AKA decelerating ramp– Ascending ramp: AKA accelerating ramp– Sinusoidal: AKA sine wave– Exponential rising– Exponential decaying


Types of waveforms seen
• Pressure waveforms– Rectangular – Exponential rise– Sine
• Volume waveforms– Ascending ramp– Sinusoidal
• Flow waveforms– Rectangular– Sinusoidal– Ascending ramp– Descending ramp– Exponential decay
Flow PatternsFlow Patterns
ACCELERATINGACCELERATING
DECELERATINGDECELERATING
SINESINE
SQUARESQUARE
Flow PatternsFlow Patterns
ACCELERATINGACCELERATING
DECELERATINGDECELERATING
SINESINE
SQUARESQUARE
Pressure-Time Scalar
• Machine-triggered breaths have no negative deflection at the start• Patient triggered breaths may have a negative deflection at the start
if the breath is being pressure triggered…the greater the patient effort to trigger the breath, the greater the negative deflection seen…no deflection see with flow triggering
• In volume modes, the shape will be exponential rise for mandatory breaths and sinusoidal for spontaneous breaths…if PS is added to spontaneous breaths, then the waveform will be square on the spontaneous breaths
• In pressure modes, the shape will be rectangular for mandatory breaths and sinusoidal for spontaneous breaths…if PS added to the spontaneous breaths, they will be rectangular also
• If PEEP is added, the baseline during expiration will be above zero• The area under the entire curve equals the Paw (mean airway
pressure)

Components of Inflation Pressure
Components of Inflation Pressure
Begin InspirationBegin Inspiration Begin ExpirationBegin Expiration
11
22
BBAA
1. PIP 1. PIP 2. 2. PPplatplat/Alveolar Pressure/Alveolar PressureA. Airway ResistanceA. Airway ResistanceB. Distending PressureB. Distending Pressure
Time (sec)Time (sec)
PPawaw
(cm H(cm H22O)O)
Components of Inflation Pressure
Components of Inflation Pressure
Begin InspirationBegin Inspiration Begin ExpirationBegin Expiration
11
22
BBAA
1. PIP 1. PIP 2. 2. PPplatplat/Alveolar Pressure/Alveolar PressureA. Airway ResistanceA. Airway ResistanceB. Distending PressureB. Distending Pressure
Time (sec)Time (sec)
PPawaw
(cm H(cm H22O)O)
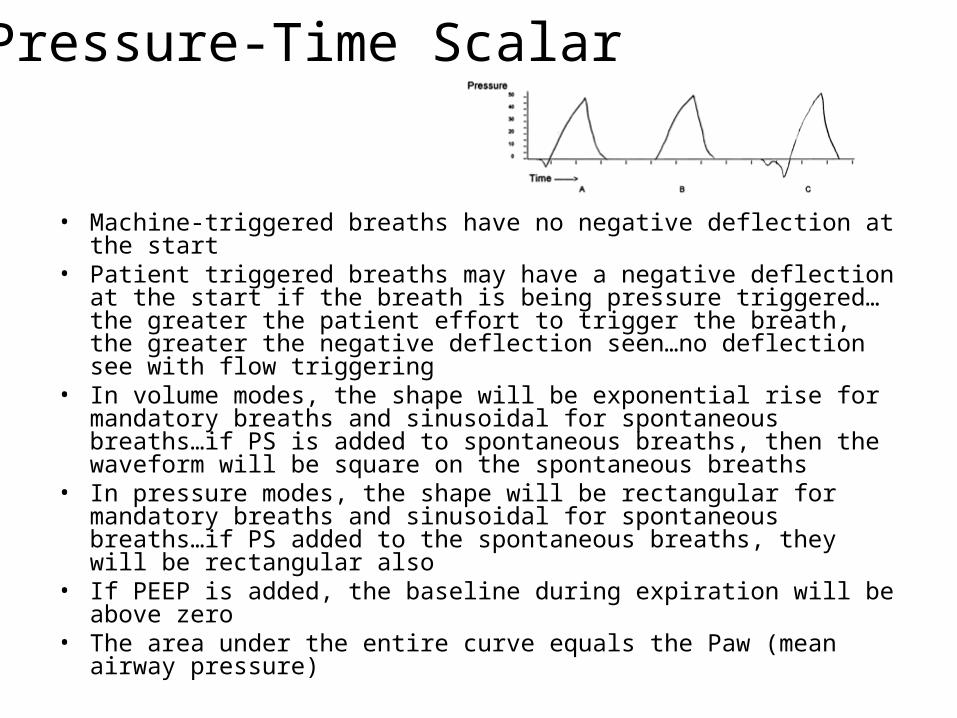
Use of Pressure-Time Scalars
Patient Ventilator Pt-Vent Interaction
Air trapping (auto-PEEP)
Breath type Asynchrony
Airway obstruction
PIP and plateau Triggering effort
Active exhalation PEEP/CPAP
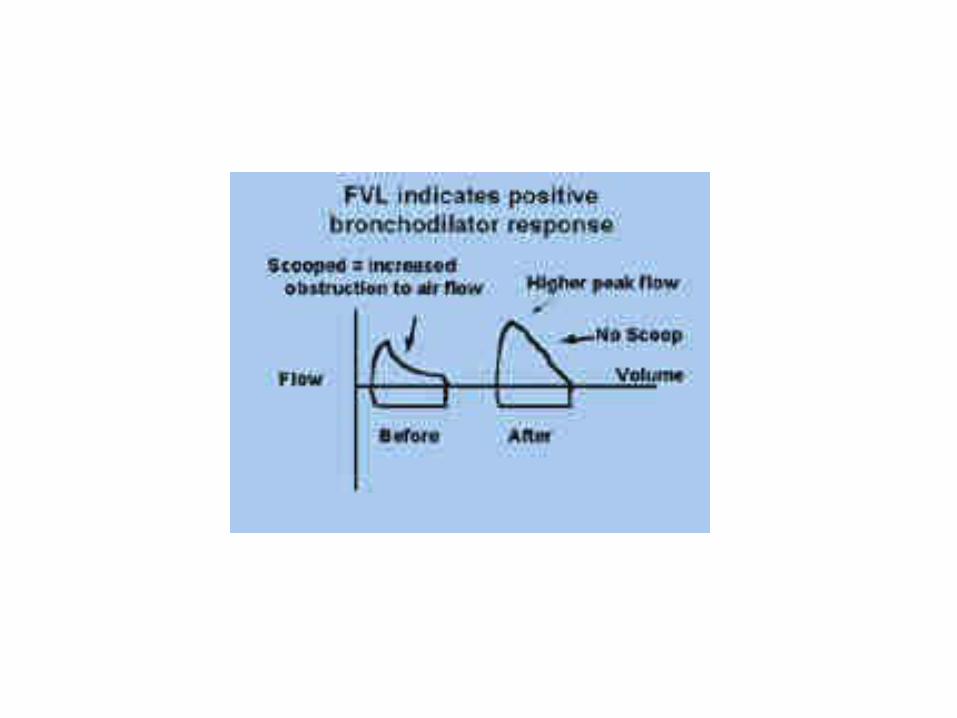
Bronchodilator response
Pressure waveform change
Resp mechanics (C/Raw)
It/Et/I:E
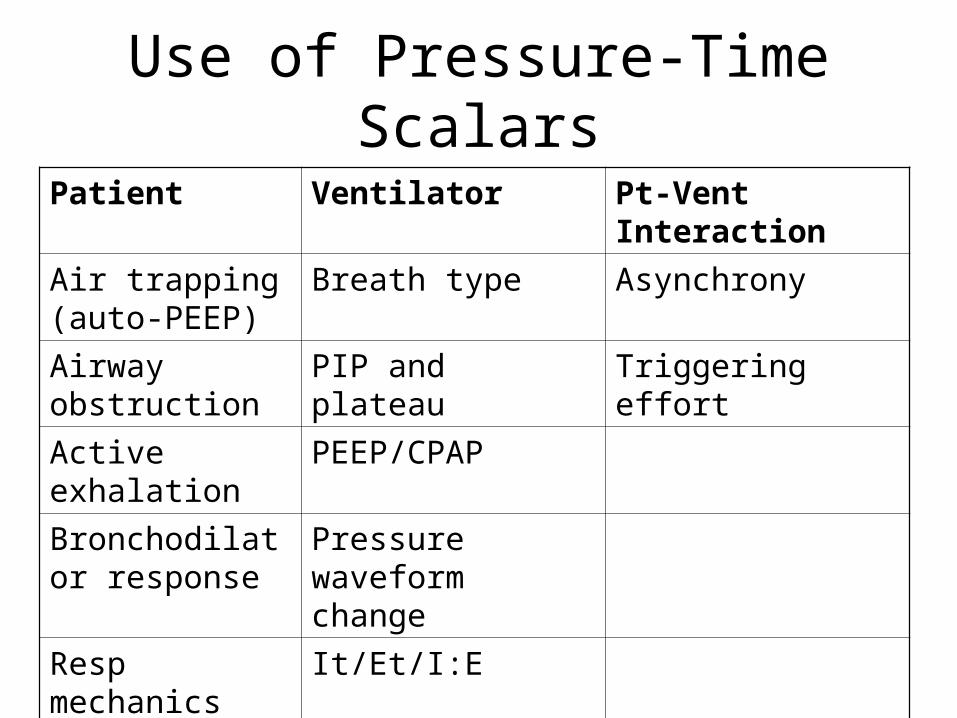
Volume-Time Scalar
• Ascending ramp shape if a square wave flow pattern is used…sinusoidal if the sine wave flow pattern is used…exponential rise if the decelerating flow pattern is used
• Plateaus at the peak of the curve in PC/PS• If the exhalation side of the curve doesn’t
return to baseline, it could be auto-PEEP or there could be a leak (eg-around ETT or through a chest tube)
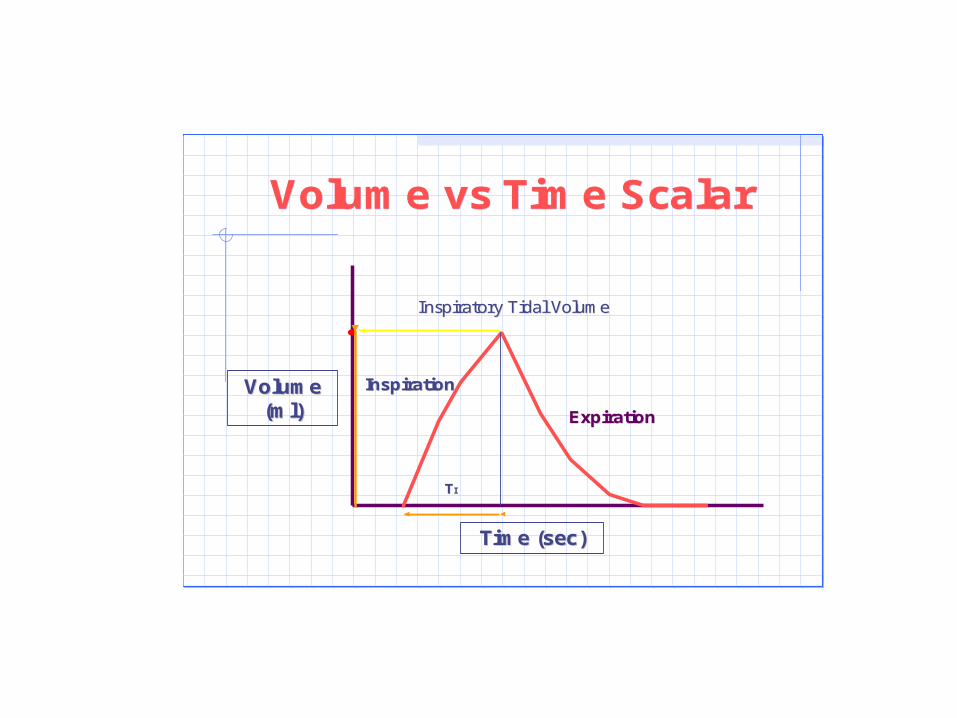
Volume vs Time ScalarVolume vs Time Scalar
InspirationInspiration
ExpirationExpiration
Time (sec)Time (sec)
Volume Volume (ml)(ml)
Inspiratory Tidal VolumeInspiratory Tidal Volume
TTII
Volume vs Time ScalarVolume vs Time Scalar
InspirationInspiration
ExpirationExpiration
Time (sec)Time (sec)
Volume Volume (ml)(ml)
Inspiratory Tidal VolumeInspiratory Tidal Volume
TTII

Use of Volume-Time Scalars
Patient Ventilator Pt-Vent Interaction
Air trapping (auto-PEEP)
Breath types Asynchrony
Active exhalation
Volume waveform shape
Vt
Leaks

Flow-Time Scalars
• No evidence supports one flow pattern over another…the square wave might distribute gas more evenly in patients with a unilateral lung dx…decelerating ramp may distribute gas more evenly because the high burst of flow at the beginning would pop alveoli open and allow for gas exchange during the entire breath
• If expiratory flow doesn’t return to baseline before the next breath starts, there’s auto-PEEP present (air trapping is occurring)
• Volume control on some vents allows you to select the flow pattern you want
• All pressure breaths (PC, PS, PRVC, VS) will have a decelerating ramp flow pattern
• CPAP has a sinusoidal flow pattern unless PS has been added
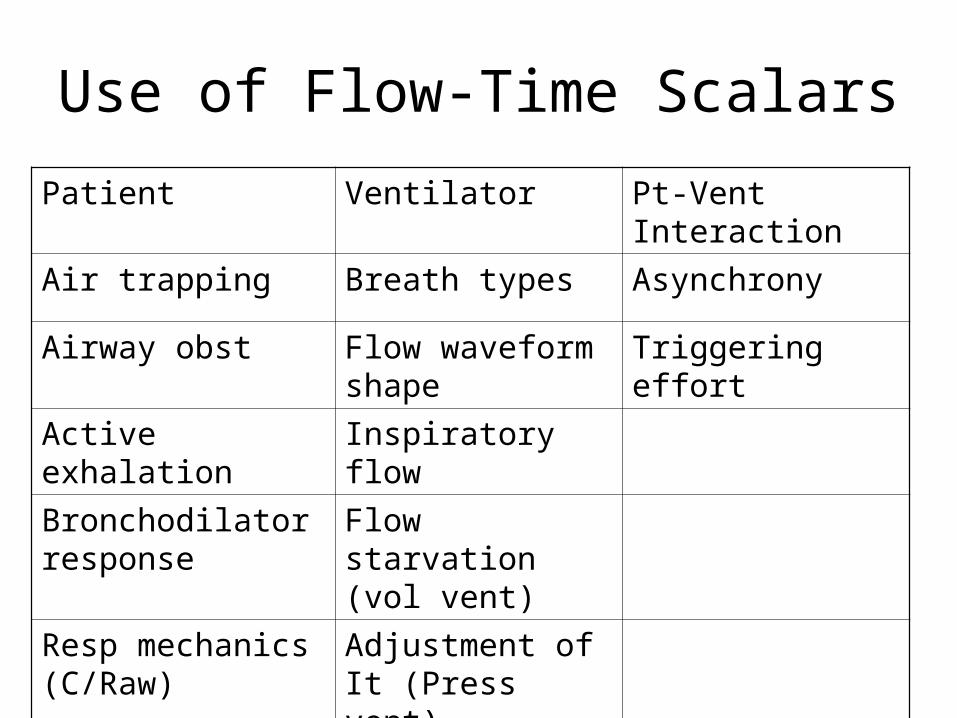
Use of Flow-Time Scalars
Patient Ventilator Pt-Vent Interaction
Air trapping Breath types Asynchrony
Airway obst Flow waveform shape
Triggering effort
Active exhalation Inspiratory flow
Bronchodilator response
Flow starvation (vol vent)
Resp mechanics (C/Raw)
Adjustment of It (Press vent)
Adjustment of rise time


Pressure-Volume Loops
• Volume is plotted on the y axis and pressure on the x axis (can also be plotted the other way around)
• Inspiratory curve is upward and expiratory curve is downward
• Spontaneous breaths go clockwise and positive pressure breaths go counterclockwise
• The bottom of the loop will be at the set PEEP level or be at 0 if there’s no PEEP set
• I starts and E ends at the bottom of the loop…I ends and E starts at the top of the loop
• The loop is almost square in PC/PS because of pressure limiting during I
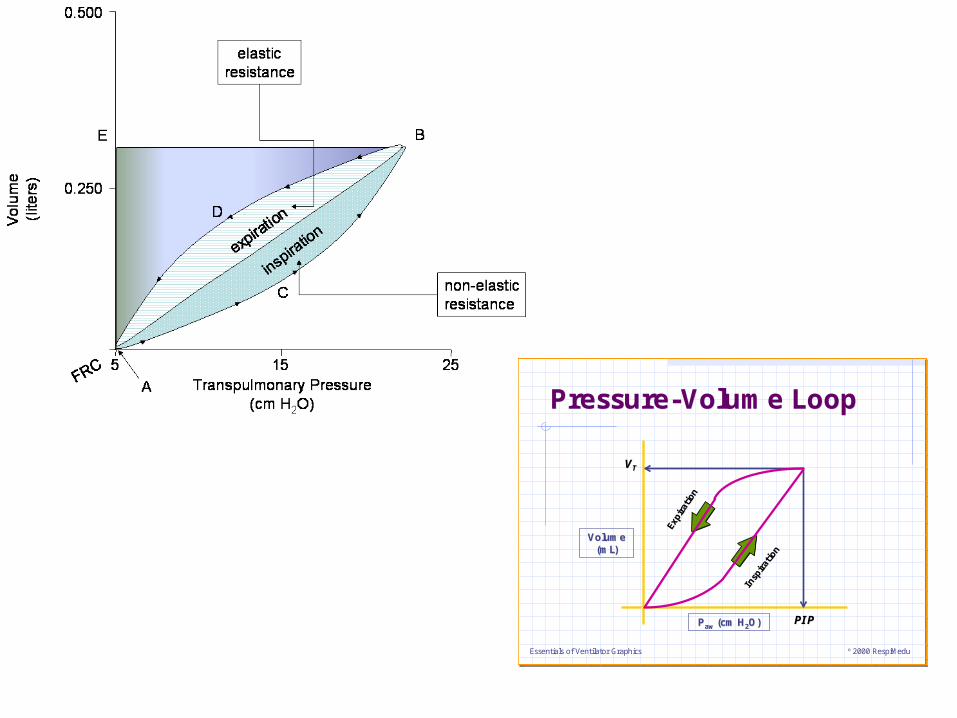
Essentials of Ventilator Graphics ©2000 RespiMedu
Pressure-Volume LoopPressure-Volume Loop
Volume Volume ((mLmL))
Insp
iratio
n
Insp
iratio
n
Expi
ration
Expi
ration
PIPPIP
VVTT
PPawaw (cm H(cm H22O)O)
Essentials of Ventilator Graphics ©2000 RespiMedu
Pressure-Volume LoopPressure-Volume Loop
Volume Volume ((mLmL))
Insp
iratio
n
Insp
iratio
n
Expi
ration
Expi
ration
PIPPIP
VVTT
PPawaw (cm H(cm H22O)O)


Abnormal PV Loops• If an imaginary line is drawn down the middle of the loop,
the area to the right represents inspiratory resistance/WOB and the area to the left represents expiratory resistance/WOB (just the opposite for spont breaths- I is to the left and E is to the right)
• The more vertical the loop lays, the lower the lung C, the more horizontal it lays, the higher the lung C
• The fatter the loop, the higher the airway resistance…you can tell if it’s I or E resistance by looking at whether the right or left side bulges out more
• A bird beak at the top of the loop represents over-distension
• A pig tail at the bottom indicates patient triggering…the bigger the pig tail, the higher the patient WOB to trigger the breath
• The loop won’t meet at the bottom with airtrapping or leaks


Use of PV Loops
Patient•Airway obst•Active exhalation•Bronchodilator response•Lung overdistension•Resp mechanics•WOB
Ventilator •Adjusting PS levels•Flow starvation•Leaks
Pt-Vent Interaction•Triggering effort

Flow-Volume Loops
• Flow is plotted on the y axis and volume on the x axis• Inspiration is above the horizontal line and expiration is
below (some vents reverse this and I is below while E is above)
• The shape of the insp flow curve will match what’s set on the ventilator
• The shape of the exp flow curve represents passive exhalation…it’s long and more drawn out in patients with less recoil
• Can be used to determine the PIF, PEF, and Vt• Looks circular with spontaneous breaths• Looks squared but set at an angle with PC/PS breaths
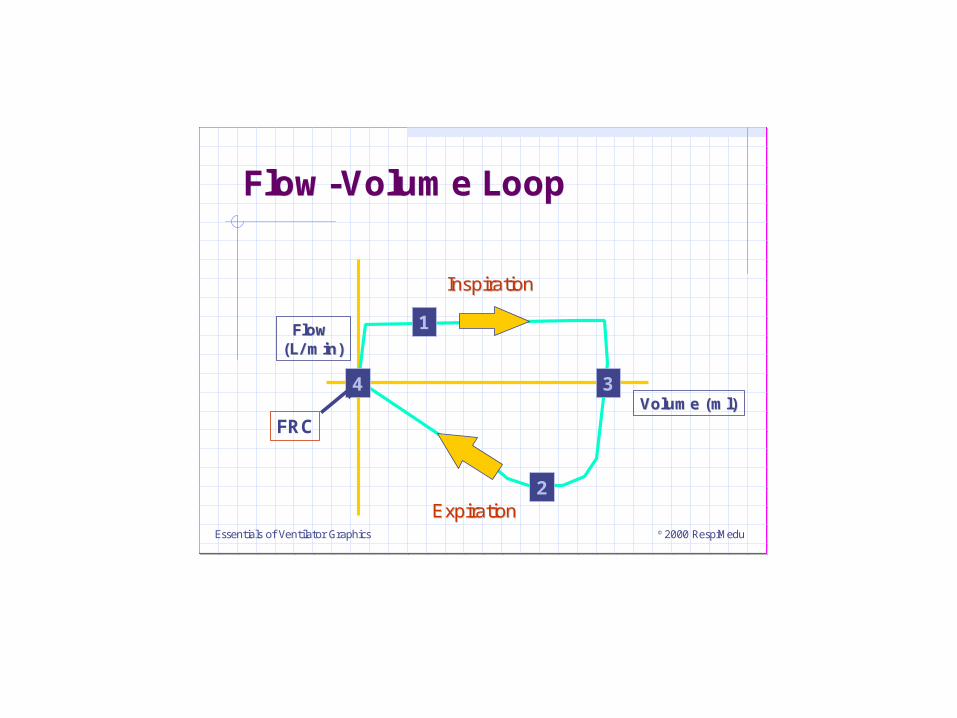
Essentials of Ventilator Graphics ©2000 RespiMedu
Flow-Volume LoopFlow-Volume Loop
Volume (ml)Volume (ml)
1
2
34
InspirationInspiration
ExpirationExpiration
Flow Flow (L/ min)(L/ min)
FRC
Essentials of Ventilator Graphics ©2000 RespiMedu
Flow-Volume LoopFlow-Volume Loop
Volume (ml)Volume (ml)
1
2
34
InspirationInspiration
ExpirationExpiration
Flow Flow (L/ min)(L/ min)
FRC

Abnormal FV Loops
• The expiratory curve “scoops” with high expiratory resistance
• If the patient is air trapping or has a leak, the loop will not meet at the left side where I starts/E ends
• If water/secretions are building up in the airway or circuit, the loop becomes very jagged

Use of FV Loops
Patient•Air trapping•Airway obst•Airway resistance•Active exhalation•Bronchodilator response
Ventilator•Insp flow•Exp flow•Flow starvation•Vt•Leaks•Water or secretion build-up
Pt-Vent Interaction•asynchrony
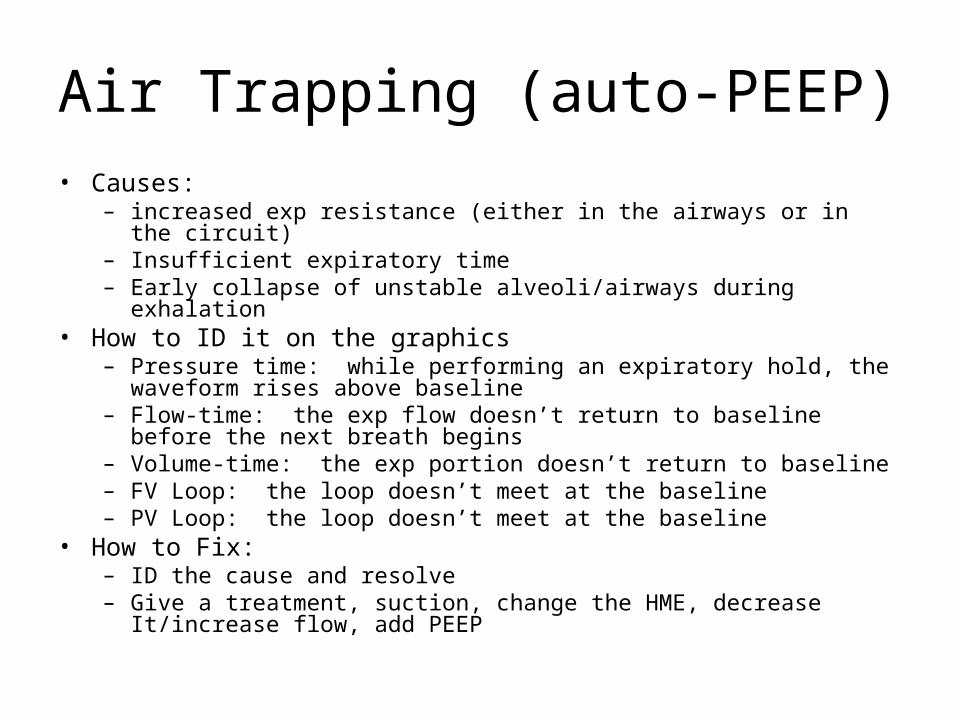
Air Trapping (auto-PEEP)• Causes:
– increased exp resistance (either in the airways or in the circuit)– Insufficient expiratory time– Early collapse of unstable alveoli/airways during exhalation
• How to ID it on the graphics– Pressure time: while performing an expiratory hold, the waveform rises
above baseline– Flow-time: the exp flow doesn’t return to baseline before the next
breath begins– Volume-time: the exp portion doesn’t return to baseline– FV Loop: the loop doesn’t meet at the baseline– PV Loop: the loop doesn’t meet at the baseline
• How to Fix:– ID the cause and resolve– Give a treatment, suction, change the HME, decrease It/increase flow,
add PEEP

Air TrappingAir Trapping
InspirationInspiration
ExpirationExpiration
NormalNormalPatientPatient
Time (sec)Time (sec)
Air TrappingAir TrappingAutoAuto--PEEPPEEP
}}
Flow Flow (L/min)(L/min)
Air TrappingAir Trapping
InspirationInspiration
ExpirationExpiration
NormalNormalPatientPatient
Time (sec)Time (sec)
Air TrappingAir TrappingAutoAuto--PEEPPEEP
}}
Flow Flow (L/min)(L/min)

Airway Resistance Changes
• Causes: – Bronchospasm– Damp or blocked expiratory valve/filter– ETT problems (too small, kinked, obstructed,
patient biting)– High flow– Secretion build-up– Water in the HME
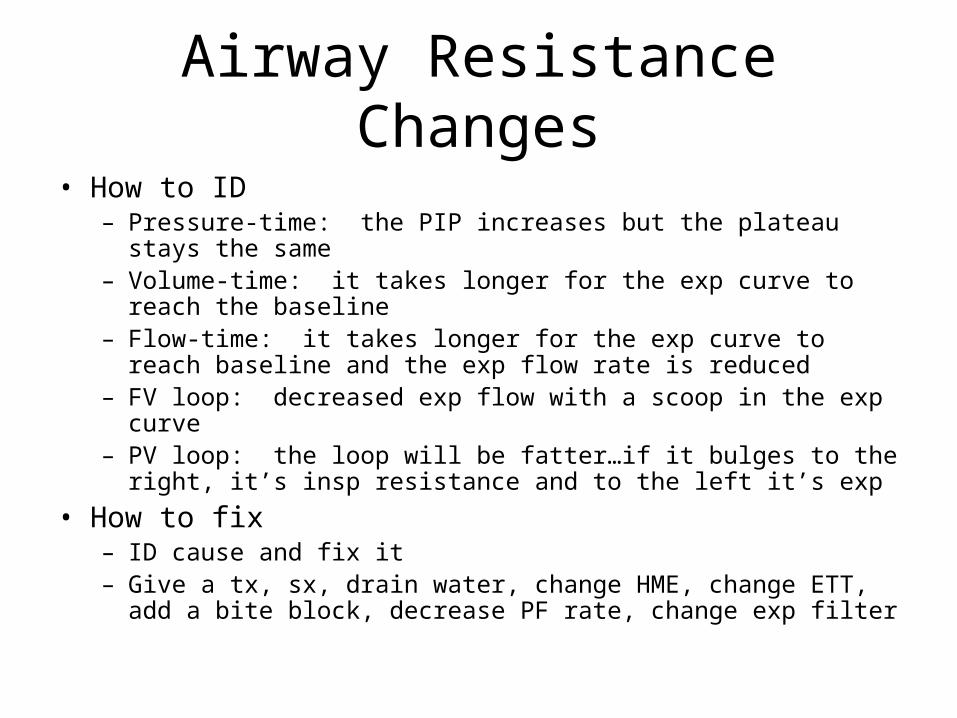
Airway Resistance Changes
• How to ID– Pressure-time: the PIP increases but the plateau stays the
same– Volume-time: it takes longer for the exp curve to reach the
baseline– Flow-time: it takes longer for the exp curve to reach baseline
and the exp flow rate is reduced– FV loop: decreased exp flow with a scoop in the exp curve– PV loop: the loop will be fatter…if it bulges to the right, it’s insp
resistance and to the left it’s exp
• How to fix– ID cause and fix it– Give a tx, sx, drain water, change HME, change ETT, add a bite
block, decrease PF rate, change exp filter

PIP vs PplatPIP vs Pplat
NormalNormal High RawHigh Raw
High FlowHigh Flow Low CLow C LL
Time (sec)Time (sec)
PIPPIP
PPplatplat
PIPPIP
PIPPIP PIPPIP
PPplatplatPPplatplat
PPplatplat
PPawaw
(cm H(cm H22O)O)
PIP vs PplatPIP vs Pplat
NormalNormal High RawHigh Raw
High FlowHigh Flow Low CLow C LL
Time (sec)Time (sec)
PIPPIP
PPplatplat
PIPPIP
PIPPIP PIPPIP
PPplatplatPPplatplat
PPplatplat
PPawaw
(cm H(cm H22O)O)
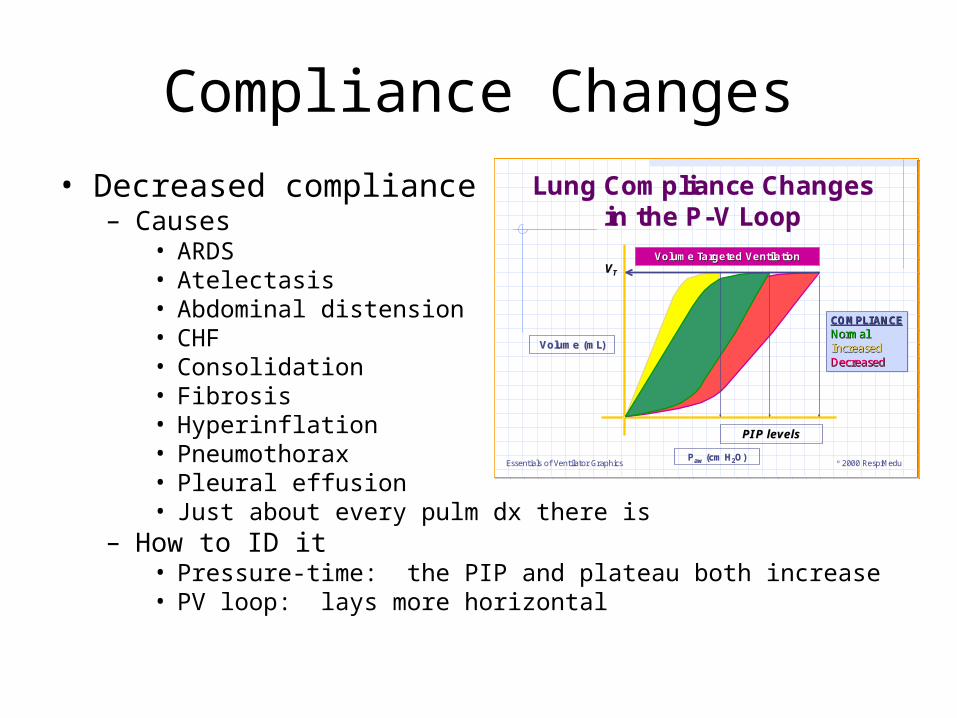
Compliance Changes
• Decreased compliance– Causes
• ARDS• Atelectasis• Abdominal distension• CHF• Consolidation• Fibrosis• Hyperinflation• Pneumothorax• Pleural effusion• Just about every pulm dx there is
– How to ID it• Pressure-time: the PIP and plateau both increase• PV loop: lays more horizontal
Essentials of Ventilator Graphics ©2000 RespiMedu
Lung Compliance Changes in the P-V Loop
Lung Compliance Changes in the P-V Loop
Volume (Volume (mLmL))
PIP levelsPIP levels
VVTT
PPawaw (cm H(cm H22O)O)
COMPLIANCENormalIncreasedDecreased
COMPLIANCECOMPLIANCENormalNormalIncreasedIncreasedDecreasedDecreased
Volume Targeted VentilationVolume Targeted Ventilation

Compliance changes
• Increased compliance– Causes
• emphysema• Surfactant therapy
– How to ID it• Pressure-time: PIP and plateau both decrease• PV loop: stands more vertical (upright)
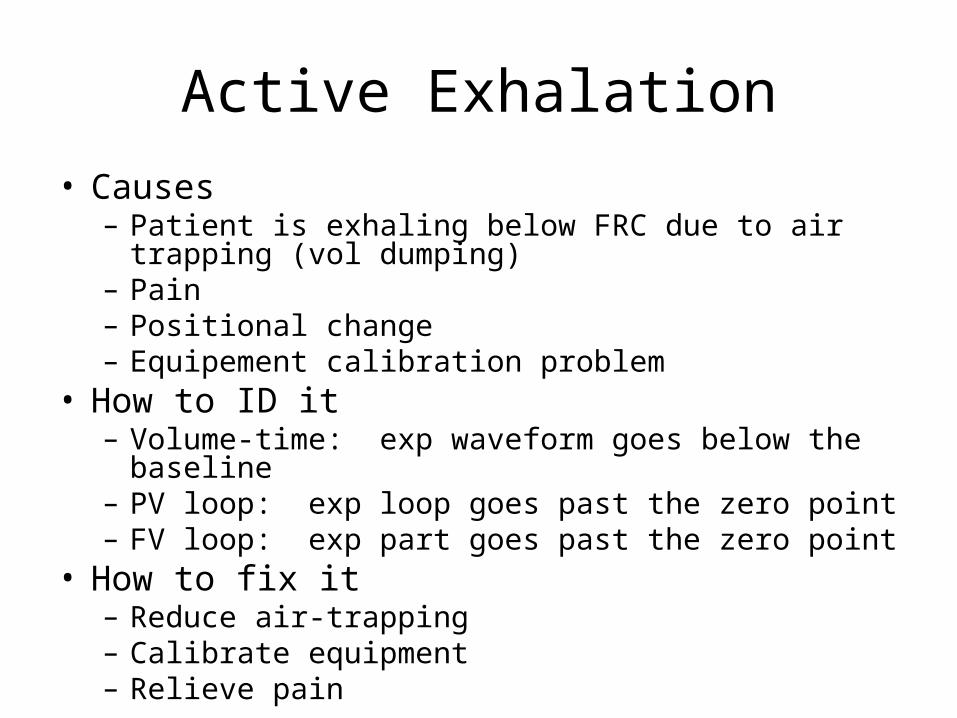
Active Exhalation
• Causes– Patient is exhaling below FRC due to air trapping (vol
dumping)– Pain– Positional change– Equipement calibration problem
• How to ID it– Volume-time: exp waveform goes below the baseline– PV loop: exp loop goes past the zero point– FV loop: exp part goes past the zero point
• How to fix it– Reduce air-trapping– Calibrate equipment– Relieve pain
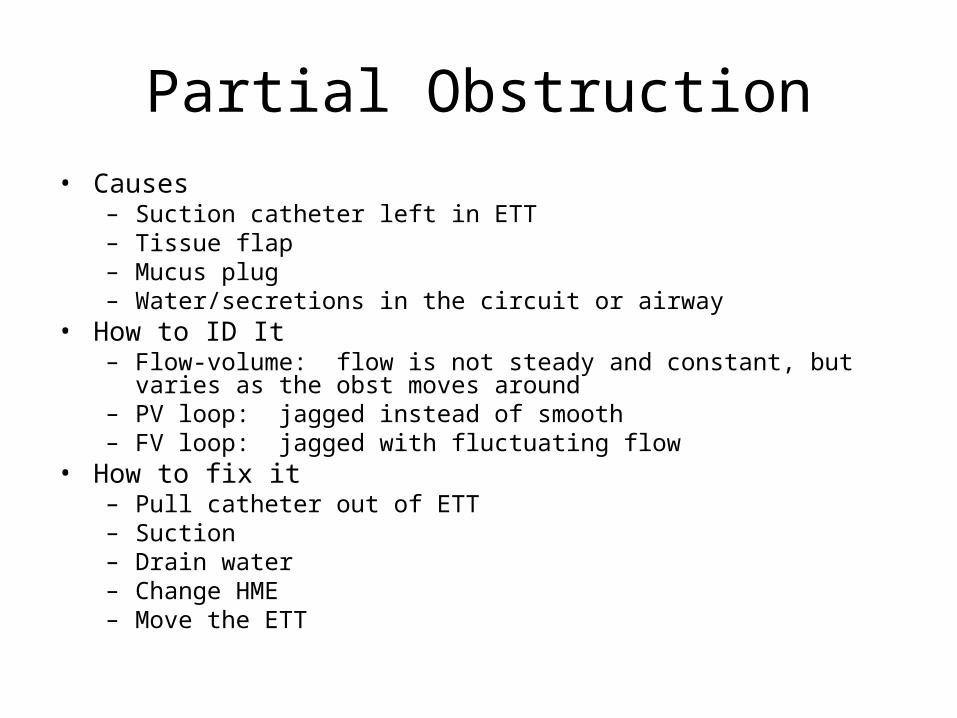
Partial Obstruction• Causes
– Suction catheter left in ETT– Tissue flap– Mucus plug– Water/secretions in the circuit or airway
• How to ID It– Flow-volume: flow is not steady and constant, but varies as the obst
moves around– PV loop: jagged instead of smooth– FV loop: jagged with fluctuating flow
• How to fix it– Pull catheter out of ETT– Suction– Drain water– Change HME– Move the ETT

Overdistension • Causes
– Vt set too high (vol vent)– Pressure set too high (press
vent)– Could occur in pressure vent
with C or Raw changes
• How to ID it– PV loop: bird beak at the top
of the loop
• How to fix it– Reduce Vt (vol vent)– Reduce pressure (P vent)
Essentials of Ventilator Graphics ©2000 RespiMedu
OverdistensionOverdistension
Pressure (cm HPressure (cm H22O)O)
Paw rises with little or no change in VT
PPawaw
(cm H(cm H22O)O)
Essentials of Ventilator Graphics ©2000 RespiMedu
OverdistensionOverdistension
Pressure (cm HPressure (cm H22O)O)
Paw rises with little or no change in VT
PPawaw
(cm H(cm H22O)O)

Leaks • Causes
– Expiratory leak: air leak through a chest tube, BP fistula, ETT cuff leak, NG tube in trachea
– Inspiratory leak: loose connections, ventilator malfunction, faulty flow sensor
• How to ID it– Pressure-time: decreased PIP– Volume-time: decreased Vt…exp leaks keep exp Vt from returning to
baseline– Flow-time: PEF decreases– PV loop: exp side doesn’t return to the baseline– FV loop: exp part doesn’t return to baseline
• How to fix it– ID source of leak and fix it– Do a leak test and make sure all connections are tight

Rate Asynchrony• Causes
– Neurological injury/swelling– Air hunger
• How to ID it– Pressure-time: patient tries to inhale/exhale in the middle of the
waveform, causing a dip in the pressure– Flow-time: patient tries to inhale/exhale in the middle of the waveform,
causing erratic flows/dips in the waveform – PV loop: dips in the loop during either I or E, showing patient efforts to
breathe– FL loop: dips in the loop during either I or E, showing patient efforts to
breathe• How to fix it: if neurological, may need paralytic or sedative to
reduce respiratory drive…if air hunger, adjust settings (try increasing the flow rate/decreasing the It or increasing the set rate to “capture” the patient) or changing the mode - sometimes changing from partial to full support will solve the problem

Flow Asynchrony
• Causes:flow rate set incorrectly for the patient demands (volume vent only…in pressure ventilation the flow is a function of the pressure setting and the patient’s lung characteristics – you don’t set it or have any control over it)
• How to ID It– Pressure-time curve: patient “pulls off” the pressure
curve and it becomes concave – Pressure-volume loop: the inspiratory side will scoop
inward with a decrease in pressure
• How to fix it: increase the peak flow setting

Trigger Asynchrony
• Causes: sensitivity not set correctly…patient has to do excessive work to trigger a breath, autoPEEP
• How to identify it:– Pressure-time curve: there will be a huge negative
deflection before each pressure curve and/or negative pressure deflections that don’t result in a breath delivery
– Flow-time curve: there will be a blip where the patient attempts to trigger
– Pressure-volume loop: there will be a large “pig tail” on the loop
• How to fix it: set sensitivity so that minimal effort is required to trigger the ventilator, eliminate the autoPEEP

Setting the Rise Time
• The faster the flow valve opens, the faster the set pressure is reached in pressure modes
• If the valve opens so fast that the flow is instantaneously delivered to the airway, you can get an overshoot in the pressure curve with ringing (Bart Simpson hair)…you need to increase the rise time if this occurs – this makes the flow valve open a bit more slowly
• If the valve opens too slow, the pressure curve becomes rounded when it should be square in a pressure mode…this will decrease Vt delivery…you need to decrease the rise time if this occurs

Volume-Targeted Ventilation
Essentials of Ventilator Graphics ©2000 RespiMedu
Controlled Mode (Volume- Targeted Ventilation)
Controlled Mode (Volume- Targeted Ventilation)
PressurePressure
Volume Volume Volume
FlowFlowPreset Peak FlowPreset Peak Flow
Preset Preset VVtt
Dependent onDependent onCCLL & R& Rawaw
Time (sec)Time (sec)
(L/min)(L/min)
(cm H(cm H22O)O)
(ml)(ml)
Essentials of Ventilator Graphics ©2000 RespiMedu
Assisted Mode(Volume-Targeted Ventilation)
Assisted Mode(Volume-Targeted Ventilation)
FlowFlow
PressurePressure
VolumeVolume
Time (sec)Time (sec)
(L/min)(L/min)
(cm H(cm H22O)O)
(ml)(ml)
Essentials of Ventilator Graphics ©2000 RespiMedu
Assisted Mode(Volume-Targeted Ventilation)
Assisted Mode(Volume-Targeted Ventilation)
FlowFlow
PressurePressure
VolumeVolume
Time (sec)Time (sec)
(L/min)(L/min)
(cm H(cm H22O)O)
(ml)(ml)
Essentials of Ventilator Graphics ©2000 RespiMedu
SIMV(Volume-Targeted Ventilation)
SIMV(Volume-Targeted Ventilation)
Time (sec)Time (sec)
FlowFlow
PressurePressure
VolumeVolume
(L/min)(L/min)
(cm H(cm H22O)O)
(ml)(ml)
Essentials of Ventilator Graphics ©2000 RespiMedu
SIMV(Volume-Targeted Ventilation)
SIMV(Volume-Targeted Ventilation)
Time (sec)Time (sec)
FlowFlow
PressurePressure
VolumeVolume
(L/min)(L/min)
(cm H(cm H22O)O)
(ml)(ml)
Essentials of Ventilator Graphics ©2000 RespiMedu
SIMV+PS(Volume-Targeted Ventilation)
SIMV+PS(Volume-Targeted Ventilation)
Time (sec)Time (sec)
FlowFlow
PressurePressure
VolumeVolume
(L/min)(L/min)
(cm H(cm H22O)O)
(ml)(ml)
Set PS levelSet PS level
Essentials of Ventilator Graphics ©2000 RespiMedu
SIMV+PS(Volume-Targeted Ventilation)
SIMV+PS(Volume-Targeted Ventilation)
Time (sec)Time (sec)
FlowFlow
PressurePressure
VolumeVolume
(L/min)(L/min)
(cm H(cm H22O)O)
(ml)(ml)
Set PS levelSet PS level

Suggested Websites
• www.adhb.govt.nz/newborn/TeachingResources/Ventilation/RespiratoryFunctionMonitoringandGraphics.htm
• www.rtmagazine.com/issues/articles/2002-02_04.asp• www.rcsw.org/Download/2006_RCSW_conf/
Presentation&202006%20RCSW%20Waveforms_in_ARDS%20Dean%20H.pdf
• www.aarc.org/education/webcast/archives/waveforms/03.01.05/ppt#256,1,Using the Ventilator To Probe Physiology: Monitoring Graphics and Lung Mechanics During Mechanical Ventilation
• www.brighamandwomens.org/respiratorytherapy/advmecven2.ppt


![Pneumonia (Ventilator-associated [VAP] and non-ventilator](https://img.pdfslide.net/doc/110x75/61c3dfa934191a172140c0d5/pneumonia-ventilator-associated-vap-and-non-ventilator-.jpg)