Embed Size (px)
Citation preview

2015/16 Meteorological Verification Data – Technical Reference

Published by the Bureau of Meteorology
© Commonwealth of Australia 2016 This work is copyright. Apart from any use as permitted under the Copyright Act 1968, no part may be reproduced without prior written permission from the Bureau of Meteorology. Requests and inquiries concerning reproduction and rights should be addressed to the Production Manager, Communication Section, Bureau of Meteorology, GPO Box 1289, Melbourne 3001. Information regarding requests for reproduction of material from the Bureau website can be found at www.bom.gov.au/other/copyright.shtml
i
Contact details Tennessee Leeuwenburg Scientific and Predictive Software Lead Bureau of Meteorology GPO Box 1289 MELBOURNE VIC 3001 Phone: 03 9669 4310 Email: [email protected]
Acknowledgments Thanks to Maoyuan Liu, Ioanna Ioannou and Harry Jack who all contributed significantly to the preparation of this document and preparing the dataset.

ii
Table of Contents 1.1 Introduction...........................................................................................................................31.2 How the Bureau uses this data.........................................................................................31.3 Sneak Peek..........................................................................................................................41.4 Data Schema for Forecast and Observations.................................................................4
1.4.1 TJLite schema.................................................................................................................41.4.2 Notes.................................................................................................................................6
1.5 Station Data.........................................................................................................................71.5.1 Map of AWS stations in this dataset............................................................................7
1.6 StationData.csv...................................................................................................................71.7 station_groups.yml..............................................................................................................81.8 Meteorological parameters................................................................................................9
1.8.1 Forecast parameters......................................................................................................91.9 Observational parameters..................................................................................................91.10 Example Code...................................................................................................................10
1.10.1 Useful Functions.......................................................................................................101.1 Example calculation of root-mean-square error...........................................................131.11 Copyright and Legal Information.....................................................................................15
3
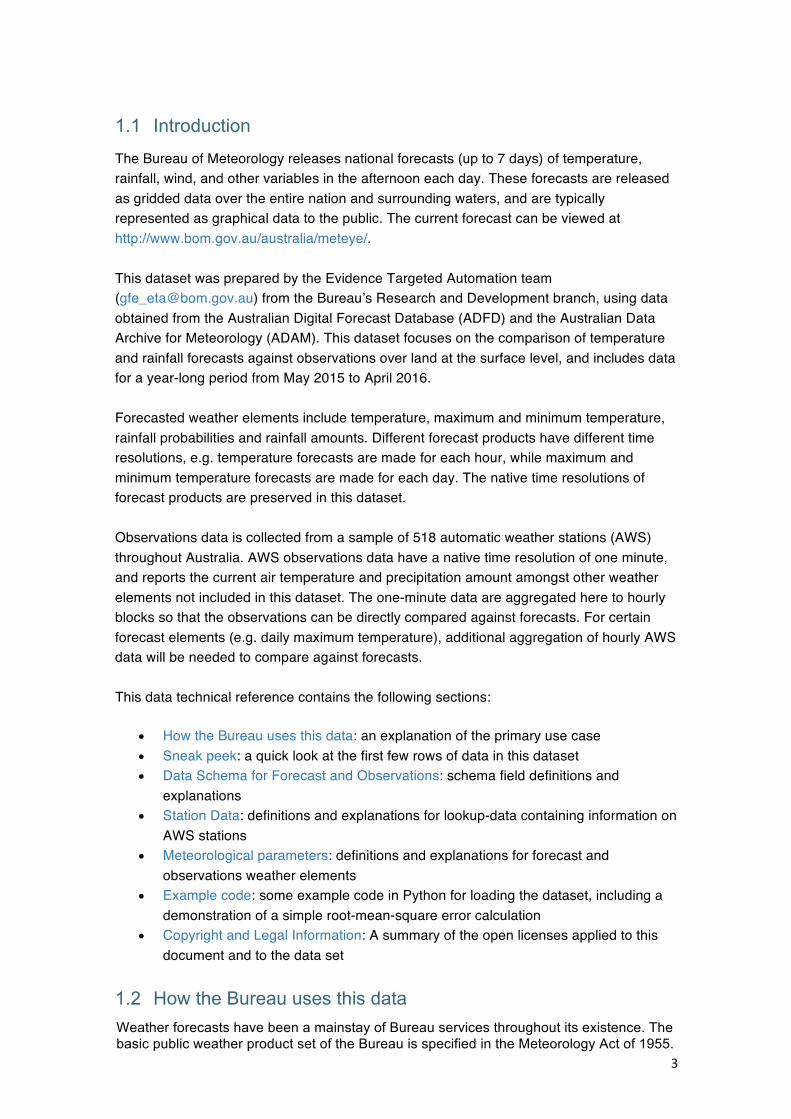
1.1 Introduction The Bureau of Meteorology releases national forecasts (up to 7 days) of temperature, rainfall, wind, and other variables in the afternoon each day. These forecasts are released as gridded data over the entire nation and surrounding waters, and are typically represented as graphical data to the public. The current forecast can be viewed at http://www.bom.gov.au/australia/meteye/. This dataset was prepared by the Evidence Targeted Automation team ([email protected]) from the Bureau’s Research and Development branch, using data obtained from the Australian Digital Forecast Database (ADFD) and the Australian Data Archive for Meteorology (ADAM). This dataset focuses on the comparison of temperature and rainfall forecasts against observations over land at the surface level, and includes data for a year-long period from May 2015 to April 2016. Forecasted weather elements include temperature, maximum and minimum temperature, rainfall probabilities and rainfall amounts. Different forecast products have different time resolutions, e.g. temperature forecasts are made for each hour, while maximum and minimum temperature forecasts are made for each day. The native time resolutions of forecast products are preserved in this dataset. Observations data is collected from a sample of 518 automatic weather stations (AWS) throughout Australia. AWS observations data have a native time resolution of one minute, and reports the current air temperature and precipitation amount amongst other weather elements not included in this dataset. The one-minute data are aggregated here to hourly blocks so that the observations can be directly compared against forecasts. For certain forecast elements (e.g. daily maximum temperature), additional aggregation of hourly AWS data will be needed to compare against forecasts. This data technical reference contains the following sections:
• How the Bureau uses this data: an explanation of the primary use case • Sneak peek: a quick look at the first few rows of data in this dataset • Data Schema for Forecast and Observations: schema field definitions and
explanations • Station Data: definitions and explanations for lookup-data containing information on
AWS stations • Meteorological parameters: definitions and explanations for forecast and
observations weather elements • Example code: some example code in Python for loading the dataset, including a
demonstration of a simple root-mean-square error calculation • Copyright and Legal Information: A summary of the open licenses applied to this
document and to the data set
1.2 How the Bureau uses this data Weather forecasts have been a mainstay of Bureau services throughout its existence. The basic public weather product set of the Bureau is specified in the Meteorology Act of 1955.
4
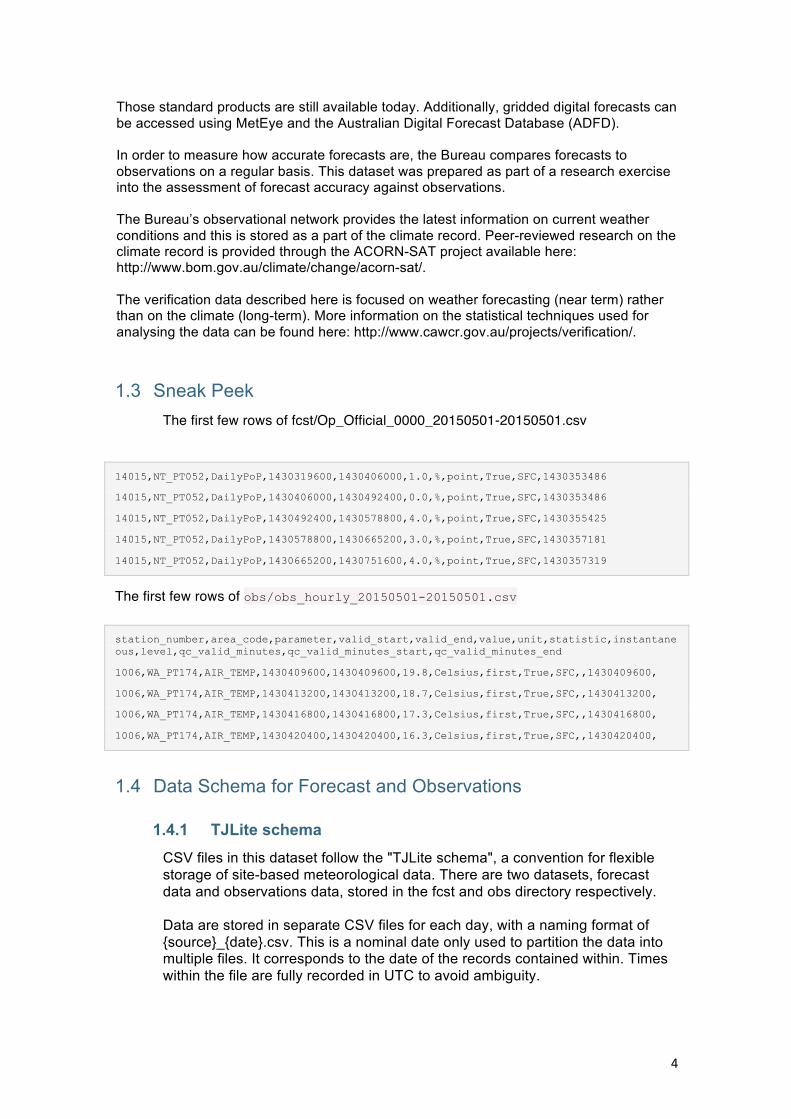
Those standard products are still available today. Additionally, gridded digital forecasts can be accessed using MetEye and the Australian Digital Forecast Database (ADFD). In order to measure how accurate forecasts are, the Bureau compares forecasts to observations on a regular basis. This dataset was prepared as part of a research exercise into the assessment of forecast accuracy against observations. The Bureau’s observational network provides the latest information on current weather conditions and this is stored as a part of the climate record. Peer-reviewed research on the climate record is provided through the ACORN-SAT project available here: http://www.bom.gov.au/climate/change/acorn-sat/. The verification data described here is focused on weather forecasting (near term) rather than on the climate (long-term). More information on the statistical techniques used for analysing the data can be found here: http://www.cawcr.gov.au/projects/verification/.
1.3 Sneak Peek The first few rows of fcst/Op_Official_0000_20150501-20150501.csv
14015,NT_PT052,DailyPoP,1430319600,1430406000,1.0,%,point,True,SFC,1430353486
14015,NT_PT052,DailyPoP,1430406000,1430492400,0.0,%,point,True,SFC,1430353486
14015,NT_PT052,DailyPoP,1430492400,1430578800,4.0,%,point,True,SFC,1430355425
14015,NT_PT052,DailyPoP,1430578800,1430665200,3.0,%,point,True,SFC,1430357181
14015,NT_PT052,DailyPoP,1430665200,1430751600,4.0,%,point,True,SFC,1430357319
The first few rows of obs/obs_hourly_20150501-20150501.csv station_number,area_code,parameter,valid_start,valid_end,value,unit,statistic,instantaneous,level,qc_valid_minutes,qc_valid_minutes_start,qc_valid_minutes_end
1006,WA_PT174,AIR_TEMP,1430409600,1430409600,19.8,Celsius,first,True,SFC,,1430409600,
1006,WA_PT174,AIR_TEMP,1430413200,1430413200,18.7,Celsius,first,True,SFC,,1430413200,
1006,WA_PT174,AIR_TEMP,1430416800,1430416800,17.3,Celsius,first,True,SFC,,1430416800,
1006,WA_PT174,AIR_TEMP,1430420400,1430420400,16.3,Celsius,first,True,SFC,,1430420400,
1.4 Data Schema for Forecast and Observations
1.4.1 TJLite schema CSV files in this dataset follow the "TJLite schema", a convention for flexible storage of site-based meteorological data. There are two datasets, forecast data and observations data, stored in the fcst and obs directory respectively. Data are stored in separate CSV files for each day, with a naming format of {source}_{date}.csv. This is a nominal date only used to partition the data into multiple files. It corresponds to the date of the records contained within. Times within the file are fully recorded in UTC to avoid ambiguity.
5
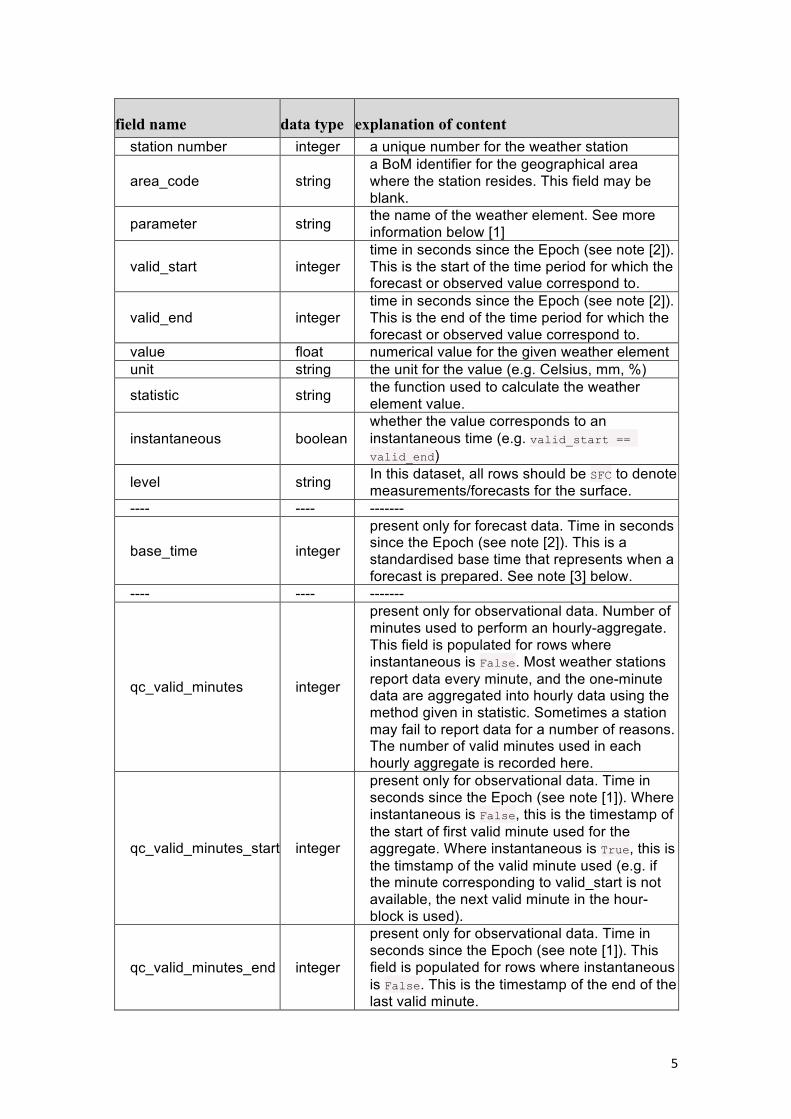
field name data type explanation of content station number integer a unique number for the weather station
area_code string a BoM identifier for the geographical area where the station resides. This field may be blank.
parameter string the name of the weather element. See more information below [1]
valid_start integer time in seconds since the Epoch (see note [2]). This is the start of the time period for which the forecast or observed value correspond to.
valid_end integer time in seconds since the Epoch (see note [2]). This is the end of the time period for which the forecast or observed value correspond to.
value float numerical value for the given weather element unit string the unit for the value (e.g. Celsius, mm, %)
statistic string the function used to calculate the weather element value.
instantaneous boolean whether the value corresponds to an instantaneous time (e.g. valid_start == valid_end)
level string In this dataset, all rows should be SFC to denote measurements/forecasts for the surface.
---- ---- -------
base_time integer
present only for forecast data. Time in seconds since the Epoch (see note [2]). This is a standardised base time that represents when a forecast is prepared. See note [3] below.
---- ---- -------
qc_valid_minutes integer
present only for observational data. Number of minutes used to perform an hourly-aggregate. This field is populated for rows where instantaneous is False. Most weather stations report data every minute, and the one-minute data are aggregated into hourly data using the method given in statistic. Sometimes a station may fail to report data for a number of reasons. The number of valid minutes used in each hourly aggregate is recorded here.
qc_valid_minutes_start integer
present only for observational data. Time in seconds since the Epoch (see note [1]). Where instantaneous is False, this is the timestamp of the start of first valid minute used for the aggregate. Where instantaneous is True, this is the timstamp of the valid minute used (e.g. if the minute corresponding to valid_start is not available, the next valid minute in the hour-block is used).
qc_valid_minutes_end integer
present only for observational data. Time in seconds since the Epoch (see note [1]). This field is populated for rows where instantaneous is False. This is the timestamp of the end of the last valid minute.
6
1.4.2 Notes 1. Additional information on parameter, string, the weather element name. • For forecast data, these elements are ['T', 'MaxT', 'MinT', 'PoP',
'DailyPoP', 'DailyPoP1', 'DailyPoP5', 'DailyPoP10', 'DailyPoP15', 'DailyPoP25', 'DailyPoP50', 'Precip', 'Precip10Pct', 'Precip25Pct', 'Precip50Pct', 'DailyPrecip', 'DailyPrecip10Pct', 'DailyPrecip25Pct', 'DailyPrecip50Pct', 'DailyPrecip75Pct'].
• For observational data, these are ['PRCP', 'AIR_TEMP', 'AIR_TEMP_MIN', 'AIR_TEMP_MAX']. See section 1.8.1 for definitions of these fields.
• For an overview of the different weather elements, see below. 2. Time since Epoch is calculated as time in seconds since the Unix Epoch
(1970-01-01T00:00:00Z+00). https://en.wikipedia.org/wiki/Unix_time provides more information. See http://www.unixtimestamp.com/ for an online conversion tool.
3. Different regions (state offices) may publish their forecasts at slightly different times. This can also vary slightly by field type. For consistency, each forecast is given a nominal base_time which represents the time the forecast was issued. The difference between base_time and valid_start gives the lead_time of a forecast, i.e. how far into the future a forecast is. Generally, forecast accuracy tends to be better at shorter lead times.
7
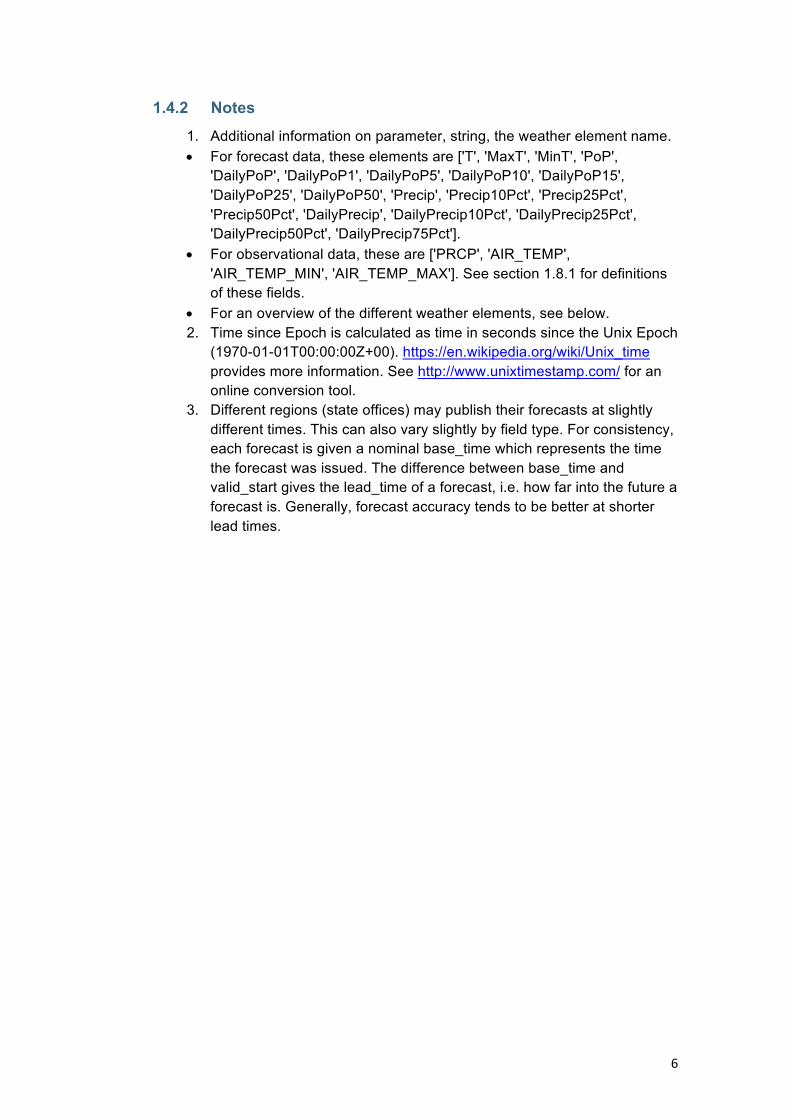
1.5 Station Data
1.5.1 Map of AWS stations in this dataset
Figure1:MapofAustraliashowingthelocationofAutomatedWeatherStations
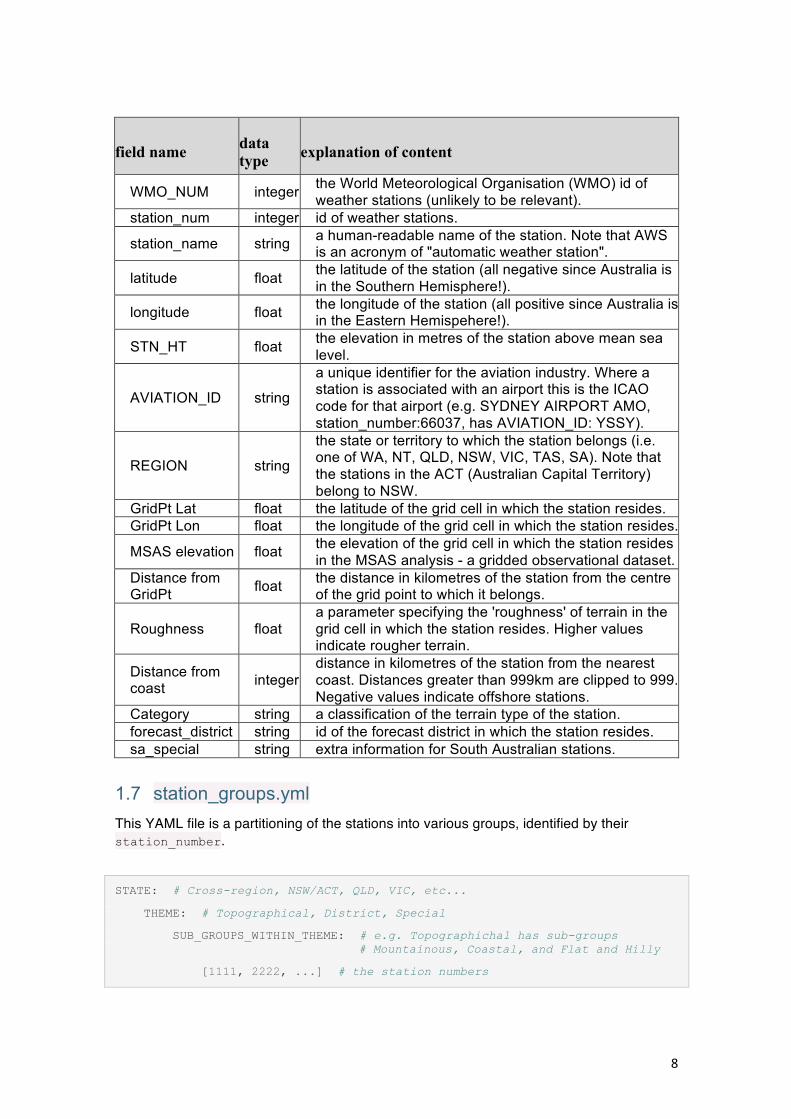
1.6 StationData.csv StationData.csv holds information about the automatic weather station (AWS) sites that are present in the forecast and observational data (they are identified by their station_number in these datasets).
The first few rows of StationData.csv:
WMO_NUM,station_number,station_name,LATITUDE,LONGITUDE,STN_HT,AVIATION_ID,REGION,GridPt Lat,GridPt Lon,MSAS elevation,Distance from GridPt,Roughness,Distance from coast,Category,forecast_district,sa_special
95695,46012,WILCANNIA AERODROME AWS,-31.5194,143.385,94.3,YWCA,NSW,-31.49,143.38,89.12,2.4,13.3,999,flat_inland,NSW_PW016,
95485,46126,TIBOOBURRA AIRPORT,-29.4448,142.0567,176.4,YTIB,NSW,-29.45,142.04,170.04,2.1,11.7,999,flat_inland,NSW_PW016,
94686,46128,FOWLERS GAP AWS,-31.0867,141.7017,181,FOWG,NSW,-31.07,141.71,190.08,0.7,21,225,flat_inland,NSW_PW016,
8
field name data type explanation of content
WMO_NUM integer the World Meteorological Organisation (WMO) id of weather stations (unlikely to be relevant).
station_num integer id of weather stations.
station_name string a human-readable name of the station. Note that AWS is an acronym of "automatic weather station".
latitude float the latitude of the station (all negative since Australia is in the Southern Hemisphere!).
longitude float the longitude of the station (all positive since Australia is in the Eastern Hemispehere!).
STN_HT float the elevation in metres of the station above mean sea level.
AVIATION_ID string
a unique identifier for the aviation industry. Where a station is associated with an airport this is the ICAO code for that airport (e.g. SYDNEY AIRPORT AMO, station_number:66037, has AVIATION_ID: YSSY).
REGION string
the state or territory to which the station belongs (i.e. one of WA, NT, QLD, NSW, VIC, TAS, SA). Note that the stations in the ACT (Australian Capital Territory) belong to NSW.
GridPt Lat float the latitude of the grid cell in which the station resides. GridPt Lon float the longitude of the grid cell in which the station resides.
MSAS elevation float the elevation of the grid cell in which the station resides in the MSAS analysis - a gridded observational dataset.
Distance from GridPt float the distance in kilometres of the station from the centre
of the grid point to which it belongs.
Roughness float a parameter specifying the 'roughness' of terrain in the grid cell in which the station resides. Higher values indicate rougher terrain.
Distance from coast integer
distance in kilometres of the station from the nearest coast. Distances greater than 999km are clipped to 999. Negative values indicate offshore stations.
Category string a classification of the terrain type of the station. forecast_district string id of the forecast district in which the station resides. sa_special string extra information for South Australian stations.
1.7 station_groups.yml This YAML file is a partitioning of the stations into various groups, identified by their station_number.
STATE: # Cross-region, NSW/ACT, QLD, VIC, etc...
THEME: # Topographical, District, Special
SUB_GROUPS_WITHIN_THEME: # e.g. Topographichal has sub-groups # Mountainous, Coastal, and Flat and Hilly
[1111, 2222, ...] # the station numbers

9
1.8 Meteorological parameters
1.8.1 Forecast parameters The forecast data (see fcst/Op_Official_0000_{date}.csv) has the following parameters:
parameter unit description
'T' degrees celcius the instantaneous air temperature.
'MaxT' degrees celcius
the maximum temperature over the forecast period.
'MinT' degrees celcius the minimum temperature over the forecast period.
'PoP' percentage the chance of receiving at least 0.2mm rainfall (the detection limit of the rain gauges) over a 3-hour period
'DailyPoP' percentage the chance of receiving at least 0.2mm rainfall (the detection limit of the rain gauges) over a 24-hour
'DailyPoP1' percentage the chance of receiving at least 1mm rainfall over a 24-hour period.
'DailyPoP5' percentage the chance of receiving at least 5mm rainfall over a 24-hour period.
'DailyPoP10' percentage the chance of receiving at least 10mm rainfall over a 24-hour period.
'DailyPoP15' percentage the chance of receiving at least 15mm rainfall over a 24-hour period.
'DailyPoP25' percentage the chance of receiving at least 25mm rainfall over a 24-hour period.
'DailyPoP50' percentage the chance of receiving at least 50mm rainfall over a 24-hour period.
'Precip' mm the expected (in a statistical sense) amount of rainfall over a 3-hour period.
'Precip10Pct' mm there is a 10% chance of receiving at least this much rainfall over the 3-hour period.
'Precip25Pct' mm there is a 25% chance of receiving at least this much rainfall over the 3-hour period.
'Precip50Pct' mm there is a 50% chance of receiving at least this much rainfall over the 3-hour period.
'DailyPrecip' mm the expected (in a statistical sense) amount of rainfall over a 15Z-aligned 24-hour period.
'DailyPrecip10Pct' mm there is a 10% chance of receiving at least this much rainfall over the 24-hour period.
'DailyPrecip25Pct' mm there is a 25% chance of receiving at least this much rainfall over the 24-hour period.
'DailyPrecip50Pct' mm there is a 50% chance of receiving at least this much rainfall over the 24-hour period.
'DailyPrecip75Pct' mm there is a 75% chance of receiving at least this much rainfall over the 24-hour period.
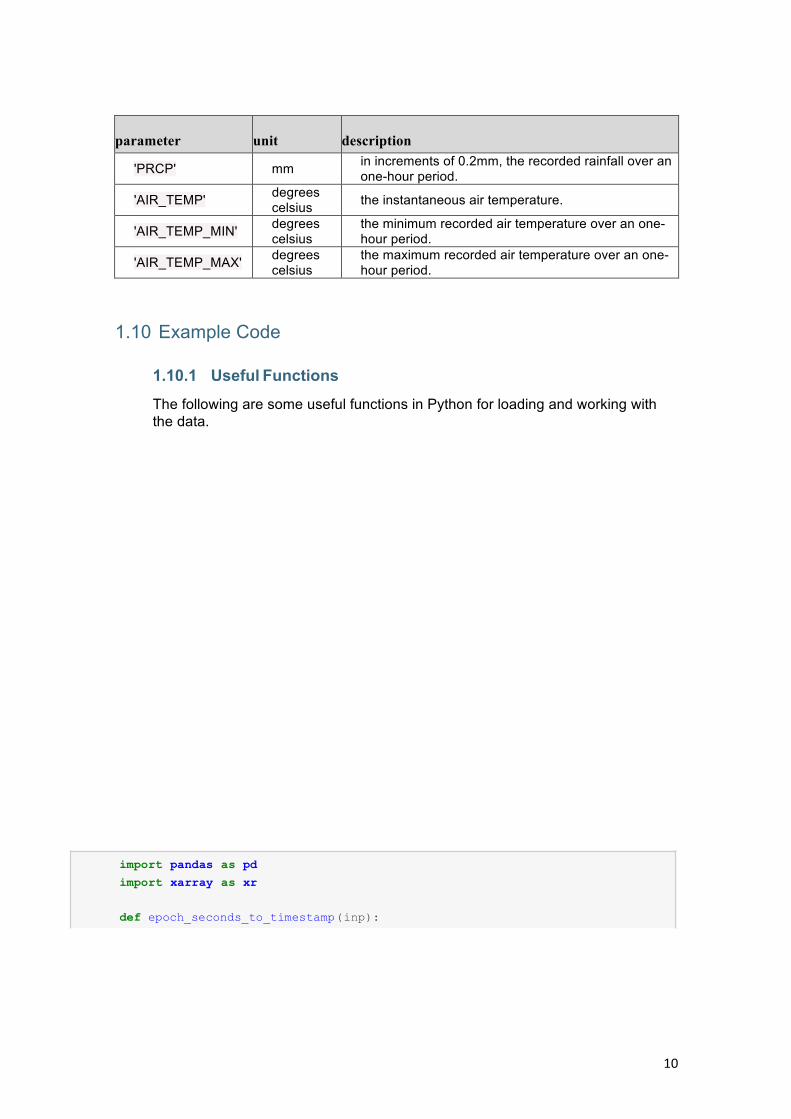
1.9 Observational parameters The observational data (see obs/obs_hourly_{date}.csv) has the following parameters
10
import pandas as pd
import xarray as xr def epoch_seconds_to_timestamp(inp):
parameter unit description
'PRCP' mm in increments of 0.2mm, the recorded rainfall over an one-hour period.
'AIR_TEMP' degrees celsius the instantaneous air temperature.
'AIR_TEMP_MIN' degrees celsius
the minimum recorded air temperature over an one-hour period.
'AIR_TEMP_MAX' degrees celsius
the maximum recorded air temperature over an one-hour period.
1.10 Example Code
1.10.1 Useful Functions The following are some useful functions in Python for loading and working with the data.

11
"""
Converts an integer (seconds since UNIX epoch) or list of integers
into a Pandas Timestamp object.
Example:
>>> epoch_seconds_to_timestamp(1461945600)
Timestamp('2016-04-29 16:00:00')
>>> epoch_seconds_to_timestamp([1461945600, 1461945660, 1461945720])
DatetimeIndex(['2016-04-29 16:00:00', '2016-04-29 16:01:00',
'2016-04-29 16:02:00'], dtype='datetime64[ns]', freq=None)
"""
return pd.to_datetime(inp, unit='s') def pd_read_fcst_csv(file_path):
""" Reads a forecast CSV file and returns a Pandas DataFrame with the
appropriate type conversions.
Examples:
>>> pd_read_fcst_csv('fcst/Op_Official_0000_20150501.csv')
"""
df = pd.read_csv(file_path) for field in ['valid_start', 'valid_end', 'base_time']:
df[field] = epoch_seconds_to_timestamp(df[field])
df['station_number'] = df['station_number'].astype('int')
return df def pd_read_obs_csv(file_path):
""" Reads a observations CSV file and returns a Pandas DataFrame with the
appropriate type conversions.
Example:
>>> pd_read_obs_csv('obs/obs_hourly_20150501.csv')
"""
df = pd.read_csv(file_path)
for field in ['valid_start', 'valid_end', 'qc_valid_minutes_start', 'qc_valid_minutes_end']: df[field] = epoch_seconds_to_timestamp(df[field])
df['station_number'] = df['station_number'].astype('int')
return df def dataframe_param_to_xarray(dataframe, param, indices):
""" Filters the `dataframe` using its "parameter" column to contain only
the supplied `param`, then create an xarray DataArray object using
the supplied `indices`.
Example:
>>> df = pd.DataFrame([[0, 'max', 5],
[0, 'min', 3],
12
[1, 'max', 10],
[1, 'min, 0]],
columns=['x', 'parameter', 'value'])
>>> dataframe_param_to_xarray(df, 'min', ['x']) <xarray.DataArray 'min' (x: 2)>
array([3, 0])
Coordinates:
* x (x) int64 0 1
"""
# filter by parameter dataframe = dataframe[dataframe['parameter'] == param]
# keep only the indices and value columns
selection = dataframe[indices + ['value']]
# drop any spurious duplicated data
# (the same indices and value, i.e. some data was saved twice?)
selection = selection.drop_duplicates(subset=indices)
# drop any spurious NaN-data
# (indices contain NaN, incomplete data?)
selection = selection.dropna(subset=indices)
# set the dataframe index
selection = selection.set_index(indices)
# obtain an xarray.DataArray from the 'value' column, using the indices
# as coordinate values data_array = xr.DataArray.from_series(selection["value"])
data_array.name = param
return data_array
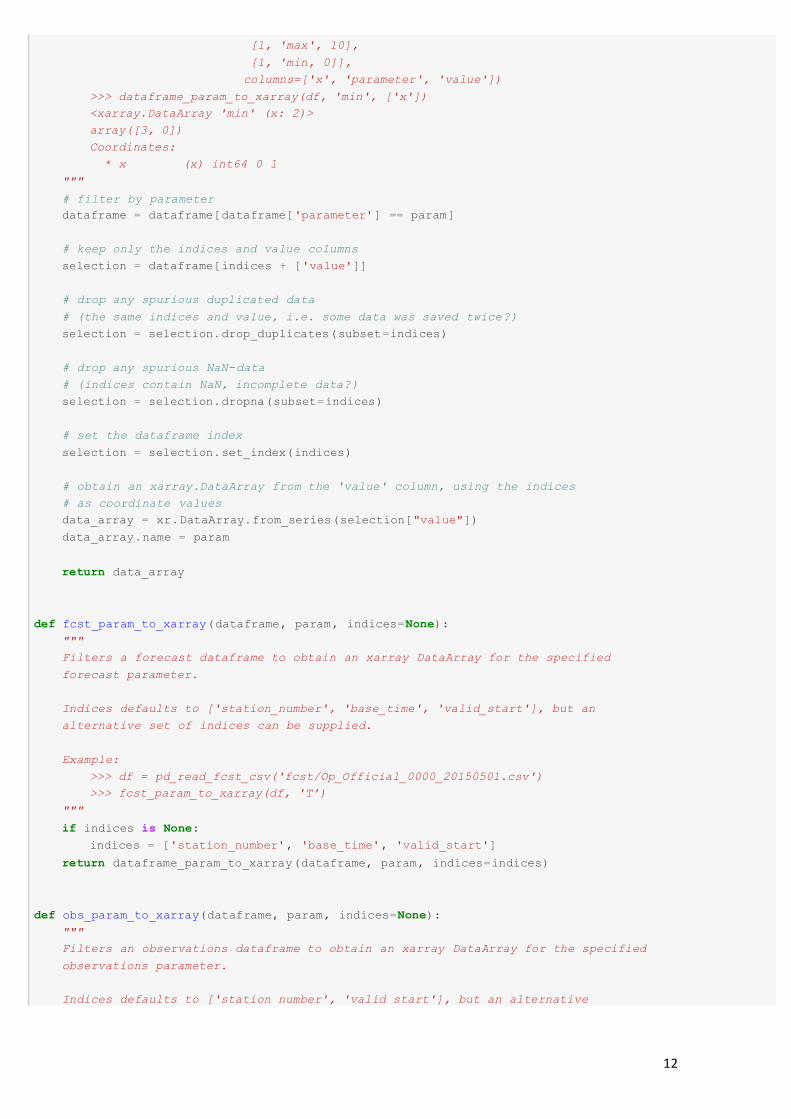
def fcst_param_to_xarray(dataframe, param, indices=None):
""" Filters a forecast dataframe to obtain an xarray DataArray for the specified
forecast parameter.
Indices defaults to ['station_number', 'base_time', 'valid_start'], but an
alternative set of indices can be supplied.
Example:
>>> df = pd_read_fcst_csv('fcst/Op_Official_0000_20150501.csv') >>> fcst_param_to_xarray(df, 'T')
"""
if indices is None: indices = ['station_number', 'base_time', 'valid_start']
return dataframe_param_to_xarray(dataframe, param, indices=indices) def obs_param_to_xarray(dataframe, param, indices=None):
""" Filters an observations dataframe to obtain an xarray DataArray for the specified
observations parameter.
Indices defaults to ['station number', 'valid start'], but an alternative

13
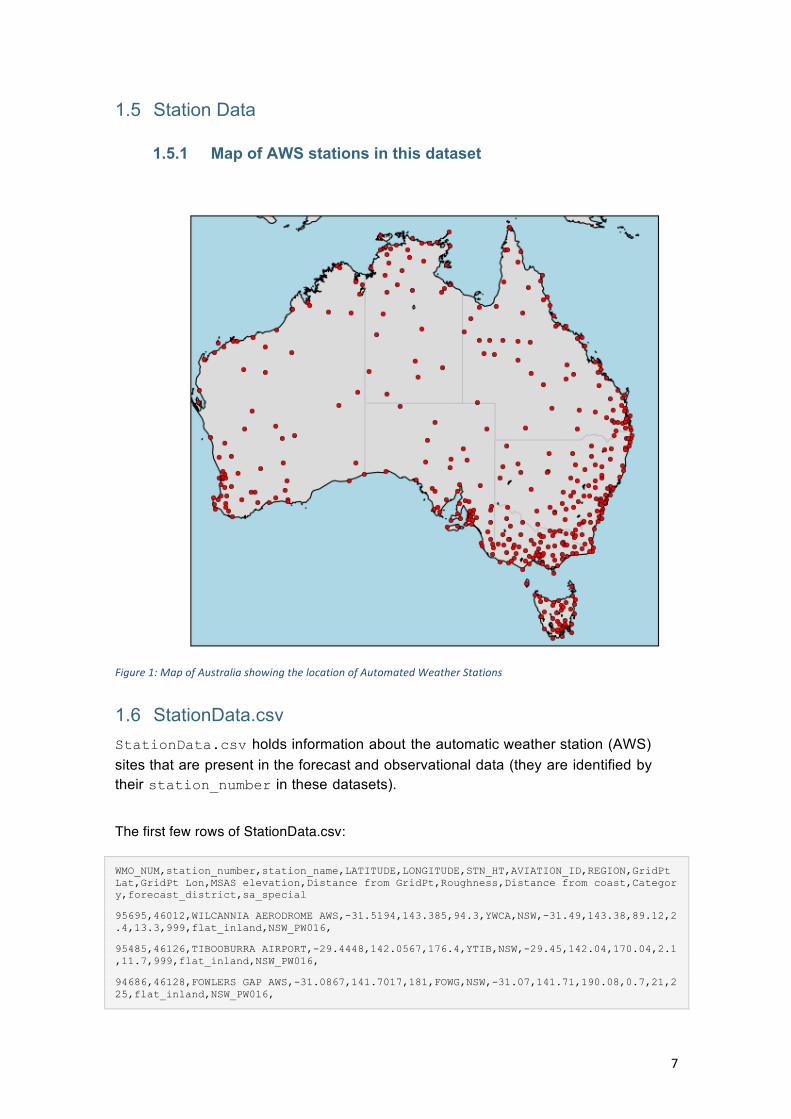
1.1 Example calculation of root-mean-square error
Data points: 72255
No. of stations: 435
# how many stations were matched? print('No. of stations: ', len(se.coords['station_number']))
# how many valid (not NaN) points are there?
print('Data points: ', int(se.count()))
# load the forecast issued on 2015-06-01
fcst_df = pd_read_fcst_csv('fcst/Op_Official_0000_20150601.csv')
# extract the hourly-temperature forecast into an xarray DataArray
fcst = fcst_param_to_xarray(fcst_df, 'T',
indices=['station_number', 'valid_start'])
# this is a 7-day forecast.
# load 7 days of observations to compare against the forecast obs_dfs = [pd_read_obs_csv('obs/obs_hourly_20150601.csv'),
pd_read_obs_csv('obs/obs_hourly_20150602.csv'),
pd_read_obs_csv('obs/obs_hourly_20150603.csv'),
pd_read_obs_csv('obs/obs_hourly_20150604.csv'),
pd_read_obs_csv('obs/obs_hourly_20150605.csv'),
pd_read_obs_csv('obs/obs_hourly_20150606.csv'),
pd_read_obs_csv('obs/obs_hourly_20150607.csv')]
obs_df = pd.concat(obs_dfs)
# extract the hourly-temperature observations into an xarray DataArray
obs = obs_param_to_xarray(obs_df, 'AIR_TEMP')
# calculate squared errors
se = pow(fcst - obs, 2.0)
# calculate root-mean-squared errors averaged over all stations
rmse = pow(se.mean(dim=['station_number']), 0.5)
set of indices can be supplied.
Example:
>>> df = pd_read_obs_csv('obs/obs_hourly_20150501.csv') >>> obs_param_to_xarray(df, 'AIR_TEMP')
"""
if indices is None: indices = ['station_number', 'valid_start']
return dataframe_param_to_xarray(dataframe, param, indices=indices)
14
array(['2015-06-01T00:00:00.000000000+0000'], dtype='datetime64[ns]')
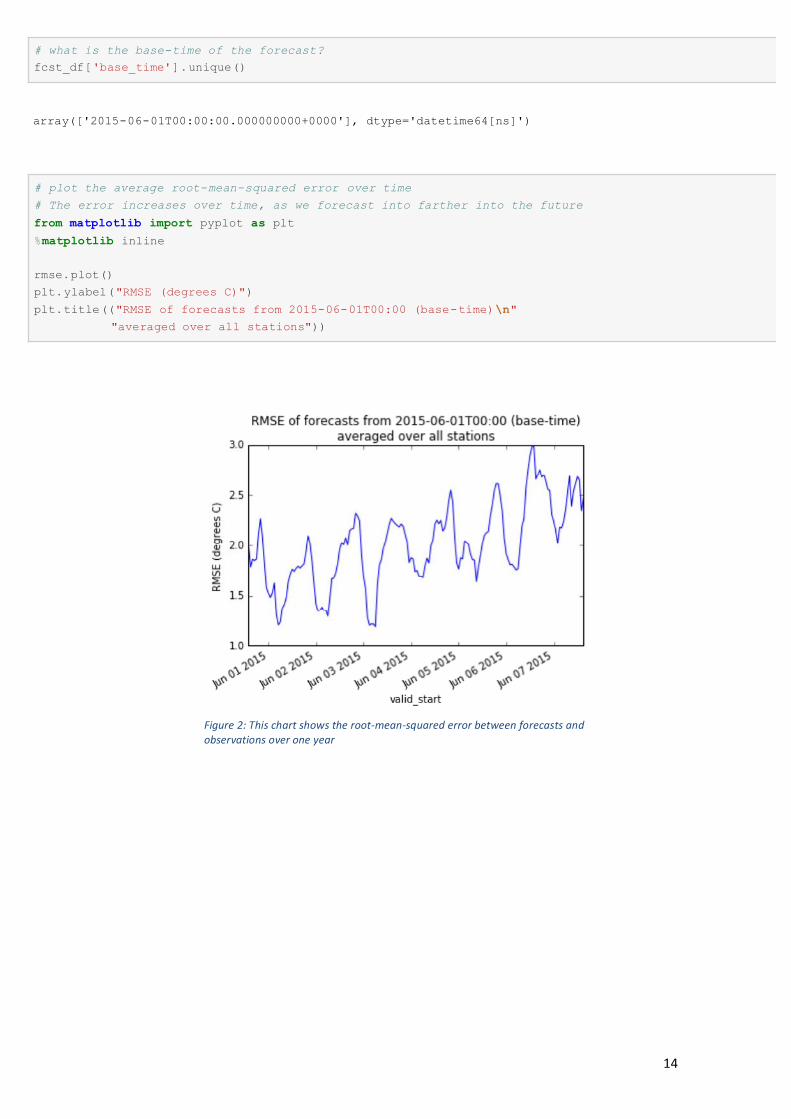
# plot the average root-mean-squared error over time
# The error increases over time, as we forecast into farther into the future
from matplotlib import pyplot as plt
%matplotlib inline
rmse.plot()
plt.ylabel("RMSE (degrees C)")
plt.title(("RMSE of forecasts from 2015-06-01T00:00 (base-time)\n" "averaged over all stations"))
# what is the base-time of the forecast?
fcst_df['base_time'].unique()
Figure2:Thischartshowstheroot-mean-squarederrorbetweenforecastsandobservationsoveroneyear

15
1.11 Copyright and Legal Information This document and the associated data are supplied according to a “CC-BY-SA 4.0” license. The license summary may be found here: https://creativecommons.org/licenses/by-sa/4.0/. The full license text may be found here: https://creativecommons.org/licenses/by-sa/4.0/legalcode. The code samples provided in this document are supplied according to the Apache 2.0 license. The full license text may be found here: https://www.apache.org/licenses/LICENSE-2.0.