Embed Size (px)
Citation preview
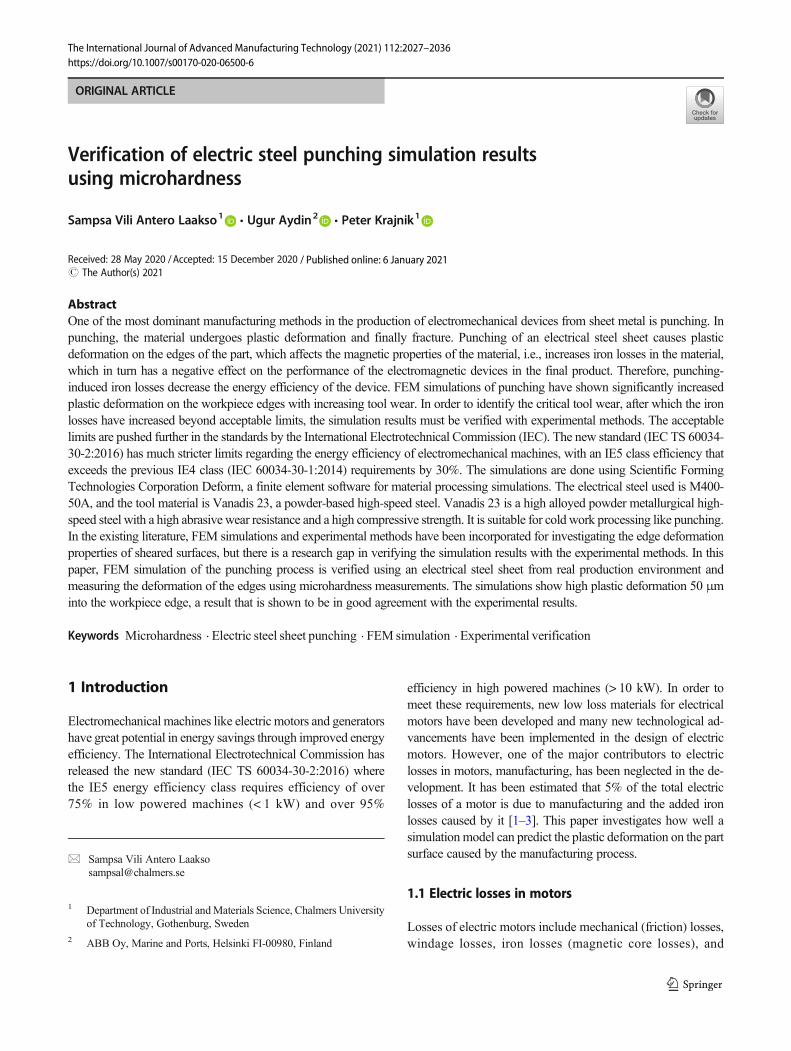
ORIGINAL ARTICLE
Verification of electric steel punching simulation resultsusing microhardness
Sampsa Vili Antero Laakso1& Ugur Aydin2
& Peter Krajnik1
Received: 28 May 2020 /Accepted: 15 December 2020# The Author(s) 2021
AbstractOne of the most dominant manufacturing methods in the production of electromechanical devices from sheet metal is punching. Inpunching, the material undergoes plastic deformation and finally fracture. Punching of an electrical steel sheet causes plasticdeformation on the edges of the part, which affects the magnetic properties of the material, i.e., increases iron losses in the material,which in turn has a negative effect on the performance of the electromagnetic devices in the final product. Therefore, punching-induced iron losses decrease the energy efficiency of the device. FEM simulations of punching have shown significantly increasedplastic deformation on the workpiece edges with increasing tool wear. In order to identify the critical tool wear, after which the ironlosses have increased beyond acceptable limits, the simulation results must be verified with experimental methods. The acceptablelimits are pushed further in the standards by the International Electrotechnical Commission (IEC). The new standard (IEC TS 60034-30-2:2016) has much stricter limits regarding the energy efficiency of electromechanical machines, with an IE5 class efficiency thatexceeds the previous IE4 class (IEC 60034-30-1:2014) requirements by 30%. The simulations are done using Scientific FormingTechnologies Corporation Deform, a finite element software for material processing simulations. The electrical steel used is M400-50A, and the tool material is Vanadis 23, a powder-based high-speed steel. Vanadis 23 is a high alloyed powder metallurgical high-speed steel with a high abrasive wear resistance and a high compressive strength. It is suitable for cold work processing like punching.In the existing literature, FEM simulations and experimental methods have been incorporated for investigating the edge deformationproperties of sheared surfaces, but there is a research gap in verifying the simulation results with the experimental methods. In thispaper, FEM simulation of the punching process is verified using an electrical steel sheet from real production environment andmeasuring the deformation of the edges using microhardness measurements. The simulations show high plastic deformation 50 μminto the workpiece edge, a result that is shown to be in good agreement with the experimental results.
Keywords Microhardness . Electric steel sheet punching . FEM simulation . Experimental verification
1 Introduction
Electromechanical machines like electric motors and generatorshave great potential in energy savings through improved energyefficiency. The International Electrotechnical Commission hasreleased the new standard (IEC TS 60034-30-2:2016) wherethe IE5 energy efficiency class requires efficiency of over75% in low powered machines (< 1 kW) and over 95%
efficiency in high powered machines (> 10 kW). In order tomeet these requirements, new low loss materials for electricalmotors have been developed and many new technological ad-vancements have been implemented in the design of electricmotors. However, one of the major contributors to electriclosses in motors, manufacturing, has been neglected in the de-velopment. It has been estimated that 5% of the total electriclosses of a motor is due to manufacturing and the added ironlosses caused by it [1–3]. This paper investigates how well asimulationmodel can predict the plastic deformation on the partsurface caused by the manufacturing process.
1.1 Electric losses in motors
Losses of electric motors include mechanical (friction) losses,windage losses, iron losses (magnetic core losses), and
* Sampsa Vili Antero [email protected]
1 Department of Industrial andMaterials Science, Chalmers Universityof Technology, Gothenburg, Sweden
2 ABB Oy, Marine and Ports, Helsinki FI-00980, Finland
https://doi.org/10.1007/s00170-020-06500-6
/ Published online: 6 January 2021
The International Journal of Advanced Manufacturing Technology (2021) 112:2027–2036

resistance losses in the stator and in the rotor. Iron losses arecaused by eddy currents and hysteresis in the stator. Ironlosses and resistance losses are increased with increased ma-terial deformation [4–8]. This paper will focus on determiningthe iron losses in stator sheet manufacturing.
1.2 Motor designs for improved energy efficiency
There are some technological advancements in electric motordesigns that improve the energy efficiency. Variable speeddrives, VSD’s, have higher efficiency than induction drivesat lower speeds and do not need to be over-dimensioned.Using optimal flux in lower speed applications reduces ironlosses and winding losses. Iron losses are proportional to mag-netic flux density and frequency. Decreasing frequency de-creases iron losses. Winding losses are proportional to voltageand thus inversely proportional to the square of magnetic flux.In order to maintain constant torque at low speeds, the mag-netic flux can be increased by increasing voltage instead offrequency and thus decreasing also winding losses.
Winding losses can be reduced by increasing the followingindividually or in combination: the winding wire diameter,packing density, and number of turns. All the solutions requireoptimization. Increasing only the wire diameter requires largerstator slots and thus the magnetic flux losses in stator increase.Increasing the wire diameter at the cost of the number of turnsincreases the iron losses with increasingmagnetic flux, but theslot size does not need modification. Increasing wire diameterand stator length decreases winding losses at the cost of
material usage and larger motor. Increasing only the statorlength increases the winding losses, but it is compensated withreduced iron losses. The longer stator reduces heating of themotor and the smaller cooling fans reduce mechanical losses.Joule losses in rotor bars can be decreased by improving theconductivity of the rotor bar material and improving themanufacturing process to minimize manufacturing defects.Mechanical losses can be minimized with good balancing,minimizing friction, and optimizing the cooling fans and fins.Iron losses can be minimized by using better steel laminationmaterials with lower losses. Stress relieving heat treatment canreduce the iron losses in the laminations. Other efficiencyincreasing technologies are different lamination geometries,different winding geometries, different placement of the mag-nets, and using permanent magnets [9].
Regardless of the motor design, decreasing the iron lossesof the lamination steel sheets will improve the efficiency of themotor. Additionally, iron losses are among the major individ-ual contributors to the losses on average with 30% of the totallosses.
1.3 Effect of elastic and plastic deformation on ironlosses
Iron losses are dependent on material stress state and defor-mations. Naumoski et al. [10] investigated six different elec-trical steels under applied load in elastic regimen σϵ[− 80;+100 MPa] using single strip testing setup to measure ironlosses. The steels are designated H/M/L+A based on high,
Fig. 1 Relative losses at differentapplied stresses as in Naumoskiet al. [10]
Fig. 2 Energy loss densities atdifferent stresses, undeformedsample (left) and sample with 1%plastic deformation (right), as inAydin et al. [11]
2028 Int J Adv Manuf Technol (2021) 112:2027–2036

medium, or low alloying content. The second part of the des-ignation is based on the grain side: B/M/S+G for big, medium,or small grain size. The results in Fig. 1 show that stresseshave a major effect on iron losses. Small under 20-MPa tensilestresses decrease the hysteresis losses, but after 20 MPa, thelosses begin to increase. Compressive stresses increased thelosses [10].
Aydin et al. [11] have done similar experiments withplasticly deformed specimen loaded with elastic stresses.The undeformed specimen and specimen with 1% plasticstrain are measured for energy loss density under applied elas-tic stress σϵ[− 30;+100 MPa] shown in Fig. 2. The deformedspecimen shows 73% average increase of energy loss densitycompared to the undeformed sample [11]. This was obtainedat 1% of plastic deformation while in punching, the deforma-tion is 200% or more. It has not yet been investigated howmuch exactly the electric losses change with higher plasticstrains, but they are expected to increase significantly.
1.4 Stator and rotor manufacturing
Stator and rotor plates are cut from a larger roll of electric steelsheet using punching. Punching is a manufacturing processwhere a punching tool with desired part geometry is pushedthrough the workpiece. The workpiece is supported with a die,with reverse geometry of the punch. Theworkpiece is left witha punch shaped hole. In punching, the material undergoesplastic deformation and finally fracture. Li et al. have shownthe strain hardening effect to be a major cause for increasedhardness and deformation on the cut edge of punched sheets
[12]. The plastic deformation on the edges of a part affects themagnetic properties of the material, i.e., increases iron lossesin the material; therefore, alternative methods have been in-vestigated like laser cutting, water jet cutting, and wire EDM[13, 14]. Laser cutting does not leave burr or deformations onthe cut but causes high thermal effects on the cut surface,which have an even higher negative effect on the losses thanplastic deformation [15]. Some manufacturers use laser cut-ting and anneal the products afterwards to mitigate the thermaleffects. Water jet cutting and wire EDM processes are notcapable of competitive production speed, but especiallyEDM leaves the cut surface nearly deformation free.Punching can be done either with large tools and one wholestator/rotor section is cut in one cycle or the section can be cutin segments using multiple cycles, which is the case especiallywith larger stator/rotor diameters. Figure 3 shows differentstator stacking layouts and segment sizes. The layout affectsthe air gap between the segments that affect the flux densityand magnetomotive force. The smaller the air gap, the betteroutput; thus, the uniform cross section is ideal [16].
1.5 Simulation of the punching process
FEM simulations of punching allow to estimate cut surfacequality, tool wear and forces, and the effect of the processparameters, but the quantitative accuracy of the simulationsis strongly dependent on the modeling accuracy of the geom-etry and tool properties, such as the misalignment of the toolor tool deflections [17]. Simulation error can be evaluated bymeasuring the punching force in real process and comparingthat to the simulated punching force [18]. Ghadbeigi et al. [19]used Digital Image Correlation (DIC), optical microscopy,nanohardness measurements, and dislocation density map-ping to investigate the punching-induced deformation on thecut edge of electrical steels in punching. Their results showinteresting behavior with increased punching speed, wherehigher punching speed reduces the deformation. This is in-valuable information for manufacturing of electrical steelproducts, since the speed increases productivity but also de-creases the deformation-induced losses. The results should beapplied carefully however, since the higher cutting speed in-creases the tool wear and therefore increases the losses. Usinghigh punching speeds requires reliable tool wear prediction oronline monitoring of the tool wear to prevent uncontrollabletool wear and subsequent edge deformation. In addition, their
Fig. 3 Different stator stackinglayouts: uniform cross section,60° overlapping “staircase”segments, and 10° coincidentsegments [16]
Table 1 Properties and alloying elements of the M400-50A electricalsteel
Property Value Units
Young’s modulus 200–210 GPa
Yield stress (Rp02) > 280 MPa
Ultimate tensile strength (Rm) > 400 MPa
Hardness (Vickers HV5) 165 HV5
Thermal conductivity at 100 °C 25 W/mK
Density 7700 Kg/m3
Carbon content ≤ 0.005 wt.%
Si + Al content < 2.8 wt.%
2029Int J Adv Manuf Technol (2021) 112:2027–2036

experimental results can be used for verifying the simulationresults of punching processes [19]. Wu et al. [20] used opticalmicrographs and scanning electron microscopy (SEM) tomeasure plastic strain from the sheared edges in punching.Their results show high strains (peak strain at 3 mm/mm) inthe workpiece surface and the strains continue 500μm into theworkpiece, or 31% of the sheet thickness [20]. FEMmodelingcan be used for simulating the effect of tool wear on burrformation [21]. Senn and Liewald [22] investigated two-stage punching to prevent burr formation, using simulationsand experiments. Their results show significant improvementsin reducing the burr on the cut edge, which would be benefi-cial also in stator and rotor sheet manufacturing, since the burrcauses short circuits in the final product and needs to be re-moved [22]. Senn and Liewald and Schenek et al. have alsoinvestigated the slant angle in punching, which shows a majorinfluence on the process especially in damaging the punchingdie due to punch bending of the punch [23, 24]. The shape ofthe cut surface and punching force has been used as the
verification data for simulations and no publications areknown to the authors where plastic strain is measured on thecut surface and compared against the simulated results.
2 Materials and methods
2.1 M400-50A electrical steel
Electrical steels are defined in DIN EN 10106 standard to0.35, 0.5, 0.65, and 1.0 mm thicknesses. This paper investi-gates M400-50A electrical steel. The M400-50A designationreads as M for magnetizing steel with maximum iron losses of4 W/kg (400), 50 for a thickness of 0.5 mm, and A for non-oriented grains. M400-50A is alloyed with Si and Al, and theproperties of the material are given in Table 1. Figure 4 showsthe tensile testing results of the materials in the rolling direc-tion and orthogonal to the rolling direction.
Fig. 4 Tensile testing in therolling direction and orthogonalto the rolling direction, and theJohnson-Cook model fit
Fig. 5 Simulation setup and tool edge geometries
2030 Int J Adv Manuf Technol (2021) 112:2027–2036

2.2 Punching
The punching experiments are done with Müller WeingartenNKA 8-2 groove broaching machine with 80-kN pressingforce and punching cycle frequency of 400–1300 1/min. Thetool cuts a rotor groove with punchline length 157.5 mm. Thetool material is powder-based high-speed steel Vanadis 23.
2.3 FEM simulations
The simulations are done with Scientific FormingTechnologies Corporation Deform FEM software. Deformuses an updated Lagrangian formulation and a quasi-staticimplicit solver. Linear quadrature elements with four integra-tion points are used. The model is an axisymmetric 2D simu-lation of punching a circular hole. The circumference of thepunch is matched with the circumference of the real punchingtool (157.5 mm) since the punching line length correlates withthe punching force rather than with the punching area.Therefore, the radius of the simulated punch is 25 mm. Thesimulation setup and tool edge geometries are shown in Fig. 5.The punch is modeled both rigid and elastic to evaluate theeffect on modeling accuracy. Three different tool geometriesare used, new tool, worn tool #1, and worn tool #2. The work-piece is meshed with 13,099 square elements. The elementsize in the shear zone is 12μm. The tool whenmodeled elastic
has 5040 square elements. The elements are linear quadratureswith four integration points. Friction in all contacts isCoulomb friction with friction coefficient 0.5. The simulationtime step is 2 · 10−5 s. The solver is Sparse solver that is thedefault in Deform, and time integration is done using theNewton-Raphson iteration scheme.
The flow stress behavior of the material is modeled usingthe Johnson-Cook material model (Eq. 1) [25] because it iscommonly used in the field. The Cockcroft-Latham failuremodel (Eq. 2) [26] is used for modeling the brittle behaviorof the material. The Cockcroft-Latham model was selecteddue to its simplicity. The parameters for the models are ac-quired through tensile testing and using digital image correla-tion with shear testing. Thermal softening behavior is not crit-ical in punching since the cutting temperature does not elevatemuch over the room temperature. Therefore, the material is setto soften linearly until the melting temperature. The strainhardening coefficient was inversely determined to fit experi-mental results. The modeling details are explained further inLaakso et al. [3]. The parameters for the Johnson-Cook modelare given in Table 2, and the Cockcroft-Latham critical valueCcrit was determined to be 400. The fit of the Johnson-Cookmodel is shown in Fig. 4. The Cockcroft-Latham model isused together with element deletion, which is known to causesome loss of resolution near the damaged layer caused by theremoved elements. The lost resolution is not considered to be
Table 2 Johnson-Cook parameters
A [MPa] B [MPa] C n m ε̇ref [s−1] Troom [°C] Tmelt [°C]
290.4 619.5 0.001 0.478 1 0.01 20 1500
Fig. 6 Cross sections of thepunched workpiece mounted inresin (top left) and polished formicrohardness testing withStruers DuraScan-70. Themicrohardness indentation matrixshown in the bottom left
2031Int J Adv Manuf Technol (2021) 112:2027–2036
a major concern since the element size was small in the shearzone. There is, however, some loss of accuracy as the ele-ments in the shear zone with the highest plastic strains areremoved. Therefore, the simulation will predict the maximumstrain slightly lower than in reality.
σ ¼ Aþ Bεnð Þ 1þ Clnε̇
ε̇ref
!" #1−
T−T room
Tmelt−T room
� �m� �ð1Þ
where A is the yield equivalent, B is the strain hardening mul-tiplier, n is the strain hardening exponent, m is the thermal
softening exponent, ε is the strain, ε̇ is the strain rate, T istemperature, Troom is the reference temperature, and Tmelt isthe melting temperature.
Ccrit ¼ ∫εσ*dε ð2Þwhere σ* = maximum principal stress and Ccrit = criticalvalue.
2.4 Microhardness testing and prediction of strain
The microhardness testing is done with Struers hardness testerDuraScan-70 G5. Testing is done with HV0.005 Vickers loadwith 12 × 12 grid in 40-μm increments. The total number ofmeasuring points is 144, including 9 excluded measuringpoints that were either too close to the edge or the indentationmark was not clear. The samples were cut from the workpieceusing wire EDM and then mounted to Struers Polyfast resin,polished, and cleaned for microhardness testing. The mountedsamples, the microhardness measuring setup, and the indenta-tion matrix are shown in Fig. 6. Sonmez and Demir testeddifferent analytical expression between Vickers hardness andplastic strain [27]. The model used in the paper, by Tabor and
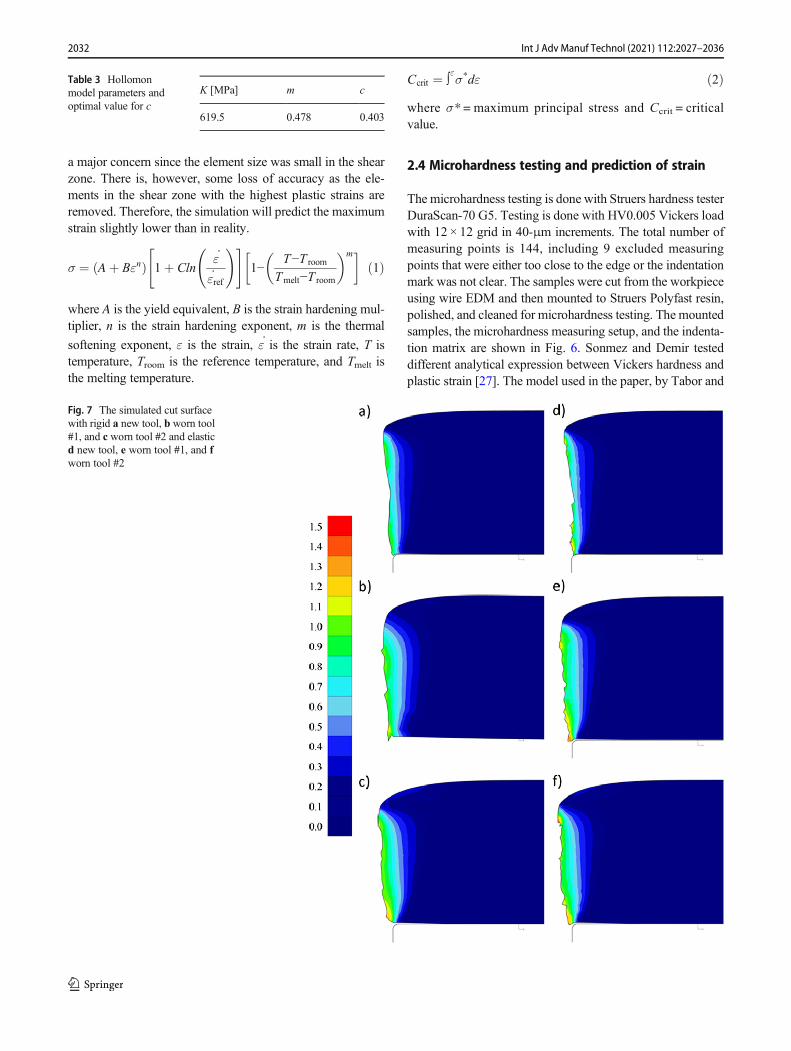
Fig. 7 The simulated cut surfacewith rigid a new tool, b worn tool#1, and c worn tool #2 and elasticd new tool, e worn tool #1, and fworn tool #2
Table 3 Hollomonmodel parameters andoptimal value for c
K [MPa] m c
619.5 0.478 0.403
2032 Int J Adv Manuf Technol (2021) 112:2027–2036

Taylor [28] (Eq. 3), is in relatively good agreement with themeasured harnesses with an average error of 15.7% based onexperiments done by Sonmez and Demir. The model is basedon the Hollomon model [29] for strain hardening materialsshown in Eq. 4 and the definition of Vickers hardness.
HV ¼ cK ε0 þ εeð Þm ð3Þσ ¼ Kεm ð4Þwhere HV is the Vickers hardness, c is the experimentallydetermined multiplier, ε0 is the initial strain, εe is the repre-sentative strain, m is the strain hardening exponent, and K isthe yield strength equivalent. The value for parameter c isdetermined inversely from the hardness data, usingFig. 8 Plot directions
Fig. 9 Strain distributions in depth and height directions, rigid tool up, and elastic tool down
2033Int J Adv Manuf Technol (2021) 112:2027–2036

Levenberg-Marquardt [30, 31] method while minimizing theerror between measured and predicted HV. The values arepresented in Table 3.
3 Results
3.1 Simulation results
Simulation results show a clear effect of tool wear on cutsurface deformations and surface shape. The plastic deforma-tion is increased significantly with the worn tool (Fig. 7). Thedeformation of the cut surface is evaluated using Von Misestotal strain plotted in the directions shown in Fig. 8. The cutsurfaces and plastic strains are shown in Fig. 7 and the plottedvalues in Fig. 9. Whether the tool was modeled rigid or elastichad no major impact on simulation outputs, which can be seenin Figs. 7 and 9.
3.2 Microhardness testing results
Microhardness results plotted on the surface cross-section areashow that the material deformation is the strongest on the50-μm-wide deformation zone, after which the deformationis gradually leveling to the stock material values at 300 μm.Figure 10 shows the measured microhardness. The averagestandard deviation of the microhardness measurements was17%. The simulations are in good agreement with the micro-hardness results, as shown in Fig. 11. Third-order polynomialregression of the hardness was used to plot the values at H =0.25 mm. The total average error of the simulated hardness
compared to measured hardness is 2.9%. Regardless of theexcellent fit, the results must be evaluated in a qualitativemanner, since there is still unknown uncertainty on convertingthe microhardness values to plastic strain values, that wouldrequire more explicit measurements to determine the accuracyof the strain-hardness conversion.
4 Discussion
The simulations show significant plastic deformation on thecutting plane of electric steel sheets for rotor assembly causedby the punching process. It was also shown that increasingtool wear increases the deformations of the cut surface. The
Fig. 10 Microhardness results of the cutting plane cross section, grids in mm and hardness in Vickers
Fig. 11 Comparison of simulated hardness to measured hardness andregression results
2034 Int J Adv Manuf Technol (2021) 112:2027–2036
plastic deformation has been shown to increase the iron lossesin the cut edges of stator and rotor by ~ 70% with a strainincrease of 1% by Aydin et al. [11]. Therefore, controllingthe punching process and tool wear is of uttermost importancein manufacturing highest energy efficiency IE5 class electro-mechanical devices. The simulations are in good comparisonwith the experimental results, with an average error of 2.9%.There was no major effect whether the tool was modeled rigidor elastic. This is an effect of relatively small loads acting onthe tool in punching, compared to for example turning, wheretool models have been observed to affect the simulations. Thefollowing conclusions can be made:
1. The simulations provide meaningful and accurate resultsand can be used for optimizing the punching process re-garding the cut edge deformations and to determine thecritical wear.
2. Based on the results of this investigation and reviewedresults from the existing research literature, thepunching-induced strains and subsequent losses can beminimized by increasing punching speed and minimizingtool wear by either changing the tool frequently orselecting a more wear-resistant tool material grade.
5 Future work
The research will continue regarding tool wear modeling anddetermination of the critical wear of the punching tool, afterwhich the workpiece surface deformations are higher than theacceptable limits for energy efficiency standards for rotatingelectrical machinery. Another improvement of the method isrequired related to the microhardness results, which need to bemapped to verified strain values measured during tensile test-ing, in order to have a quantitative evaluation of thedeformations.
Author contributions Dr. Sampsa Laakso has done the simulations, ex-periments, analysis of the results, and writing of the paper.
Dr. Ugur Aydin provided expertise on iron losses and loss measure-ments for the material.
Professor Peter Krajnik was responsible for the quality control andprovided the facilities and environment for the work.
Funding Open Access funding provided by Chalmers University ofTechnology.
Data availability All data is published with the paper.
Compliance with ethical standards
Conflict of interest The authors declare that there are no conflicts ofinterest.
Ethical approval This work does not contain any ethical issues or per-sonal information.
Consent to participate No human or animal was involved in this work;thus, no consent was required.
Consent to publish All authors have given their permission for publish-ing this work.
Code availability The simulation software Deform 12.0 is a commer-cially licensed product of Scientific Forming Technologies Corporation.
Open Access This article is licensed under a Creative CommonsAttribution 4.0 International License, which permits use, sharing, adap-tation, distribution and reproduction in any medium or format, as long asyou give appropriate credit to the original author(s) and the source, pro-vide a link to the Creative Commons licence, and indicate if changes weremade. The images or other third party material in this article are includedin the article's Creative Commons licence, unless indicated otherwise in acredit line to the material. If material is not included in the article'sCreative Commons licence and your intended use is not permitted bystatutory regulation or exceeds the permitted use, you will need to obtainpermission directly from the copyright holder. To view a copy of thislicence, visit http://creativecommons.org/licenses/by/4.0/.
References
1. Holopainen TP, Rasilo P, Arkkio A (2016) Identification of mag-netic properties for cutting edge of electrical steel sheets. In: 2016XXII Int. Conf. Electr. Mach. pp 1783–1787. https://doi.org/10.1109/ICELMACH.2016.7732765
2. Rasilo P, Aydin U, Holopainen TP, Arkkio A (2016) Analysis ofiron losses on the cutting edges of induction motor core lamina-tions. In: 2016XXII Int. Conf. Electr. Mach. pp 1312–1317. https://doi.org/10.1109/ICELMACH.2016.7732694
3. Laakso SVA, Väänänen A, Bossuyt S, Arkkio A (2018) Dull punchline is not a joke – worn cutting edge causes higher iron losses inelectrical steel piercing. Robot Comput Integr Manuf. https://doi.org/10.1016/j.rcim.2018.03.006
4. Bertotti G (1988) General properties of power losses in soft ferro-magnetic materials. IEEE Trans Magn 24:621–630
5. Bertotti G (1998) Hysteresis in magnetism: for physicists, materialsscientists, and engineers. Elsevier Science https://books.google.se/books?id=B7xZctzCPfgC. Accessed 24 May 2020
6. Bertotti G (1985) Physical interpretation of eddy current losses inferromagnetic materials. II. Analysis of experimental results. J ApplPhys 57:2118–2126. https://doi.org/10.1063/1.334405
7. Krings A (2014) Iron losses in electrical machines-influence ofmaterial properties, manufacturing processes, and inverter opera-tion. KTH Royal Institute of Technology
8. Serpico C, Visone C, Mayergoyz ID, Basso V, Miano G (2000)Eddy current losses in ferromagnetic laminations. J Appl Phys 87:6923–6925. https://doi.org/10.1063/1.372887
9. Lukaszczyk M (2014) Improving efficiency in electric motors.World Pumps 2014:34–41. https://doi.org/10.1016/S0262-1762(14)70080-X
10. Naumoski H, Maucher A, Herr U (2015) Investigation of the influ-ence of global stresses and strains on the magnetic properties ofelectrical steels with varying alloying content and grain size. In:2015 5th Int. Electr. Drives Prod. Conf. pp 1–8. https://doi.org/10.1109/EDPC.2015.7323206
2035Int J Adv Manuf Technol (2021) 112:2027–2036
11. Aydin U, Rasilo P, Martin F, Belahcen A, Kouhia R, Daniel L,Arkkio A (2019) Effect of simultaneous plastic and elastic defor-mation on magnetic properties of electrical steel sheets. In: 64thAnnu. Conf. Magn. Magn. Mater., AIP Publishing, LLC and theIEEE Magnetics Society, Las Vegas. p 442. https://magnetism.org/storage/app/media/docs/2019MMMFinalAbstractBook20191028.pdf. Accessed 24 May 2020
12. Li JH, Fan WF, Zhang ZM (2010) Study on work hardening per-formance of pure shearing fine-blanking with negative clearance forASTM-Gr. D and ASTM-1022 Steel. In: Adv. Mater. Res. pp 145–148
13. Schoppa A, Louis H, Pude F, von Rad C (2003) Influence of abra-sive waterjet cutting on the magnetic properties of non-orientedelectrical steels. J Magn Magn Mater 254–255:370–372. https://doi.org/10.1016/S0304-8853(02)00882-X
14. Scutaru G (2015) The effect of mechanical and electrical dischargecutting technologies on the magnetic properties of non-orienteds i l i con i ron s tee l s . Rev Roum Des Sc i Tech - Se rÉlectrotechnique Énergétique 60:59–68
15. Siebert R, Schneider J, Beyer E (2014) Laser cutting and mechan-ical cutting of electrical steels and its effect on the magnetic prop-erties. IEEE Trans Magn 50:1–4. https://doi.org/10.1109/TMAG.2013.2285256
16. Fyhr P (2018) Electromobility: materials and manufacturing eco-nomics. Division of Production and Materials Engineering, LundUniversity
17. Altan Taylan TAE (2012) Sheet metal forming. ASM Internationalhttp://app.knovel.com/hotlink/toc/id:kpSMFPA001/sheet-metal-forming-processes-2/sheet-metal-forming-processes-2. Accessed24 May 2020
18. Hambli R, Potiron A (2000) Finite element modeling of sheet-metalblanking operations with experimental verification. J Mater ProcessTechnol 102:257–265. https://doi.org/10.1016/S0924-0136(00)00496-9
19. Ghadbeigi H, Al-Rubaye A, Robinson FCJ, Hawezy D, Birosca S,Atallah K (2020) Blanking induced damage in thin 3.2% siliconsteel sheets. Prod Eng 14:53–64. https://doi.org/10.1007/s11740-019-00931-1
20. Wu X, Bahmanpour H, Schmid K (2012) Characterization of me-chanically sheared edges of dual phase steels. J Mater Process
Technol 212:1209–1224. https://doi.org/10.1016/j.jmatprotec.2012.01.006
21. Hambli R, Soulat D, Chamekh A (2009) Finite element predictionof blanking tool cost caused by wear. Int J Adv Manuf Technol 44:648–656. https://doi.org/10.1007/s00170-008-1859-9
22. Senn S, Liewald M (2019) A method for producing burr-free shear-ing surfaces to increase part quality through two-stage counter-cut-ting. AIP Conf Proc 2113:80014. https://doi.org/10.1063/1.5112622
23. Senn S, Liewald M (2017) Experimental investigation of piercingof high-strength steels within a critical range of slant angle. J PhysConf Ser 896:12099. https://doi.org/10.1088/1742-6596/896/1/012099
24. Schenek A, Liewald M, Senn S (2019) Identification of processlimits for punching with a slant angle. IOP Conf Ser Mater SciEng 651:12066. https://doi.org/10.1088/1757-899x/651/1/012066
25. Johnson GR, Cook WH (1983) A constitutive model and data formetals subjected to large strains, high strain rates and high temper-atures. In: Proc. 7th Int. Symp. Ballist. pp 541–547
26. Cockcroft MG, Latham DJ (1968) Ductility and the workability ofmetals. J Inst Met 96:33–39
27. Sonmez FO, Demir A (2007) Analytical relations between hardnessand strain for cold formed parts. J Mater Process Technol 186:163–173. https://doi.org/10.1016/j.jmatprotec.2006.12.031
28. Tabor D, Taylor GI (1948) A simple theory of static and dynamichardness. Proc R Soc London Ser A Math Phys Sci 192:247–274.https://doi.org/10.1098/rspa.1948.0008
29. Hollomon JH (1945) Tensile deformation. Am Inst MinMetall EngMet Technol Technical_ 1–22
30. Levenberg K (1944) Amethod for the solution of certain non-linearproblems in least squares. Q Appl Math 2:164–168
31. Marquardt D (1963) An algorithm for least-squares estimation ofnonlinear parameters. J Soc Ind ApplMath 11:431–441. https://doi.org/10.1137/0111030
Publisher’s note Springer Nature remains neutral with regard to jurisdic-tional claims in published maps and institutional affiliations.
2036 Int J Adv Manuf Technol (2021) 112:2027–2036


![[NCKU] Simulation and Verification with Altera FPGA](https://img.pdfslide.net/doc/110x75/55295cbf550346522e8b4745/ncku-simulation-and-verification-with-altera-fpga.jpg)