Embed Size (px)
Citation preview

This is a repository copy of Verification of Mountain Weather Information Service forecastsfor three upland areas in the UK..
White Rose Research Online URL for this paper:http://eprints.whiterose.ac.uk/85894/
Version: Accepted Version
Article:
Procter, N, Birch, CE, Monk, G et al. (1 more author) (2014) Verification of Mountain Weather Information Service forecasts for three upland areas in the UK. Weather, 69 (12). 342 - 349. ISSN 0043-1656
https://doi.org/10.1002/wea.2314
[email protected]://eprints.whiterose.ac.uk/
Reuse
Unless indicated otherwise, fulltext items are protected by copyright with all rights reserved. The copyright exception in section 29 of the Copyright, Designs and Patents Act 1988 allows the making of a single copy solely for the purpose of non-commercial research or private study within the limits of fair dealing. The publisher or other rights-holder may allow further reproduction and re-use of this version - refer to the White Rose Research Online record for this item. Where records identify the publisher as the copyright holder, users can verify any specific terms of use on the publisher’s website.
Takedown
If you consider content in White Rose Research Online to be in breach of UK law, please notify us by emailing [email protected] including the URL of the record and the reason for the withdrawal request.

For Peer Review
�
�
�
�
�
�������������� ����������������������������
������������������ ���������������������
�
�������� ��������
������ ������ ���������������
� ������������ �������� ������������ ����
����� �!" ���#�!������������� �$��
%�"������& ����'��������� (������)�*�����+�,� -��� ����'�&��#�)� �������'���������#���- ���"����. ���)�%������+�,� -��� ����'�&��#�)� �������'���������#���- ���"������/)�0��''���+�1�����������%�����)������ ������������'��"�� ��� ��- ��������")�����+�,� -��� ����'�&��#�)�*�� �����%������'�����"������ �� � �����
2��3��#�� ����� ��3������)���������'������� �4)�5��������-�� ' ��� ���
��
�
�
http://mc.manuscriptcentral.com/weather
Weather

For Peer Review
Verification of Mountain Weather Information Service forecasts for three upland areas in the UK
N. Procter1, C. E. Birch
1, G. Monk
2, J. H. Marsham
1
1School of Earth and Environment, University of Leeds, UK
2Mountain Weather Information Service, Dumfries and Galloway, UK
Correspondence to: Dr Cathryn Birch, School of Earth and Environment, University of Leeds, Leeds,
LS2 9JT, UK, [email protected]
1 Introduction
UK mountains pose a particular forecast challenge; the proximity of all the upland regions to a
coastline produces localised and complex weather, which is difficult to forecast. Conditions in the
mountains can be vastly different from neighbouring low-lying regions and the severity of the
weather often surprises people, given the fairly low altitude of the hills and the relatively mild British
weather. The location of the UK in the mid-latitude storm track means the weather can change
quickly, from calm and beautiful (e.g. Figure 1) to severe conditions, sometimes within only a few
hours.
The Mountain Weather Information Service (MWIS) provides daily weather forecasts for eight
upland regions of the UK: Northwest Highlands, West Highlands, Cairngorms National Park and
Monadhliath, Southeastern Highlands, Southern Uplands, Lake District, Snowdonia National Park,
and Peak District and Yorkshire Dales (http://www.mwis.org.uk). MWIS is run by a small team,
headed by Geoffrey Monk, who combine freely available model products from the UK, US and
Canadian national weather services and the European Centre for Medium-Range Weather Forecasts
with their knowledge and experience of complex mountain weather conditions to create the
mountain forecasts. Until now MWIS have had little opportunity to verify their forecasts against
Page 1 of 26
http://mc.manuscriptcentral.com/weather
Weather
123456789101112131415161718192021222324252627282930313233343536373839404142434445464748495051525354555657585960
For Peer Review
observations. Through collaboration between MWIS and the University of Leeds this study uses
publically available observations from automatic weather stations (AWS) located in upland areas to
evaluate forecasts from three of the regions.
MWIS was established between 2002 and 2005 from a small office in Dumfries and Galloway. Prior
to this mountain forecasts were only accessible from the UK Met Office via premium rate fax and
telephone lines. Having an interest in mountain forecasting, Geoff surveyed the requirements of the
mountain user community and MWIS was then established after a long trial of forecasts for a limited
area of the West Highlands. The forecasts are specifically tailored to the users’ needs and are set out
in a way that effectively communicates the potential dangers by, for example, placing wind speed at
the top of the forecast and giving the likely effect of that particular speed on a hill-walker. Since
October 2007 Sportscotland, the national agency for sport in Scotland, have fully funded the
provision of the Scottish forecasts, however the English and Welsh forecasts remain without funding
and the additional operational costs of the website are covered by commercial sponsorship. The
forecasts may now be viewed by as many as two million people every year.
In this paper, the relative accuracy and consistency of the 1, 2 and 3-day MWIS forecasts are
analysed, and an assessment of improvements in the forecast performance between 2006 and 2012
is made. The forecasting of high-wind speed and low-temperature events is investigated further, and
finally two case studies are presented, which highlight reasons for some of the larger forecast errors.
2 Forecasts and observations
Each MWIS forecast consists of two A4 pages. The first page presents a summary of the general
conditions followed by a more detailed forecast, which includes sections describing how windy, wet,
cloudy, hazy and cold the day is expected to be. Numeric values for temperature and wind speed are
given, as well as qualitative descriptions of temporal and spatial variations and, when appropriate,
the possibility of more severe conditions is highlighted (see example in Table 1). The second page
Page 2 of 26
http://mc.manuscriptcentral.com/weather
Weather
123456789101112131415161718192021222324252627282930313233343536373839404142434445464748495051525354555657585960

For Peer Review
looks ahead to the following two days, with brief entries for the same sections. The forecasts for
Scottish regions specify wind and temperature values at an altitude of 900m, and for the Lake
District at an altitude of 750m.
Observations from AWSs located on or close to the top of hills, were used to verify the forecasts
from three of the eight regions. Data are recorded hourly by the stations and include wind direction,
wind speed, temperature, dew point temperature and highest gust speed in the last hour. The Lake
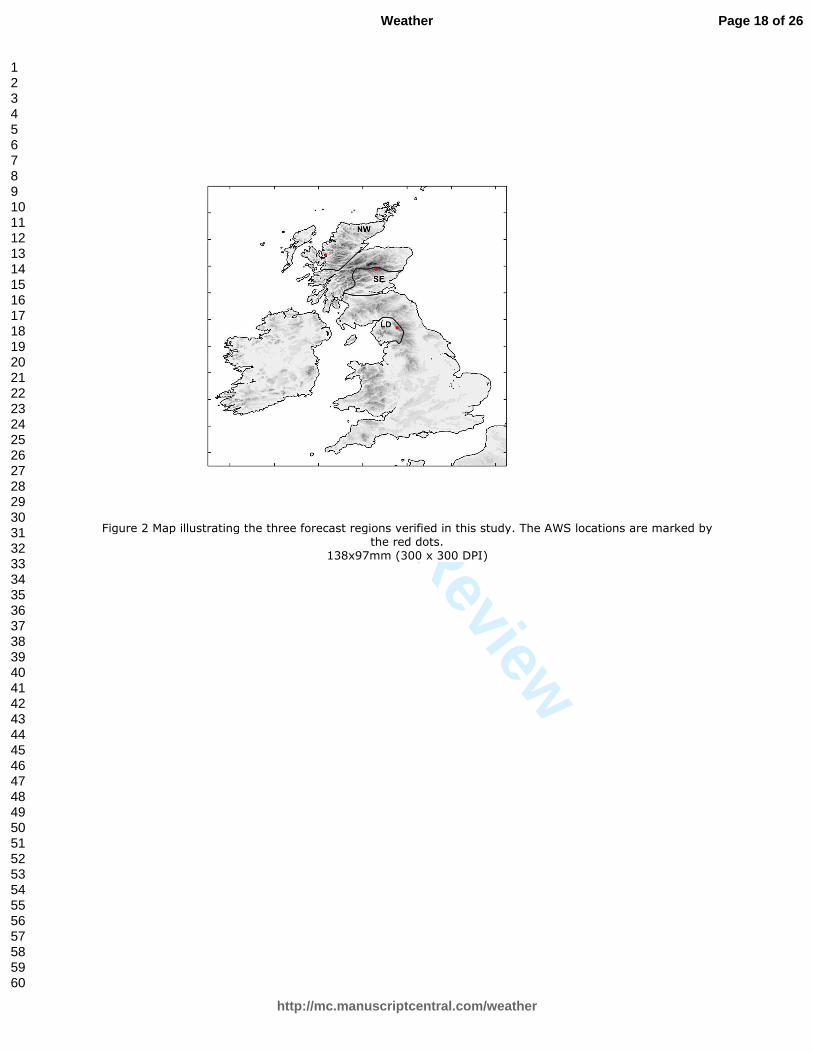
District (LD) was chosen as a region to be verified due to the large number of walkers it attracts. An
AWS at Great Dun Fell (Figure 2) provided the observational data against which to verify the
forecasts. The Northwest Highlands (NW) was chosen due to its frequency of severe weather, with
an AWS at Bealach-na-ba providing the observational data. Neither Great Dun Fell AWS (847m) nor
Bealach-na-ba AWS (773m) match the 750 and 900m forecasting altitudes closely. The region of
Southeastern Highlands (SE), with data from an AWS at Cairnwell (933m), was therefore selected as
the third region for verification specifically because the AWS-forecast height difference is small
(33m).
3 Method
Verification was only possible for aspects of the forecasts that provide a numerical value and thus
the study focuses on wind and temperature, which are also two of the key variables for mountain
safety. Attempts to verify the ‘chance of summits in cloud’ forecasts by comparison with
temperature and dew point temperature proved unsuccessful, perhaps due to unreliable dew point
measurements and are thus not presented here. The forecasts describe the expected conditions ‘for
the day’; with the emphasis on the middle of the day because this is the time users tend to be out on
the hills. The observation recorded at midday is used to verify the forecast but if conditions are
predicted to change considerably over the day a range of values is given in the forecast description
and for the analysis a midday estimate is determined by interpreting the wording of the forecast.
Day one (d+1) values are verified for both 2006 and 2012 and additionally, day two (d+2) and day
Page 3 of 26
http://mc.manuscriptcentral.com/weather
Weather
123456789101112131415161718192021222324252627282930313233343536373839404142434445464748495051525354555657585960
For Peer Review
three (d+3) are verified for 2006. It is necessary to be aware of the limitations of using a point
measurement to verify daily forecasts for a large region of complex terrain during the analysis.
Three statistical measures were used to compare the relationship between forecast and
observation. Root mean square error (RMSE) is a measure of dispersion from the one-to-one
(perfect forecast) line – a low value indicates generally accurate forecasts. Another measure used is
the least squares regression, or best-fit line; a gradient of close to 1 and an intercept close to 0 is
desirable. Pearson’s correlation coefficient (PCC) is a measure of linear correlation; an absolute value
close to one indicates highly consistent, but not necessarily accurate, forecasts. For example, the
data in Figure 4a could be well correlated along the regression line (red) but the regression line may
not be equal to the one-to-one line (black).
Correct forecasting of very cold or very windy conditions is especially important as these are
particularly dangerous conditions. These events were defined as freezing temperatures (�0 °C) or
wind speeds equal to or greater than 40 mph since these values represented thresholds beyond
which weather becomes significantly more hazardous. The performance of forecasting these events
was examined through contingency tables.
4 Statistical assessment of forecast error
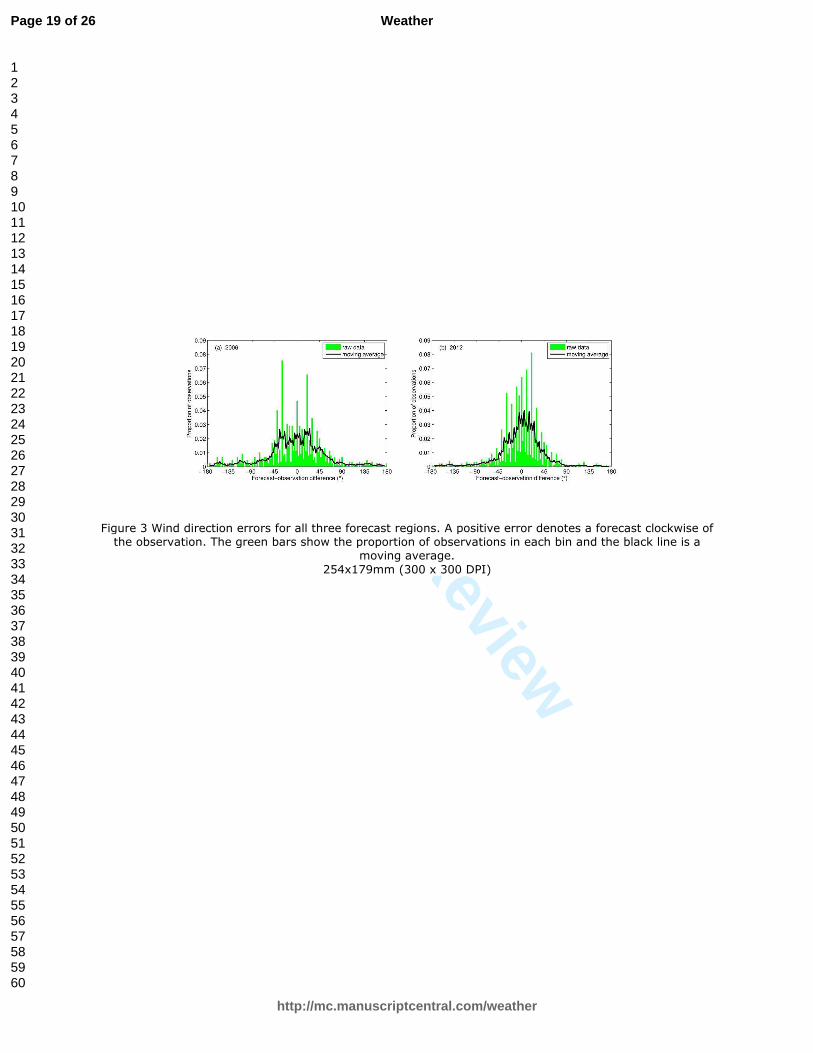
Data from the three sites are combined in Figure 3 to present the study results for forecasting
accuracy of d+1 wind direction. The plots show the difference between forecast and observation as a
proportion of total days for each year. Both years’ forecasts are generally accurate with the majority
of forecast wind directions close to the observed value: the percentage of forecasts that are within
45°of the true wind direction improves between the two years, increasing from 69% for 2006 to 82%
for 2012. Neither year shows significant asymmetry about 0°, demonstrating that the forecast is
equally likely to be anticlockwise or clockwise of the true direction. Separate plots for each region
Page 4 of 26
http://mc.manuscriptcentral.com/weather
Weather
123456789101112131415161718192021222324252627282930313233343536373839404142434445464748495051525354555657585960

For Peer Review
indicate that all three regions improved, with the level of improvement greatest for SE and least for
NW (not shown).
As an example, Figure 4 shows the d+1 observation-forecast scatterplots for temperature and wind
speed against the ‘perfect forecast’ one-to-one line for the SE region. The d+1 observation-forecast
scatterplots for wind speed indicate similar results for NW and LD (not shown). Statistics for all three
regions are shown in Table 2. The scatterplots indicate a good degree of overall consistency with
most winds speeds being accurately forecast (e.g. PCC=0.8 for 2012) and improvement between
2006 and 2012 is evident for all three regions. For LD and SE the gradient of the line of best-fit
increases toward 1, the intercept decreases toward zero, and both the RMSE and PCC improve. For
NW the gradient, intercept and PCC improve but the RMSE is almost unchanged – in fact it increases
by 0.016mph. The improved PCC (which is unaffected by bias) for each region indicates more
consistent forecasts, but there is some evidence of systematic bias. LD data displays a general trend
of under-forecasting wind speed, consistent with the forecast being for a lower altitude than the
observation, although this bias was reduced between 2006 and 2012. NW data shows little bias in
the 2006 forecasts, but in 2012 a tendency to over-forecast was evident (consistent with the
forecast being for a higher altitude than the observation). SE forecasts, where the observation-
forecast height difference was only 33 m, displayed no obvious bias in either year.
Temperature d+1 scatterplots for all three regions and both years demonstrated accurate forecasts
although again differences are to be expected due to the differences between the altitudes of AWS
observations and the altitude of the forecast. Points on the NW plot tend to lie to the right of the
one-to–one line because the observation altitude is lower than the forecast altitude and to the left
on the LD plot because the observations altitude is higher than the forecast altitude. There was no
clear bias for the SE where the AWS is only 33m above the forecast altitude of 900m. All three
regions produced very high PCCs in both years (around 0.95) and showed reductions in the RMSE of
5.4% (LD), 8.8% (NW) and 8.5% (SE) from 2006 to 2012 respectively. All six lines of best-fit are also
Page 5 of 26
http://mc.manuscriptcentral.com/weather
Weather
123456789101112131415161718192021222324252627282930313233343536373839404142434445464748495051525354555657585960

For Peer Review
close to the one-to-one line, although the gradient for each of the three regions decreases away
from 1 between 2006 and 2012 by 0.11 (LD), 0.10 (NW) and 0.07 (SE) respectively. The shallower
2012 gradients are partly explained by under-predictions of high temperatures during the heat wave
at the end of May in that year (see case study below). If the last 11 days of May are removed from
the data, the three best-fit line gradients increase by 0.031 (LD), 0.029 (NW) and 0.027 (SE)
respectively.
Hill-walkers and mountaineers often make the decision to travel to an upland region two or three
days in advance, hence the quality of the two and three-day forecasts is important. Table 2 also
shows the 2006 statistics for the two (d+2) and three (d+3) day forecasts. As is to be expected for all
three regions the PCC, RMSE and gradient worsen for the longer range forecasts of both wind speed
and temperature. However the deterioration is by no means severe (e.g. PCC decreases by less than
0.1 between d1 and 3 for all three regions for both wind speed and temperature).
The contingency tables shown in Table 3 combine the results for all three regions and examine the
forecast accuracy of high wind speed (≥40 mph) and low temperature (≤0 °C) events Each day is
assigned to one of four categories: hits (correct predictions of events), false alarms (predictions of
events which are incorrect), misses (observed events which are not forecast), or correct predictions
of the non-occurrence of events. a, b, c and d are the percentages of days which fall into each
respective category. Furthermore a+b is the total percentage of days that are forecast as high wind
speeds/low temperature events, so a/(a+b) is the ‘Proportion of Forecasts of Events that are Correct’
(denoted PFEC), which can be interpreted as the probability that an event will occur given that it is
forecast. Similarly a+c is the total percentage of days that are observed as events, so a/(a+c) is the
‘Proportion of Events that are Correctly Forecast’ (denoted PECF), which can be interpreted as the
probability an event will be forecast given that an event will occur.
The temperature contingency tables show very little change between the two years. Both had high
numbers of hits (17.6% and 18.6%), with comparatively few misses (3.6% and 4.2%) or false alarms
Page 6 of 26
http://mc.manuscriptcentral.com/weather
Weather
123456789101112131415161718192021222324252627282930313233343536373839404142434445464748495051525354555657585960

For Peer Review
(6.8% for both). Both years show a bias toward over-forecasting, with a greater number of forecasts
of sub-zero days (17.6%+6.8%=24.4% and 18.6%+6.8%=25.4%) than observations
(17.6%+3.6%=21.2% and 18.6%+4.2%= 22.6%). This is influenced by the AWS-forecast altitude
difference; the LD and NW AWS observations are above and below the forecast height so under and
over- forecasting are evident in these regions respectively. Conversely, the SE AWS is at a slightly
higher altitude than the forecast and yet significant over forecasting is apparent. This indicates that
the over forecasting displayed in the contingency table is indeed genuine. For the two years the
PECFs were high (0.83 and 0.81) as were the PFECs – (0.72 and 0.73).
The wind speed contingency tables show a slight decrease in the number of high wind speed events
observed; from 5.5%+7.2%=12.7% to 7.2%+4.9%=12.1% between 2006 and 2012. Given this
decrease it may be expected that the number of hits and false alarms would decrease because there
are fewer opportunities for them to occur. However both percentages increase; the hits from 5.5%
to 7.2% and the false alarms from 4.7% to 7.5%. This is to most likely due to the apparent increase in
the readiness to forecast high winds; the percentage of days forecast as high wind speed events
increases from 10.2% to 14.7%. Both the increase in the forecasting and the decrease in the
observation of high wind speed events lead to a decrease in misses (from 7.2% to 4.9%). The large
increase in the forecasting of high winds would also lead to the expectation that the PECF would rise
– indeed it rose from 0.43 to 0.60 - and that the PFEC would fall – it did, from 0.54 to 0.49. This is
again because the forecast is more likely to catch the high wind speed days, but at the cost of
increased risk of causing false alarms. Given that the increase is much greater than the decrease, and
that misses are a greater concern than false alarms, this could well be interpreted as an overall
improvement in the forecasting of high winds.
5 Conditions associated with large forecast errors
Whilst the verification statistics suggest that the forecasts are in general reasonably accurate, there
are outliers apparent on the scatterplots (e.g. Figure 4, marked in black for temperature in 2012)
Page 7 of 26
http://mc.manuscriptcentral.com/weather
Weather
123456789101112131415161718192021222324252627282930313233343536373839404142434445464748495051525354555657585960
For Peer Review
represent days with larger forecast errors. The days with the 10 largest errors in temperature and
wind speed in each year and region are considered in more detail. For several of these days the
textual summary of the forecasts conveyed the forecaster’s uncertainty of weather conditions or
their timing, or presented more than one possible outcome. This qualitative information cannot be
reflected in the statistics but sometimes did in fact correspond well with the hourly observations.
Any days in the top ten errors for which it was felt the forecast adequately described the
observations of the day were discounted, and the conditions of the remaining days analysed.
Conditions which were prone to large errors are discussed below.
The majority of the largest errors in wind speed were under high-wind conditions, associated with
the passage of low-pressure systems. Comparisons of forecast and analysis charts indicated that in
most cases the timing of the passage of the front was incorrectly predicted by the NWP models,
leading to errors in the forecast wind speed (not shown).
5.1 Winter inversions
Three of the largest temperature errors in 2006 occurred during the winter months, when the UK
weather was dominated by high-pressure conditions. A region of high pressure moved over the UK
on 23rd
January, became well-established on 26th
January and persisted until 7th
February (see
example charts, Figure 5c and d). During this period the error in forecast temperature was up to 7 °C.
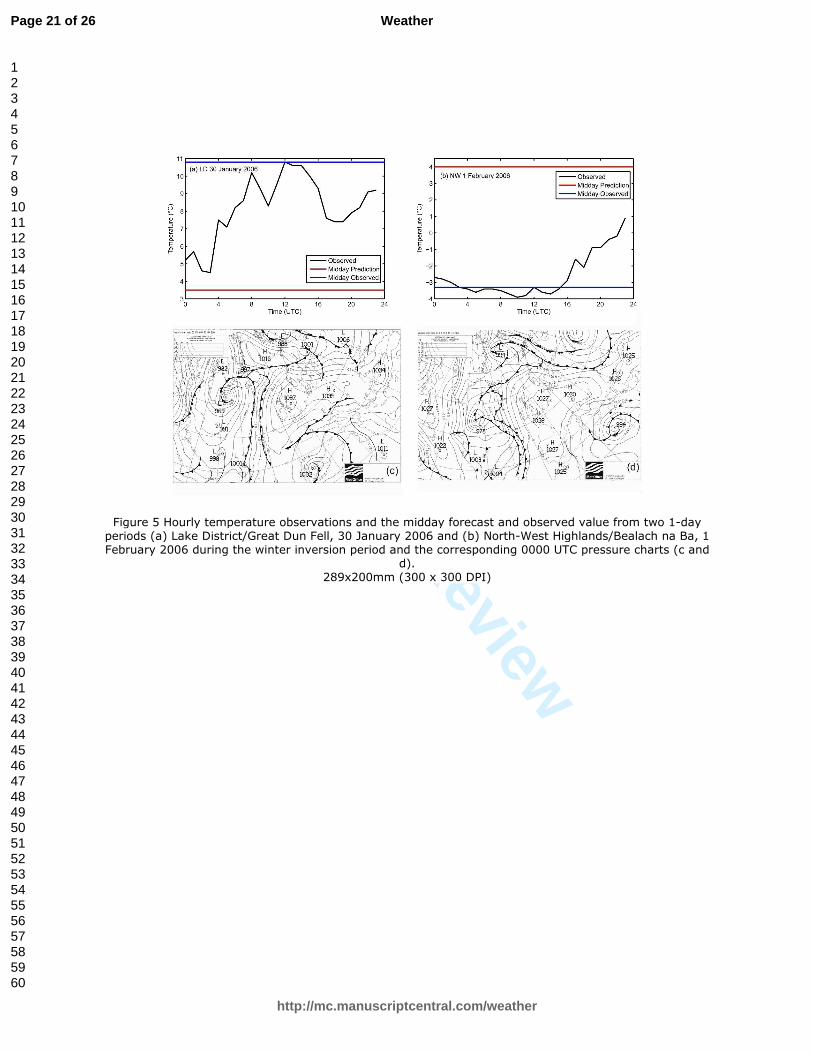
On some days the textual summary for temperature in the forecast suggests a large
uncertainty/range, although some large errors do remain. Figure 5 illustrates two examples during
this period. The plots show the hourly observations over each day, the observation at midday and
the forecast value. On 30 January 2006 in LD the forecast midday temperature was 3.5°C and the
observed midday temperature was 10.8°C. In fact, the observed temperature remained at least 4°C
warmer than the forecast throughout the daylight hours (Figure 5a). The opposite occurred on 1
February 2006 in NW; the forecast value was 4°C but the observed value was -3.3°C, more than 7°C
cooler than predicted (Figure 5b).
Page 8 of 26
http://mc.manuscriptcentral.com/weather
Weather
123456789101112131415161718192021222324252627282930313233343536373839404142434445464748495051525354555657585960
For Peer Review
Radiosonde observations from Castor Bay in Northern Ireland at 1200 UTC on 30 January and 1
February are illustrated by the tephigram plots in Figures 6 and 7, which should be indicative of
conditions in NW and LD. The temperature (red line) and dew point temperature (blue line) are
plotted in this format so that the stability of the atmosphere can be easily assessed. An explanation
of the axes is given in the figure caption. A temperature inversion exists when the temperature
increases with height. Figure 6 shows two inversions close to the surface. The first exists from very
near the surface up to 1010 hPa (200 m) with a temperature difference of ~5°C and the second
spans 990 to 970 hPa (360-500 m) with a temperature difference of ~6°C. On 1 February there is a
single inversion that is elevated from the surface, spanning 930 to 875 hPa (775-1300 m), with a
temperature difference of ~6°C. The elevated inversions in Figure 6 and 7 are likely caused by the
anticyclone, which is associated with large-scale subsidence and low-winds (Iijima and Shinoda,
2000) that cause air to warm as it descends. The surface-based inversions are likely due to the
radiative cooling of the surface. Sharp temperature changes in the vertical and their variation on
sub-daily scales are extremely challenging to represent in NWP models (Sheridan et al., 2010). When
the altitude of the inversion is close to the forecast height, it is extremely difficult to produce an
accurate forecast because slight variations in the height of the inversion will lead to large errors in
the temperature profile.
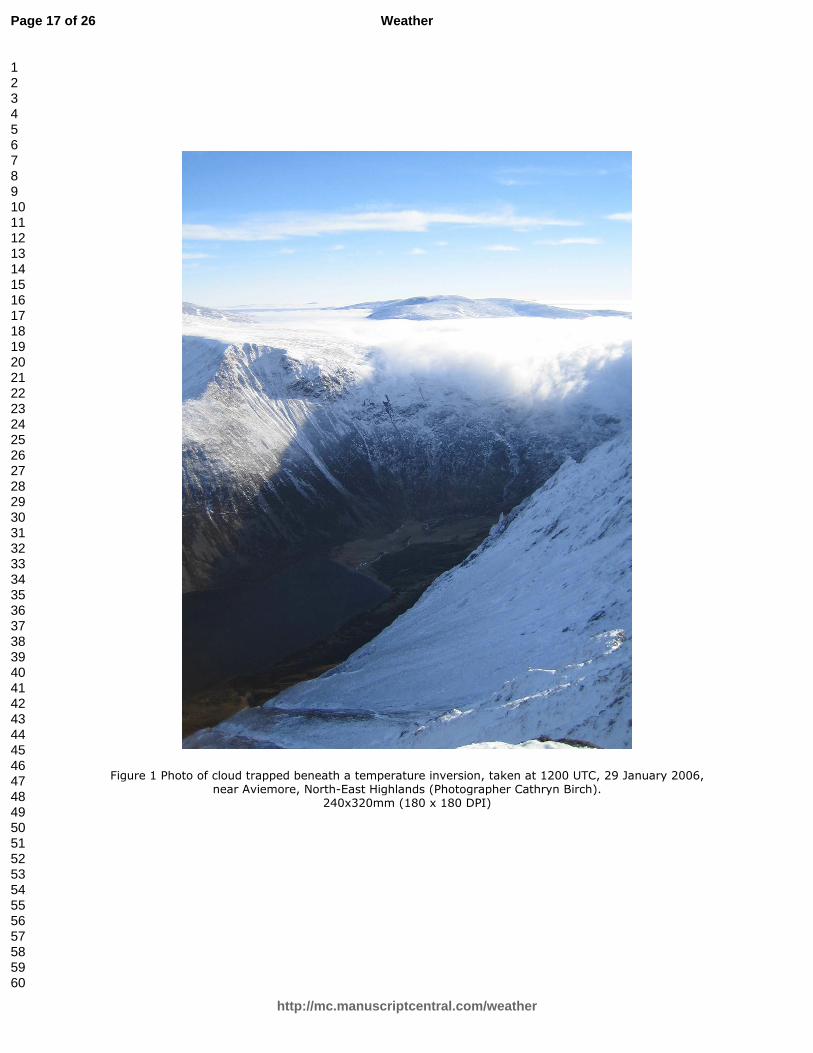
A spectacular example of a temperature inversion from this period was photographed near
Aviemore in the North-East Highlands at 1200 UTC, 29 January 2006 (Figure 1). On this day the
tephigram is very similar to those in Figure 7, the inversion base at approximately 900 m above sea
level. The top of the cloud layer in the photograph resides at approximately 900 m, in agreement
with the radiosonde observations.
Predicting any cloud layers associated with the inversion can also be challenging (Fernando and Weil,
2010) and is another reason for NWP forecast uncertainty or the uncertainty in forecast-observation
comparisons. The forecast for the LD on 30 January 2006 suggested cloud may be present in the east
Page 9 of 26
http://mc.manuscriptcentral.com/weather
Weather
123456789101112131415161718192021222324252627282930313233343536373839404142434445464748495051525354555657585960
For Peer Review
of the region for at least part of the day. The satellite image in Figure 8a shows cloud is only present
in the northern-most part of the region at 1200 UTC, which may help explain the under-prediction of
temperature. On 1 February 2006 cloud was forecast only in the western part of the NW highlands,
which is in agreement with the satellite image in Figure 8b. The cloud layer was predicted to reside
between 400 and 700 m (i.e. below the inversion). The AWS at Bealach-na-ba is at 773 m and thus
could have been in cloud on this day, possibly adding to the forecast-observation difference.
5.2 Heat wave conditions
7 of the 10 largest temperature errors in 2012 occurred during a period of ‘heat-wave’ weather
during May. The temperatures increased between the 19 and 23 May during dominant high pressure
(Figure 9b). The hot weather continued through to the 28 May with Scotland breaking its May
temperature record on the 25th
when 30.9 °C was recorded at Inverailort, Highland, and the
temperatures then cooled toward the end of the month. On all of these occasions the forecast
temperature was up to 6 °C cooler than that observed.
23 May 2012 in the Lake District is taken as an example for this period. The temperature was
forecast to be 12-15 °C but the observed temperature was above 15 °C between 0600 and 2000 UTC
and peaked at midday with a recording of 19.5 °C (Figure 9a). The LD was generally cloud-free during
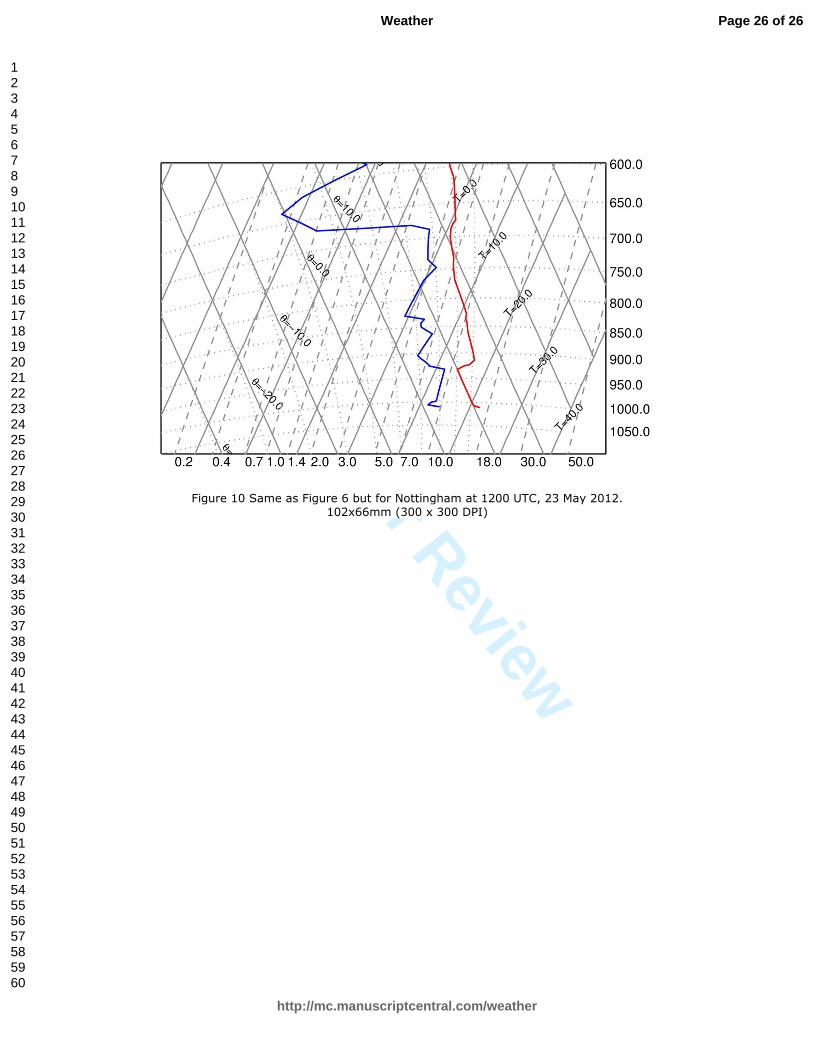
this period and the forecast was consistent with this (not shown). The radiosonde observations from
Nottingham at 1200 UTC (Figure 10) show cloud-free conditions (for cloud to be present
temperature must equal the dew point temperature) with a temperature inversion spanning
approximately 4 °C, from 930 to 910 hPa (800-1000 m). The height of the inversion is close to the
forecast height of 750 m. As with the winter case, it is possible that the forecast temperature was
too low because the height and strength of the temperature inversion were not predicted accurately
by the NWP models.
Page 10 of 26
http://mc.manuscriptcentral.com/weather
Weather
123456789101112131415161718192021222324252627282930313233343536373839404142434445464748495051525354555657585960
For Peer Review
Experience from MWIS suggests that the NWP models they use tend to underestimate maximum
temperatures in mountainous regions during hot weather. NWP models struggle to represent soil
moisture and the coupling between the land and atmosphere (Koster et al., 2004). If errors exist in
this field, they will cause biases in the partition between sensible and latent heat, which could
explain the near-surface temperature biases highlighted by this study. Another reason could be that
heatwaves occur relatively infrequently in the UK and thus forecaster experience in describing them
is more limited compared to other weather conditions.
6 Conclusions
This study uses observations from upland weather stations to verify mountain weather forecasts
provided by the Mountain Weather Information Service for three different regions in the UK. MWIS
forecasts made one day in advance generally exhibit good levels of accuracy and consistency and
this is largely, and perhaps surprisingly, maintained in day two and three forecasts. The forecasters
at MWIS were pleasantly surprised at the degree to which forecasting performance is maintained. A
possible explanation for this is that the errors associated with the d+2 and d+3 numerical weather
prediction forecasts from the operational centres are small compared to both the errors associated
interpolation of forecast products to the heights and locations required and the issues associated
with representing a relatively large, complex region with a single forecast value.
The general accuracy of the wind speed forecasts was good (PCC=0.8 and Gradient>0.7 for all three
regions in 2012), with the largest errors mostly due to incorrect model forecasts of the timing of
incoming fronts. There were very few large errors (>45°) in the forecasting of wind direction, and the
large errors that did occur mainly occurred during periods of very low wind speeds. There is strong
evidence for improvement of the forecasts of the wind, both speed and direction between 2006 and
2012. Improvements to the forecasts of temperature are also apparent but these are less marked,
perhaps due to high quality of the 2006 forecasts. Reasons for these improvements may include
Page 11 of 26
http://mc.manuscriptcentral.com/weather
Weather
123456789101112131415161718192021222324252627282930313233343536373839404142434445464748495051525354555657585960
For Peer Review
increases in forecaster experience and the increased on-line availability of model products since
2006.
The analysis of high wind speed or sub-zero temperature days through contingency tables gave
additional insight into the quality of the forecasting of the more severe weather conditions. The
contingency tables for wind speed and temperature differed. The wind-speed tables showed a clear
shift towards more readily forecasting high winds, leading to a large increase (from 0.43 to 0.60) in
the PECF, and a small decrease (from 0.54 to 0.49) in PFEC. In contrast the temperature tables
showed little change between the two years with both tables having PECFs and PFECs just over 0.80
and 0.70 respectively.
The largest forecast errors in temperature tend to occur during certain types of weather conditions.
The difficulty in forecasting the exact height and strength of temperature inversions and their
variation over the day was the most common cause of large errors during the winter months. The
hot spell of weather at the end of May 2012 was persistently under-forecast which may also have
been due to similar problems with temperature inversions, due to forecaster inexperience or due to
the inability of models to represent land-surface processes adequately. The precise reasons are
unclear and thus the obvious follow-up study would assess the accuracy of MWIS forecasts during all
heatwaves between 2006 and 2012 and evaluate the near-surface temperature, soil moisture and
surface heat fluxes over the three UK upland regions in NWP models.
Acknowledgements
Our thanks go to NERC for providing the funding for the student placement. We would also like to
thank Hazel Bremner, Duncan Malone and Zoe Dupuy for their help with the collection of the
forecast data. We are grateful to the University of Granada whose archives provided the
observational data, the University of Wyoming for providing the tephigram data, the UK Met Office
(via wetter3 and wetterzentrale) for the synoptic charts and the Dundee Satellite Receiving Station
Page 12 of 26
http://mc.manuscriptcentral.com/weather
Weather
123456789101112131415161718192021222324252627282930313233343536373839404142434445464748495051525354555657585960

For Peer Review
for providing the satellite imagery. We are grateful to two anonymous reviewers for their helpful
comments and suggestions.
References
Fernando HJS, Weil JC. 2010. Whither the stable boundary layer?: A shift in the research agenda.
Bull. Am. Meteorol. Soc. 91:1475-1484.
Iijima Y, Shinoda M. 2000. Seasonal changes in the cold-air pool formation in a subalpine hollow,
Central Japan. Int. J. Clim. 20: 1471-1483.
Koster RD and coauthors. 2004. Regions of strong coupling between soil moisture and precipitation.
Science. 305: 1138-1140.
Sheridan P, Smith S, Brown A, Vosper S. 2010 A simple height-based correction for temperature
downscaling in complex terrain. Meteorol. App. 17: 329-339.
Page 13 of 26
http://mc.manuscriptcentral.com/weather
Weather
123456789101112131415161718192021222324252627282930313233343536373839404142434445464748495051525354555657585960

For Peer Review
Headline for the Lake District
Fairly light wind; a few snow showers. May deteriorate later afternoon.
How windy? (On the
summits)
Effect of wind on you?
Southwesterly 25mph. Will back southerly and into afternoon strengthen
toward 35 or perhaps 40mph from west.
Fairly small, although in afternoon buffeting may become significant.
How wet? Showers: later merging to give frequent precipitation
A few showers, snow above 550m. In early afternoon, from west, showers
merging to give almost constant precipitation for around 3 hours.
Cloud on the hills?
Chance of cloud free
summits?
Extensively on higher areas
Generally cloud rarely clearing above 800m and occasional patches below
600m – most breaks to higher areas northern and eastern fells. Into
afternoon cloud may lower toward 350 to 550m
30%
Sunshine and air
clarity?
Bursts of sunshine morning eastern and northern fells. Fog on higher
areas, and in some valleys at first.
How Cold? (at 750m)
Freezing level
0°C
800m
Table 1 Example forecast text for the Lake District, 13 January 2014.
Page 14 of 26
http://mc.manuscriptcentral.com/weather
Weather
123456789101112131415161718192021222324252627282930313233343536373839404142434445464748495051525354555657585960

For Peer Review
Correlation Data LD NW SE
2012
d 1
2006
d 1
2006
d 2
2006
d 3
2012
d 1
2006
d 1
2006
d 2
2006
d 3
2012
d 1
2006
d 1
2006
d 2
2006
d 3
Wind
Speed
(mph)
PCC 0.80 0.71 0.69 0.61 0.79 0.61 0.57 0.52 0.80 0.68 0.66 0.59
RMSE 8.63 10.70 11.04 11.52 11.21 11.19 11.94 12.52 9.06 9.51 9.98 10.91
Gradient 0.71 0.58 0.55 0.47 0.85 0.56 0.53 0.47 0.85 0.65 0.62 0.55
Intercept 5.24 6.47 7.19 10.15 9.41 12.48 13.90 15.77 5.58 9.74 10.70 13.06
Temp.
(°C)
PCC 0.95 0.96 0.94 0.92 0.95 0.95 0.94 0.92 0.94 0.96 0.94 0.93
RMSE 1.67 1.76 2.03 2.35 1.80 1.96 2.05 2.11 1.70 1.84 2.10 2.16
Gradient 0.86 0.98 0.97 0.92 0.90 1.00 1.00 0.97 0.82 0.89 0.89 0.87
Intercept 1.40 0.65 0.76 1.26 -0.73 -1.15 -1.10 -0.59 0.33 -0.20 -0.19 0.12
Table 2 Forecast statistics for wind speed and temperature during 2006 and 2012 for each of the three forecast regions.
Page 15 of 26
http://mc.manuscriptcentral.com/weather
Weather
12345678910111213141516171819202122232425262728293031323334353637383940414243444546474849

For Peer Review
�������������� ��������������
���������
� 40mph� � 40mph�
����������
� 40mph� ����������������� ���������������������
� 40mph� �!��������������� "�����������������
#$%�&�'(�#�$%&� !�
�����������'�� ��������������
���������
� 40mph� � 40mph�
����������
� 40mph� ������������������ �������������������
� 40mph� ����������������� "�'���������������
#$%�&� )(�#�$%&�� �
*�+�����,������ ��������������
���������
� 0°%� 0°%�
����������
� 0°%� �"���������������� '�"�����������������
0°%� ������������������ ��"���������������
#$%�&�"�(�#�$%&��)�
*�+�����,���'�� ��������������
���������
� 0°%� 0°%�
����������
� 0°%� ���'��������������� '�"���������������
0°%� )�'����������������� ���������������
#$%�&�")(�#�$%&���
Table 3 Contingency tables for temperature and wind speed during 2006 and 2012 for all three of
the forecast regions.
Page 16 of 26
http://mc.manuscriptcentral.com/weather
Weather
123456789101112131415161718192021222324252627282930313233343536373839404142434445464748495051525354555657585960
For Peer Review
��
�
�
�������������� ��������������������������������������������������������������������� �����!����"�������#���������$���%&����'��������(��������������!��)���*+��
�,�-.�����(�/��-��/��01*��
�
�
Page 17 of 26
http://mc.manuscriptcentral.com/weather
Weather
123456789101112131415161718192021222324252627282930313233343536373839404142434445464748495051525354555657585960
For Peer Review
��
�
�
��������������� ���������������������� �������� ���������������� � ��������������������� ������������������������ ���
� !"#$���% &&�"� &&�'()*��
�
�
Page 18 of 26
http://mc.manuscriptcentral.com/weather
Weather
123456789101112131415161718192021222324252627282930313233343536373839404142434445464748495051525354555657585960
For Peer Review
��
�
�
����������������� ������������������ ������������ ��������������� ������������� ������������ �������������� ���������� ����������������������� ��������� ������������� ����������������� ������������������
����������������
��� !"#���$�%%� ��%%�&'()��
�
�
Page 19 of 26
http://mc.manuscriptcentral.com/weather
Weather
123456789101112131415161718192021222324252627282930313233343536373839404142434445464748495051525354555657585960

For Peer Review
��
�
�
������������� ����������������� ����� ���������������������� ������������� �������������������� ������
������������ ����� � � �� ���������� ����� !�"� �#���������$������������ ������� ������� ��������$� ��
� ���������������%!�!��
�%�&�'(����)���&�)���*+,���
�
�
Page 20 of 26
http://mc.manuscriptcentral.com/weather
Weather
123456789101112131415161718192021222324252627282930313233343536373839404142434445464748495051525354555657585960
For Peer Review
��
�
�
�������������� ������ ���������� �������� ���������������� ����������������������� ������������������������ �� ��� !"��� � �������#�$%�&�������'%%(���������)� ��*�� ���������!+����������+�#������������'%%(�������� ������ ���������������������� ���������������%%%%�,-.�������������� ���������
��/��'012'%%����$%%�2�$%%� 34���
�
�
Page 21 of 26
http://mc.manuscriptcentral.com/weather
Weather
123456789101112131415161718192021222324252627282930313233343536373839404142434445464748495051525354555657585960

For Peer Review
��
�
�
��������������� �������������������������������������������������� �����������!������ ��������������"�������� ���������������"��#��������������#��������������$��%���!������ #������������&�'���
������������������$����������������(�)���$��%������������������������������������������*����������� #������������&�'���$��������������������������������������������"��$���������������$������������������� �'����������
(��+�&�*!�������������������������������� �#���� &����������&�������������������$���������� �������������������������������������������� �#���� &�����������&������������������$������������������� ��������(#����
��+���#������#��$+���'��"����������������*!�����'�� �(����'�����,)�*��
�
�
Page 22 of 26
http://mc.manuscriptcentral.com/weather
Weather
123456789101112131415161718192021222324252627282930313233343536373839404142434445464748495051525354555657585960

For Peer Review
��
�
�
��������������������� ������������������������������������������� ������� ��������������� !"��
�
�
Page 23 of 26
http://mc.manuscriptcentral.com/weather
Weather
123456789101112131415161718192021222324252627282930313233343536373839404142434445464748495051525354555657585960

For Peer Review
��
�
�
������������ �� ����������������������������� ������������ !"��#�$�%���&�'##(��%)��*�����+�� !"�����*����&�'##(,��
�+-.��������##�.��##��/����
�
�
Page 24 of 26
http://mc.manuscriptcentral.com/weather
Weather
123456789101112131415161718192021222324252627282930313233343536373839404142434445464748495051525354555657585960

For Peer Review
��
�
�
��������������������� ������������������������������������������ ! "����#����!������$%&��
�
�
Page 25 of 26
http://mc.manuscriptcentral.com/weather
Weather
123456789101112131415161718192021222324252627282930313233343536373839404142434445464748495051525354555657585960
For Peer Review
�������������� ������������������������������������������������������������� ������!"#$��
Page 26 of 26
http://mc.manuscriptcentral.com/weather
Weather
123456789101112131415161718192021222324252627282930313233343536373839404142434445464748495051525354555657585960