Embed Size (px)
Citation preview

Vermont Agency of Education
P
S
I
SCHOOL NAMECLASS OF 2011
PS ENROLLMENT RATE
CLASS OF 2012
PS ENROLLMENT RATE
CLASS OF 2013
PS ENROLLMENT RATE
STATEWIDE 59.2% 58.7% 60.0%P
SArlington Memorial School 60.0% 65.5% 44.0%P
SBellows Falls UHS #27 44.9% 43.9% 44.4%P
SBellows Free Academy High School (Fairfax) 54.1% 63.3% 53.2%P
SBellows Free Academy UHS #48 58.3% 60.6% 59.6%P
SBlack River US #39 57.1% 68.0% 44.0%P
SBlue Mountain US #21 41.5% 55.9% 60.0%
PS040Brattleboro UHS #6 60.8% 60.4% 64.2%P
SBurlington Senior High School 56.0% 54.0% 60.8%P
ABurr & Burton 63.5% 72.0% 66.4%P
SCabot School ++ ++ ++P
SCanaan Schools 72.0% 53.6% 61.1%P
SChamplain Valley UHS #15 72.4% 72.1% 73.9%P
SChelsea Elementary High School ++ ++ ++P
SColchester High School 65.7% 68.6% 69.4%P
SConcord Graded/High School ++ ++ ++P
SCraftsbury Schools 64.7% 73.3% ++P
SDanville School 57.6% 44.0% 44.0%P
SEnosburg Middle/High School 46.4% 46.8% 47.9%P
SEssex High School 76.4% 73.7% 73.0%P
SFair Haven UHS #16 59.2% 53.9% 54.5%P
SGreen Mountain UHS #35 62.5% 52.4% 64.3%P
SHartford High School 53.8% 65.7% 64.9%P
SHarwood UHS #19 51.0% 67.4% 61.8%P
SHazen UHS #26 53.5% 50.0% 52.6%P
SLake Region UHS #24 43.8% 53.6% 49.5%P
SLamoille UHS #18 46.9% 38.2% 54.9%P
SLeland & Gray UHS #34 64.5% 49.1% 62.0%P
ALyndon Institute 58.4% 43.8% 59.4%P
SMiddlebury Senior UHS #3 53.9% 67.2% 60.0%P
SMill River US #40 52.7% 56.5% 62.3%P
SMilton High School 56.5% 57.1% 55.5%P
SMissisquoi Valley UHS #7 47.3% 45.0% 47.4%P
SMontpelier High School 58.3% 72.1% 73.3%P
SMt. Abraham UHS #28 57.5% 56.3% 53.3%P
SMt. Anthony Senior UHS #14 59.1% 55.1% 55.7%P
SMt. Mansfield US #17 71.5% 68.6% 69.2%
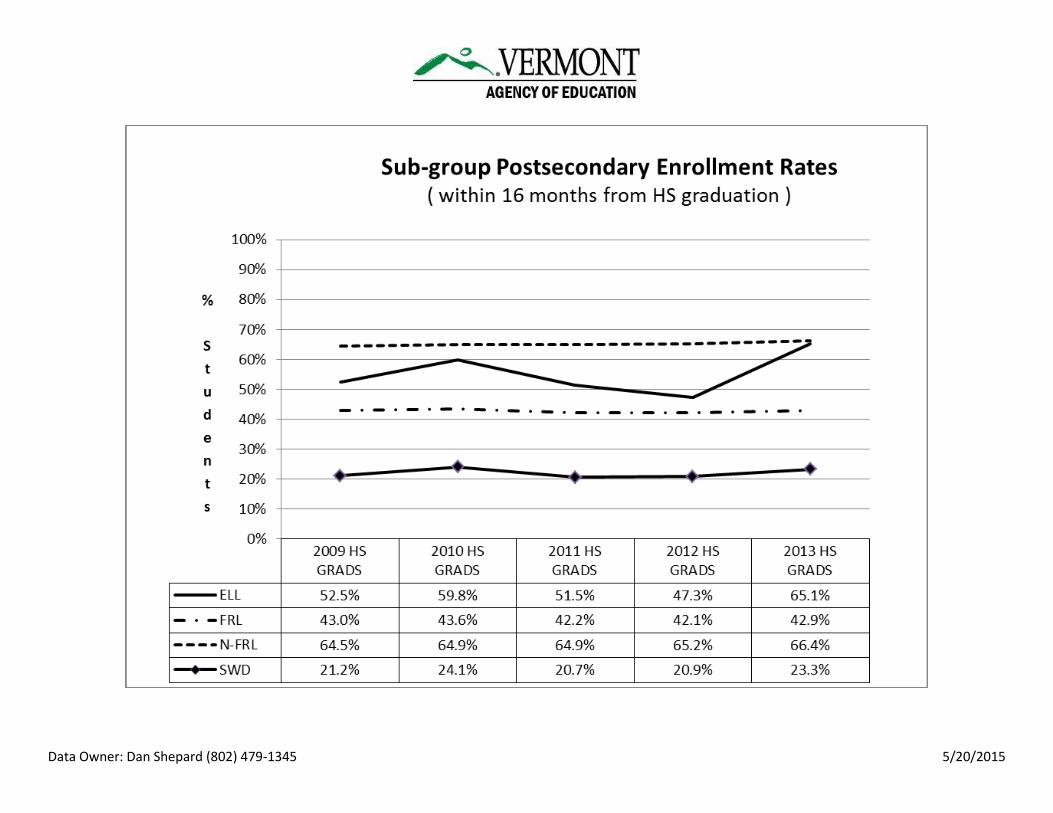
Vermont High School Graduates
Postsecondary Enrollment Rate
This report represents Vermont students who graduated with a regular high school diploma and enrolled in an
institution of higher education within 16 months of their high school graduation date. This rate is not based on the 9th
grade cohort. These percentages were derived using postsecondary data collected by the National Student
Clearinghouse (NSC).
The National Student Clearinghouse collects enrollment data from ~98% of the postsecondary institutions that
participate in Title IV Student Loans. While this captures the majority of postsecondary enrollments, it may not include
many trade, vocational, military, and international institutions, or apprenticeship programs. As well, this report does
not include publicly tuitioned students that attend out of state High Schools due to demographic issues. Also, students
and schools can opt for a Family Educational Rights and Privacy Act (FERPA) blocker on their enrollment records and
therefore not be included in NSC reports.
It is also important to note that there may be a number of reasons for a secondary graduate not to continue to a
postsecondary experience, or not to persist. While the Agency of Education works to eliminate inadequate preparation
as a reason, we must also recognize that other factors may come into play. The rising cost of higher education and the
potential debt burden are certainly significant factors in this important decision.
Data Owner: Dan Shepard (802) 479-1345 6/3/2015

Vermont Agency of Education
P
S
I
SCHOOL NAMECLASS OF 2011
PS ENROLLMENT RATE
CLASS OF 2012
PS ENROLLMENT RATE
CLASS OF 2013
PS ENROLLMENT RATEP
SNorth Country UHS #22A 43.1% 41.6% 38.8%P
SNorthfield Middle/High School 43.9% 45.5% 50.0%P
SOtter Valley UHS #8 66.7% 48.2% 47.3%P
SOxbow UHS #30 35.4% 42.3% 56.1%P
SPeoples Academy 49.4% 64.0% 50.6%P
SPoultney High School 55.9% 55.6% 38.9%P
SProctor Junior/Senior High School 87.5% 75.0% 50.0%P
SRandolph UHS #2 44.6% 46.1% 52.9%P
SRichford Junior/Senior High School 51.2% 48.7% 43.9%P
SRochester School 60.7% 81.3% ++P
SRutland High School 66.8% 61.2% 65.3%P
SSouth Burlington High School 75.3% 76.0% 72.2%P
SSouth Royalton Elementary/High School 66.7% ++ 37.5%P
SSpaulding UHS #41 56.5% 44.0% 56.0%P
SSpringfield High School 55.7% 49.5% 56.4%P
ASt. Johnsbury Academy 64.6% 61.5% 61.8%P
SStowe Middle/High School 68.5% 72.1% 81.6%P
AThetford Academy 69.8% 63.0% 72.6%P
STwin Valley High School 50.0% 59.5% ++P
STwinfield US #33 55.9% 52.8% ++P
SU32 UHS #32 54.3% 59.6% 72.2%P
SVergennes UHS #5 64.4% 53.8% 57.9%P
SWest Rutland School 65.6% 50.0% ++P
SWhitcomb Junior/Senior High School ++ 54.5% ++P
SWilliamstown Middle/High School 55.2% 35.3% 47.5%P
SWindsor High School 64.5% 60.0% 60.0%P
SWinooski High School 48.1% 46.3% 45.7%P
SWoodstock Senior UHS #4 59.2% 71.3% 66.3%
++ represents suppressed data (n<=11)
Data Owner: Dan Shepard (802) 479-1345 6/3/2015
Data Owner: Dan Shepard (802) 479-1345 5/20/2015
Vermont Agency of Education
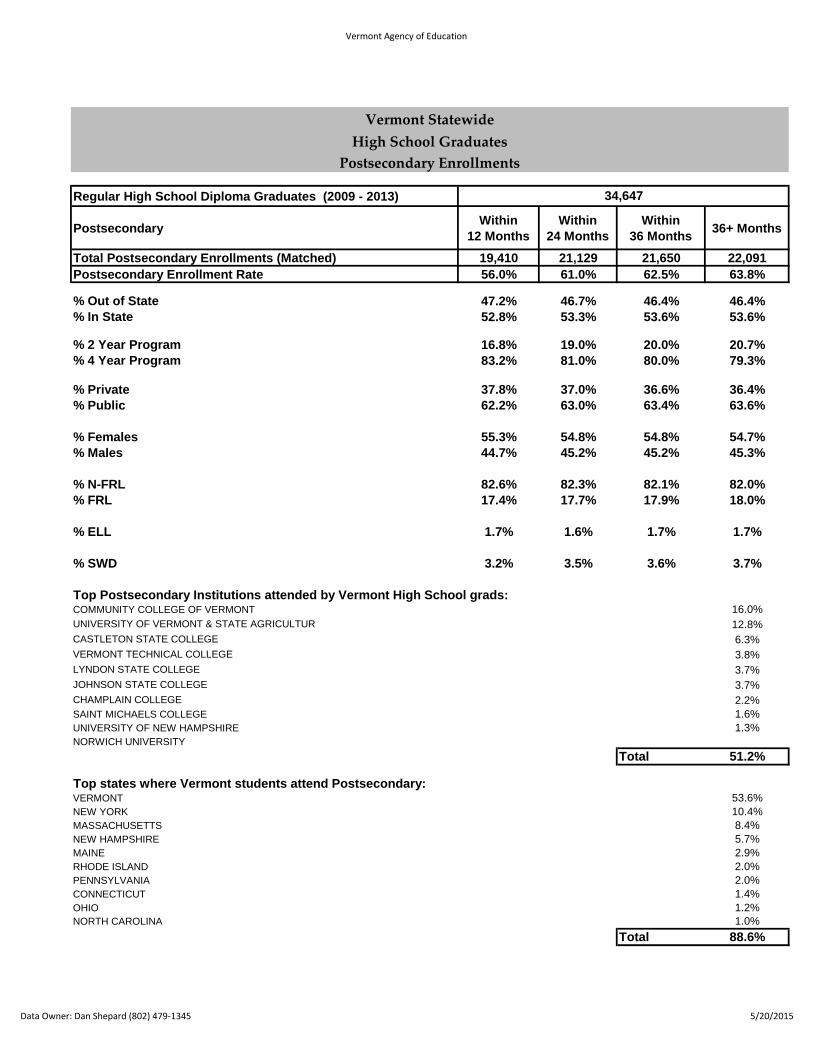
Regular High School Diploma Graduates (2009 - 2013)
PostsecondaryWithin
12 Months
Within
24 Months
Within
36 Months36+ Months
Total Postsecondary Enrollments (Matched) 19,410 21,129 21,650 22,091
Postsecondary Enrollment Rate 56.0% 61.0% 62.5% 63.8%
% Out of State 47.2% 46.7% 46.4% 46.4%
% In State 52.8% 53.3% 53.6% 53.6%
% 2 Year Program 16.8% 19.0% 20.0% 20.7%
% 4 Year Program 83.2% 81.0% 80.0% 79.3%
% Private 37.8% 37.0% 36.6% 36.4%
% Public 62.2% 63.0% 63.4% 63.6%
% Females 55.3% 54.8% 54.8% 54.7%
% Males 44.7% 45.2% 45.2% 45.3%
% N-FRL 82.6% 82.3% 82.1% 82.0%
% FRL 17.4% 17.7% 17.9% 18.0%
% ELL 1.7% 1.6% 1.7% 1.7%
% SWD 3.2% 3.5% 3.6% 3.7%
Top Postsecondary Institutions attended by Vermont High School grads:COMMUNITY COLLEGE OF VERMONT COMMUNITY COLLEGE OF VERMONT 16.0%
UNIVERSITY OF VERMONT & STATE AGRICULTUR UNIVERSITY OF VERMONT & STATE AGRICULTUR 12.8%
CASTLETON STATE COLLEGE CASTLETON STATE COLLEGE 6.3%
VERMONT TECHNICAL COLLEGE VERMONT TECHNICAL COLLEGE 3.8%
LYNDON STATE COLLEGE LYNDON STATE COLLEGE 3.7%
JOHNSON STATE COLLEGE JOHNSON STATE COLLEGE 3.7%
CHAMPLAIN COLLEGE CHAMPLAIN COLLEGE 2.2%
SAINT MICHAELS COLLEGE SAINT MICHAELS COLLEGE 1.6%
UNIVERSITY OF NEW HAMPSHIRE UNIVERSITY OF NEW HAMPSHIRE 1.3%
NORWICH UNIVERSITY NORWICH UNIVERSITY
Total 51.2%
Top states where Vermont students attend Postsecondary:VERMONT VT 53.6%
NEW YORK NY 10.4%
MASSACHUSETTS MA 8.4%
NEW HAMPSHIRE NH 5.7%
MAINE ME 2.9%
RHODE ISLAND RI 2.0%
PENNSYLVANIA PA 2.0%
CONNECTICUT CT 1.4%
OHIO OH 1.2%
NORTH CAROLINA NC 1.0%
Total 88.6%
34,647
Vermont Statewide
High School Graduates
Postsecondary Enrollments
Data Owner: Dan Shepard (802) 479-1345 5/20/2015

Data Owner: Dan Shepard (802) 479-1345 5/20/2015

Vermont Agency of Education
P
S
I
SCHOOL NAMECLASS OF 2010
PS PERSISTENCE RATE
CLASS OF 2011
PS PERSISTENCE RATE
CLASS OF 2012
PS PERSISTENCE RATE
STATEWIDE 81.1% 81.8% 83.2%P
SArlington Memorial School 80.0% 73.3% 78.9%P
SBellows Falls UHS #27 81.0% 67.7% 86.2%P
SBellows Free Academy High School (Fairfax) 76.4% 83.0% 82.3%P
SBellows Free Academy UHS #48 81.9% 79.7% 81.6%P
SBlack River US #39 73.3% 91.7% 88.2%P
SBlue Mountain US #21 80.0% 82.4% 78.9%
PS040Brattleboro UHS #6 82.0% 79.3% 80.9%P
SBurlington Senior High School 73.9% 77.4% 78.0%P
ABurr & Burton 81.2% 84.2% 81.8%P
SCabot School ++ ++ ++P
SCanaan Schools 78.6% 83.3% 86.7%P
SChamplain Valley UHS #15 86.9% 85.9% 89.6%P
SChelsea Elementary High School ++ ++ ++P
SColchester High School 77.2% 80.8% 85.8%P
SConcord Graded/High School 78.6% ++ ++P
SCraftsbury Schools ++ ++ ++P
SDanville School ++ 89.5% ++P
SEnosburg Middle/High School 86.5% 71.9% 83.3%P
SEssex High School 87.0% 86.4% 88.1%P
SFair Haven UHS #16 81.8% 75.3% 78.2%P
SGreen Mountain UHS #35 72.9% 90.0% 78.8%P
SHartford High School 78.2% 74.1% 83.8%P
SHarwood UHS #19 83.0% 81.3% 86.5%P
SHazen UHS #26 78.6% 78.9% 75.9%P
SLake Region UHS #24 74.4% 88.1% 82.2%P
SLamoille UHS #18 77.8% 86.8% 80.0%P
SLeland & Gray UHS #34 67.7% 85.0% 81.5%P
ALyndon Institute 84.0% 75.0% 84.4%
Vermont High School Graduates
Postsecondary Persistence Rate
This report represents Vermont students who graduated with a regular high school diploma and enrolled in an institution
of higher education within 16 months of High School Graduation; and persisted in postsecondary for at least three
semesters within two academic school years. These percentages were derived using postsecondary data collected by the
National Student Clearinghouse (NSC).
The National Student Clearinghouse collects enrollment data from ~98% of the postsecondary institutions that participate in
Title IV Student Loans. While this captures the majority of postsecondary enrollments, it may not include many trade,
vocational, military, and international institutions, or apprenticeship programs. As well, this report does not include
publicly tuitioned students that attend out of state High Schools due to demographic issues. Also, students and schools can
opt for a Family Educational Rights and Privacy Act (FERPA) blocker on their enrollment records and therefore not be
included in NSC reports.
It is also important to note that there may be a number of reasons for a secondary graduate not to continue to a
postsecondary experience, or not to persist. While the Agency of Education works to eliminate inadequate preparation as a
reason, we must also recognize that other factors may come into play. The rising cost of higher education and the potential
debt burden are certainly significant factors in this important decision.
Data Owner: Dan Shepard (802) 479-1345 6/3/2015

Vermont Agency of Education
P
S
I
SCHOOL NAMECLASS OF 2010
PS PERSISTENCE RATE
CLASS OF 2011
PS PERSISTENCE RATE
CLASS OF 2012
PS PERSISTENCE RATEP
SMiddlebury Senior UHS #3 85.6% 84.2% 80.7%P
SMill River US #40 70.7% 67.2% 83.6%P
SMilton High School 86.4% 87.8% 86.3%P
SMissisquoi Valley UHS #7 74.6% 84.1% 76.3%P
SMontpelier High School 86.0% 83.9% 87.8%P
SMt. Abraham UHS #28 80.5% 84.9% 73.8%P
SMt. Anthony Senior UHS #14 82.3% 81.1% 87.9%P
SMt. Mansfield US #17 91.3% 87.3% 87.5%P
SNorth Country UHS #22A 79.0% 82.2% 80.2%P
SNorthfield Middle/High School 78.1% 88.9% 80.0%P
SOtter Valley UHS #8 73.6% 79.4% 90.6%P
SOxbow UHS #30 78.1% 72.4% 83.3%P
SPeoples Academy 80.0% 76.7% 75.0%P
SPoultney High School 86.4% 63.2% 65.0%P
SProctor Junior/Senior High School 75.0% 100.0% 95.2%P
SRandolph UHS #2 67.5% 78.8% 87.8%P
SRichford Junior/Senior High School 76.2% 85.7% 73.7%P
SRochester School ++ 82.4% 84.6%P
SRutland High School 81.7% 78.8% 81.8%P
SSouth Burlington High School 84.1% 82.2% 86.0%P
SSouth Royalton Elementary/High School 95.7% 90.0% ++P
SSpaulding UHS #41 79.6% 81.4% 83.8%P
SSpringfield High School 73.8% 79.6% 74.5%P
ASt. Johnsbury Academy 81.9% 80.6% 82.5%P
SStowe Middle/High School 82.4% 83.8% 88.6%P
AThetford Academy 83.3% 89.2% 85.3%P
STwin Valley High School 65.0% 65.2% 81.8%P
STwinfield US #33 77.8% 78.9% 78.9%P
SU32 UHS #32 87.5% 85.4% 79.8%P
SVergennes UHS #5 76.4% 80.4% 82.5%P
SWest Rutland School 86.7% 81.0% ++P
SWhitcomb Junior/Senior High School ++ ++ ++P
SWilliamstown Middle/High School 71.4% ++ ++P
SWindsor High School 90.9% 90.0% 85.7%P
SWinooski High School 76.0% 72.0% 72.0%P
SWoodstock Senior UHS #4 75.7% 82.0% 84.2%
++ represents suppressed data (n<=11)
Data Owner: Dan Shepard (802) 479-1345 6/3/2015

Data Owner: Dan Shepard (802) 479-1345 5/20/2015
Vermont Agency of Education
SCHOOL NAMECLASS OF 2009
PS COMPLETION RATE
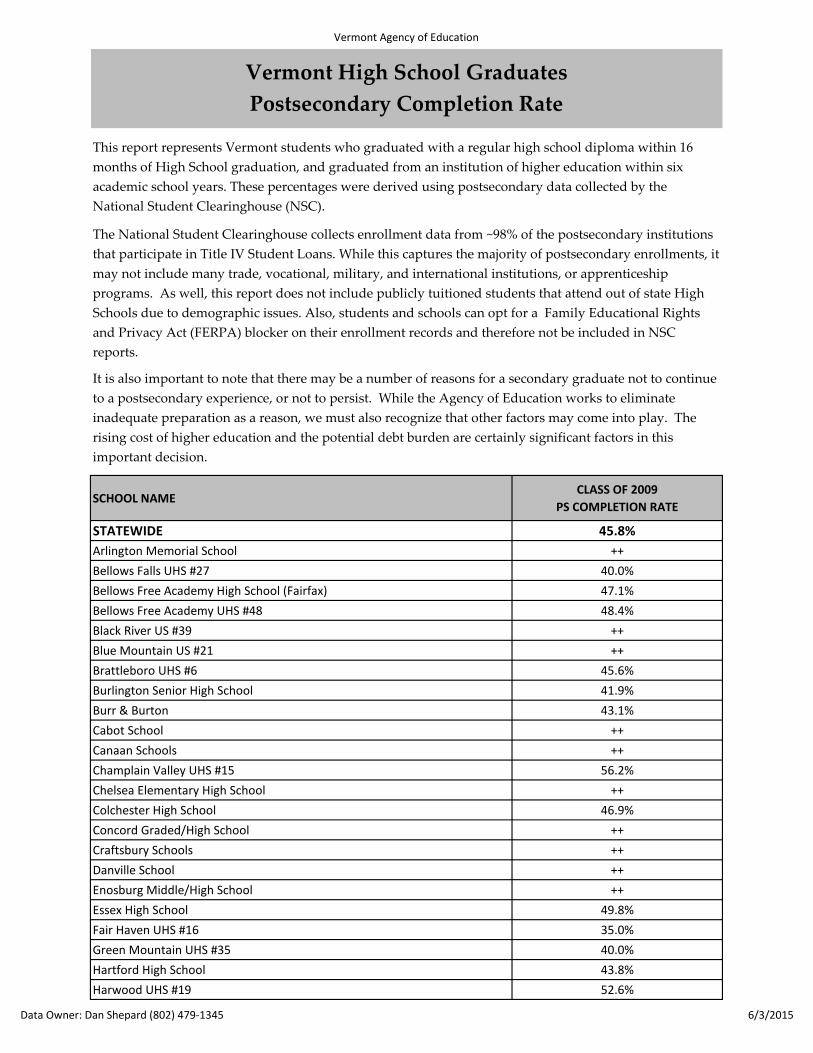
STATEWIDE 45.8%
Arlington Memorial School ++
Bellows Falls UHS #27 40.0%
Bellows Free Academy High School (Fairfax) 47.1%
Bellows Free Academy UHS #48 48.4%
Black River US #39 ++
Blue Mountain US #21 ++
Brattleboro UHS #6 45.6%
Burlington Senior High School 41.9%
Burr & Burton 43.1%
Cabot School ++
Canaan Schools ++
Champlain Valley UHS #15 56.2%
Chelsea Elementary High School ++
Colchester High School 46.9%
Concord Graded/High School ++
Craftsbury Schools ++
Danville School ++
Enosburg Middle/High School ++
Essex High School 49.8%
Fair Haven UHS #16 35.0%
Green Mountain UHS #35 40.0%
Hartford High School 43.8%
Harwood UHS #19 52.6%
Vermont High School Graduates
Postsecondary Completion Rate
This report represents Vermont students who graduated with a regular high school diploma within 16
months of High School graduation, and graduated from an institution of higher education within six
academic school years. These percentages were derived using postsecondary data collected by the
National Student Clearinghouse (NSC).
The National Student Clearinghouse collects enrollment data from ~98% of the postsecondary institutions
that participate in Title IV Student Loans. While this captures the majority of postsecondary enrollments, it
may not include many trade, vocational, military, and international institutions, or apprenticeship
programs. As well, this report does not include publicly tuitioned students that attend out of state High
Schools due to demographic issues. Also, students and schools can opt for a Family Educational Rights
and Privacy Act (FERPA) blocker on their enrollment records and therefore not be included in NSC
reports.
It is also important to note that there may be a number of reasons for a secondary graduate not to continue
to a postsecondary experience, or not to persist. While the Agency of Education works to eliminate
inadequate preparation as a reason, we must also recognize that other factors may come into play. The
rising cost of higher education and the potential debt burden are certainly significant factors in this
important decision.
Data Owner: Dan Shepard (802) 479-1345 6/3/2015

Vermont Agency of Education
SCHOOL NAMECLASS OF 2009
PS COMPLETION RATE
Hazen UHS #26 50.0%
Lake Region UHS #24 34.8%
Lamoille UHS #18 41.5%
Leland & Gray UHS #34 53.8%
Lyndon Institute 39.5%
Middlebury Senior UHS #3 46.6%
Mill River US #40 49.0%
Milton High School 39.1%
Missisquoi Valley UHS #7 42.3%
Montpelier High School 55.4%
Mt. Abraham UHS #28 50.0%
Mt. Anthony Senior UHS #14 41.8%
Mt. Mansfield US #17 53.9%
North Country UHS #22A 41.9%
Northfield Middle/High School 38.2%
Otter Valley UHS #8 ++
Oxbow UHS #30 33.3%
Peoples Academy 47.3%
Poultney High School 48.1%
Proctor Junior/Senior High School ++
Randolph UHS #2 31.4%
Richford Junior/Senior High School ++
Rochester School ++
Rutland High School 45.4%
South Burlington High School 58.3%
South Royalton Elementary/High School ++
Spaulding UHS #41 41.1%
Springfield High School 38.2%
St. Johnsbury Academy 42.0%
Stowe Middle/High School 65.9%
Thetford Academy 51.1%
Twin Valley High School 48.1%
Twinfield US #33 ++
U32 UHS #32 47.5%
Vergennes UHS #5 41.9%
West Rutland School ++
Whitcomb Junior/Senior High School ++
Williamstown Middle/High School ++
Windsor High School 54.3%
Winooski High School ++
Woodstock Senior UHS #4 43.5%
++ represents suppressed data (n<=11)
Data Owner: Dan Shepard (802) 479-1345 6/3/2015

Data Owner: Dan Shepard (802) 479-1345 5/20/2015
Postsecondary Completers - within 6 years of initial PS enrollment
High School Graduating Class of 2009
Statewide 45.8%
N-FRL 48.3%
FRL 30.7%
ELL 32.7%
SPED 20.6%

Data Owner: Dan Shepard (802) 479-1345 5/20/2015

Data Owner: Dan Shepard (802) 479-1345 5/20/2015

Data Owner: Dan Shepard (802) 479-1345 5/20/2015
States where Vermont 2009 High School Graduates Completed Postsecondary Degree


![II* þ ˆ x þ x (š ˆ æ ˙ î ˝ % ( ) &ž È È ÿü Ž£ÿÿÿùL ü ÿ,Ëï ´j ...legislature.vermont.gov/assets/Documents/2016/WorkGroups...Q 1 å×ô kJí]/ ÓTé82Ÿ¢ù„J](https://img.pdfslide.net/doc/110x75/5aab44a77f8b9a8d678ba1b9/ii-x-x-s-z-zl-j-1-kj-t82yj-ad-oasmo.jpg)