Embed Size (px)
Citation preview

Regional Workshops: AppendicesVermont’s Energy Future
November 2007
RAAB ASSOCIATES, LTD.
www.RaabAssociates.org
with
www.cbuilding.org

Table of Contents
AppendicesAppendix A: Regional Workshop AttendeesAppendix B: Polling Results by LocationAppendix C: Distributions on Select Polling QuestionsAppendix D: Meeting SummariesAppendix E: Regional Workshop Background DocumentAppendix F: Regional Workshop Background Document Appendices

Appendix A: Regional Workshop Attendees

Vermont's Energy Future, Public Workshop, St. Johnsbury School, St. Johnsbury, VT, 10-3-07PARTICPANTSLast Name First Name Home CityALPERT VERN HARDWICKAMADOR SALVADOR CORINTHAUSTIN SUE GILMANAUSTIN FRED GILMANBAKER SHARON KIRBYBARHYDT FRAN LOWER WATERFORDBERRIAN TOM DANVILLEBOSTIC DONALD ST. JOHNSBURYBOUCHARD CHRIS LYNDONVILLEBRISTOL BARBARA SHEFFIELDBROUHA PAUL SUTTONBROWN NANCY EAST BURKECARLSON LINDA E. ST. JOHNSBURYCOPPENRATH GEORGE BARNETDALOZ JUDY ST. JOHNSBURYDASCENSIO FRANK EAST BURKEDESROCHERS LINDA ST. JOHNSBURYDESROCHERS ROBERT ST. JOHNSBURYELLIOTT VIRGINIA EAST BURKEFERGUS CHARLES EAST BURKEFINN MARK ST. JOHNSBURYGAILLARD ANNIE WALDENGALLAGHER SUZANNE ST. JOHNSBURYGAVIN ELEANOR EAST CHARLESTONGERE MARYL NEWPORTGIBSON WILLIAM RYEGATEGILL JOCK PEACHAMGOODRICH JOHN ST. JOHNSBURYGOETZ JEREMY ST. JOHNSBURYGORELICK STEVEN WALDENGRAY ELLEN EAST BURKEGUILES TIMOTHY WILLIAMSTOWNIBEY AMANDA MONTPELIERKARP ERIKA GREENSBOROKELLY BRIAN BURKELAROCQUE LEIGH ST. JOHNSBURYLUNDE ALFRED BARREMALESKI STEVE SUTTONMOORE JAMES MONTPELIERNELSON GARET LYNDONOHAGAN PAT SHEFFIELD OWENS ADRIAN CRAFTSBURY VTPEASLEE REP. JANICE GUILDHALLPERCHLIK ANDREW MARSHFIELDPFORZHEIMER ROBERT SUTTONPOTAK NANCY GREENSBOROREGER DEBORAH CORINTHRIVERS CHRISTINE BRANDONROBINSON MARY RICHFORDROMANS PETER GREENSBOROROUDEBUSH PETER GREENSBORO
Raab Associates, Ltd and The Consensus Building Institute
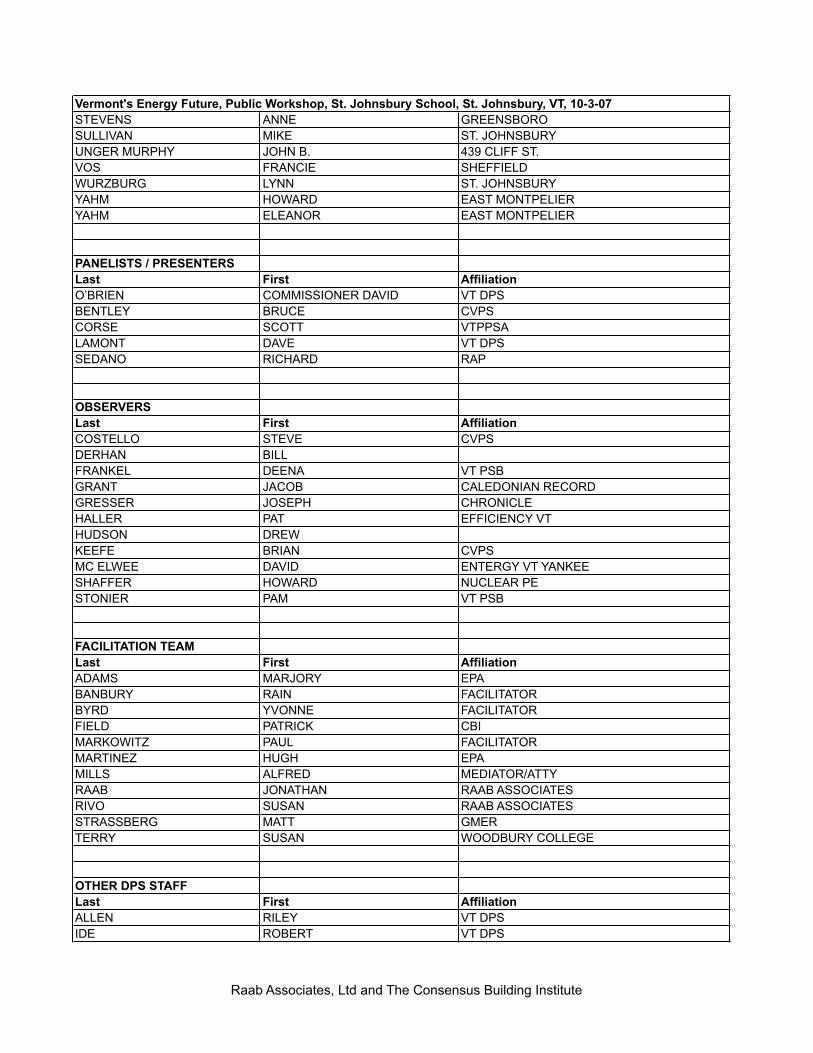
Vermont's Energy Future, Public Workshop, St. Johnsbury School, St. Johnsbury, VT, 10-3-07STEVENS ANNE GREENSBOROSULLIVAN MIKE ST. JOHNSBURYUNGER MURPHY JOHN B. 439 CLIFF ST.VOS FRANCIE SHEFFIELDWURZBURG LYNN ST. JOHNSBURYYAHM HOWARD EAST MONTPELIERYAHM ELEANOR EAST MONTPELIER
PANELISTS / PRESENTERSLast First AffiliationO’BRIEN COMMISSIONER DAVID VT DPSBENTLEY BRUCE CVPSCORSE SCOTT VTPPSALAMONT DAVE VT DPSSEDANO RICHARD RAP
OBSERVERS Last First AffiliationCOSTELLO STEVE CVPSDERHAN BILLFRANKEL DEENA VT PSBGRANT JACOB CALEDONIAN RECORDGRESSER JOSEPH CHRONICLEHALLER PAT EFFICIENCY VTHUDSON DREWKEEFE BRIAN CVPSMC ELWEE DAVID ENTERGY VT YANKEESHAFFER HOWARD NUCLEAR PESTONIER PAM VT PSB
FACILITATION TEAMLast First AffiliationADAMS MARJORY EPABANBURY RAIN FACILITATORBYRD YVONNE FACILITATORFIELD PATRICK CBIMARKOWITZ PAUL FACILITATORMARTINEZ HUGH EPAMILLS ALFRED MEDIATOR/ATTYRAAB JONATHAN RAAB ASSOCIATESRIVO SUSAN RAAB ASSOCIATESSTRASSBERG MATT GMERTERRY SUSAN WOODBURY COLLEGE
OTHER DPS STAFFLast First AffiliationALLEN RILEY VT DPSIDE ROBERT VT DPS
Raab Associates, Ltd and The Consensus Building Institute

Last Name First Name Home CityADAMS WALTER ESSEX TOWNALDEBORGH TJARK BURLINGTONASERMILY LAURA MIDDLEBURYAUSTIN JULIA HUNTINGTONBARSOTTI MICHAEL BURLINGTONBASSETT ALICE SHELBURNEBAKAL TIM S. BURLINGTONBELYEA MICHAEL BURLINGTONBENES JOSHUA JERICHOBIJUR ANNE CHARLOTTEBOOMHOWER MICHELE GEORGIABOUFFARD RODNEY ESSEX JCTBOWER STEVE RICHMONDBOYAN STEVE BURLINGTONBOYAN KITTY BURLINGTONBRAULT MARGARET SO. BURLINGTONBROWN SUZANNA GEORGIABROWN GREG COLCHESTERBROWNLEE DANYELLE RICHMONDBURGESS DARLA UNDERHILLBUSHEY JORDAN BERLINCAINE JON BURLINGTONCALLAN JOHN WATERBURY CENTERCANNON ALISON BURLINGTONCARLSON MELISSA BURLINGTONCARTER RACHEL BURLINGTONCARY LAURA SOUTH BURLINGTONCASSIDY MICHAEL S. BURL.CATALANO ANGELINA BURLINGTONCHANT ELIZABETH COLCHESTERCHICKERING KAREN SO BURLINGTONCHICOINE JOEL CAMBRIDGECINADR II MATTHEW WILLISTONCLARKE VIRGINIA RICHMONDCOLE JOANNA BURLINGTONCONSTANTINEAU DONNA HINESBURG, VTCRIMMINS HOLLY BURLINGTONCROWLEY STEPHEN SOUTH BURLINGTONDAVIS CATHERINE JERICHODEVINS ROBERT ESSEXDIERSCH CHERYL SHELBURNEEATON DAVE JERICHOFEHRS JEFF WILLISTONFERLAND BRAD ST. ALBANSFLASH SERRILL BURLINGTONFLETCHER DAWN BURLINGTONFORENZA ROBERT S. HeroFORWARD JEFF RICHMONDGARDNER CASSY BURLINGTONGILBERT MAURINE SOUTH BURLINGTON, VTGIORDANO JENNIFER BURLINGTONGLASPIE BETH ESSEX JUNCTIONGORDESKY BEN BURLINGTONGORDON CHRIS BURLINGTONHALL AARON BURLINGTON
Vermont's Energy Future, Public Workshop, Tuttle Middle School, South Burlington, VT, 10/17/2007 PARTICIPANTS
Raab Associates, Ltd and The Consensus Building Institute

Vermont's Energy Future, Public Workshop, Tuttle Middle School, South Burlington, VT, 10/17/2007 HAMILTON BLAIR BURLINGTONHARDY BETSY S. BURLINGTONHEAD HELEN SOUTH BURLINGTONHEATH MARTHA WESTFORDHEFFERNAN PAT SHELBURNEHENGELSBERG TOM CHARLOTTEHILDEBRAN JAMES HUNTINGTONHOOPES TIM HINESBURGHORN KAREN MORETOWNHULBERT JOHN BARREHUNT ALLAN SOUTH BURLINGTONINNES CLARE COLCHESTERJENKINS WALLY HUNTINGTONJOEL PETERANNE RICHMONDJOHNSON DAVID SHELBURNEKEENAN REP. KATHLEEN ST. ALBANSKENNEDY JEANNE SOUTH BURLINGTONLEAS JAMES SOUTH BURLINGTONLEBAN DONNA SOUTH BURLINGTONLENES JOAN SHELBURNELETOURNEAU ANDREW MONKTONLEVERONI JACQUELINE BURLINGTONLEVIN MATT MONTPELIERLINNEBUR ADAM BRISTOLLINNEBUR HEIDI BURLINGTONLOSITO NICK BURLINGTONLOUGHNER KARL ESSEX JUNCTIONMANDEL ZOHN BURLINGTONMANGIONE ZACH BURLINGTONMANNING DOUG LOWELLMASTROIANNI KEVIN BURLINGTONMAXON DAN ESSEX JCT.MCNARY BOB FERRISBURGHMCRAE GLENN COLCHESTERMELLINGER DAN ESSEXMENDOCINO JEROME JERICHOMERRELL ERIKA BURLINGTONMICHAEL PATRICK BURLINGTONMILES BRIAN BURLINGTONMILLER RON CHARLOTTEMORGAN MARCY SO. BURLINGTONMORGAN DONALD SO. BURLINGTONMOSS PETER FAIRFAXMOTAZE BELINDA SOUTH BURLINGTONMOTT GARRET BUELS GORENELSON ELISA BURLINGTONNOLAN KEN MILTONNORRMANDIN JON BURLINGTONOBRIEN SHEA BURLINGTONONEILL PAT WESTFIELDOROURKE MEGHAN BURLINGTONOSLER EVAN BURLINGTONPALUBA VIOLET COLCHESTERPATTEN WILL HINESBURGPAULEY MITCH BURLINGTONPIDGEON ELIZABETH SHOREHAMPIERSON DIANNE BURLINGTON
Raab Associates, Ltd and The Consensus Building Institute

Vermont's Energy Future, Public Workshop, Tuttle Middle School, South Burlington, VT, 10/17/2007 PIPER TOM SOUTH BURLINGTONPURCELL ROBERT GEORGIARAAP WILL SHELBURNERAMSEY JEFF SOUTH BURLINGTONREED CHARLOTTE UNDERHILLREISS CHARLES HINESBURGRENDALL DON S. BURLINGTONRIDGE ARTHUR CHARLOTTEROBBINS JESSE BURLINGTONRUBIN CYNTHIA BURLINGTONRYDER KAREN SOUTH BURLINGTONSACHS DEBRA SO. BURLINGTONSARAH SEAN MONTPELIERSCUDERI STEPHEN BURLINGTONSEIFERT NICK JEFFERSONVILLESHAPIRO ELLEN SO. BURLINGTONSHUTE CHRISTA SHELBURNESLOTE STU HINESBURGSMITH R PAUL BURLINGTONSMITH SPENCER BURLINGTONSPENGLER KRISTY COLCHESTERSPENGLER JEFF COLCHESTERSOPHER RAE BURLINGTONSPIEGEL ERICA BURLINGTONST GEORGE MONIQUE WILLISTONSTEIN DANIEL ESSEX JUNCTIONSTEINERT III ROBERT J. BURLINGTONSTRADNIC VLADIMIR SHELBURNESTUCKER DOV BURLINGTONSULLIVAN MARY BURLINGTONSULLIVAN DAN HINESBURGTURSI ALEXANDRA ESSEX JUNCTIONUSHER DAVID COLCHESTERWACEK DOUGLAS BURLINGTONWALSKEKY AL W. BERKSHIREWARD SARAH BURLINGTONWATTS RICHARD HINESBURGWATTS ANDREW ESSEX TOWNWHITE GARY ST ALBANSWHITNEY JOHN SAINT ALBANSWINSLOW MIKE VERGENNESWOLAVER MORGAN MIDDLEBURYZENIE JOHN COLCHESTERZIGMUND SEAN BURLINGTON
PANELISTS / PRESENTERSLast First AffiliationO’BRIEN COMMISSIONER DAVID VT DPSLAMONT DAVE VT DPSSEDANO RICHARD RAPGRIFFIN BOB GMPIRVING JOHN BED
OBSERVERS Last First Affiliation
Raab Associates, Ltd and The Consensus Building Institute

Vermont's Energy Future, Public Workshop, Tuttle Middle School, South Burlington, VT, 10/17/2007 CALLAN ISIAHCALLAN GRACECALLAN JOSEPHCOSTELLO STEVE CVPSDAVIS BOB WCAXDUFFY KATE WCAXFRANKEL DEENA VT PSBHALLQUIST DAVID VT ELECTRIC CO-OPRIVERS CHRISTINE CVPSSHAFFER HOWARD NUCLEAR PESTONIER PAM VT PSBYORK JEFFWHEELER MARCI RUTLAND ECON DEVELOPMENT
FACILITATION TEAMLast First AffiliationADAMS MARJORY EPABANBURY RAIN BCJCBENTLEY BRUCE CVPSBIRKHOFF JULIANA CBIBOWMAN BILL VEICBUCKLEY TOM BEDBYRD YVONNE MCJCFIELD PATRICK CBIGOULD EMILY MEDIATOR / ATTORNEYHALLER CHRIS PLACE MATTERSMARKOWITZ PAUL FACILITATORMARTINEZ HUGH EPAMILLS ALFRED MEDIATOR / ATTORNEYMOSKAL JOHN EPAMURPHY JIM FACILITATORPARROW DIANE VEICRAAB JONATHAN RAAB ASSOCIATESRIVO SUSAN RAAB ASSOCIATESSCHNURE DOROTHY GMPSCHWEISBERG MATT EPASIMOLLARDES EILEEN VT GAS SYSTEMSSMITH DOUG GMPSTRASSBERG MATT GMERTERRY SUSAN WOODBURY COLLEGETONKIN ELLIE EPA
OTHER DPS STAFFLast First AffiliationALLEN RILEY VT DPSIDE ROBERT VT DPSWARK STEVE VT DPS
Raab Associates, Ltd and The Consensus Building Institute

Last Name First Name Home CityALDRICH BRAD MONTPELIERATCHINSON BOB PLAINFIELDAUSTIN JULIA HUNTINGTONBAEHR AMOS WORCESTERBALLOU RAYMOND ROYALTONBARG LORI PLAINFIELDBELENKY MARY MARSHFIELDBEST ERIC BRAINTREEBISOGNO MICHAEL BURLINGTONBRIGHT RANDY MONTPELIERBROOKS KAREN MONTPELIERBROWN PAUL NORTHFIELDBRUCE NANCY E.MONTPELIERBUCHANAN BECKY PLAINFIELDCARBINE CHARITY WOLCOTTCLARKSON BRENDA DUXBURYCOHEN ANDREA MONTPELIERCOLYER BRADFORD STOWECRIFO HOPE MIDDLESEXCURTIS-MURPHY EMILY JOHNSONCZAPLINSKI RICHARD ADAMANTDAYE KATHLEEN WATERBURYDELATTRE SUSAN RANDOLPHDERRYBERRY DENNIS WAITSFIELDDOELGER BILL MONTPELIERDONAHUE ANNE NORTHFIELDEDGERLY JESSICA MONTPELIERELIAS JEANNE FAYSTONELMER PEG CABOTENGLAND GAIL CALAISESSELSTYN ERIC N. MONTPELIERETKIND NORM WOODBURYETNIER CARL MONTPELIERFAJARDO NATALIA MONTPELIERFARNHAM STEVEN PLAINFIELDFITZGERALD BRIAN DUXBURYFORCIER RICHARD MONTPELIERGARRETT TOSSY NORTHFIELDGLEASON ERIC HARTLANDGOLDFARB MITCH MONTPELIERGRUNDY JIM E.MONTPELIERHAAS BUD BRADFORDHAFNER MARTHA RANDOLPH CTRHAGEN KIMBERLY N. MIDDLESEXHORNBLAS AMY CABOTHUTCHINSON EDWARD PLAINFIELDIRONS ZACKARY BERLINJOHNSON DAVID WOODBURYJOHNSON KERRICK N. MIDDLESEXJONES KENNETH MONTPELIERKEEFE BRIANKELMAN ANITA WEST BROOKFIELDKIMBELL STEPHEN TUNBRIDGEKRAUTH RON MIDDLESEXKRAUTH ANITA MIDDLESEX
Vermont's Energy Future, Public Workshop, Montpelier Elks Club, Montpelier, VT, 10/18/2007 PARTICIPANTS
Raab Associates Ltd and The Consensus Building Institute

Vermont's Energy Future, Public Workshop, Montpelier Elks Club, Montpelier, VT, 10/18/2007 LABOSSIERE JEFF WESTFORDLACKEY LARRY STOWELANGDON J.D. STOWELAROSA LEILA LYNDONVILLELEWIS DIANE SHAFTSBURYMARONI CAROL CRAFTSBURYMARSH DUANE BARREMARTIN HELENE STOWEMATTHEWS SAM MONTPELIERMATTHEWS KIP EAST MONTPELIERMCDONALD PATRICIA BERLINMILLER GRAHAM MONTPELIERMILLER BETTY MONTPELIERMOORMAN JESSE MONTPELIERMOREY BOB E. MONTPELIERNEWCOMB PENELOPE CHARLESTONNICHOL LUCYNISSEN KARIN MONTPELIERNOTTERMANN NANCY E. HARDWICKPEROT KINNY WARRENPETTY PHILIP BARREPUGLISI MARIA RANDOLPHRADER CATHERINE EAST MONTPELIERRAE JOAN FAYSTONRAY MARK SHELBURNEREED FRANK RANDOLPH CENTERRESSLER JANET MONTPELIERROBECHEK CARA MONTPELIERROTH PETER H. QUECHEERUSSELL-STORY ERIN WARRENSAMMET LISA CRAFTSBURYSANDERS WALTER S. BURLINGTONSAUER KATHLEEN WEST BROOKFIELDSAWYER SCOTT MONTPELIERSCHUYLER SONJA JERICHOSHOULDICE BANFIELD SHAWN MONTPELIERSIPPLE PAUL FAYSTONSNOW RUSSELL WATERBURY CENTERSTOLEROFF DEBRA PLAINFIELDSTRONG CHRIS STOWESUITOR CAROLJEAN NORTHFIELDSUITOR RICHARD NORTHFIELDTHAYER ALEXANDRA PLAINFIELDTHOMAS COLLEEN WARRENTOKAR BRIAN E. MONTPELIERVAN DER DOES PETER BELLOWS FALLS , VTWALKER ROBERT THETFORD CENTERWALL JOHN NORTHFIELDWALRAFEN JANICE PLAINFIELDWASHBURN DORIS E. MONTPELIERWASSERMAN NANCY MONTPELIERWHITE WILLIAM BROOKFIELDWHITNEY CLAY E CALAISWICKENDEN MICHAEL HYDE PARKWILSCHEK JOSLYN MONTPELIERWOLFE JEFFERY WHITE RIVER JUNCTIONWOOD LEA MONTPELIER
Raab Associates Ltd and The Consensus Building Institute

Vermont's Energy Future, Public Workshop, Montpelier Elks Club, Montpelier, VT, 10/18/2007 WRIGHT ROBERT RANDOLPHYOUNG MARCI MORRISVILLEYOUNG SUSAN S. BURLINGTON
PANELISTS / PRESENTERSLast First AffiliationO’BRIEN COMMISSIONER DAVID VT DPSGRIFFIN BOB GMPLAMONT DAVE VT DPSSEDANO RICHARD RAP
OBSERVERS Last First AffiliationBISHOP ANN VT PSBCOSTELLO STEVE CVPSDOYLE BILL STATE LEGISLATURE? THERE 10 MINUTESDOYLE MIKE SONFRANKEL DEENA VT PSBFRENCH PATSY STATE LEGISLATUREHALLQUIST DAVEJONES KENWALDSTEIN SANDRA
FACILITATION TEAMLast First AffiliationBANBURY RAIN BCJCBIRKHOFF JULIANA CBIBYRD YVONNE MCJCFIELD PATRICK CBIHALLER CHRIS PLACE MATTERSLEWIS CINDY EPAMARKOWITZ PAUL MEDIATOR MILLS ALFRED MEDIATOR/ATTYMURPHY JIM EPARAAB JONATHAN RAAB ASSOCIATESRIVO SUSAN RAAB ASSOCIATESSCHWEISBERG MATT EPASIMOLLARDES EILEEN VT GAS SYSTEMSSMITH DOUG GMPSTRASSBERG MATT GMERTONKIN ELLIE EPAWHYTE HELEN FACILITATOR
OTHER DPS STAFFLast First AffiliationALLEN RILEY VT DPSHOFFMANN SARAH VT DPSIDE ROBERT VT DPSPARISEAU TAMARA VT DPSPARUSH SUSAN VT DPSSMITH RICHARD VT DPSWARK STEVE VT DPS
Raab Associates Ltd and The Consensus Building Institute
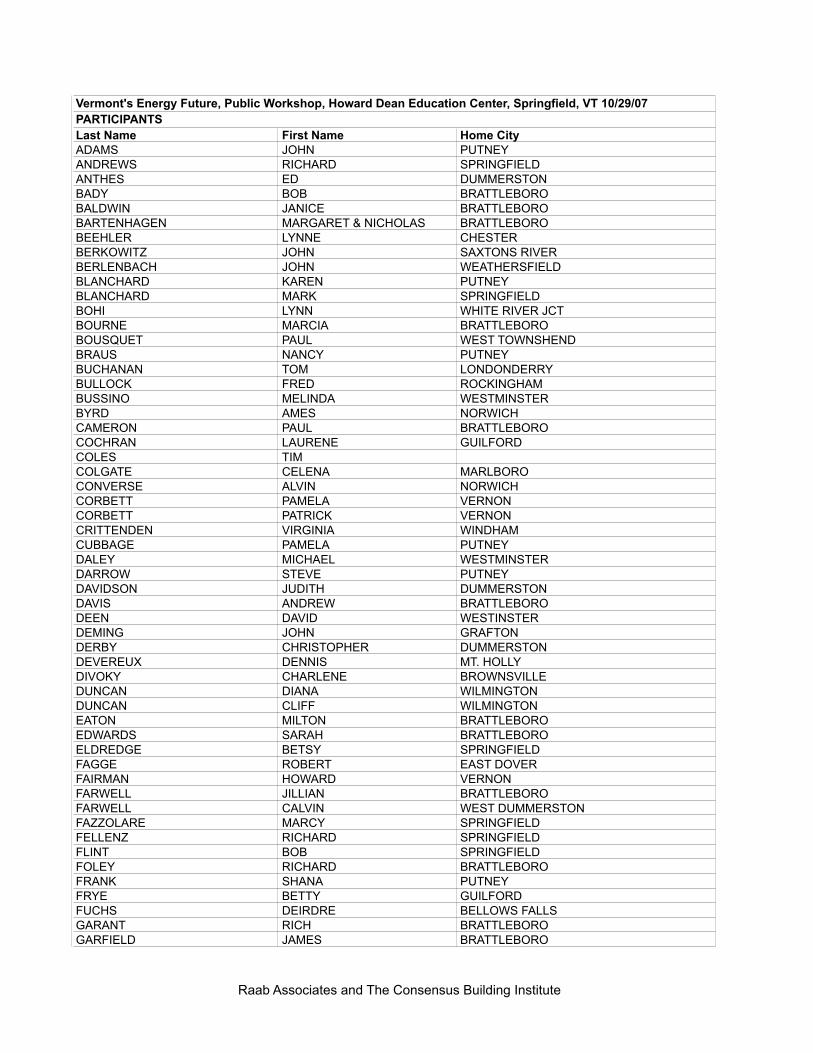
Last Name First Name Home CityADAMS JOHN PUTNEYANDREWS RICHARD SPRINGFIELDANTHES ED DUMMERSTONBADY BOB BRATTLEBOROBALDWIN JANICE BRATTLEBOROBARTENHAGEN MARGARET & NICHOLAS BRATTLEBOROBEEHLER LYNNE CHESTERBERKOWITZ JOHN SAXTONS RIVERBERLENBACH JOHN WEATHERSFIELDBLANCHARD KAREN PUTNEYBLANCHARD MARK SPRINGFIELDBOHI LYNN WHITE RIVER JCTBOURNE MARCIA BRATTLEBOROBOUSQUET PAUL WEST TOWNSHENDBRAUS NANCY PUTNEYBUCHANAN TOM LONDONDERRYBULLOCK FRED ROCKINGHAMBUSSINO MELINDA WESTMINSTERBYRD AMES NORWICHCAMERON PAUL BRATTLEBOROCOCHRAN LAURENE GUILFORDCOLES TIMCOLGATE CELENA MARLBOROCONVERSE ALVIN NORWICHCORBETT PAMELA VERNONCORBETT PATRICK VERNONCRITTENDEN VIRGINIA WINDHAMCUBBAGE PAMELA PUTNEYDALEY MICHAEL WESTMINSTERDARROW STEVE PUTNEYDAVIDSON JUDITH DUMMERSTONDAVIS ANDREW BRATTLEBORODEEN DAVID WESTINSTERDEMING JOHN GRAFTONDERBY CHRISTOPHER DUMMERSTONDEVEREUX DENNIS MT. HOLLYDIVOKY CHARLENE BROWNSVILLEDUNCAN DIANA WILMINGTONDUNCAN CLIFF WILMINGTONEATON MILTON BRATTLEBOROEDWARDS SARAH BRATTLEBOROELDREDGE BETSY SPRINGFIELDFAGGE ROBERT EAST DOVERFAIRMAN HOWARD VERNONFARWELL JILLIAN BRATTLEBOROFARWELL CALVIN WEST DUMMERSTONFAZZOLARE MARCY SPRINGFIELDFELLENZ RICHARD SPRINGFIELDFLINT BOB SPRINGFIELDFOLEY RICHARD BRATTLEBOROFRANK SHANA PUTNEYFRYE BETTY GUILFORDFUCHS DEIRDRE BELLOWS FALLSGARANT RICH BRATTLEBOROGARFIELD JAMES BRATTLEBORO
Vermont's Energy Future, Public Workshop, Howard Dean Education Center, Springfield, VT 10/29/07PARTICIPANTS
Raab Associates and The Consensus Building Institute
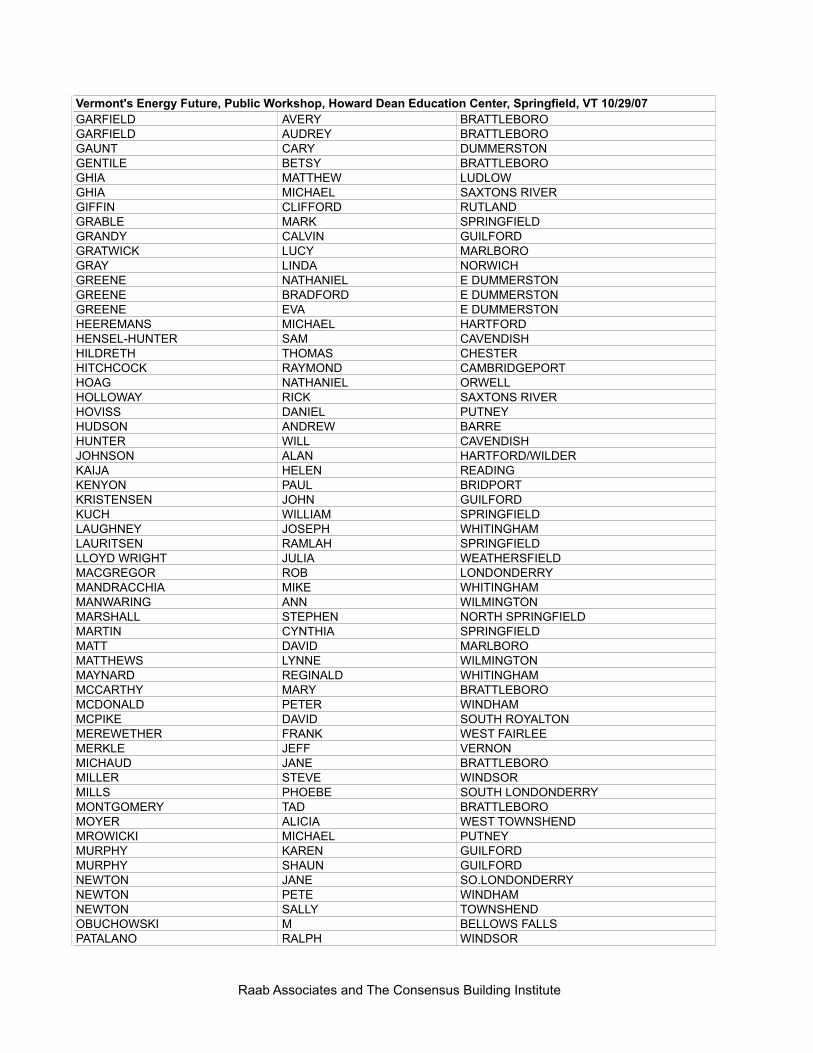
Vermont's Energy Future, Public Workshop, Howard Dean Education Center, Springfield, VT 10/29/07GARFIELD AVERY BRATTLEBOROGARFIELD AUDREY BRATTLEBOROGAUNT CARY DUMMERSTONGENTILE BETSY BRATTLEBOROGHIA MATTHEW LUDLOWGHIA MICHAEL SAXTONS RIVERGIFFIN CLIFFORD RUTLANDGRABLE MARK SPRINGFIELDGRANDY CALVIN GUILFORDGRATWICK LUCY MARLBOROGRAY LINDA NORWICHGREENE NATHANIEL E DUMMERSTONGREENE BRADFORD E DUMMERSTONGREENE EVA E DUMMERSTONHEEREMANS MICHAEL HARTFORDHENSEL-HUNTER SAM CAVENDISHHILDRETH THOMAS CHESTERHITCHCOCK RAYMOND CAMBRIDGEPORTHOAG NATHANIEL ORWELLHOLLOWAY RICK SAXTONS RIVERHOVISS DANIEL PUTNEYHUDSON ANDREW BARREHUNTER WILL CAVENDISHJOHNSON ALAN HARTFORD/WILDERKAIJA HELEN READINGKENYON PAUL BRIDPORTKRISTENSEN JOHN GUILFORDKUCH WILLIAM SPRINGFIELDLAUGHNEY JOSEPH WHITINGHAMLAURITSEN RAMLAH SPRINGFIELDLLOYD WRIGHT JULIA WEATHERSFIELDMACGREGOR ROB LONDONDERRYMANDRACCHIA MIKE WHITINGHAMMANWARING ANN WILMINGTONMARSHALL STEPHEN NORTH SPRINGFIELDMARTIN CYNTHIA SPRINGFIELDMATT DAVID MARLBOROMATTHEWS LYNNE WILMINGTONMAYNARD REGINALD WHITINGHAMMCCARTHY MARY BRATTLEBOROMCDONALD PETER WINDHAMMCPIKE DAVID SOUTH ROYALTONMEREWETHER FRANK WEST FAIRLEEMERKLE JEFF VERNONMICHAUD JANE BRATTLEBOROMILLER STEVE WINDSORMILLS PHOEBE SOUTH LONDONDERRYMONTGOMERY TAD BRATTLEBOROMOYER ALICIA WEST TOWNSHENDMROWICKI MICHAEL PUTNEYMURPHY KAREN GUILFORDMURPHY SHAUN GUILFORDNEWTON JANE SO.LONDONDERRYNEWTON PETE WINDHAMNEWTON SALLY TOWNSHENDOBUCHOWSKI M BELLOWS FALLSPATALANO RALPH WINDSOR
Raab Associates and The Consensus Building Institute

Vermont's Energy Future, Public Workshop, Howard Dean Education Center, Springfield, VT 10/29/07PEARSON WILLIAM BRATTLEBOROPEASE-GRANT RICHARD CHESTERPELLETT KATHY CHESTERPENNIMAN WILLIAM BRATTLEBOROPETERSON JEEM HARTLANDPOST IRWIN CHESTERPOST MELISSA CHESTERRASMUSSEN JASON ASCUTNEYRAYMOND NORMAND PUTNEYREED-SAVORY GEORGE BRATTLEBORO RIVERS MARK BRATTLEBOROROBERTSON DAN BRIDGEPORTROSENGRANT KARL SPRINGFIELDRYDJESKI DENIS SPRINGFIELDSACHS GARY BRATTLEBOROSCHAEFER JOHN BRATTLEBOROSCHIFO ROSS PITTSFORDSCHULZE DEB SPRINGFIELDSCHULZE WILLIAM NORTH SPRINGFIELDSCHWARZ JANET BRATTLEBOROSCHWARZ WALTER BRATTLEBOROSCUDDER HERVEY BRATTLEBOROSHAND REP. ERNEST WEATHERSFIELDSICKEN DANIEL DUMMERSTONSIMMONS CHAD BRATTLEBOROSIMON THOMAS WILMINGTONSMALLHEER SUSAN SPRINGFIELDSMITH KEN SPRINGFIELDSMITH ANDREW BELLOWS FALLSSONNTAG JANE BRATTLEBOROSPRUYT FRIC BRATTLEBOROSTACK JAMES ANDOVERSTANDER ANDREA MONTPELIERSTEAD CRAIG PUTNEYSTEAD ELIZABETH PUTNEYSTEVENS ERIC GRAFTONTAYLOR CATHERINE SPRINGFIELDTENNEY ELLEN SAXTONS RIVERTERAMI SCOTT TUNBRIDGETHEISSEN RONALD ANDOVERTITCOMB JONATHAN ASCUTNEYTURNAS KATHRYN BRATTLEBOROUNSICKER JEFF DUMMERSTONVANASSE NORMAN LUDLOWWATKINS RACHEL N. SPRINGFIELDWETHERELL KAREN SPRINGFIELDWHITACRE MARLENE GRAFTONWHITCOMB HALLIE SPRINGFIELD, VTWHITMAN JOHN READSBOROWILBUR SANDRA SOUTH LONDONDERRYWILBUR JAMES SOUTH LONDONDERRYWILLIAMS ELIZABETH PUTNEYWILSON CLAIRE PUTNEYWINSLOW DAVE SPRINGFIELD
PANELISTS / PRESENTERS
Raab Associates and The Consensus Building Institute

Vermont's Energy Future, Public Workshop, Howard Dean Education Center, Springfield, VT 10/29/07Last First AffiliationO’BRIEN COMMISSIONER DAVID VT DPSLAMONT DAVE VT DPSBENTLEY BRUCE CVPSRICHARDS PATTY VT PPSA
OBSERVERS Last First AffiliationBISHOP ANN VT PSBBUSTARD DAN EAGLE TIMESCOSTELLO STEVE CVPSEMMONS ALICEFLETCHER SARAHFRANKEL DEENA VT PSBHEINTZ PAUL BRATTLEBORO REFORMERMATTEAU JAMES WINDHAM REGIONAL COMMISSIONRIVERS CHRISTINE CVPS
FACILITATION TEAMLast First AffiliationBANBURY RAIN BCJCBEDINGER LINSA CVPSHARVEY KATE CBIBYRD YVONNE MCJCEDMONDSON LUCY EPAFIELD PATRICK CBIGALLOWAY WALT EPAGROSS GLENN FACILITATORGRUBER JIM FACILITATORHITTLE JOCELYN PLACE MATTERSHOYT JULIANA FACILITATORMARKOWITZ PAUL FACILITATORMILLS ALFRED MEDIATOR/ATTYMOORE KATHLEEN FACILITATORMURPHY JIM EPARAAB JONATHAN RAAB ASSOCIATESRIVO SUSAN RAAB ASSOCIATESSCHWEISBERG MATT EPASEFTEL JOSEPH FACILITATORSIMPSON ANDREA EPASTRASSBERG MATT GMERTERRY SUSAN WOODBURY COLLEGETONKIN ELLIE EPAWHYTE HELEN FACILITATOR
OTHER DPS STAFFLast First AffiliationALLEN RILEY VT DPSIDE ROBERT VT DPSWARK STEVE VT DPS
Raab Associates and The Consensus Building Institute

Last Name First Name Home CityACINAPURA JOE BRANDONADAMS J.Q. SCOTT RUTLANDANDERSON CAROLYN RUTLAND TOWNANDREWS PEGARMIENTO RYAN CASTLETONARSENEAULT NORMAN GRANVILLE, VTAULT RAY PROCTORBAIR JEANNETTE HANCOCKBAKER ED N CLARENDON VTBALD MICHAEL ROYALTONBARBER KAREN BENSONBATES REBECCA SHREWSBURYBETTS ALAN PITTSFORDBIZAOUI-COLE ERICA PLYMOUTHBLITTERSDORF JOHN N. CHITTENDENBLUCHER MARK DANBYBLUCHER HOPE DANBYBONAFINE JULIA RUTLANDBOSSEN JOE POULTNEYBOTZOW RUTH POWNALBOTZOW BILL POWNALBOWMAN DUSTIN CANTON, NYBRETON NIKKI RUTLANDBRETON JAMES RUTLANDBRIGHAM DICK CUTTINGSVILLE, VTBROWN MEI MEI BRANDONBUCHAN ROBERT RUTLANDBUGEL LEONARD S LONDONDERRYBURNS JEANNE LUDLOWCALFEE WILLIAM DORSETCARRIS WILLIAM RUTLANDCATER JAMES RUTLANDCHIARELLO MARCELLA SHELBURNECHIARELLO CHRIS SHELBURNECLAYTON CYNTHIA MIDDLETOWN SPRINGSCLAYTON PEPPER MIDDLETOWN SPRINGSCONRAD ROSS MIDDLEBURYCONSOLINO TOM WILMINGTONCOPPOCK DAVE RUTLANDCOUGHLIN HAL CENTER RUTLANDDANSEREAU NATHAN PITTSFORDDANSEREAU LINDA PITTSFORDDARLING SCOTT SHREWSBURYDEBOER BRAD BENNINGTONDEWEY MARY POULTNEYDOANE TUTHILL BRAINTREEDONAHUE TOM RUTLANDDUKE LANI RUTLANDDUPONT JULIE PLYMOUTHEBERHARDT SILVIO POWNAL
Vermont's Energy Future, Public Workshop, Holiday Inn Rutland, Rutland, VT 10/30/07PARTICIPANTS
Raab Associates, Ltd and The Consensus Building Institute

Vermont's Energy Future, Public Workshop, Holiday Inn Rutland, Rutland, VT 10/30/07ECKHARDT SUSAN RUTLAND TOWNFANNIN MICHAEL TINMOUTHFARNHAM NATHANIEL CHITTENDENFRESSIE FRANK POULTNEYGANDIN CHRIS PITTSFORDGARLAND CATHERINE CASTLETONGEPHART JEFFREY ROCHESTERGLODZIK BETHANY RUTLANDGRAFFAM JOANN RUTLANDHAND JIM DORSETHARRISON JIM CHITTENDENHARVEY GEORGE BRATTLEBOROHODULIK MIKE KILLINGTONHOOPES DAVID LONDONDERRYHORROCKS TOM RUTLANDHOWLAND ROB PITTSFORDHUMPHREY MELINDA CHITTENDENHUNTER SHERMAN RUTLANDHUNTER PAT RUTLANDIOBINO RALPH E. WALLINGFORDJACKSON CYNTHIA RANDOLPHJACKSON JOHN RANDOLPHKAUFFMANN TOM LONDONDERRYKELLY TARA MIDDLETOWN SPRINGSKEUNE TIFFANY RUTLANDKIEFABER KEVIN CENTER RUTLANDKING BRAD RUTLANDKIRBY LAWRENCE RUTLANDKREVETSKI KATHY RUTLANDKREVETSKI WAYNE RUTLANDKROHN LEE MANCHESTER CENTERLAFOREST DEAN W. RUTLANDLAPP ERIC RUTLANDLETENDRE STEVEN MIDDLETOWN SPRINGSLEWIS SUSAN BENNINGTONLIERMAN BRUCE N BENNINGTONLINCOLN ROBERT RUTLANDMACAULAY TOM RUTLANDMACCARTY THOMAS MIDDLETOWN SPRINGSMALCOLM REPRESENTATIVE JOHN PAWLETMANARAS KATIE LINCOLNMARMER SUSAN DORSETMCCAUGHIN MARTHA E. MIDDLEBURYMCCORMICK CHARLES RUTLANDMCNAMARA BILL CAVENDISHMCPIKE DAVID S. ROYALTONMCVEIGH SCOTT RUTLANDMILKEY GINI BRATTLEBOROMILLETTE PAUL BENSONMOORE AMY POWNALMOORE JACK RUTLANDMYERS PAUL PERU
Raab Associates, Ltd and The Consensus Building Institute

Vermont's Energy Future, Public Workshop, Holiday Inn Rutland, Rutland, VT 10/30/07NELSON FRANK WEST PAWLET (OFFICE)NEWCOMB MARC FAIR HAVEN VTOBRIEN MICHAEL WEST RUTLANDORSBURN COLLEEN BELLOWS FALLSPAHL GREG WEYBRIDGEPAISON JAMES RUTLANDPARKER RAMONA CHITTENDENPERKINS THELMA RUTLAND CITYPERKINS ROBERT RUTLAND CITYPICTON KEN BENNINGTONPIERC DEAN MIDDLEBURYPIERCE PHILIP J MIDDLEBURYPIOTROWSKI CHARLES WALLINGFORDPOTTER DAVE CLARENDONPOTTS CEDAR POULTNEYPRESUME HANTZ PITTSFORDPRINTZ SCOTT BENNINGTONPULCER RONALD RUTLAND TOWNPURCELL VAN CHITTENDENPURCELL LISA CHITTENDENRICE NANCY RANDOLPH CENTERRIZZY BECKY RUTLANDROBERTS KENNETH RUTLANDROME JOSHUA DANBYRYAN BILL WEST RUTLANDSAGI DAVID RUTLANDSAUNDERS GEORGE BRANDONSCHWIEBERT EDWARD RUTLANDSCOVIL BEAR MANCHESTERSHARKEY JIM BENNINGTONSIGURDSON RODSILVER MORRIS BENSONSLABAUGH RONALD MIDDLEBURYSMECKER FRANK RICHMONDSMITH ANNETTE DANBYSPAFFORD BRENDA CASTLETONSPENCER JOHN BONDVILLESPOONER BETTY RUTLANDSTACOM FRANK CHITTENDENSTERNBERG P. SHAFTSBURYSTEVENS WILL SHOREHAMSTEVENS MELISSA MOUNT HOLLYSWAYZE CORNELIA TUNBRIDGESWAYZE HENRY TUNBRIDGESYMONS CALEB BENSONTADIO DON RUTLANDTEMPLE JEFF RUTLANDTERIELE JOHN CASTLETONTERRELL DAVIS SHREWSBURYTERRY JACQUELINE POULTNEYTHURLOW FRED WALLINGFORDTOD DOROTHY WARREN
Raab Associates, Ltd and The Consensus Building Institute

Vermont's Energy Future, Public Workshop, Holiday Inn Rutland, Rutland, VT 10/30/07TURNBULL CLAY TOWNSHENDWALLETT ANDREW RUTLANDWALLETT SYLVIA RUTLANDWALTER LARRY RUTLANDWEBSTER BRUCE GOSHENWELCH KEN EAST WALLINGFORDWETHERBY CHRIS RUTLANDWHEATLEY KATHERINE MIDDLEBURYWHITE GREG ROCHESTERWIECHERS VICTORIA BRATTLEBOROWILLIAMS CHRIS HANCOCKWILSON DEANE RUTLANDWILTON CHUCK RUTLANDWILTON WENDY RUTLANDWYATT FRANCIS SHREWSBURYYATES DAVID PROCTOR
PANELISTS / PRESENTERSLast First AffiliationO’BRIEN COMMISSIONER DAVID VT DPSBENTLEY BRUCE CVPSLAMONT DAVE VT DPSSEDANO RICHARD RAP
OBSERVERS Last First AffiliationBODIN MADELINE JOURNALISTCOSTELLO STEVE CVPSDECHAN WILLIAMEDGAR CHARLES KILLINGTONEIRMANN CHARLIE PAWLETEIRMANN JUDIE PAWLETETTORI FRANK RUTLANDKEEFE PAM CVPSRIVERS CHRISTINE CVPSRIZZI BLSARAH SEAN VPIRG
FACILITATION TEAMLast First AffiliationBANBURY RAIN BCJCBEDINGER LISA FACILITATORBYRD YVONNE MCJCFERGUSON ONA CBIFIELD PATRICK CBIGALLOWAY WALT EPAGORDON JOSH CBIGROSS GLENNGRUBER JIM
Raab Associates, Ltd and The Consensus Building Institute

Vermont's Energy Future, Public Workshop, Holiday Inn Rutland, Rutland, VT 10/30/07HARVEY KATE CBIHITTLE JOCELYN PLACE MATTERSHOOKER-HATFIELD MOLLY FACILITATORHOYT JULIANA FACILITATORMARKOWITZ PAUL MEDIATOR MAXFIELD ANDREW CBIMILLS ALFRED MEDIATOR/ATTYMOORE KATHLEEN FACILITATORRAAB JONATHAN RAAB ASSOCIATESRIVO SUSAN RAAB ASSOCIATESSCHWEISBERG MATT EPASTEWART ART CDSCSTRASSBERG MATT GMERTERRY SUSAN WOODBURY COLLEGETONKIN ELLIE EPAWENBERG MARKWHYTE HELEN FACILITATOR
OTHER DPS STAFFLast First AffiliationALLEN RILEY VT DPSIDE ROBERT VT DPSPOOR TJ VT DPSWARK STEVE VT DPS
Raab Associates, Ltd and The Consensus Building Institute

Appendix B: Polling Results by Location

Appendix B: Polling Results by Location
Question Answer St. Johnsbury S. Burlington Montpelier Springfield Rutland AggregateHow do you identify yourself? Male 54% 60% 50% 62% 68% 60%
Female 46% 40% 50% 38% 32% 40% Which of the following best describes the highest level of education you have completed?
Less than high school 3% 1% 0% 2% 1% 1%
High school 3% 4% 3% 2% 4% 3%
Some university / college 17% 13% 10% 14% 13% 13%
University / college graduate
32% 33% 27% 31% 31% 31%
Some graduate work 17% 12% 12% 18% 15% 15% Graduate degree 28% 37% 48% 32% 35% 36% Other 0% 0% 0% 2% 1% 1% How old are you? Under 20 0% 5% 0% 3% 3% 3% 20-29 5% 13% 6% 3% 7% 7% 30-39 7% 13% 14% 6% 8% 9% 40-49 14% 22% 14% 11% 24% 18% 50-59 30% 26% 34% 35% 34% 32% 60-70 34% 18% 22% 33% 18% 24% Over 70 9% 4% 10% 9% 6% 7% Which best describes your employment status?
Self-employed 31% 19% 24% 27% 17% 23%
Government employee 5% 11% 10% 5% 10% 9% Student 0% 12% 0% 2% 7% 5% Small business (< 25) 13% 7% 6% 7% 6% 7%
Medium business (25-100)
2% 9% 6% 8% 4% 6%
Large business (> 100) 13% 12% 8% 9% 20% 13%Non-profit 0% 16% 19% 13% 15% 14%Farmer 0% 1% 4% 4% 3% 3%Retired 0% 10% 18% 19% 12% 13%
Other 36% 3% 5% 5% 6% 8% How long have you lived in Vermont? Less than 1 year 4% 4% 2% 4% 3% 3%
1 to 5 12% 10% 14% 10% 17% 13% 6 to 10 9% 12% 14% 9% 11% 11% 11 to 20 23% 20% 15% 15% 14% 17% 21 to 30 14% 20% 14% 19% 14% 17% More than 30 years 37% 32% 41% 42% 40% 39% Don’t live in Vermont 2% 1% 1% 2% 0% 1% Generally speaking, which party candidates do you generally vote for?
Democrat 37% 52% 39% 48% 46% 46%
Republican 21% 7% 16% 13% 14% 13% Independent 23% 17% 29% 17% 21% 21% Progressive 12% 13% 10% 9% 7% 10% Other 0% 3% 2% 9% 7% 5% None 7% 7% 4% 5% 5% 5%
Page 1 of 15

Appendix B: Polling Results by Location
Question Answer St. Johnsbury S. Burlington Montpelier Springfield Rutland AggregateWhich is your local electric utility? Barton Electric 2% 0% 0% 0% 0% 0%
Burlington Electric 0% 33% 0% 0% 0% 8%
Central Vermont Public Service
25% 12% 14% 68% 92% 48%
Green Mountain Power 16% 39% 36% 28% 3% 25% Vermont Electric Coop 11% 14% 3% 0% 0% 5%
Vermont Marble Power Division
0% 0% 0% 0% 1% 0%
Village of Enosburg Electric 0% 0% 0% 0% 0% 0% Village of Hardwick 11% 0% 5% 0% 0% 2%
Village of Hyde Park Electric 0% 0% 1% 0% 0% 0%Village of Jacksonville Electric 0% 0% 0% 1% 0% 0%Village of Johnson Electric 0% 0% 0% 0% 0% 0%Village of Ludlow Electric 0% 0% 0% 1% 1% 0%
Village of Lyndonville 21% 0% 0% 0% 0% 2% Village of Orleans 0% 0% 0% 0% 0% 0%
Village of Readsboro Electric 0% 0% 0% 1% 0% 0%Village of Northfield Electric 0% 0% 4% 0% 0% 1%Village of Stowe Electric 0% 0% 4% 0% 0% 1%
Village of Swanson Electric 0% 0% 0% 0% 0% 0%
Washington Electric Coop
7% 0% 21% 0% 0% 4%
Other 7% 1% 14% 2% 3% 4% Vermont should continue to purchase electricity from Hydro Quebec. Do you:
Strongly Agree 54% 52% 46% 39% 45% 47%
Somewhat Agree 31% 32% 34% 37% 32% 33%
Neither Agree nor Disagree
10% 8% 5% 12% 10% 9%
Somewhat Disagree 6% 3% 12% 7% 10% 8% Strongly Disagree 0% 4% 0% 4% 2% 2% No Opinion 0% 1% 2% 2% 1% 1% Vermont should continue to purchase electricity from the Vermont Yankee nuclear power plant. Do you:
Strongly Agree 31% 17% 15% 14% 22% 18%
Somewhat Agree 8% 13% 14% 10% 9% 11%
Neither Agree nor Disagree
4% 6% 4% 5% 6% 5%
Somewhat Disagree 8% 18% 11% 7% 15% 12% Strongly Disagree 49% 45% 55% 64% 48% 53% No Opinion 0% 1% 1% 1% 1% 1%
Over the next ten years, would you like to see Vermont ____________ the percentage of electricity it uses that comes from renewable resources?
Increase 84% 97% 97% 95% 91% 94%
Keep about the same 12% 3% 2% 4% 9% 5% Decrease 4% 0% 1% 1% 0% 1%
Page 2 of 15

Appendix B: Polling Results by Location
Question Answer St. Johnsbury S. Burlington Montpelier Springfield Rutland AggregateVermont should require that a minimum percentage of the electricity sold to Vermonters come from renewable sources. Do you:
Strongly Agree 53% 76% 70% 75% 68% 70%
Somewhat Agree 14% 8% 19% 12% 18% 14%
Neither Agree nor Disagree
8% 5% 2% 2% 5% 4%
Somewhat Disagree 8% 3% 4% 5% 3% 4% Strongly Disagree 18% 6% 4% 7% 6% 7% No Opinion 0% 2% 1% 0% 1% 1% How much more per month would you be willing to pay, if necessary, for energy that came entirely from renewable energy resources?
$0 10% 8% 6% 12% 10% 9%
$ 1 to 5 18% 6% 8% 7% 5% 8% $ 6 to 10 16% 13% 18% 13% 16% 15% $ 11 to 20 8% 20% 10% 14% 20% 16% $ 21 to 30 24% 22% 19% 15% 14% 18% $ 31 to 40 4% 2% 13% 14% 8% 8% $ 41 to 50 6% 7% 4% 6% 4% 5% $ Greater than 50 16% 22% 22% 19% 23% 21% Would you like to see the electricity used by Vermonters produced …
Entirely inside Vermont 15% 19% 35% 13% 14% 19%
Mostly inside Vermont 42% 49% 41% 52% 45% 47%
About 1/2 inside and 1/2 inside outside VT
30% 20% 15% 17% 17% 19%
Mostly outside Vermont 6% 1% 0% 2% 2% 2%
Entirely outside Vermont 0% 0% 0% 0% 0% 0%
Don’t care 8% 10% 9% 16% 23% 14%
If electricity produced inside VT were more costly than that produced outside VT using comparable resources, how much more would you be willing to pay per month as a premium for all your electricity to be generated by in-state resources?
$0 17% 13% 20% 23% 18%
$ 1 to 5 12% 11% 10% 15% 12% $ 6 to 10 19% 13% 17% 12% 15% $ 11 to 20 20% 16% 18% 23% 20% $ 21 to 30 11% 20% 18% 9% 14% $ 31 to 40 5% 2% 4% 8% 5% $ 41 to 50 4% 3% 3% 3% 3% $ Greater than 50 11% 22% 10% 6% 12%
Page 3 of 15

Appendix B: Polling Results by Location
Question Answer St. Johnsbury S. Burlington Montpelier Springfield Rutland AggregateHow strongly would you support or oppose a wind farm being built if it were visible from where you live?
Strongly Support 39% 81% 78% 69% 74% 72%
Somewhat Support 18% 9% 16% 10% 16% 13%
Neither Support nor Oppose
6% 1% 2% 7% 5% 4%
Somewhat Oppose 4% 2% 2% 3% 3% 3% Strongly Oppose 31% 5% 1% 11% 1% 7% No Opinion 2% 1% 1% 0% 1% 1% Over the next ten years, would you like to see Vermont ___________ funding for its energy efficiency program?
Increase 75% 80% 81% 87% 82% 82%
Keep about the same 12% 17% 14% 8% 13% 13% Decrease 13% 3% 5% 5% 5% 5% The rates Vermonters pay for electricity should be higher when the cost of generating it is higher and lower when the cost of generating it is lower. Do you:
Strongly Agree 52% 47% 61% 36% 44% 47%
Somewhat Agree 26% 21% 17% 30% 31% 25%
Neither Agree nor Disagree
6% 10% 2% 13% 12% 9%
Somewhat Disagree 8% 8% 11% 10% 5% 8% Strongly Disagree 4% 10% 6% 6% 6% 7% No Opinion 4% 4% 3% 5% 2% 4% On a scale of 1 to 9, where 1 = not at all concerned and 9 = extremely concerned, how concerned are you about each of the following? Not at all concerned
10% 3% 3% 8% 7% 6%
Radioactive waste from nuclear power plants
… 6% 5% 4% 5% 6% 5%
… 4% 2% 2% 4% 2% 2% … 2% 2% 1% 0% 1% 1% Middle of the 1-9 range 6% 4% 5% 6% 6% 5% … 2% 3% 4% 2% 1% 2% … 8% 12% 8% 4% 4% 7% … 4% 9% 12% 5% 8% 8% Extremely concerned 60% 60% 60% 66% 66% 63% On a scale of 1 to 9, where 1 = not at all concerned and 9 = extremely concerned, how concerned are you about each of the following? Not at all concerned
6% 4% 1% 1% 3% 3%
Greenhouse gases produced by burning fuel to make electricity
… 4% 1% 1% 3% 0% 1%
… 4% 1% 1% 3% 2% 2% … 6% 0% 2% 3% 6% 3% Middle of the 1-9 range 2% 5% 5% 8% 10% 7% … 0% 5% 2% 2% 4% 3% … 17% 10% 6% 6% 6% 8% … 10% 10% 22% 10% 17% 14% Extremely concerned 52% 65% 60% 65% 51% 60%
Page 4 of 15

Appendix B: Polling Results by Location
Question Answer St. Johnsbury S. Burlington Montpelier Springfield Rutland AggregateOn a scale of 1 to 9, where 1 = not at all concerned and 9 = extremely concerned, how concerned are you about each of the following? Not at all concerned
6% 2% 3% 2% 3% 3%
Other air pollution produced by burning fuel to make electricity
… 2% 2% 1% 2% 1% 1%
… 0% 3% 3% 5% 2% 3% … 2% 3% 4% 3% 4% 3% Middle of the 1-9 range 12% 6% 8% 7% 13% 9% … 0% 8% 5% 9% 13% 8% … 15% 19% 14% 12% 16% 15% … 21% 22% 26% 17% 19% 21% Extremely concerned 42% 35% 37% 43% 29% 37% On a scale of 1 to 9, where 1 = not at all concerned and 9 = extremely concerned, how concerned are you about each of the following? Not at all concerned
13% 5% 6% 12% 7% 8%
Damage to river habitats caused by building facilities to produce hydro power
… 8% 8% 6% 11% 11% 9%
… 6% 10% 13% 10% 11% 10% … 11% 7% 10% 10% 11% 10% Middle of the 1-9 range 25% 17% 12% 13% 21% 17% … 8% 13% 11% 8% 10% 10% … 9% 11% 15% 9% 8% 10% … 13% 18% 13% 6% 10% 12% Extremely concerned 8% 11% 16% 20% 11% 14% On a scale of 1 to 9, where 1 = not at all concerned and 9 = extremely concerned, how concerned are you about each of the following? Not at all concerned
25% 54% 63% 60% 62% 56%
The visual impact of a wind farm on the scenery of Vermont
… 17% 21% 13% 15% 18% 17%
… 6% 8% 12% 7% 7% 8% … 6% 4% 5% 1% 3% 3% Middle of the 1-9 range 8% 4% 4% 4% 4% 4% … 0% 2% 0% 1% 3% 2% … 2% 2% 1% 1% 2% 1% … 2% 2% 1% 0% 0% 1% Extremely concerned 35% 4% 2% 11% 1% 7%
Page 5 of 15

Appendix B: Polling Results by Location
Question Answer St. Johnsbury S. Burlington Montpelier Springfield Rutland AggregateOn a scale of 1 to 9, where 1 = no threat at all, and 9 = an extremely serious threat, how much of a threat to Vermont’s scenic beauty would you say is posed by locating each of the following electricity sources in Vermont? No threat at all
6% 4% 3% 3% 3% 4%
A coal fired electric generating plant … 0% 2% 7% 8% 2% 4%
… 4% 4% 2% 4% 5% 4% … 0% 3% 1% 4% 0% 2% Middle of the 1-9 range 16% 3% 4% 10% 11% 8% … 2% 5% 6% 0% 6% 4% … 10% 10% 7% 5% 6% 7% … 12% 17% 14% 13% 11% 14%
Extremely serious threat 51% 53% 55% 52% 56% 54%
On a scale of 1 to 9, where 1 = no threat at all, and 9 = an extremely serious threat, how much of a threat to Vermont’s scenic beauty would you say is posed by locating each of the following electricity sources in Vermont? No threat at all
12% 10% 8% 9% 11% 10%
A natural gas fired electric generating plant
… 8% 10% 14% 10% 9% 10%
… 15% 3% 5% 13% 9% 8% … 10% 12% 5% 7% 8% 8% Middle of the 1-9 range 25% 15% 16% 16% 14% 16% … 8% 11% 8% 7% 9% 9% … 8% 13% 15% 9% 9% 11% … 4% 11% 6% 11% 13% 10%
Extremely serious threat 12% 15% 21% 17% 20% 17%
On a scale of 1 to 9, where 1 = no threat at all, and 9 = an extremely serious threat, how much of a threat to Vermont’s scenic beauty would you say is posed by locating each of the following electricity sources in Vermont? No threat at all
13% 40% 42% 40% 40% 38%
A utility scale wind farm … 17% 23% 23% 20% 19% 21%
… 8% 18% 18% 10% 15% 14% … 10% 5% 3% 5% 6% 5% Middle of the 1-9 range 8% 3% 10% 6% 8% 7% … 2% 1% 0% 2% 3% 1% … 2% 3% 2% 1% 3% 2% … 2% 2% 2% 6% 5% 4%
Extremely serious threat 38% 5% 1% 10% 2% 8%
Page 6 of 15

Appendix B: Polling Results by Location
Question Answer St. Johnsbury S. Burlington Montpelier Springfield Rutland AggregateOn a scale of 1 to 9, where 1 = no threat at all, and 9 = an extremely serious threat, how much of a threat to Vermont’s scenic beauty would you say is posed by locating each of the following electricity sources in Vermont? No threat at all
61% 71% 78% 77% 68% 72%
A residential scale wind farm … 16% 14% 13% 6% 18% 13%
… 4% 6% 3% 7% 3% 5% … 4% 0% 0% 4% 2% 2% Middle of the 1-9 range 12% 2% 2% 2% 2% 3% … 0% 2% 1% 1% 2% 2% … 2% 2% 2% 0% 2% 1% … 2% 2% 0% 2% 1% 1%
Extremely serious threat 0% 2% 1% 2% 2% 1%
On a scale of 1 to 9, where 1 = no threat at all, and 9 = an extremely serious threat, how much of a threat to Vermont’s scenic beauty would you say is posed by locating each of the following electricity sources in Vermont? No threat at all
10% 8% 6% 12% 9% 9%
Electricity transmission lines … 17% 9% 6% 9% 10% 10%
… 15% 14% 21% 10% 12% 14% … 6% 7% 9% 7% 7% 7% Middle of the 1-9 range 10% 19% 8% 13% 17% 14% … 2% 14% 8% 5% 9% 8% … 8% 12% 12% 13% 12% 12% … 8% 6% 4% 6% 7% 6%
Extremely serious threat 25% 12% 27% 24% 17% 20%
Page 7 of 15

Appendix B: Polling Results by Location
Question Answer St. Johnsbury S. Burlington Montpelier Springfield Rutland AggregateHydro Quebec can sell VT power from any mix of their resource we choose (hydro, wind, fossil fuels). Would you be willing to pay extra to get power exclusively from their wind resources?
Yes 62% 66% 58% 51% 59%
No 31% 29% 33% 35% 32% Don’t Care 7% 5% 9% 14% 9% Hydro Quebec (predominantly hydro) provides base load power, meaning power is usually available 24/7. If you learned that discontinuing power from H.Q. would require another base load source of power, and that only natural gas, coal, out of state nuclear power, or oil were available to replace this power, would you choose to:
Have VT replace H.Q. (predominantly hydro) power with coal, natural gas, out of state nuclear power, or oil
4% 2% 9% 13% 7%
Continue to purchase power from H.Q.
96% 98% 91% 87% 93%
VT Yankee (nuclear) provides base load power, meaning power is usually available 24/7. If you learned that discontinuing power from V.Y. would require another base load source of power, and that only natural gas, coal, out of state nuclear power, or oil were available to replace this power, would you choose to
Have VT replace V.Y. (nuclear) power with coal, natural gas, out of state nuclear power, or oil
44% 33% 52% 51% 46%
Continue to purchase power from V.Y.
56% 67% 48% 49% 54%
Regarding the following 2 statements, where would you place yourself on a scale of 1 to 7. Vermont should:
Meet as much of its electricity needs as possible by increasing how efficiently consumers use electricity
68% 63% 74% 73% 63% 68%
… 6% 12% 12% 7% 8% 9% … 4% 10% 3% 6% 8% 7%
Middle of the 1-7 range. 8% 9% 8% 11% 11% 10%
… 9% 2% 2% 2% 6% 4% … 0% 2% 1% 1% 4% 2%
Meet its electricity needs entirely by generating or buying more electricity
6% 2% 0% 1% 0% 1%
Page 8 of 15

Appendix B: Polling Results by Location
Question Answer St. Johnsbury S. Burlington Montpelier Springfield Rutland AggregateRegarding the following 2 statements, where would you place yourself on a scale of 1 to 7.
Contracting to buy electricity from other providers
10% 3% 6% 3% 12% 6%
… 2% 2% 3% 5% 6% 4% … 8% 8% 7% 3% 4% 6%
Middle of the 1-7 range. 33% 41% 31% 40% 29% 35%
… 12% 15% 17% 14% 11% 14% … 10% 15% 11% 13% 16% 13%
Building their own facilities
24% 16% 25% 22% 23% 22%
Regarding the following 2 statements, where would you place yourself on a scale of 1 to 7.
Have electric bills that don’t change too much from year to year, even if their electricity may wind up costing quite a bit more than the market price
28% 9% 15% 6% 11% 12%
Citizens should : … 12% 15% 10% 5% 8% 10% … 8% 12% 7% 8% 9% 9%
Middle of the 1-7 range. 32% 30% 29% 34% 34% 32%
… 2% 9% 13% 10% 13% 10% … 4% 9% 9% 10% 5% 8%
Get electricity at the market price, even if one’s bills may go up and down by quite a bit from year to year
14% 16% 17% 26% 21% 19%
Regarding the following 2 statements, where would you place yourself on a scale of 1 to 7.
Only consider direct costs, like those of building and operating the power generation facility and the power lines
6% 1% 2% 1% 6% 3%
In choosing a source for electricity, VT should: … 2% 1% 2% 2% 1% 1%
… 0% 3% 1% 0% 3% 2%
Middle of the 1-7 range. 18% 4% 5% 6% 5% 6%
… 4% 4% 4% 5% 7% 5% … 2% 10% 7% 6% 11% 8%
Consider indirect costs as well, like those associated with pollution, greenhouse gas emissions, or the production of nuclear wastes
68% 78% 78% 80% 68% 75%
Regarding the following 2 statements, where would you place yourself on a scale of 1 to 7.
A few large, centralized, plants 4% 5% 2% 3% 5% 4%
Vermont’s electricity should be produced by: … 0% 2% 1% 3% 3% 2%
… 2% 5% 4% 3% 9% 5%
Middle of the 1-7 range. 32% 27% 25% 21% 29% 26%
… 8% 17% 12% 16% 21% 16% … 8% 13% 11% 17% 14% 13%
Many, small decentralized facilities
46% 31% 45% 39% 18% 34%
Page 9 of 15

Appendix B: Polling Results by Location
Question Answer St. Johnsbury S. Burlington Montpelier Springfield Rutland Aggregate
If it costs more to generate electricity from smaller decentralized plants, how much more would you be willing to pay per month to procure all your power from smaller decentralized plants?
$0 18% 11% 12% 25% 17%
$ 1 to 5 13% 9% 8% 11% 10% $ 6 to 10 19% 16% 10% 12% 14% $ 11 to 20 19% 14% 15% 15% 16% $ 21 to 30 12% 18% 17% 11% 14% $ 31 to 40 4% 9% 13% 7% 8% $ 41 to 50 3% 2% 13% 6% 6% $ Greater than 50 13% 21% 14% 11% 14%
Thinking about the ways in which Vermont might meet its future electricity needs, please rate how important each of the following goals is to you using a scale of 1 to 9, with 1 being not at all important and 9 being critically important.
Not at all important
16% 11% 14% 6% 10% 11%
Keeping electricity rates low for the consumer
… 6% 11% 11% 5% 11% 9%
… 8% 14% 12% 17% 9% 13% … 6% 6% 4% 10% 10% 8% Middle of the 1-9 range 29% 23% 25% 30% 22% 26% … 6% 7% 8% 9% 12% 8% … 8% 9% 10% 5% 5% 7% … 6% 6% 5% 3% 10% 6% Critically important 14% 13% 12% 15% 12% 13%
Thinking about the ways in which Vermont might meet its future electricity needs, please rate how important each of the following goals is to you using a scale of 1 to 9, with 1 being not at all important and 9 being critically important.
Not at all important
10% 5% 10% 6% 8% 7%
Keeping electric rates stable for the consumer
… 0% 9% 7% 7% 9% 7%
… 14% 10% 9% 13% 7% 10% … 8% 5% 11% 13% 10% 10% Middle of the 1-9 range 22% 25% 17% 23% 18% 21% … 6% 12% 16% 7% 12% 11% … 8% 16% 5% 6% 10% 9% … 8% 6% 8% 9% 12% 9% Critically important 24% 12% 15% 16% 12% 15%
Page 10 of 15

Appendix B: Polling Results by Location
Question Answer St. Johnsbury S. Burlington Montpelier Springfield Rutland Aggregate
Thinking about the ways in which Vermont might meet its future electricity needs, please rate how important each of the following goals is to you using a scale of 1 to 9, with 1 being not at all important and 9 being critically important.
Not at all important
8% 1% 3% 6% 3% 4%
Reducing dependence on overseas energy sources
… 2% 3% 1% 1% 2% 2%
… 2% 2% 2% 2% 1% 2% … 10% 2% 0% 2% 1% 2% Middle of the 1-9 range 18% 7% 3% 8% 4% 7% … 4% 2% 3% 2% 0% 2% … 4% 5% 7% 4% 8% 6% … 2% 13% 14% 13% 10% 11% Critically important 51% 66% 67% 62% 72% 65%
Thinking about the ways in which Vermont might meet its future electricity needs, please rate how important each of the following goals is to you using a scale of 1 to 9, with 1 being not at all important and 9 being critically important.
Not at all important
0% 3% 3% 0% 2% 2%
Minimizing air pollution … 0% 1% 0% 1% 1% 1%
… 2% 0% 0% 0% 2% 1% … 0% 0% 0% 2% 1% 1% Middle of the 1-9 range 4% 6% 3% 3% 7% 5% … 8% 4% 3% 5% 7% 5% … 8% 12% 6% 8% 8% 9% … 8% 16% 20% 13% 17% 16% Critically important 69% 58% 65% 68% 55% 62%
Thinking about the ways in which Vermont might meet its future electricity needs, please rate how important each of the following goals is to you using a scale of 1 to 9, with 1 being not at all important and 9 being critically important.
Not at all important
10% 7% 6% 3% 19% 9%
Using power produced in Vermont … 0% 6% 3% 10% 10% 6%
… 8% 8% 8% 4% 4% 6% … 6% 9% 5% 6% 9% 7% Middle of the 1-9 range 27% 18% 12% 23% 12% 17% … 4% 15% 15% 7% 11% 11% … 8% 17% 11% 19% 14% 15% … 12% 8% 20% 15% 5% 12% Critically important 25% 12% 21% 14% 16% 16%
Page 11 of 15

Appendix B: Polling Results by Location
Question Answer St. Johnsbury S. Burlington Montpelier Springfield Rutland Aggregate
Thinking about the ways in which Vermont might meet its future electricity needs, please rate how important each of the following goals is to you using a scale of 1 to 9, with 1 being not at all important and 9 being critically important.
Not at all important
8% 14% 22% 15% 11% 15%
Avoiding facilities in Vermont that detract from its scenic beauty
… 6% 14% 13% 13% 10% 12%
… 10% 13% 13% 12% 25% 15% … 6% 13% 2% 8% 9% 8% Middle of the 1-9 range 14% 13% 17% 16% 18% 16% … 10% 10% 9% 6% 11% 9% … 10% 6% 6% 13% 5% 8% … 10% 10% 9% 6% 6% 8% Critically important 26% 6% 9% 12% 5% 10%
Thinking about the ways in which Vermont might meet its future electricity needs, please rate how important each of the following goals is to you using a scale of 1 to 9, with 1 being not at all important and 9 being critically important.
Not at all important
10% 7% 0% 2% 6% 4%
Reducing the emission of gases that may contribute to climate change
… 0% 1% 0% 2% 0% 1%
… 2% 0% 1% 1% 1% 1% … 0% 1% 1% 0% 1% 1% Middle of the 1-9 range 14% 2% 2% 4% 7% 5% … 4% 3% 0% 5% 3% 3% … 0% 5% 6% 6% 5% 5% … 6% 9% 14% 10% 11% 10% Critically important 65% 72% 76% 71% 66% 71%
Page 12 of 15

Appendix B: Polling Results by Location
Question Answer St. Johnsbury S. Burlington Montpelier Springfield Rutland Aggregate
Thinking about the ways in which Vermont might meet its future electricity needs, please rate how important each of the following goals is to you using a scale of 1 to 9, with 1 being not at all important and 9 being critically important.
Not at all important
0% 3% 5% 1% 2% 2%
Having a reliable supply of electricity … 2% 2% 2% 3% 1% 2%
… 2% 2% 3% 1% 3% 2% … 0% 4% 1% 6% 2% 3% Middle of the 1-9 range 13% 8% 11% 11% 13% 11% … 0% 5% 8% 6% 4% 5% … 10% 14% 14% 14% 11% 13% … 17% 17% 18% 16% 21% 18% Critically important 56% 47% 39% 43% 43% 44%
Thinking about the ways in which Vermont might meet its future electricity needs, please rate how important each of the following goals is to you using a scale of 1 to 9, with 1 being not at all important and 9 being critically important.
Not at all important
13% 4% 5% 5% 8% 6%
Reducing radioactive wastes … 4% 5% 2% 3% 2% 3%
… 4% 3% 1% 2% 5% 3% … 0% 1% 2% 2% 1% 1% Middle of the 1-9 range 4% 2% 4% 3% 4% 3% … 6% 3% 0% 3% 1% 2% … 4% 9% 6% 3% 6% 6% … 6% 9% 11% 4% 4% 7% Critically important 60% 63% 68% 77% 69% 68%
Thinking about the ways in which Vermont might meet its future electricity needs, please rate how important each of the following goals is to you using a scale of 1 to 9, with 1 being not at all important and 9 being critically important.
Not at all important
6% 2% 3% 4% 4% 4%
Creating jobs in Vermont … 0% 3% 2% 3% 4% 3%
… 2% 7% 1% 3% 5% 4% … 2% 2% 1% 3% 3% 2% Middle of the 1-9 range 20% 15% 10% 20% 10% 15% … 6% 13% 11% 10% 10% 10% … 11% 19% 17% 17% 13% 16% … 13% 16% 14% 11% 13% 14% Critically important 41% 24% 40% 29% 38% 33%
Page 13 of 15

Appendix B: Polling Results by Location
Question Answer St. Johnsbury S. Burlington Montpelier Springfield Rutland Aggregate
Thinking about the ways in which Vermont might meet its future electricity needs, please rate how important each of the following goals is to you using a scale of 1 to 9, with 1 being not at all important and 9 being critically important.
Not at all important
2% 2% 4% 3% 2% 3%
Getting electricity from resources that will never be used up
… 4% 1% 2% 2% 0% 1%
… 2% 2% 3% 2% 2% 2% … 2% 1% 0% 3% 1% 1% Middle of the 1-9 range 10% 7% 0% 7% 5% 5% … 4% 2% 1% 3% 3% 3% … 16% 10% 9% 5% 7% 9% … 14% 12% 11% 9% 19% 13% Critically important 47% 64% 69% 65% 61% 63% Which three (3) resource options do you think should be the highest priorities to meet Vermont’s future electricity needs considering all factors (cost, environmental attributes, reliability, etc.). You will vote three times.
Coal 1% 0% 1% 1% 0% 0.6%
Energy efficiency 18% 26% 27% 25% 24% 25.0%Hydro 22% 17% 15% 13% 14% 15.3%Methane from farms or landfills
10% 7% 9% 4% 6% 6.7%
Natural gas 1% 1% 1% 2% 2% 1.5%Nuclear 10% 5% 3% 4% 8% 5.5%Oil 0% 0% 0% 1% 0% 0.2%Solar 13% 14% 14% 20% 15% 15.7%Wind 14% 23% 24% 20% 24% 21.8%Wood 11% 7% 6% 10% 7% 7.7%
Which three (3) resource options do you think should be the lowest priorities to meet Vermont’s future electricity needs considering all factors (cost, environmental attributes, reliability, etc.). You will vote three times.
Coal 32% 31% 32% 35% 32% 32.3%
Energy efficiency 1% 1% 0% 1% 1% 0.7% Hydro 0% 0% 1% 0% 1% 0.4%
Methane from farms or landfills
1% 2% 2% 2% 1% 1.8%
Natural gas 7% 8% 8% 5% 11% 7.9% Nuclear 20% 25% 25% 28% 21% 24.3% Oil 25% 28% 30% 23% 27% 26.8% Solar 2% 3% 1% 1% 3% 2.0% Wind 8% 1% 0% 2% 1% 1.8% Wood 3% 2% 1% 2% 3% 2.1%
Page 14 of 15

Appendix B: Polling Results by Location
Question Answer St. Johnsbury S. Burlington Montpelier Springfield Rutland AggregateHow valuable to you were each of the following elements of the workshop? Not Valuable
8% 5% 8% 4% 4% 5%
Small group facilitated discussion with other Vermonters
Low Value 4% 9% 8% 12% 4% 8%
Medium Value 10% 11% 20% 23% 21% 18% High Value 21% 30% 32% 25% 35% 30% Very High Value 56% 45% 32% 36% 36% 39% How valuable to you were each of the following elements of the workshop? Not Valuable
8% 9% 5% 7% 3% 6%
Questions and answers with the panel
Low Value 10% 11% 20% 20% 13% 15%
Medium Value 33% 29% 31% 27% 29% 30% High Value 16% 26% 25% 26% 30% 26% Very High Value 33% 26% 18% 20% 24% 23% How valuable to you were each of the following elements of the workshop? Not Valuable
6% 3% 4% 6% 7% 5%
Keypad polling Low Value 10% 6% 3% 8% 4% 6% Medium Value 17% 10% 11% 14% 11% 12% High Value 21% 31% 39% 30% 34% 32% Very High Value 46% 50% 43% 43% 44% 45% How valuable to you were each of the following elements of the workshop? Not Valuable
6% 5% 9% 11% 7% 8%
Written materials available ahead of time
Low Value 22% 14% 9% 7% 6% 10%
Medium Value 25% 21% 24% 28% 27% 25% High Value 24% 21% 26% 25% 26% 25% Very High Value 24% 39% 32% 28% 33% 32%
Page 15 of 15

Appendix C: Distributions of Select Polling Questions

APPENDIX C - DISTRIBUTIONS ON SELECT POLLING QUESTIONS
On a scale of 1 to 9, where 1 = not at all concerned and 9 = extremely concerned, how concerned are you about each of the following?
Radioactive waste from nuclear power plants
Greenhouse gases produced by burning fuel to make electricity
3% 1% 2% 3%7%
3%8%
14%
60%
Not at allconcerned
… Middle ofthe 1-9range
… Extremelyconcerned
6% 5% 2% 1%5% 2%
7% 8%
63%
Not at allconcerned
… Middle ofthe 1-9range
… Extremelyconcerned
1

APPENDIX C - DISTRIBUTIONS ON SELECT POLLING QUESTIONS
On a scale of 1 to 9, where 1 = not at all concerned and 9 = extremely concerned, how concerned are you about each of the following? (continued)
Other air pollution produced by burning fuel to make electricity
Damage to river habitats caused by building facilities to produce hydro power
3% 1% 3% 3%9% 8%
15%21%
37%
Not at allconcerned
… Middle ofthe 1-9range
… Extremelyconcerned
8% 9%10% 10%
17%
10% 10%12%
14%
Not at allconcerned
… Middle ofthe 1-9range
… Extremelyconcerned
3% 1% 2% 3%7%
3%8%
14%
60%
Not at allconcerned
… Middle ofthe 1-9range
… Extremelyconcerned
2

APPENDIX C - DISTRIBUTIONS ON SELECT POLLING QUESTIONS
On a scale of 1 to 9, where 1 = not at all concerned and 9 = extremely concerned, how concerned are you about each of the following? (continued)
The visual impact of a wind farm on the scenery of Vermont
On a scale of 1 to 9, where 1 = no threat at all, and 9 = an extremely serious threat, how much of a threat to Vermont’s scenic beauty would you say is posed by locating each of the following electricity sources in Vermont?
A coal fired electric generating plant
8% 9%10% 10%
17%
10% 10%12%
14%
Not at allconcerned
… Middle ofthe 1-9range
… Extremelyconcerned
56%
17%
8%3% 4% 2% 1% 1%
7%
Not at allconcerned
… Middle ofthe 1-9range
… Extremelyconcerned
4% 4% 4% 2%8%
4%7%
14%
54%
No threatat all
… Middle ofthe 1-9range
… Extremelyseriousthreat
3

APPENDIX C - DISTRIBUTIONS ON SELECT POLLING QUESTIONS
On a scale of 1 to 9, where 1 = no threat at all, and 9 = an extremely serious threat, how much of a threat to Vermont’s scenic beauty would you say is posed by locating each of the following electricity sources in Vermont? (continued)
A natural gas fired electric generating plant
A utility scale wind farm
10% 10%8% 8%
16%
9%11%
10%
17%
No threatat all
… Middle ofthe 1-9range
… Extremelyseriousthreat
38%
21%
14%
5% 7%
1% 2% 4%
8%
No threatat all
… Middle ofthe 1-9range
… Extremelyseriousthreat
4

APPENDIX C - DISTRIBUTIONS ON SELECT POLLING QUESTIONS
On a scale of 1 to 9, where 1 = no threat at all, and 9 = an extremely serious threat, how much of a threat to Vermont’s scenic beauty would you say is posed by locating each of the following electricity sources in Vermont? (continued)
A residential scale wind farm
Electricity transmission lines
38%
21%
14%
5% 7%
1% 2% 4%
8%
No threatat all
… Middle ofthe 1-9range
… Extremelyseriousthreat
72%
13%5% 2% 3% 2% 1% 1% 1%
No threatat all
… Middle ofthe 1-9range
… Extremelyseriousthreat
9% 10%
14%
7%
14%
8%
12%
6%
20%
No threatat all
… Middle ofthe 1-9range
… Extremelyseriousthreat
5

APPENDIX C - DISTRIBUTIONS ON SELECT POLLING QUESTIONS
Thinking about the ways in which Vermont might meet its future electricity needs, please rate how important each of the following goals is to you using a scale of 1 to 9, with 1 being not at all important and 9 being critically important.
Keeping electricity rates low for the consumer
Keeping electric rates stable for the consumer
11%9%
13%
8%
26%
8% 7%6%
13%
Not at allimportant
… Middle ofthe 1-9range
… Criticallyimportant
7% 7%
10% 10%
21%
11%9% 9%
15%
Not at allimportant
… Middle ofthe 1-9range
… Criticallyimportant
6

APPENDIX C - DISTRIBUTIONS ON SELECT POLLING QUESTIONS
Thinking about the ways in which Vermont might meet its future electricity needs, please rate how important each of the following goals is to you using a scale of 1 to 9, with 1 being not at all important and 9 being critically important. (cont'd)
Reducing dependence on overseas energy sources
Minimizing air pollution
4% 2% 2% 2%7%
2%6%
11%
65%
Not at allimportant
… Middle ofthe 1-9range
… Criticallyimportant
2% 1% 1% 1%5% 5%
9%16%
62%
Not at allimportant
… Middle ofthe 1-9range
… Criticallyimportant
7

APPENDIX C - DISTRIBUTIONS ON SELECT POLLING QUESTIONS
Thinking about the ways in which Vermont might meet its future electricity needs, please rate how important each of the following goals is to you using a scale of 1 to 9, with 1 being not at all important and 9 being critically important. (cont'd)
Using power produced in Vermont
Avoiding facilities in Vermont that detract from its scenic beauty
9%
6% 6%7%
17%
11%
15%
12%
16%
Not at allimportant
… Middle ofthe 1-9range
… Criticallyimportant
15%
12%
15%
8%
16%
9%8% 8%
10%
Not at allimportant
… Middle ofthe 1-9range
… Criticallyimportant
8

APPENDIX C - DISTRIBUTIONS ON SELECT POLLING QUESTIONS
Thinking about the ways in which Vermont might meet its future electricity needs, please rate how important each of the following goals is to you using a scale of 1 to 9, with 1 being not at all important and 9 being critically important. (cont'd)
Reducing the emission of gases that may contribute to climate change
Having a reliable supply of electricity
4% 1% 1% 1%5% 3% 5%
10%
71%
Not at allimportant
… Middle ofthe 1-9range
… Criticallyimportant
2% 2% 2% 3%
11%
5%
13%18%
44%
Not at allimportant
… Middle ofthe 1-9range
… Criticallyimportant
9

APPENDIX C - DISTRIBUTIONS ON SELECT POLLING QUESTIONS
Thinking about the ways in which Vermont might meet its future electricity needs, please rate how important each of the following goals is to you using a scale of 1 to 9, with 1 being not at all important and 9 being critically important. (cont'd)
Reducing radioactive wastes
Creating jobs in Vermont
6% 3% 3% 1% 3% 2%6% 7%
68%
Not at allimportant
… Middle ofthe 1-9range
… Criticallyimportant
4% 3% 4% 2%
15%10%
16% 14%
33%
Not at allimportant
… Middle ofthe 1-9range
… Criticallyimportant
10

APPENDIX C - DISTRIBUTIONS ON SELECT POLLING QUESTIONS
Thinking about the ways in which Vermont might meet its future electricity needs, please rate how important each of the following goals is to you using a scale of 1 to 9, with 1 being not at all important and 9 being critically important. (cont'd)
Getting electricity from resources that will never be used up
3% 1% 2% 1%5% 3%
9%13%
63%
Not at allimportant
… Middle ofthe 1-9range
… Criticallyimportant
11

Appendix D: Meeting Summaries

Vermont’s Energy Future Workshop Summary of Panel Discussion and Public Comments
St Johnsbury, Vermont October 3, 2007
Panel Discussion Panel Members Dave Lamont, VT Department of Public Service
Richard Sedano, Regulatory Assistance Project Bruce Bentley, Central Vermont Public Service Scott Corse, VT Public Power Supply Authority
Q: How can we quantify externalities associated with each energy resource? A: Externalities are difficult to quantify. We use an “adder” for resources to approximate externalities, but recognize it is rough justice. We could spend more money on trying to quantify externalities, but it would not necessarily get a more accurate picture of the cost. The current system works well. A: We use a default system in integrated planning which for example includes a 10% add on for efficiency. Total life cycle costs are available but determining exact figures is difficult because of the need to make connections between air emissions and health impacts. A: We are moving towards internalizing externalities into costs, such as purchasing carbon credits. A: We currently do not include externalities in cost estimates of KW/hour costs. Q: How can individuals and schools find financing for energy efficiency projects and small-scale energy production projects? A: Schools can enter into energy performance contracts. For example, Montpelier Schools contracted with Honeywell for energy improvements. Honeywell did the work and then split the savings with the school. Both parties made money through the deal. It used Efficiency Vermont programs and then went even further. A: Individual homeowners used to be able to get 1/4 of a point off their mortgage if they built an energy efficient house. The program did not catch on with many banks and may not be used now. A: Entergy contributes funding to the Clean Energy Development Fund, which supports the use of renewable energy throughout the State. Distributive generation is not economically feasible because of size issues. Q: How can we determine if Vermont Yankee is really safe and how can we replace the energy from Vermont Yankee?

A: On the safety issue, we will have to rely on the thorough review conducted by the Nuclear Regulatory Commission (NRC). It’s their determination. A: I used to work at Vermont Yankee and know that the NRC takes safety seriously. Vermont gets to contribute to the process and we would rely on their review. A: The public will always be concerned about the safety of Vermont Yankee. There should always be openness to hearing questions and concerns about safety. The state organization with oversight is the Vermont State Nuclear Advisory Panel. A: As to other sources, we are looking at contract extensions but other options are on the table for consideration. Q: After 2018 after the contract with Hydro-Quebec ends, what percentage can be met by Vermont based renewable energy sources? A: Act 61 set a goal of meeting all new load growth with renewable energy. It’s a tough goal and it looks like we will not be able to meet it. Most potential renewable energy resources are not yet market competitive. Vermont already uses a lot of renewable energy. Perhaps biomass can be used more in the future. A: We looked at renewable resources such as wind, wood, solar, water, and biomass. Where as Vermont Yankee generates around 250 MW and Hydro-Quebec around 300 MW, most new renewable projects realistically would generate a small amount such as 7 to 10 MW for a wind energy project. Biomass has the potential to generate 20 to 30 MW, but solar is expensive. The potential for using municipal solid waste and palletized grass is still unknown. A: We can meet load growth but it will still only be around 10% of our total portfolio. Q: How can we develop new solutions? A: We can use the Clean Energy Development Fund but they generally only fund reliable technology and ideas. Many unusual ideas are too risky for them and they believe that ratepayers are risk adverse. Q: How can we meet our future energy needs without changing the physical face of Vermont? A: We can’t. At a minimum we need to expand the transmission system, which will impact the physical face of Vermont. Q: How can we improve the efficiency of the current centralized distributive power transmission from 15% to 85%?

A: A more realistic estimate is that the system is close to 50% efficient. The best way to increase the efficiency is to combine heat and power projects. It is difficult to get the whole system up to 85% efficiency. The use of byproducts of combined heat and power (CHP) is exciting. Green Mountain Coffee Roasters has a great CHP system that demonstrates its potential in the right place. Q: What are the real costs of wind turbines, including impacts to wildlife, tourism, quality of life, etc.? A: The Public Service Board recently issued a decision approving wind turbines in Sheffield. The decision discussed those impacts and held that the benefits of wind turbines exceeded the costs. But the decision did not assign specific costs for each impact. Q: Can you include the costs of resource extraction in the calculations? A: Every energy resource receives subsidies, which are an expression of the public will. Therefore it is hard to calculate an exact number. The Public Service Board (PSB) looks at the evidence that is offered in each case and makes its decision based on that evidence. Follow-up comment: Can you present the level of subsidy for each resource in the hand out materials so it is clear relative to each resource. Q: The permitting for small-scale hydro projects is so complex; can it be made simple so that individuals can undertake small-scale projects? A: Individuals can either contact the Clean Energy Development Fund or the Vermont Agency of Natural Resources (ANR). ANR can help determine environmental issues that need to be addressed. For example, if the project would not impact navigable waters, no Federal Energy Regulatory Commission (FERC) permit is required. A: Community Hydro out of Planefield is a private firm set up to help individuals with small-scale hydro projects. Q: Is it possible to create a rate structure that serves as an incentive to conserve energy by utilizing peak vs. off peak pricing and other incentives? A: We already use rate structures designed to give the public price signals. We used to use seasonal differences but stopped it. The utilities are working with the (Public Service Department) PSD on this issue right now. We want to send the right signals to the public to impact their future energy consumption. A: We need to be sensitive to low income customers who can’t afford to pay higher prices. If we charge more for energy consumption during peak hours, some customers will be unable to afford their bill or use energy during peak hours.

A: Real time pricing may be necessary because until it hits your pocketbook, most consumers will not change use. A: Smart meters can control appliances by turning them off during peak hours. It may be possible to use it in response to current load market. For example, if the load market price reaches a certain price point, it turns off your appliance for a period of time. Q: What can we do now do protect our negotiating position with Hydro-Quebec? A: We are now in the early stages of discussions with Hydro-Quebec. We are not discussing the building of any new dams with them, but they may still decide to build new dams for their own or other parties use. We may also talk with them about the use of wind energy. Hydro-Quebec is a reliable energy source for Vermont because they are next to Vermont. They benefit from their connection from Vermont just as we benefit from the close proximity. A: We will also discuss the Churchill Falls Dam in Labrador, wind resources in the Gaspe Peninsula, and other resources outside of the current dams. Q: Who makes the re-licensing and de-commissioning decision concerning Vermont Yankee? A: Every nuclear power plant has a license that expires on a certain date. They need to apply to the NRC to extend their license. In Vermont, it also needs the approval of the State. De-commissioning is a separate matter since that involves taking the plant apart. Q: Why aren’t we already negotiating with Vermont Yankee and Hydro-Quebec? Do we have any priority compared to other users because of our existing contracts? A: We do not have a right of first refusal or other benefits based on our existing contracts. We want to negotiate contracts with several different energy providers to spread out the risk and not have too many eggs in any one basket. We want to design a balanced energy portfolio to minimize risk. A: We are already in discussion with Hydro-Quebec; it’s just not covered in the newspaper. Although there is no right of first refusal, Vermont Yankee shares revenue over a certain price, which creates a financial incentive for most energy output to go to Vermont. Vermont Yankee and Hydro-Quebec have no incentive to sell energy to us below market rate. If we want low prices, we must be willing to take some risks. One possibility is to use a collaborative effort between private developers and the public on a project. Q: Is it possible to negotiate large contracts as part of a several state consortium?

A: It’s not feasible because the surrounding states have private companies sell to the wires and they are not in a position to join Vermont, which is vertically integrated. Public Comment Session Comment: On I 91 there is a small farm with a windmill to pump water. The permitting process is way to complex and needs to be streamlined. Local generation of energy in St. Johnsbury is possible since there is a dam in place but unfortunately there is no way to pay for the generator. Is it possible to consider a small-scale nuclear reactor in Vermont, perhaps 100 to 200 MW? Comment: I live off the grid and use solar power. There are certain benefits through Efficiency Vermont that we are not able to utilize because we are off the grid. Every 10 years I need to replace my battery. I would like to be able to hook up to the grid for those times and also be able to sell excess power back to the grid. Comment: I am in the business of energy efficient buildings. In the late 1970’s and early 1980’s Fannie Mae developed a program that allowed you to re-finance your home and include the price of energy efficient projects, which then could be financed over 30 years. The program was stopped in 1992 because it was underutilized. Due to the increase in energy costs, the program would likely be used more now. Comment: The energy generation contribution that the Northeast Kingdom makes is underappreciated. We already generate way more than our share, such as producing 71% of in state renewable energy. We should also consider energy from biomass. Comment: We should expand the criteria used to evaluate future energy options to include 1) a design goal of an 85% efficient system, 2) a robust and reliant system with no single point of failure, 3) based on conservation and efficiency first due to concerns about climate change impacts, 4) consider full life cycle impacts, and 5) does not place a financial or safety risk on future generations. Comment: If the rates reach a certain point and begin to hurt the users financially, they will react. My rates have been rising. Is it due to a speculative market? It’s important that we are meeting in St Johnsbury because it played an important role in history. Comment: In New Jersey, the Public Service Company installed “closers” on air conditioners that would turn off air conditioners for 10 minutes during peak hours. The biggest trouble with nuclear power is the disposal of waste. There is a new kind of reactor that runs on atmospheric pressure and is therefore, much safer. It is also more efficient since it can use nuclear hazardous waste, which still has 99% of its power left. Also, if we hydrolize hydrogen into metal hydride, it can run internal combustion engines. We need an affordable source of hydrogen, which we can get from nuclear power plants.

Comment: I am worried about the increased rate Vermont Yankee is generating spent fuel rods. They will need more dry cask storage room. There is also a danger of tritium, (ed. note, I think she is referring to tritiated water, a.k.a. heavy water) a highly radioactive isotope of water. It is not possible to sift it out of water emissions and it causes Down’s Syndrome and other mutagenic problems. Comment: There has been significant discussion about what can be done on a personal level. Some solutions need to be on a large scale. Our jobs and energy supply are dependent on large-scale projects. Comment: Distributive power will be common. Energy efficiency should be expanded to include energy conservation (less use). Rate designs should encourage conservation. (Use less, pay less.) Comment: I have worked in the utility industry for 20 years. The polling is not representative because the level of education and where people work is way out of line with the Vermont overall.
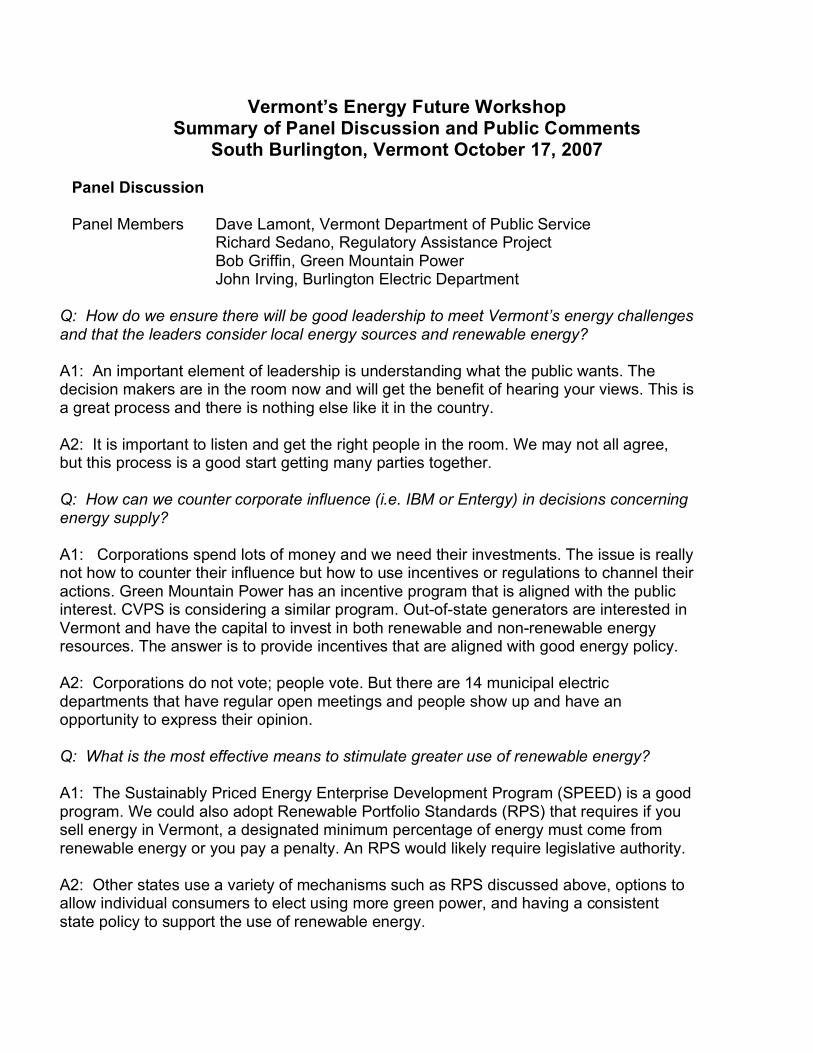
Vermont’s Energy Future Workshop Summary of Panel Discussion and Public Comments
South Burlington, Vermont October 17, 2007
Panel Discussion Panel Members Dave Lamont, Vermont Department of Public Service Richard Sedano, Regulatory Assistance Project Bob Griffin, Green Mountain Power John Irving, Burlington Electric Department
Q: How do we ensure there will be good leadership to meet Vermont’s energy challenges and that the leaders consider local energy sources and renewable energy? A1: An important element of leadership is understanding what the public wants. The decision makers are in the room now and will get the benefit of hearing your views. This is a great process and there is nothing else like it in the country. A2: It is important to listen and get the right people in the room. We may not all agree, but this process is a good start getting many parties together. Q: How can we counter corporate influence (i.e. IBM or Entergy) in decisions concerning energy supply? A1: Corporations spend lots of money and we need their investments. The issue is really not how to counter their influence but how to use incentives or regulations to channel their actions. Green Mountain Power has an incentive program that is aligned with the public interest. CVPS is considering a similar program. Out-of-state generators are interested in Vermont and have the capital to invest in both renewable and non-renewable energy resources. The answer is to provide incentives that are aligned with good energy policy. A2: Corporations do not vote; people vote. But there are 14 municipal electric departments that have regular open meetings and people show up and have an opportunity to express their opinion. Q: What is the most effective means to stimulate greater use of renewable energy? A1: The Sustainably Priced Energy Enterprise Development Program (SPEED) is a good program. We could also adopt Renewable Portfolio Standards (RPS) that requires if you sell energy in Vermont, a designated minimum percentage of energy must come from renewable energy or you pay a penalty. An RPS would likely require legislative authority. A2: Other states use a variety of mechanisms such as RPS discussed above, options to allow individual consumers to elect using more green power, and having a consistent state policy to support the use of renewable energy.

Q: Should Vermont work towards 100% of energy from in-state sources, and if not, what percentage is appropriate? A: In-state compared to out-of-state generation of the energy is not that important from a system perspective since we are part of the New England Power Grid. In-state energy generation facilities would create some jobs in Vermont though. Q: Tonight we have mostly heard about planning for the next 7 to 10 years What is the real long-term plan? A1: Many contracts will expire in the next few years, but the new contracts being negotiated may last for the next 20 years. We are currently in negotiations. We must be careful because we are filling a large part of our portfolio at one time and must consider that choices may change over time. A2: This process is great, but it will end. There should be a continuing dialogue as things change. The public is increasingly well informed and is an important part of the process. Q: How can we offer better incentives for net metering and combined heat and power systems? A1: We can provide better incentives but first must examine the benefits from each source. A2: The Clean Energy Development Fund is a source of funding for clean energy projects. It is funded by Vermont Yankee, but its legislative mandate will expire unless it is continued. It recently funded 25 proposals. The net metering caps are arbitrarily set. Even though comparatively Vermont has a good system, more can be done to promote it. Q: Is there one power source that makes sense for Vermont based on geography? A1: There is no single power source that is the answer. We need a combination of many different energy sources. A2: We need diversity in the kind of energy contracts, the sources of the energy, and the terms of the contracts. That diversity will provide some stability. Q: How do we allocate and balance carbon generation for agriculture as compared to power? A: Agricultural policy is a national question. If we focus on putting too much corn to make ethanol, than we have plenty of ethanol but less agricultural products for food. Q: Why have we chosen not to include externalities into the full life cycle costs of our energy choices?

A1: We include some externalities. Vermont uses the least cost source procurement method, which considers capital costs, operating costs, and externalities. Most of the externalities considered are air emissions. It is difficult to achieve consensus on what the value of each externality should be. We do not include all externalities, but we do include some. A2: We consider qualitative impacts when quantitative impacts are heard to determine. The Public Service Board will consider the externalities even if it is impossible to accurately quantify the impacts of the fuel. A3: Externalities make more expensive energy options preferable to less expensive options. As a result, the price of the energy may go up. Environmental costs are considered, but the legislature should make it clear what should be considered. Q: Is the decision about the reliability of Vermont Yankee in Vermont’s hands? If the citizens or the legislature say no, is it still up to others? A: The Nuclear Regulatory Commission (NRC) has jurisdiction and must issue a permit for the facility to operate. Vermont can participate in the process but the decision is up to the NRC. If the legislature votes not to extend the license, it is unclear what would happen and Vermont Yankee could appeal to the courts. Q: How much does transmission loss factor into making energy decisions? Are local sources better because they minimize the loss? A1: There is a loss of around 5% to 10% due to energy transmission when energy comes from far away. Generating energy in Vermont nearer our energy consumption would be more efficient. A2: Vermont resources have an economic advantage over out-of-state resources due to transmission loss from importation. Q: Have we learned any lessons from our earlier decisions about coming up with our energy mix and long-term supply stability? A1: Many mistakes were made but it is difficult to forecast the risk of various options. The decision makers must understand the risks involved inherent with each choice. A2: New England states, except Vermont, de-regulated because they were looking for a quick payback. They now generate 50% of their energy from natural gas, which is very risky. Vermont did not de-regulate and we have the lowest rates in New England. A3: We must look at the credit ratings of the businesses that we are dealing with. If we are looking at a 15-year contract, will they be around then. Many businesses go under.

Q: If nuclear power was not an option in Vermont, what alternatives are there in Vermont to fill the power supply? A1: Burlington Electric does not use any nuclear power; it is not an option. We use 2/3 renewable energy now and in the future want it to be 100%. We are small and our priorities are renewable energy and in-state generation. We may look to use wind and biomass in the future. A2: At Green Mountain Power, 40% of our energy comes from Vermont Yankee. The Sheffield wind facility will only produce around 40 megawatts. Existing hydro sources will not fill the void. If we didn’t use energy from Vermont Yankee, we would have to use energy from carbon emitting sources. We could consider a combined cycle gas plant but that costs $400,000,000 to build and would require partners. Q: What changes to the rate structure can be made to conserve energy? A1: We can try using smart meters which do not just measure electricity use, but can control household usage by turning off appliances during times when rates are at peak prices. The technology is still in the developmental phase. A2: Many states change the price of kilowatts per hour depending on the demand to create incentives to use power during low demand times. For example, they may charge below the regular price during low demand periods and significantly above the average price during peak demand periods. But we worry about people who cannot change their practices and the impacts of that kind of policy, especially on the poor. Q: How can the state give large users such as IBM incentives to develop co-generation facilities and their own sources of power? A1: We are meeting with IBM about co-generation and combined heat and power. We will discuss how they can utilize their waste heat but there are still questions how it will work, especially in the summer. A2: If we as a state want to encourage it, we must use the tax code as an incentive. Q: Why isn’t there a full inventory of our hydropower potential in Vermont? A: There are two studies that we utilized that estimated the hydropower resources in the state. The first came up with a potential of generating 10 mega watts. The second study was more comprehensive and came up with a potential of generating 40 mega watts. There is also a program now that is investigating new hydro sites and looking into costs. Q: How do we look at decisions holistically? A: We need to monetize the impacts of the many factors such as burning fossil fuels. But the challenge is that we also do not know what the future costs will be of some options

such as solar which may or may not become more affordable and competitive in the future. Q: How can we improve the permitting process for small-scale projects, such as local town projects? A1: We can’t control local politics. But we can standardize things to make installation easier. One challenge is that it is almost as expensive to evaluate a small hydro project as it is to evaluate a large hydro project. A2: Community Energy teams can fill the vision of Act 200. The hope was that there would be an energy conversation at the community level as part of the town planning process. Montpelier and Thetford have one. The small hydro projects are more common in Europe. If the whole community benefits, neighbors are less likely to complain. A3: Permitting a project has been difficult, but the Public Service Board in the Sheffield decision laid out a road map for how to permit a plant. There is out-of-state investment interest in renewable energy in Vermont. Q: Can small-localized energy projects play a role in meeting base demand? A1: The two contracts that are expiring provide 500 megawatts of power. The net metering program has been operating for 10 years and with all participants only generates 1 mega watt. Even when you add up all the small projects, the sum is not enough to replace the major energy sources currently used. A2: If we used 100% wind energy, there would be no energy when there was no wind. Therefore, we need a back-up system. New York State looked into it and determined that at most wind could provide 20% of their power. Q: Can the least cost source procurement rule really consider environmental impacts? A: The decisions consider the externalities such as environmental impacts. Another way could be to internalize the costs and benefits by requiring carbon-emitting sources to pay for a permit based on how many tons of pollution they emit. Q: What does the term “Efficiency” mean in the report? A: Efficiency refers to technological changes such as using compact florescent light bulbs. It does not include life style changes. Q: Engineering, permitting, and constructing a new energy plant in Vermont will take many years, given that many of the contracts expire in 5 to 10 years, what is being done now to plan for future in state facilities?

A1: It will take more than 5 years from inception to construction of a facility. We need to take input from citizens to find out what they want first. We could issue a request for proposal because we have to, one way or another, replace 80% of our energy under contract. We will also extend the contracts due to expire. A2: Utilities use the least cost source procurement; they do not guess public policy. If generating the energy in state is important, there needs to be clear legislation. If this is important, than the utilities and regulators will follow. Public Comment C1: Sweden is weaning itself off of oil without building nuclear power plants within 15 years. Iceland hopes that all cars and boats will be powered by hydrogen. C2: The age of cheap energy is coming to an end. We have been spoiled but now we have to face tough choices. In the long term, to live sustainably, we will need to have a less convenient life style. C3: Americans utilize a tremendous amount of energy and natural resources. We are 6% of the world’s population but we utilize 40% of the world’s energy and natural resources. We need educational programs in the school to teach children about how not to waste. C4: Thank you for the opportunity to provide input. While we have talked about the risks of various energy sources, the risk of climate change trumps all risks. Must put aside politics and do everything we can about energy efficiency. There should be public service announcements to educate the public. C5: Thank you all for this phenomenal process. Although many energy sources were discussed, I did not hear anything about geothermal systems, which can be used in many situations, including schools. We also need more educational programs in the schools; perhaps they can be funded from Efficiency Vermont. Individuals can lower their energy consumption, sometimes up to 50%. Beyond using compact florescent bulbs, people can lower energy by getting rid of phantom energy consumption (device chargers left plugged in, for instance).
C6: In the future, we will likely drive electric or hydrogen-powered cars therefore we will need to generate more electricity. If one uses wind power and there is no wind, most people use batteries. We can also use geothermal power. C7: Vermont Yankee is a deteriorating and aging facility that is operating at 20% over its rating. Three Mile Island was relatively new when the accident occurred there. The Nuclear Regulatory Commission made a list of potential hazards, but then stated that they were too remote to require any protection. To replace energy from Vermont Yankee, we could increase energy efficiency to 15%, (a savings of the equivalent of 1/2 of Vermont’s

energy from Vermont Yankee) and use other projects such as a co-generation facility for IBM’s own energy needs (that could supply 8% or ¼ of the power from Vermont Yankee). C8: Energy efficiency is popular but misunderstood. 70% must come from commercial and industrial uses, because they consume the most energy. The legislature passed a commercial energy code but there is no enforcement mechanism. If a technology is required by code, there is no need for an incentive program. Yet many commercial users do not install them and there is no enforcement. We need an enforcement program for the code to work. C9: There should be a mechanism so that we can invest in renewable energy. C10: Thank you for this process because it is important. But it is missing a large part of the climate change problem by not focusing on transportation and heating which generate 6 times as much carbon. We need a cultural shift. We did not get here by accident, but because we did not pay attention to the consequences of our actions. We need people to realize their responsibility to maximize efficiency. We need to look at full life cycle costs of all alternatives.
Vermont’s Energy Future Workshop Summary of Panel Discussion and Public Comments
Montpelier, Vermont October 18, 2007
Panel Discussion Panel Members Dave Lamont, Vermont Department of Public Service Richard Sedano, Regulatory Assistance Project Bob Griffin, Green Mountain Power
Q: What can Vermont do to create incentives for new technologies and promote renewable energy, and if successful, what percentage of our energy could we obtain from renewable energy sources? A1: We use the least cost source procurement method, which considers external costs as well as the cost of the resources. That method favors renewable energy because the externalities are added to combustion energy sources. The potential percentage from renewable energy resources is a difficult determination because it’s a moving target. Existing renewable sources account for approximately 30% of our energy, and wood fired energy sources could add several hundred megawatts, hydropower could add another 50 to 100 megawatts, and wind’s potential is hard to quantify. A2: We must look at smart metering where the meter provides a signal based on the current price of the energy and then the consumer makes changes based on the price information. Many new energy technologies are not economical in the beginning and need some funding source such as tax credits to get started. Green Mountain Power put in the first commercial wind facility in Vermont. Current technology utilizes much larger facilities, which have a capacity that is 30% to 40% greater. There is also the Clean Energy Fund, which awards grants to renewable energy projects. Q: How much do efficiency measures cost per kilowatt/hour and how much is saved? A1: The cost of efficiency is roughly 3 cents per kilowatt/hour. Efficiency Vermont’s most recent report stated that it was 3.5 cents per kilowatt/hour. The cost per kilowatt hour is reduced to 2.8 cents per kilowatt/hour if you consider the total cost saved. For example, if the customer buys a compact fluorescent light bulb and the utility pays $5 and the customer pays $3, the customer also has an additional savings because the energy efficient light bulb will not need replacement for 7 years. A2: We can increase our energy savings through efficiency by about 1% per year. After 10 to 15 years, there should be a savings of 10% to 15% or 100 to 150 megawatts. A3: The energy consumption growth rate in Vermont is 1%/ per year. We can use efficiency measures to offset the growth.

Q: What is the current subsidy provided to Vermont Yankee and what could be achieved if that amount was provided to renewable energy? A1: The total subsidy is hard to quantify. Congress passed legislation that authorized an insurance program. There is federal money spent on spent rod storage and disposal such as the facility being developed in Yucca Mountain in Nevada. There are also many other subsidies, but we don’t have a total amount of the subsidy. A2: We provide subsidies for virtually all sources of energy. For example, there are public canals that are used to transport coal and public roads are used to move other energy resources. Subsidies are everywhere you look but hard to quantify. Q: How do you measure true life cycle costs with quantifiable externalities? A1: Some externalities are actually internalized. In the New England power system, you have to buy credits to emit CO2 and SO2. But not all external costs are internalized and some of them are hard to quantify. The external costs in the report were based on the consensus of the experts on the resource team, but the costs determinations are subjective. A2: It’s hard to reach consensus among experts. Many questions are hard to predict. For example, when we run a long-term plan, we assume there will be a carbon tax, but we do not know what it will be. We run it with a tax at a few different rates to create different scenarios. Q: The impacts of carbon generation are so important, why did the report not consider global warming and try to quantify the impacts? A: There are two major approaches to externalities. What is the mitigation cost to control the damage and what is the compensatory cost to society to pay for the damage. Regulators are more comfortable with controlling the damage, i.e. cap and trade program. It is difficult because there isn’t a society wide acceptance of what amount of damage is acceptable. Should we focus on cancer deaths or polar bear deaths? Q: What is the state plan for energy use in heating and transportation? A: The state is currently working on a comprehensive energy plan. The Governor’s Commission on Climate Change is looking at reducing our impact on climate change by our choice of fuels. We could revive all fuel efficiency programs. Q: Is the 20% energy efficiency reduction figure aggressive enough and how can we educate people and use incentives to go beyond 20%? A1: If we want to go beyond the 20% reduction, we need a comprehensive plan. We need building standards and a code that ensures all construction meets a base level before we focus on incentives for even higher energy efficiency. There is little

enforcement of existing codes. Act 250 has saved a tremendous amount of energy consumption. We need vigilant enforcement of those permits. Efficiency Vermont programs are critically important and we need to make their programs available to all. We should also use the tax codes to create incentives and community energy teams. A2: Efficiency programs can target: 1) the opportunity to intervene, educate or utilize incentives for a consumer about to buy an appliance; 2) the consumer who was not about to make a purchase. The first category can cost around 3 cents per kilowatt/hour. The second category is much more difficult and much more expensive. A3: Efficiency Vermont’s annual budget has increased from $17,000,000 to $30,000,000. We can see what increased savings come from the increased budget and add more if it makes sense. Q: How do we increase Vermont’s energy independence and get Vermonters to generate their own power? A1: Generating your own power is now easier due to interconnection standards. The Renewable Energy Development Fund provides funding for many projects. We could also expand net metering so that energy independent homes that are connected to the grid could sell excess energy back to the grid. A2: Some communities manage to produce as much energy as they consume. You can use community energy teams to determine the local potential. A3: Utilities are actively interested in owning and operating their own facilities. We have 4 small hydro plants. Other communities can work with Community Hydro. Q: How do we decrease Vermont’s consumption by 50%? A1: That much of a reduction is a real challenge. Utilities are required to supply power to anyone who turns on their switch. We can only educate consumers to use less and increase efficiency. A2: Providing energy costs different amounts per kilowatt at different times of the day. We can send signals to the consumer by increasing the rate at peak demand to reduce energy consumption. The rate structure still could be revenue neutral if the consumers did not change their energy consumption patterns. But if they did change their consumption patterns, they could save money. Efficiency programs can reduce peak energy demand and be driven by economic self-interest. Q: What planning or activities are going on now to re-negotiate the major energy contracts? A1: We have ongoing discussions with both Entergy and Hydro Quebec. Since it takes 5 to 6 years to build an alternative facility, we need to talk to them now. If we do not renew
the contracts, we will likely have to replace the energy from the market, which means carbon emitting sources. Both Entergy and Hydro Quebec are interested in talking with us and it is in their self-interest to renew the contracts. This public engagement process can influence the policy. We do not have a plan in place yet. Green Mountain Power is looking at 5 to 6 renewable energy plants. A2: The challenge from a regulatory standpoint is that we enter into contracts at market price. But then the world changes. It is difficult to plan ahead because the energy market is volatile. Q: Since Vermont as a whole is a leader in energy efficiency, why isn’t the state government more of a leader in energy efficiency and why doesn’t the state enforce existing energy efficiency building codes and require energy efficient lighting? A: The state uses wood heated boilers in some facilities. The state also has an Energy Plan that looks at state operations. The state also participates in energy efficient programs. Q: How can we streamline the permitting process to make it easier for interconnectedness and renewable energy? A: Interconnectedness became easier with 248 J, which lowered the threshold of proof for applicants. But the neighbors to proposed projects have a right to participate in the process and their participation can add time and cost. Hydropower has environmental impacts too that cannot be simply brushed aside. Q: If Vermont citizens all say no to nuclear power, what will the policy makers do after the contract with Vermont Yankee expires to ensure that we do not default to using nuclear power because other options are not available? A1: Green Mountain Power currently gets 40% of its power from Vermont Yankee. The Sheffield wind facility will only produce around 40 megawatts. Existing hydro sources will not fill the void. Biomass has good potential but it would only produce a fraction of the energy from Vermont Yankee. We would need to default to the New England market, which is largely powered by natural gas. That leaves a significant carbon footprint, even if we could supplement it by using biomass and wind energy. We could consider a combined cycle gas plant but that costs $400,000,000 to build and would require partners. A2: If we didn’t use nuclear power, there are some options left but they produce carbon. The renewable “spigot” is on full now. In Massachusetts they use a Renewable Portfolio Standard (RPS), which requires that a set minimum percentage of renewable energy be used as part of the overall energy supply. Massachusetts is pulling in renewable energy business through the RPS. A RPS may not be necessary here because there is already a recognition that Vermont is looking for more renewable energy. The Clean Energy Development Fund provides funding for small-scale renewable energy projects.

A3: Even without energy from Vermont Yankee, there are interim steps that we can take to stabilize prices and energy availability. Q: Can we increase energy available from photovoltaic or Hydro Quebec? A: We can negotiate a new contract that would provide more energy from Hydro Quebec but it would require upgrades to the transmission lines. Trans Canada may also need to upgrade the transmission lines on their side too. It would also require a permitting process. The Clean Energy Development Fund provided funding to some photovoltaic projects in Vermont. We could also use the tax code to create incentives to make it economically competitive. The best sites are currently 20 to 25 cents per kilowatt/hour. Efficiency measures cost around 3 cents per kilowatt/hour and most other resources cost around 5 to 10 cents per kilowatt/hour. Public Comment C1: We need to use incentives to promote the use of renewable energy. We can improve our energy efficiency. In the Netherlands, they consume half the energy per capita as we do in Vermont. Nuclear power is not carbon neutral. Vermont exports nuclear energy and also hydro energy, including 100 megawatts from the Connecticut River and 34 watts from the Deerfield River. Community hydro projects have been operating for years and there have only been a total of 30 violations. A 1996 study documented 420 megawatts of undeveloped hydropower at approximately 150 sites. There is more that we can do with hydropower. I am pleased that this process has occurred but we needed to do it two years ago when we could have bought the dams on the Connecticut River. C2: We should use tariffs like in Germany to promote renewable energy. Renewable Portfolio Standards do not work. Nuclear power is not carbon neutral since carbon is generated when the facility is built. Montpelier has an energy team staffed by volunteers to reduce energy consumption. C3: There should be a website to coordinate volunteer efforts to conserve energy. I think there is a non-governmental website, but there should be a government-sponsored effort as well. C4: Thank you for this forum. We need to focus on educating people about conservation so that they adopt more energy conservation measures.
C5: The survey tonight demonstrated a preference for energy facilities located in Vermont. I am concerned not only about where the facility is, but who owns it. I am more concerned about Vermont Yankee now because we don’t own it anymore. If you own it, than you can control decisions about rates, operations, and future use. I would like to see more energy facilities located in Vermont and owned by Vermonters. I would not mind a coal fired power plant, but not here, maybe in Crawford, Texas.

C6: Vermont Yankee generates 650 megawatts or 1/33 of the power from the New England grid. When Vermont Yankee is off, we get our energy from other sources. For example, Vermont Yankee closes down every 18 months for refueling. We manage just fine when it is shut down, and therefore, we don’t need it. What it the real cost of an accident at Vermont Yankee. It may be incalculable. I would rather pay an extra $30 to $50 a month in my electric bill to avoid a nuclear accident. C7: We should be allowed to send in comments by e-mail. Schools are large consumers of electricity. We need to educate students about the need for conservation. The young people will get their parents to change their lifestyles. C8: After reading the materials I was ticked off how the indirect costs of some energy sources were left off. The costs of a nuclear accident or the storage of hazardous waste should be included. The problem was just brushed aside. If you don’t have an exact number, you should use an estimate. The direct costs of dealing with the hazardous wastes should be included. C9: Thank you for this process. I was disappointed in the response to the question about renewable energy. We all say we want more renewable energy but there was no clear answer about what we should do. The Vermont Council on Rural Development has a report that makes clear recommendations on how to adopt a more sustainable energy policy with more energy from renewable sources. Page 13 of the report lists the costs for various energy resources. The costs listed for wind and solar are not current market costs. They are way to high. Costs of different energy resources must be compared on a level playing field with the same credits. C10: The focus has been on planning for electricity. Transportation and heating costs will continue to rise. That will result in increases in demand for electricity. C11: Thank you for hosting this forum. I had not been aware of the Vermont Energy Education Fund. We must partner with the schools to educate kids about conservation. There should be science contests at schools focused on energy efficiency. C12: We have untapped resources in our forests. Approximately 80% of Vermont is forested. Selective cutting makes a forest more productive. The wood could be used for biomass power and has great potential. There could even be a state-owned wood fired generator. Right now most timber cut is shipped to Canada despite the transportation costs. Using the wood resources locally to generate power would create jobs in Vermont and be positive economically. If there were a shortage of loggers in the state, using wood for power would create jobs for them.

Vermont’s Energy Future Workshop Summary of Panel Discussion and Public Comments
Springfield, Vermont October 29, 2007
Panel Discussion Panel Members Dave Lamont, Vermont Department of Public Service Richard Sedano, Regulatory Assistance Project Patty Richards, Vermont Public Supply Authority Bruce Bentley, Central Vermont Public Service
Q: How do we capture externalities so that all consequences, including environmental impacts, are considered as part of our future energy sources determination? A1: We use the least cost test for resources that considers both the cost of the resource and the external costs to society. Some externalities such as air emissions are factored in using a quantitative monetary figure. Others are harder to quantify and are factored in on a subjective basis. A2: From a utility perspective, every three years we engage in integrated resource planning to determine where we should get our energy. These workshops are very helpful to us since they provide us valuable input from the public. When we add in the externalities, energy from natural gas costs more than wind because of the environmental impacts from burning natural gas. We are making a long-term plan that will focus on where we will purchase energy over the next twenty years. A3: Public Service Board decisions consider the externalities of the resource. If the legislature does not approve of their method for considering the externalities, the legislature can pass legislation with specific instructions how to factor in externalities. Q: How do you factor in climate change issues in making decisions between various potential energy sources? A1: Central Vermont Public Service has an integrated resource plan on its website. The plan looks at many variables including CO2 emissions. We look at the price of power of each resource compared to the CO2 emission of the resource. We also listen to public feedback through this process and others. A2: There is a Regional Greenhouse Gas Initiative between 7 states that puts a cap on carbon emissions starting in 2009. It also creates a trading system that allows you to sell the right for unused carbon emissions. This will result in creating a real price for carbon emissions that can be factored in to all considerations. Q: Can you discuss progressive pricing and whether it encourages energy conservation?

A1: A handful of states have experimented with progressive pricing to promote energy conservation. In addition, inclining block rates have been used in the past and have a demonstrated conservation impact. In inclining block rates, the rate per kw/hour increases with usage. The base rate will be set at a certain amount and usage over that amount will be at a higher rate. A2: The Department of Public Service is studying smart meters that send a signal back to the consumer based on the cost of producing electricity at the moment. If it is peak demand and the cost of electricity is at it highest, the customer will get a price signal (i.e., higher cost) that will encourage less use. Q: How do we educate consumers about energy conservation? A1: Energy Efficient programs are administered by Efficiency Vermont on a statewide basis. Efficiency Vermont has the expertise and is responsible for spreading the message about the need for energy conservation. A2: Utilities are working on energy efficiency issues by engaging in geo-targeting, which is an effort to determine where they can avoid the need to upgrade transmission lines. Q: In the long-term, what percentage of energy should be produced in-state and how can we stimulate biomass and small-scale hydropower? A1: We are currently looking at building our own power plants because we want to control our own destiny. We are looking 20 years into the future and part of our plan is to have our energy sources closer to home. A2: There is a think tank called the Biomass Energy Resource Center. The most efficient use of biomass may be co-generation of heat and power. We need to think about utilizing the process heat from biomass. Educational institutions and manufacturing facilities could likely use biomass co-generation facilities. Q: Given the benefits of energy conservation, why don’t we require progressive rate structures? A1: We need to ensure that low-income people who might not be able to control the timing of their energy usage can still afford any dynamic pricing rate structure. Another approach is to use inclining block rates where there is a base rate for a certain amount of usage and an increased rate beyond that amount. That has been used before and there is no bar to using it again. We could also make inclining block rates mandatory for homes over a certain square footage. Q: Can there be a different approach for residential versus business customers that are sensitive to the needs of each?

A: Residential rates can be flexible by allowing customers who prefer renewable energy the option to utilize renewable energy by charging a surplus on their bills. Commercial customers could have a different rate structure that rewards them if they reduce energy consumption when the load is near peak level and the prices to supply the energy are at the highest. If we reduce the base load, we reduce the price for all consumers, both business and residential. Q: Who will ultimately be making the decisions on future energy sources and based on what information? A1: The purpose of these workshops is to get feedback from the public. The decisions on where utilities purchase the energy is made by the individual utilities themselves. They make the choices and choose the power supply. Central Vermont Public Service has an energy source called “cow power” and consumers can choose to purchase their energy from that source for a surplus. A2: The decisions are made by the utilities after long-term planning. The municipal managers of the towns we represent make the decisions about where we purchase our energy. If we want to build an energy generating facility, the municipal consumers have an opportunity to vote and approve the project. A3: The Public Service Board also plays a role since they must review and approve a project. Q: Due to safety and environmental concerns about the existing centralized energy sources, can we use incentives to promote de-centralized power? A1: Net metering promotes renewable energy for home usage because it allows you to run your meter backwards based on the energy you produce in excess of the energy you consume. Another option with promise is community power generation. Utilizing combined heat and power looks to be the most economical option so far for community power. We are looking into distributive utility planning and need to figure out how to create incentives to promote it. We want to avoid the cost of more transmission wires. A2: There is a Clean Energy Development Fun funded by Vermont Yankee. The fund has $18,500,000 to be awarded to projects over the next 5 years. So far 20 to 25 small-scale generation projects have received grants ranging from $25,000 to $250,000. Q: What programs or incentives exist now and what new ones can be created to help the customer? A: New York State has an energy ombudsman who customers can call with any energy questions such as those concerning safety issues or rates. The ombudsman serves as their advocate. Vermont does not have an energy ombudsman.

Q: In order to promote renewable energy resources in Vermont, should we enter into long-term contract with Hydro-Quebec or will that serve as a disincentive to local renewable energy resources? A1: All resources whether from in-state or out-of-state compete in the same marketplace. Intermittent renewable energy resources are less valuable because of their uncertainty. If we enter into a contract with Hydro-Quebec, because the contract would likely be so large, we could use the energy for base power. Although Hydro-Quebec energy comes from a renewable resource, it is predictable because it is so large. In Vermont, our renewable energy sources are not so large and as a result less predictable. Therefore, Vermont renewable energy would be used to meet non-base energy needs. A2: Customers use energy on an intermittent basis. The utilities must follow the customers’ usage patterns. Q: Where is the replacement for the base load power likely to come from and will new sources be used? A1: It will not come from just one source. We want a diversity of sources to achieve stability in pricing and energy availability. We can look to some new sources such as wind and biomass. A2: The utilities have been working with the Department of Public Service to determine the economics of various potential energy sources, what can be licensed, permitted, and built in Vermont, or whether we should import energy to meet our base load needs. Q: Should we increase subsidies to solar, wind, and hydropower like some European countries do so that the equipment can be paid off in a few years? A1: Cow power would not be economical without the consumer’s willingness to pay a surplus for it. There is no silver bullet. Subsidies cost money and one place or another people have to be willing to pay for them. A2: New Jersey offers a generous tax credit for solar power. In addition to the financial incentives, New Jersey adopted a Renewable Portfolio Standard that requires utilities to purchase 22% of their energy from renewable sources by 2020. There is also a solar set aside that requires a minimum of 2% to come from solar power. They hope to cover all the big box stores with solar panels and make New Jersey the “Saudi Arabia of solar energy.” Q: Are there plans to upgrade the transmission lines so that Vermont can purchase power from out of state sources if necessary? A: VELCO is responsible for Vermont’s transmission lines. We are working with VELCO on a new 20-year planning process in an effort to match the needs of the consumer with our ability to distribute power. There is also the Vermont System Planning Committee

which looks for new cost-effective non-transmission alternatives to new transmission projects. They include 3 members of the general public on the committee and it seeks to operate in a transparent manner. Q: Why is it acceptable to expose Vermonters to the dangers of Vermont Yankee, which is an aging and deteriorating facility without a solution for its waste? A: The United States obtains about 20% of its energy from nuclear power. New England obtains a similar percentage of its total energy from nuclear power. Based on what energy resources we have now, if we did not want to use nuclear energy as part of our portfolio, it would require a long transition process. We can move away from nuclear power but it would require building new facilities and require us to buy more power from the grid. The power from the grid would come from natural gas or even more air polluting energy sources. It’s a complicated decision and in the end you have to choose your poison. Due to the slow process of building the Yucca Mountain storage facility, Vermont Yankee will have to store waste on site for many years. It may be possible at some point in the future to re-process the waste. Q: What are the true long-term costs (cradle to grave) of each energy source, not just the point of generation costs? A: The costs listed in the report were only intended to provide the costs for the utilities to purchase the power from each source. Air emissions are different since in the near future we will have to pay for a certificate to emit carbon. But those are the only other costs included in the report. For true cradle to grave costs, we need to include the externalities. We focused on carbon emission since those costs far outweighed most other externalities. Other factors can be considered, but are considered on a subjective basis. The Regional Greenhouse Gas Initiative will allow those states that do not use their entire allocation to sell the unused credits. The money from the sale could be invested in energy efficiency or clean energy generation projects. Alternatively, we could not sell the allocation credit and choose to simply retire it and the carbon would not be generated. Q: In light of the short time frame before 2 major contracts expire which supply two thirds of our energy, why are we so far behind in the planning process? A1: We are not that far behind. If those two contracts expire and we do not renew them, the lights will not go out. The Hydro-Quebec contract expires between 2012 and 2015. Even if we do not renew those contracts and do nothing else, the power will continue to flow from the grid. There is also plenty of activity going on behind the scenes as we begin the negotiation process. A2: We are doing things right now including negotiating new contracts with suppliers. Before we move forward, we want to hear input from the general public.

Q: What are the barriers and obstacles preventing Vermont from becoming a leader in distributed energy? A1: The most significant barrier is price. Small may be beautiful, but it is not cheap. Small wind turbines are expensive. Solar can be built on a modular system, but any way you do it is expensive. The cost is the issue and we need to make it economical. A2: Biomass has some potential, especially given the wood resources we have in the state. But even if we have the trees, we will need loggers available to work and currently there is a shortage of loggers. A3: Siting local facilities, even small ones, is complicated and can be difficult. The Public Service Board’s decision in the Sheffield wind turbines project lays out a road map for how to get a permit. Neighbors have the same right to participate in the permitting process for a small facility as they do for a large facility so the process can get complicated. Q: How can we find the political and cultural willpower and capital in Vermont to reduce our energy consumption to the levels of many European countries, which are half of ours per capita? A1: Vermont’s energy consumption per capita is lower than most other states. Our energy efficiency budget is already very high. The increased budget devoted to efficiency measures will pay us back and we will see the benefits in the coming years. A2: Europeans use more off-peak energy than we do, some for transportation and heating. We could use plug in electric cars that we charge at night and when necessary they could be used as an energy source at home. Q: Why doesn’t Vermont just renew the contracts with Hydro-Quebec and Vermont Yankee? A: The real question is at what price can we renew those contracts. Right now we are getting energy from both of those contracts at below market rate. For the new contracts both Vermont Yankee and Hydro-Quebec want market rate, which is more than we are currently paying. Q: The Vermont Public Interest Research Group issued a report called “A Decade of Change” that made many recommendations included getting 80% of our energy from the current Hydro-Quebec contract plus Vermont based renewable energy resources. Our energy portfolio could include the following Vermont based renewable resources: 20% from biomass (wood), 2% methane (landfill and farms), 10% from Vermont hydro power projects, 20% from wind farms, and 4% from small scale customer generated projects. Can we wean ourselves off of energy from Vermont Yankee and adopt these recommendations?

A1: The simple answer is yes. We want to diversify our portfolio. We need energy from many sources, not just one. A2: Obtaining 20% of our energy from wood biomass projects would require a big push and is ambitious. Q: Green Mountain Power was sold to a large Canadian company. What additional resources will this large company bring to the table? A: Our utilities are small and it is difficult to finance large-scale projects. With efficiency of scale, Green Mountain Power will have resources to consider new larger projects. Public Comments C1: We do not fully appreciate the potential for global disaster as a result of climate change. All of us will have to live on 20% of what we have now. We must plan a back-up system that is not dependent on fossil fuels. We need a sustainable economy that gets all its energy from within our borders. We should eliminate any obstacles to net metering. We should be able to generate our own power and sell it back to the grid. C2: We must make our decision soon on whether to close Vermont Yankee. On climate change, we need to look beyond electricity and also focus on the greenhouse gases produced when energy is used for transportation and heating. We need to be bold and ask citizens to make changes and sacrifices. According to your charts, it appears that Vermont consumes less electricity compared to the rest of New England. This may be explained by the high percentage of second homes in Vermont that are not occupied much of the year. C3: I believe strongly in the potential for wind and solar energy. All commercial consumers should have net metering. C4: The sun will not shine at night and the wind will not always blow. Therefore, we need to develop storage capacity for those technologies. The recent natural gas proposal was shut down by a tiny group of activists. In negotiating with Hydro-Quebec, I know they will be very hard-nosed negotiators. But we need to recognize that they have invested billions in equipment and they need to sell the energy to a limited natural market. C5: Thank you for this process. The debate must be on a national level. Carbon swapping will be a shell game and a mess. Energy policy must be looked at on a national level. C6: Thank you for organizing this meeting. The materials read “energy efficiency is available at all times and tends to reduce demand.” From an engineer’s perspective, efficiency means getting a job done with less energy. Conservation means not doing a job

to save energy. They are different concepts. One reduces demand and the other the cost of the demand. C7: I appreciate the materials but have concerns about the comparisons between energy sources on page 15. Energy efficiency reduces the impact; it doesn’t just have zero impact. Nuclear waste is not just an impact, it is an off the scale impact. Solar heated hot water is a cost effective option. The legislature passed a bill to make it easier to build medium scale wind and hydro facilities, but the governor vetoed the bill. C8: I think the school systems should pay more attention to energy conservation and efficiency. C9: The report is biased because it lacks cradle to grave costs, such as the cost of mining for uranium. We must develop incentives for innovative technology. Vehicle-to-grid systems could be an option because we could recharge the car batteries at work with solar panels. Then after you drive home you recharge your car with renewable energy there. Geothermal is not in the materials but it is economical and a site is planned in New Hampshire. It may be cost effective for Central Vermont Public Service to help pay for hybrids rather than build new power generating facilities. C10: We must distinguish between municipal owned utilities, investor owned utilities, and cooperatives. Municipal owned utilities take input from their residents. Central Vermont Public Service is shareholder owned and interested in returns. We must think 100 years into the future. Vermont Yankee is aging and will close down someday. Therefore the question is do we want to generate another 20 years of nuclear waste without a place to put it. It is short sighted to focus on Vermont Yankee as a solution. We must focus on renewable alternatives right now. C11: It would be great if micro-scale power facilities could be supported to allow for real distributed power. The keypad polling did not allow us to fully express our opinion. How do we give you our ideas? Efficiency Vermont should work on energy audits in schools and educate children in the process. We need to focus energy efficiency resources on school buildings. C12: Base load is a big problem. Why did Vermont not buy the dams on the Connecticut River when it had the chance? At this point they could have been self- funding. C13: The sale of the dams on the Connecticut River was like a bankruptcy sale. The dams went cheap and we missed a good deal because the governor does not believe in public ownership of power generation facilities. In the 1970’s we woke up to realize that our dependency on energy was a problem and that we needed to conserve energy. Vermont may be a leader in the country on energy efficiency but we are still just scratching the surface of energy efficiency. The energy star designation system is misleading. If they improve the efficiency, the appliance gets a good energy star rating even if it is still an inefficient appliance. A few years ago the Public Service Department issued a report, which stated that we could reduce our demand by 30% through energy

efficiency. The current report now states that demand could only be reduced by 15%. Why was this number lowered? Also, nuclear energy is not carbon neutral. Mining the uranium, transporting the uranium, and storing the waste generate greenhouse gases. The waste storage is the biggest externality there is. C14: Vermont Yankee is deteriorating and has major safety issues. Maine Yankee was shut down when it was near the end of its life span. It is unrealistic to think that Vermont Yankee can run safely for another 20 years.

Vermont’s Energy Future Workshop Summary of Panel Discussion and Public Comments
Rutland, Vermont October 30, 2007
Panel Discussion Panel Members Dave Lamont, Vermont Department of Public Service Richard Sedano, Regulatory Assistance Project Bruce Bentley, Central Vermont Public Service
Q: What approaches have succeeded elsewhere to increase energy efficiency and reduce consumption? A: Many states emphasize energy efficiency but Vermont is known nationwide as a leader in the field. In California, they view energy efficiency as a primary resource and embrace it as a state policy. Importantly, the utilities are also supportive of energy efficiency. Q: How can we encourage community distributed energy projects? A1: We are working on interconnectedness to make connecting to the grid an easier process. An advantage of distributed energy is that the more prevalent it is the less new transmission wires we will have to build. Net metering would allow homes with renewable energy to run the meter backwards. You could also allow the homes to sell the energy back to the grid at a wholesale rate. A2: We have developed standard tariffs for larger community projects so that separate contracts for each individual facility do not have to be negotiated from scratch. A3: The Clean Energy Development Fund is funded by Entergy. The fund awards grants to innovative projects including distributed energy. Q: What can Vermont do so that small-scale wind generator projects do not get squashed by NIMBYs? A: It is a difficult question because if the neighbors do not like a proposed project, they have a right to participate in any permitting process. Public participation is required and there is no way to streamline that part of the process. Q: What is the potential for green design standards and can Vermont require it? A1: Vermont passed Act 200 twenty years ago with the hope that towns would begin energy planning on a local level. Some towns do it but most do not. Montpelier and Bennington have energy planning committees because residents want it. Some of the committees are working with each other, which is an exciting development.

A2: Rutland also has an energy committee and there is an opportunity for people to participate in the process. Q: What do you expect the new contracts for Hydro-Quebec and Vermont Yankee will look like in terms of cost and the length of the contract? A1: I expect the contract will be negotiated for close to market price. They can sell into the open market for that price. Perhaps we can find a value for them to sell to us and then we can negotiate a deal slightly below market price. A2: We convened this workshop to find out what the general public wants. There is no real incentive for anyone to sell us power below the market price. The Vermont Yankee license must be approved by the legislature. The contract must demonstrate a benefit to the state and a low price would be such a benefit. A3: We may regret a fixed price contract if the market goes down. It makes sense to have a balance of some long-term fixed price contracts and some at market price. A4: Utilities can also stimulate competition by issuing a request for power and get bids. We can also take risks and build our own power facilities. Q: How do we create incentives in the energy market so that consumers pay attention to the energy they use and the externalities produced? A1: Vermont has joined the Regional Greenhouse Gas Initiative that caps CO2 emissions and charges for higher emissions. Greenhouse gas emitting energy resources will become more expensive. A2: We communicate through our pricing structure. If we charge the same for energy at all times even if producing it costs more at different times, we are not communicating well. We could charge more for energy when producing the energy costs more. Smart meters communicate to and from the customer. They let customers know when the prices are higher and let the customers make their decisions accordingly. Q: We want more of the power produced in Vermont to stay in Vermont. What is Vermont’s power to control the export of power? A1: There are two types of plants; utility owned plants and merchant owned power plants. If you own and control the plant, you can dictate where the energy is used. If a merchant owns the power plant, they can sell it anywhere they want unless restricted by a contract. A2: Electrons go where electrons go. Even if they are exported out of state, they still make Vermont’s system more reliable because of transmission losses. Under the federal transmission regulations, if it is in the national interest, the federal government can dictate the transmission path along interstate lines.

A3: If the power is from a renewable source you can earn renewable energy credits. States with renewable portfolio standards have created a market for renewable energy and may buy renewable energy credits from us. Therefore, there is an incentive for some of that power to be sold out of state. Q: When will the technology become available to allow many homes to become energy independent because they produce their own energy? A: The technology is already there. The issue is the cost. We need a break through in the economics of the technology so that more will be needed and then they will also get the added benefit of economy of scale savings. Q: How can demand side management be incorporated into state energy planning? A1: We already do that through the use of least cost planning. Under that scenario, utilities should adopt the least cost source, which is energy efficiency. The budget for Efficiency Vermont has almost doubled recently. A2: We can use peak load management. It may be cheaper to build back-up generators to clip the peak than to build more plants and transmission lines. Q: What is the potential for sustainable yield biomass projects and what size facilitates sustainability? A1: There are a few limiting factors such as the wood supply for large facilities designed to generate 150 to 200 megawatts. Another limiting factor may be the availability of loggers to cut the trees. A more practical size facility would generate 40 to 50 megawatts thereby minimizing the transportation costs but still realizing some advantage from economy of scale. Biomass plants should have a forestry and environmental plan for each harvest, like the McNeil plant. A sustainable harvest plan could also be required which would have a forester approve the plan to minimize impacts. A2: The governor has a climate change webpage that looks at the environmental trade offs between various options. A3: Biomass can be used for combined heat and power plants. Otherwise if there is a limited supply of wood, we need to balance generating BTUs and kilowatts. Q: What can be done to educate realtors, builders, bankers, and contractors about the need for energy efficiency? A: I think sustained public engagement on a regular basis is necessary but it requires a source of funding.

Q: What is the state doing to promote cutting edge technology such as combined heat and power systems? A1: The Clean Energy Development Fund in one way we are trying to fund innovative cutting edge technology. But Vermont is small and therefore we cannot play much of a role in research and development compared to larger states such as New York and California. Those states have huge budgets for research and development. The Clean Energy Development Fund can provide grants for the implementation of projects. A2: We track the development of new technology but we are generally not the developers of the new technology. There is an organization called the Electric Power Research Group that is comprised of independent research and development organizations. We are not members because it is expensive, but we still receive many of the benefits of their work. Q: Are there enough other energy choices available to consider not renewing the contracts with Vermont Yankee and Hydro-Quebec? A1: Yes, if we are willing to pay the costs. A2: When the contracts expire with Vermont Yankee and Hydro-Quebec the lights will not go out. We would just purchase the energy from the grid. But if demand exceeds supply on the market, the price will go up. Deciding what path to choose depends on how we value price certainty, absolute price, and the environmental impacts. Q: What would it take to increase the use of system-wide decentralized energy sources? A: In the 1930’s each town had its own source of energy. Than we had the idea that it would be more efficient to string wires between the towns so that if a town generates more power than it needs, it could pass the excess along to other towns that might need it. We could go back to the old system but it would be best to have a balance of local sources and centralized sources of energy. Q: Since we get so much power from Canada are we at a greater vulnerability if for reasons of national security or other compelling need, Canada may need to keep all of the power it generates? A1: Canada exports large quantities of natural gas to the United States. It is likely in the near future that Canada will need to keep more of their natural gas in Canada. But there will likely be an increase in demand for low carbon emitting energy resources and Canada has plenty of those. They may need to build more dams or wind turbines, but they could generate more power if they needed to. A2: Quebec has huge capabilities to import hydro and wind power and will want to continue importing renewable energy to the United States.

Q: How can we improve the reliability of the distribution system? A1: The infrastructure is there. The challenges are the storms and the trees that fall on the transmission wires. We have a good system, but it has its vulnerabilities. If everyone drove a hybrid car and charged it off peak, then they could use the battery as a back up power source in case there is a power outage. Underground lines are another possible solution but burying the lines is an expensive option and still is not foolproof. A2: We are working with the utilities on their tree cutting plans. We also have a Service Quality Reliability Program (SQRP) that rates each utility based on their outages. If the scores are too low, the utility is assessed a penalty. Q: What are government and industry leaders doing and what are they prepared to do to make renewable energy more available and cost effective? A1: Renewable systems cost what they cost and many are not inexpensive. Renewable energy certificates that require utilities to buy energy from renewable energy sources or buy a renewable energy certificate is one option, but that does not necessarily make renewable energy any cheaper. However, it should make it more economically attractive to build renewable energy facilities. A2: Net metering is one possible solution. Utilities must also meet increased load growth with renewable energy sources. Some solutions such as cow power work because consumers are willing to pay 4 cents per kilowatt more for it. A3: States must adopt policy initiatives and work in concert with the utilities so that we are all working together towards increasing the use of renewable energy. Q: How do we change the regulatory policy to move towards increased sustainability? A: All elements must work together towards a common goal. Efficiency Vermont can promote energy efficiency and we must have rates that favor energy conservation. Siting renewable energy facilities such as wind turbines and biomass generators will likely continue to be challenging. Q: How do we build leadership and support to invest in renewable energy and conservation for a better future? A1: We are already making that investment in our future. For example we doubled the budget of Efficiency Vermont. While we will all pay for the increased budget, we will all benefit from the investment. The Sustainably Priced Energy Enterprise Development program (SPEED) requires that load growth must be met through the use of renewable energy. That policy forces us to use more renewable energy. A2: Through these workshops, the public has expressed a preference for renewable energy and a willingness to pay extra for it. But we need to be careful and not impose that

choice on all people since lower income people might not be able to make the same choice, even if they wanted to. Q: Why can’t we change the rate design to promote energy efficiency? A: If we change the rate design, there will be winners and losers. You can try and minimize the number of people who will be detrimentally affected, but you can’t eliminate it entirely. Low-income consumers who need to use energy during peak hours and who cannot change their usage pattern would be put in a tough position. We must remain aware of the social implications of potential rate changes because some people might get hurt and we need to protect them. Q: Why don’t we use biomass projects for combined heat and power? A1: About 20 years ago there was a hope that biomass gasification would be the answer but it has not been successfully developed and lived up to its potential. The technology just is not there. A2: The other part is cost. How do we use waste heat? There are cost issues associated with that question especially when the need for the heat is not at the same location of the power facility. A3: Combined heat and power facilities may be possible for hospitals. Public Comments C1: All of our lives are affected by our energy usage. A few of the answers from the panel were either vague or misleading. The panel also went blank for a moment when asked what the state was doing to promote renewable energy. There were few specific answers. But the audience knew what it wanted. We need to consider the externalities of the resources. The fuel for nuclear power comes from Kentucky and the place that creates it is the largest single electricity consumer in the country. The carbon footprint of nuclear power is similar to the carbon footprint of natural gas. Approximately 63% of the audience was opposed to Vermont Yankee. The audience is willing to pay more for clean energy. We want an independent safety assessment of Vermont Yankee. Windham county residents cannot buy insurance from damage associated with Vermont Yankee. C2: Thank you for asking us for our input. We hope you implement what we are telling you. The energy bill before Congress includes insurance for nuclear power plants. It also may limit information available to the public because of concerns about national security. C3: Thank you to the panel for attending the workshop. We still use non-renewable resources to create renewable energy and need to move towards only using renewable energy.

C4: We live in a different world and we need to change from our old ways. The demand for oil is growing but the supply is leveling off or even declining. Also, the impact of climate change cannot be underestimated. The decision making process on a public level must keep those two paramount principles in mind. C5: Foam board insulation should be required to display its R factor in a clear way. This sample here has an R factor of 27 per inch and is fire rated as an A. It is a significant improvement over fiberglass insulation. The state should publish a “frequently asked questions” brochure on how to build your own combined heat and power facility and use net metering. Homeowners who generate more power than they use should not lose the excess credit. They should be able to sell it back to the grid. C6: Peak oil concerns impact electricity costs. Society as a whole does not understand the implications of the problem. The report did not include it as a limiting factor. We face a huge challenge because in the future we will have less energy flow. Oil and other fossil fuels are used to generate other energy sources, including the mining of energy resources. If we do not consider the limited supply of oil, we are ignoring an important issue. My plea is that you include the peak oil limitations in your planning. C7: One element of the keypad polling was disturbing. In many questions we were asked how much we would be willing to pay for a particular resource. But the demographics of this audience are not a representative cross-section of Vermont. There are many more college graduates in the audience who have a greater disposable income than other Vermonters who are not here tonight. There is a potential social injustice issue. C8: Nuclear power plants are dangerous and I once said that they are more dangerous than nuclear bombs. But I am optimistic about the future because people are beginning to understand the energy problems we face and the consequences. The technology will hopefully follow. We need the political will to bring on the new technology. There are new safe nuclear power plants being built in China that use an energy amplifier and produce no waste. Photovoltaic energy may become more economical. We must abandon the old nuclear energy technology that was developed in the 1950’s. That nuclear technology is far from carbon neutral given the mining process that moves mountains and the crushers used. C9: The capital costs for a new nuclear facility are prohibitive because there are to many variables. Uranium is a finite resource and there is a risk of external events. In addition, there has been no cradle to grave decommissioning of a large-scale plant completed to-date. C10: Thank you to the panel for attending the workshop. Some renewable energy solutions fit the state’s resources because it uses our land resources and also offers recreational opportunities. The solution is to use ski resorts to develop wind energy facilities.

C11: The report included advantages and disadvantages of various energy resources. I would like to add that nuclear energy impacts wildlife habitats because warm water is discharged into the river for cooling. For coal, we need to look not only in Vermont, but also to the impacts of the mining where they are tearing mountains apart. For wind power aesthetics, I personally would rather look at wind towers rather than junkyards. In the keypad polling, Hydro-Quebec was more popular than Vermont Yankee. Can we count on Hydro-Quebec for power in the future, especially now that the Canadian dollar is on par if not higher than the U.S. dollar? We need to diversify, even if we are only taking small steps right now. C12: Oil will become less available in the future, not just more expensive. As a result, it will cost more for manufacturing and to maintain our infrastructure. If there is no oil available, we may need to convert to electricity to heat our homes. This will impact electrical power supply.

Appendix E: Regional Workshop Background Document

VERMONT’S ENERGY FUTURE
Regional WorkshopsOctober 2007

Vermont’s Energy Future iii
Thank you for your interest in Vermont’s Energy Future, an effort to engage the public in helping to shape Vermont’s electricity future. This effort will as-sist in informing decision makers about how best to plan for Vermont’s future electricity needs. Autho-rized in 2006 by the Vermont Legislature (Act 208), this process has been endorsed by the Governor and the Joint Energy Committee.
Why plan now? Currently, Vermont imports about half of its electricity from out-of-state sources, primarily from Hydro-Québec and the New England Power Pool. Vermont obtains approximately one-third of its energy from the Vermont Yankee Nuclear Power Plant. The state has been a leader in biomass-produced electricity for over 20 years and spends more per capita on energy efficiency than any other state. As a result of previous decisions, Vermont has the lowest electricity rates in New England and one of the lowest electricity-related carbon footprints in the nation.
However, in 2012, contracts providing for two-thirds of the state’s electric power begin to expire. This leaves the future source of Vermont’s electricity open for dis-cussion and examination. Choices about the future will have to be made and will require weighing trade-offs among cost, reliability, environmental impact, large and small scale generation, and in-state versus out-of-state sources.
What is the process? Vermont’s Energy Future will employ two important means to enlist the pub-lic’s help. The first are five public workshops to be held across the state over the month of October. In-terested Vermonters are being asked to attend one of those workshops in their region to learn more about electricity choices, to deliberate with fellow citizens, and to offer their viewpoints using a technology called keypad polling. The second means of involving Ver-mont citizens is a process called Deliberative Polling, which has been used in Nova Scotia and in Texas for energy planning. Deliberative polling involves select-ing a representative sample of some 200 participants from across Vermont and bringing them together for a weekend of education, deliberation, and polling.
Why participate? Your input matters. Vermont’s Energy Future is an opportunity to help shape the dis-
cussion and to influence decision makers early in the planning process. Your input will help all parties in-volved in energy planning and decision making—the Governor, the Legislature, the Department of Public Service, and the utilities—to understand Vermonters’ concerns and priorities as they consider the best mix of energy resources to serve Vermont in the coming years.
Who has helped shape the process and cre-ate these documents? An Advisory Committee and Resource Panel made up of individuals represent-ing diverse points of view spent many hours together to help develop this background document. The goal was to prepare materials to expose Vermonters to the full range of views concerning planning for Vermont’s electricity future and the many issues involved. Giv-en the diversity of views, not all of the advisors would agree about what Vermont’s energy future should be, but all would concur that Vermonters should have the benefit of hearing from a variety of perspectives.
Where and when will the public workshops be held? The free public workshops will be held over the month of October. Each event will open with registration and a light dinner at 5:30 PM, start promptly at 6:00 PM, and run until approximately 10:00 PM. The locations and dates are listed below. Registration is required. To register for one of these events, go to www.vermontsenergyfuture.info. Please register for and attend the workshop closest to you. To ensure broad and diverse participation from across the state, participants may only register for one work-shop.
Oct. 3, 2007St. Johnsbury Elementary School, St. Johnsbury, VT
Oct. 17, 2007 South Burlington High School, S. Burlington, VT
Oct. 18, 2007 Montpelier Elks Club, Montpelier, VT
Oct. 29, 2007Dean Technical Center, Springfield, VT
Oct. 30, 2007Rutland Intermediate School, Rutland, VT
Introduction
Vermont’s Energy Future iii

Vermont’s Energy Future iv
Acknowledgements
Advisory Committee
Group Represented Representative Additional InformationUtility—investor owned Robert Griffin
(802) 864-5731 [email protected]
Mr. Griffin is a power supply planner for Green Mountain Power, Vermont’s second largest electric utility.
At large member—regulatory expertise
Richard Sedano(802) [email protected]
Mr. Sedano is the Director of the Regulatory Assistance Project and previously held the position of Commissioner at the Department of Public Services.
Utility—municipal Patricia H. Richards(802) 244-7678 x [email protected]
Ms. Richards is a planner with the Vermont Public Power Supply Authority.
Interest group James Moore(802) 223-8421 X [email protected]
Mr. Moore is a staff member with Vermont Public Interest Research Group, and deals with energy and environmental issues.
Regional planning James Matteau(802) [email protected]
Mr. Matteau is the Director of Regional Planning at the Windham Regional Commission.
DPS David Lamont(802) [email protected]
Mr. Lamont is a planner at Vermont Department of Public Service and has worked on many projects in his tenure.
IBM—large consumer Steve Blair(802) [email protected]
Mr. Blair is Site Energy Manager at IBM, and responsible for Electricity, Fuel, and Energy Conservation.
Utility—investor-owned Steve Costello(802) [email protected]
Mr. Costello is Director of Public Affairs at Central Vermont Public Service.
Resource Panel
Resource Representative Additional InformationEfficiency/ODR Patrick Haller
(802) [email protected]
Mr. Haller is Efficiency Vermont’s New Residential Construction Market Manager.
Solar Andrew Perchlik(802) [email protected]
Mr. Perchlik is the head of Renewable Energy Vermont and interacts with solar vendors within the state.
Wind John Zimmerman(802) [email protected]
Mr. Zimmerman works for the Vermont Environmental Research Association. He is a foremost authority on wind resource and siting potential in the State.
Vermont’s Energy Future iv
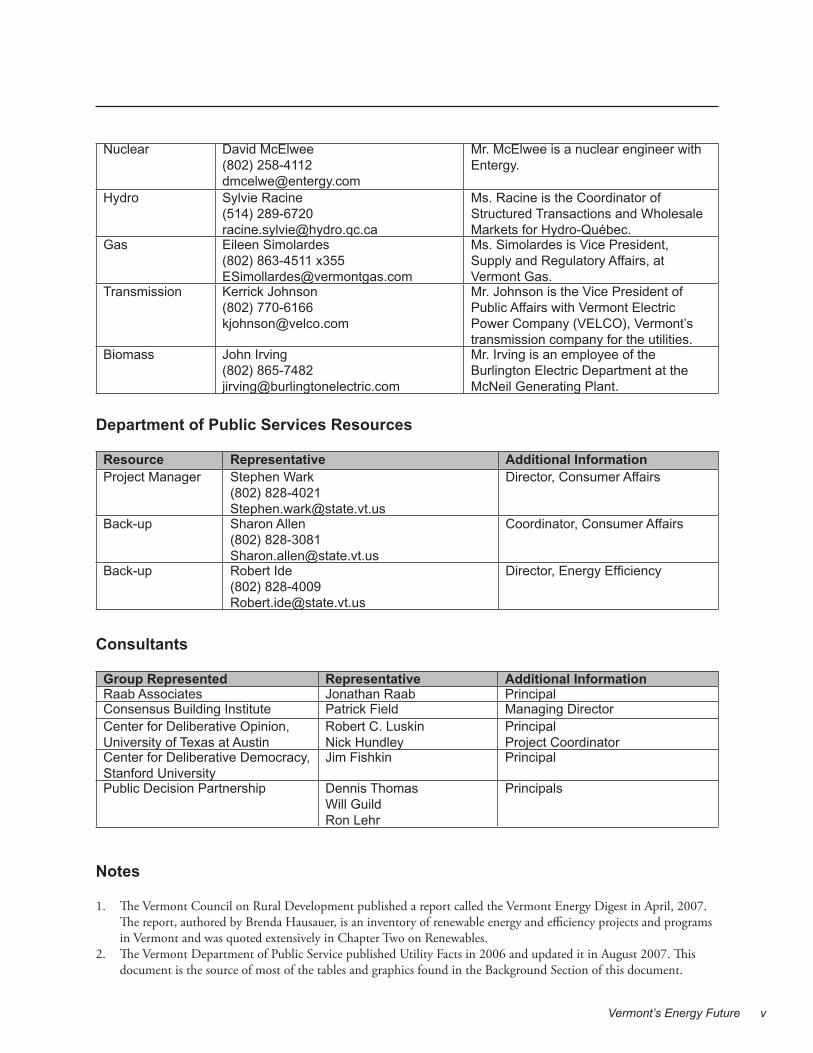
Vermont’s Energy Future v
Nuclear David McElwee(802) [email protected]
Mr. McElwee is a nuclear engineer with Entergy.
Hydro Sylvie Racine(514) [email protected]
Ms. Racine is the Coordinator of Structured Transactions and Wholesale Markets for Hydro-Québec.
Gas Eileen Simolardes(802) 863-4511 [email protected]
Ms. Simolardes is Vice President, Supply and Regulatory Affairs, at Vermont Gas.
Transmission Kerrick Johnson(802) [email protected]
Mr. Johnson is the Vice President of Public Affairs with Vermont Electric Power Company (VELCO), Vermont’s transmission company for the utilities.
Biomass John Irving (802) [email protected]
Mr. Irving is an employee of the Burlington Electric Department at the McNeil Generating Plant.
Department of Public Services Resources
Resource Representative Additional InformationProject Manager Stephen Wark
(802) [email protected]
Director, Consumer Affairs
Back-up Sharon Allen(802) [email protected]
Coordinator, Consumer Affairs
Back-up Robert Ide(802) [email protected]
Director, Energy Efficiency
Consultants
Group Represented Representative Additional InformationRaab Associates Jonathan Raab PrincipalConsensus Building Institute Patrick Field Managing DirectorCenter for Deliberative Opinion, University of Texas at Austin
Robert C. Luskin Nick Hundley
Principal Project Coordinator
Center for Deliberative Democracy, Stanford University
Jim Fishkin Principal
Public Decision Partnership Dennis Thomas Will Guild Ron Lehr
Principals
Notes
The Vermont Council on Rural Development published a report called the Vermont Energy Digest in April, 2007. The report, authored by Brenda Hausauer, is an inventory of renewable energy and efficiency projects and programs in Vermont and was quoted extensively in Chapter Two on Renewables. The Vermont Department of Public Service published Utility Facts in 2006 and updated it in August 2007. This document is the source of most of the tables and graphics found in the Background Section of this document.
1.
2.

Vermont’s Energy Future vi
Vermont’s Energy Future vii
Introduction iiiAcknowledgements iv
Chapter 1: Background Information 1Chapter 2: Comparing Attributes of Resource Options 13Chapter 3: Resource Options 19
Appendices (Will Be In Separate Document) A. Full Resource Option Descriptions B. Cross Cutting Issues C. Comparative Resource Cost Assumptions
Table of Contents
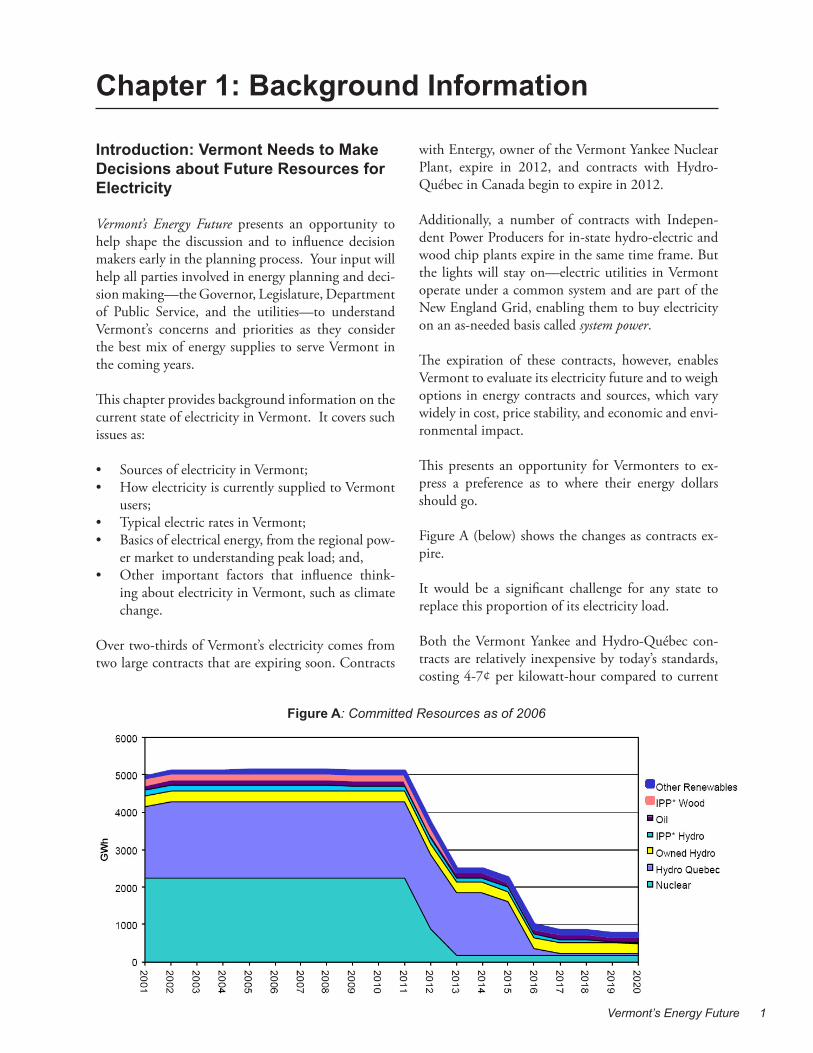
Vermont’s Energy Future �
Chapter 1: Background Information
with Entergy, owner of the Vermont Yankee Nuclear Plant, expire in 2012, and contracts with Hydro-Québec in Canada begin to expire in 2012.
Additionally, a number of contracts with Indepen-dent Power Producers for in-state hydro-electric and wood chip plants expire in the same time frame. But the lights will stay on—electric utilities in Vermont operate under a common system and are part of the New England Grid, enabling them to buy electricity on an as-needed basis called system power.
The expiration of these contracts, however, enables Vermont to evaluate its electricity future and to weigh options in energy contracts and sources, which vary widely in cost, price stability, and economic and envi-ronmental impact.
This presents an opportunity for Vermonters to ex-press a preference as to where their energy dollars should go.
Figure A (below) shows the changes as contracts ex-pire.
It would be a significant challenge for any state to replace this proportion of its electricity load.
Both the Vermont Yankee and Hydro-Québec con-tracts are relatively inexpensive by today’s standards, costing 4-7¢ per kilowatt-hour compared to current
Introduction: Vermont Needs to Make Decisions about Future Resources for Electricity
Vermont’s Energy Future presents an opportunity to help shape the discussion and to influence decision makers early in the planning process. Your input will help all parties involved in energy planning and deci-sion making—the Governor, Legislature, Department of Public Service, and the utilities—to understand Vermont’s concerns and priorities as they consider the best mix of energy supplies to serve Vermont in the coming years.
This chapter provides background information on the current state of electricity in Vermont. It covers such issues as:
Sources of electricity in Vermont;How electricity is currently supplied to Vermont users;Typical electric rates in Vermont;Basics of electrical energy, from the regional pow-er market to understanding peak load; and, Other important factors that influence think-ing about electricity in Vermont, such as climate change.
Over two-thirds of Vermont’s electricity comes from two large contracts that are expiring soon. Contracts
••
••
•
Figure A: Committed Resources as of 2006

Vermont’s Energy Future 2
A municipal electric supplier might have more flex-ibility to develop a localized generation mix, but may have fewer customers to share research costs in new or experimental technologies.
Rates for all utilities are approved by the Vermont Public Service Board.
Electric Generation in Vermont Vermont purchases about half of its electricity from generation sources in other states or in Canada. With the exception of energy from the Vermont Yankee Nuclear Plant, electricity generated in Vermont is mostly hydro or wood-fired.
Electricity usage in Vermont peaks at around 1,100 MW in the summer, 46% of which is imported. The average usage is 700-750 MW.
While there are advantages and disadvantages to im-porting energy, one question is whether this level of imports concerns you as a customer.
Vermont also exports energy—55% of power from the Vermont Yankee Nuclear Plant is sold to other New England customers.
Electricity Consumption in Vermont A good way to think about electricity consumption is in terms of fuel type. Each fuel type has its advantages and disadvantages, differing in price, environmental impact, and other factors.
Figure B (following page) shows fuel types used to generate the electricity consumed in Vermont. The area labeled “System Power A” represents purchases from New England’s power market.
The area labeled “System Power B” represents power purchased from the New England market in which the renewable attributes were sold.
For comparative purposes, Figure B shows electricity sources for New England and for the United States. One factor not reflected in these charts is that Ver-mont has one of the most aggressive energy efficiency
market prices of about 8¢ per kilowatt-hour. Additionally, nuclear and hydro power produce little to no greenhouse gases, unlike natural gas, oil, or coal.
As you can see, the decisions we face on the future of our electric supply are very important.
Some Helpful Information About Elec-tric Generation, Transmission, and Re-source Planning in Vermont
Electric UtilitiesTwenty separate electric companies provide electricity to homes and business in Vermont. Each fits into one of three categories:
Investor-Owned Companies, including Cen-tral Vermont Public Service, Green Mountain Power, Vermont MarbleMunicipal Electric Departments, such as Bur-lington Electric Department and the Village of Ludlow (there are fifteen of these) Electric Cooperatives, including Vermont Elec-tric Cooperative and Washington Electric Coop-erative
Electric utilities are responsible for the following:Procuring Power (one-half of Vermont’s electric-ity is purchased from generation sources located out of state)Building and Maintaining Generation Sources (on a limited scale)Building and Maintaining Transmission and Distribution Lines
Conducting Long-Term Planning
Managing Local System Reliability
Metering and Billing for Retail Sales
Collecting Funds to Support Demand Side Management (DSM) Programs (energy effi-ciency)
Electric utilities differ in governance (who makes the decisions) and ownership (who puts up the investment capital, takes the risk, and earns the returns).
•
•
•
•
•
•
•
•
•
•

Vermont’s Energy Future �
Figure B: Electric Energy Supply in Vermont, New England, and the United States
Source: VTDPS

Vermont’s Energy Future �
Many factors impact transmission capacity. These in-clude the type of generation source, its distance from customers and existing transmission lines, and wheth-er or not the source is in-state.
When transmission lines meet their maximum capac-ity, an increase in transfer limits or new lines may be required—although it is difficult to get permission to build new transmission lines in Vermont.
Strain on the transmission system, however, can be eased if a generation source is located close to its cus-tomers and through the use of various efficiency pro-grams such as peak shaving (reducing peak load).
You may want to consider the impacts on the trans-mission system (and the impacts of the system) as you think about the various options to meet consumer demand for electricity.
Types of CustomersAnother challenge in electric resource planning is to consider the relative impact of the various options on different types of customers. The basic customer types include:
ResidentialCommercialIndustrial
A typical residential customer in Vermont uses 600 kilowatt hours (kWh) per month and pays an average bill of $80 per month.
A typical commercial customer, such as a small restau-rant, might use 3600 kWh and pay $400 per month.
It is difficult to define the “average” industrial cus-tomer, since usage varies greatly from customer to customer and industrial customers pay on a different scale. But on the whole, industrial users tend to be more sensitive to the cost of electricity, as it makes up a greater portion of their total business expenses.
Consider a large industrial customer such as IBM. IBM uses approximately 24% of the electricity sold by Green Mountain Power and 8% of the total elec-tricity sold in Vermont.
•••
programs in the U.S. (based on expenditures and sav-ings per customer). Vermont has created a unique Energy Efficiency Utility to implement efficiency programs instead of requiring distribution utilities to do so, as is more typical in the U.S. Additionally, the Burlington Electric Department administers its own efficiency programs.
Vermont has spent over $100 million on energy ef-ficiency measures over the last decade, which have saved the state approximately 5% of its total electric-ity between 2000-2006.
Customers pay for these efficiency investments through a charge included in their monthly electric bills.
Energy efficiency as a resource, new investments in efficiency, and the ways efficiency helps to control de-mand will be topics central to the discussions.
Electric Transmission and Distribution in VermontThe ability to move electric power from the genera-tion source to the point of consumption is critical in electric resource planning.
The transmission system in Vermont is operated by Vermont Electric Power Company (VELCO), which is responsible for moving electricity in bulk over large power lines.
The smaller power lines, or distribution lines, are owned by your local electric supplier.
VELCO was formed 50 years ago as the nation’s first transmission-only company—a company that trans-ports but does not generate electricity—a concept that has spread to many other states.
VELCO is controlled by fourteen of the state’s utili-ties, with CVPS and Green Mountain Power owning 86%.
Since Vermont is a large importer of electricity, it is important to ensure there is enough capacity in its transmission system to import from New England, New York, and Canada.

Vermont’s Energy Future �
Operation of the Regional Power Market and the New England GridThat electricity cannot be stored presents additional challenges in energy planning. At any given time, the amount of electricity generated and the amount used must match exactly. If not, voltage can fluctuate, breakers can trip, and the power can go out.
However, we have grown accustomed to a highly reli-able electricity supply in the U.S., having learned that larger electrical systems are easier to balance.
Whereas electric utilities initially formed small mutu-al reliance grids, these grids have evolved and merged into an interconnected system called the New Eng-land Power Pool (NEPOOL) operated by ISO New England.
The ISO (Independent System Operator) is overseen by federal regulators with state input. The ISO moni-tors electricity demand and instructs generators to start, stop, and ramp up or down to meet needs ex-actly—a process called dispatching.
The ISO uses a complex computer program to dis-patch electricity that considers many of the same at-tributes you will think about when considering gen-eration options.
These attributes include price, fuel costs, response time, and how quickly the generator can ramp (oper-ate at various levels). Natural gas and certain hydro generators ramp well, while nuclear, wind, and other hydro generators do not.
The ISO also operates the electricity markets, which closely relate to the dispatching process. Each elec-tric supplier is responsible for generating or contract for enough electricity to meet demand. There are two ways to purchase electricity—through a bilateral con-tract or from the spot market.
In a bilateral contract, a utility contracts with a gen-erator or a wholesale market seller to provide a set amount of energy for a certain period. Bilateral con-tracts make up 80-90% of the electricity that retail electric utilities and the New England grid obtain through contracts.
For some companies, electricity can comprise as much as 20% of annual costs. Because of its size, the average industrial user pays just over 8¢ per kWh compared to the residential rate of just over 13¢.
Different Customers and Customer Types May Seek Different ValuesOne of the issues that interests Vermont decision makers is whether you would pay a premium for cer-tain electricity generation options, such as cleaner and healthier options, or more stable prices in the future.
Customers who normally pay $100 per month may be willing to pay an additional 10%, or $10, per month for these options, valuing their potential benefits.
Such a rate increase, however, may have different im-plications for a business, an industrial customer, or an institutional customer, such as a school, than for a residential customer. Whether required by law or by the realities of competition, paying additional costs will likely be a tougher choice for some customers.
Customer willingness to pay more for valued options is the central question of this trade-off process.
Energy choices are not always straightforward. With new investments in efficiency programs and technol-ogies, rates may rise to cover fixed costs. However, be-cause you use less energy with these efficiencies, your overall bill should decrease.
To make a trade-off, customers must weigh their feel-ings about renewables with the risks involved.
Usage By Customer Type Figure C (following page) provides background on electricity usage by customer type. The chart com-pares usage in Vermont, New England, and the U.S. for residential, commercial, and industrial custom-ers.
Figure D (following page) shows that residential use per customer in Vermont is less than New England and the U.S. as a whole.

Vermont’s Energy Future 6
Use per Residential Customer, 1940-2006
0
2,000
4,000
6,000
8,000
10,000
12,000
1940
1943
1946
1949
1952
1955
1958
1961
1964
1967
1970
1973
1976
1979
1982
1985
1988
1991
1994
1997
2000
2003
2006
USA New England Vermont
Figure C: Percentage of Retail Electricity Sales by End-Use Sector 2006
Figure D: Residential Per Capita Use of Electricity in Kilowatt Hours

Vermont’s Energy Future �
Research has shown that this system produces lower prices overall and stimulates more active bidding over time. In fact, most other commodity markets oper-ate in this manner, including the corn market, where producers of similar products are paid the same price regardless of their production costs.
In New England, this clearing price (also known as the marginal price or spot market price) most often is determined by a natural gas-fired electric generating plant. The amount of electricity a supplier obtains from the spot market greatly impacts overall electric-ity prices, as most bilateral energy contracts use fore-casted spot prices as the basis for a contract price.
Understanding Peak LoadElectric systems are designed to meet peak load, the moment when power demand is highest.
In order to participate in the ISO power market, utili-ties are required to have, or to contract for, the capac-ity to meet their expected peak demands plus an ad-ditional 15% for unexpected generation outages and severe weather.
Generators are primarily classified as one of three types of units:
Base Load Units operate year-round except dur-ing periods of maintenance. Base load units, except for nuclear, can change output to handle daily load swings, but are not cycled on and off. These units tend to have higher fixed costs (con-struction costs) and lower variable costs (fuel and operating costs) and produce large amounts of power. They are fueled by low or no-cost fuels such as coal, large-scale hydro, wood, or nuclear fuel.Intermediate Load Units operate in times of increased seasonal demand, typically in sum-mer and winter, when base load units alone cannot meet demand. Mostly fueled by natural gas, they tend to have moderate fixed costs and higher variable costs than base load units. Hydro plants, to the extent their output can be con-trolled, are considered a mix of base load and intermediate load.
•
•
Contracts with Hydro-Québec and with Vermont Yankee are bilateral.
Since demand for electricity is constantly changing based on factors such as the weather and the amount of outside light, there must be a market that balances the difference.
The spot market, or the short-term market, makes up the other 10-20% of the electricity market. In the spot market, utilities bid on energy “as needed” to meet demand—paying for energy on an hourly auc-tion-market price.
The prices of the spot market are more volatile, since its suppliers do not have time to smooth out highs and lows, being subject to fuel availability and trans-portation risks.
At times, spot market electricity is more expensive than long-term contracts; at other times it is cheaper. Hence, electric utilities vary the amount of spot mar-ket purchases in their portfolios based on price risks, playing the market.
Theoretically, it would be possible for local electric companies to rely mostly on the spot market, but this is rarely done due to the price risks. At times, prices can grow so high that a utility relying heavily on the spot market would not be able to pay its bills without an emergency rate increase to its customers.
This is an outcome most utilities would prefer to avoid, despite the opportunity to underprice the market at other times; it would be a risk comparable to day-trading in the stock market with borrowed money.
When utilities bid on energy in the spot market, the ISO stacks the bids, or ranks them by price, dispatch-ing electricity starting with the lowest-priced bids un-til demand is met. The price at which demand is met and the auction clears is called the clearing price.
All accepted bids receive the clearing price, even those cheaper bids stacked below it.
This may seem like an unusual way to accept bids, but most power markets operate in the same way.

Vermont’s Energy Future �
Vermont is a national leader in energy efficiency, and one issue under consideration is how much Vermont should invest in efficiency to meet demand.
Currently, efficiency funds are collected through a sys-tem benefit charge and spent on a wide-range of cost-effective programs throughout all customer sectors.
ExternalitiesThe production of electricity involves many costs—some of which are borne by the consumer and some of which are passed on to society at large.
Costs typically borne by the consumer include the fuel and capital costs of generating electricity. Costs passed on to society at large include emissions from power plants (particulates and mercury) and the relat-ed healthcare costs associated with pollution—these are called externalities.
There have been efforts to include a greater portion of externalities in the production costs of electricity. Initial efforts included requiring emitters to clean the sulfur from flue gases with scrubbers or by purchasing lower sulfur fuels.
More recently, generators have been required to ob-tain permits in order to emit various pollutants into the air. The annual allocation of permits is limited, thereby reducing the aggregate pollution from a par-ticular generation type. Renewable Energy Certifi-cates (RECs) are a similar device, in that they include externality costs for cleaner generation in the rates we pay for renewable resources.
Legislation instituting renewable portfolio standards has been put in place by elected officials concerned about pollution associated with electricity generation and eager to see the renewable energy industry grow in their states.
The additional costs, which are passed on to consum-ers, represent those societal values as perceived by various state legislators and send a price signal to con-sumers regarding their use of electricity.
Peaking Load Units operate in times of high-est demand, such as mid-afternoon on an ex-tremely hot day. They are dispatched only at peak times—when base load and intermediate load units cannot meet demand, which is typi-cally less than 5–10% of the year. Fueled by oil and natural gas, they have lower fixed costs but high variable costs. Generally, they are the most expensive units to operate.
Other resource types, such as run of the river hydro, solar, and wind-powered generators do not fit into these categories. These generate power only when the energy source is available and are not dispatchable. However, they displace other forms of generation on the grid—generally, fossil-fueled units. For this rea-son, most renewable-fueled plants benefit a power grid with other variable sources, such as natural gas or wood-fired generators.
Efficiency can serve as an alternative to such genera-tion sources. Available at all times, efficiency helps to reduce demand.
In demand response programs, for instance, customers can respond to periods of high demand by reducing the use of air conditioners or pumps.
Typical Electric Rates in VermontElectric rates in Vermont are regulated and approved by the Vermont Public Service Board. Most surround-ing states have competitive energy markets, in which consumers can choose their electric suppliers.
In Vermont, each electric utility has a geographically defined service territory and is required to supply power to anyone located in that territory.
Figures E and F compare rates in New England for 2005 and 2006.
Electric bills are a product of the applicable rate and the amount of electricity used. While the rate is set by the state, consumers can control the quantity of electricity they consume through efficient appliances and wise use.
•

Vermont’s Energy Future �
Residential Commercial Industrial All Sectors
New England 16.2 14.6 11.1 14.6
Connecticut 16.8 13.8 12.0 14.7
Maine 14.5 12.4 8.9 12.2
Massachusetts 17.0 15.8 11.4 15.4
New Hampshire 14.9 13.8 12.2 13.9
Rhode Island 15.1 13.6 12.0 13.9
Vermont 13.5 11.7 8.3 11.4
Figure F: Average Retail Price of Electricity to Ultimate Customers by End-Use Sector - 2006 (Cents per KWh)
Figure E: Average Rates VT vs. New England through January 200�

Vermont’s Energy Future �0
Ten Northeastern and Mid-Atlantic States, including Vermont, have entered into an agreement known as the Regional Greenhouse Gas Initiative (RGGI), to establish a regional cap on greenhouse gas emissions from electricity generation.
Beginning in 2009, carbon dioxide (CO2) emissions from fossil fuel-fired power plants in participating states will be capped at levels based on average emis-sions from 2000–2004 until 2015. Participating states will then reduce emissions incrementally over a four-year period to achieve a 10% reduction of CO2 emissions by 2019.
RGGI will reduce emissions through a cap-and-trade program, in which power plants in participating states must pay to pollute. In a cap-and-trade program, the state will sell “allowances” to power plants.
One allowance corresponds to one ton of CO2 emit-ted by a power plant. Each power plant is required to acquire allowances to cover its emissions.
While plants may buy or sell allowances, a limited number of allowances will be sold by the state and each state will have an emissions cap. Allowances will be allocated to each state and auctioned annually. The proceeds generated through the program will be used to build cleaner generation sources, invest in energy efficiency, or reduce rates.
Coal-fired, oil-fired, and gas-fired electric generating units with a capacity of 25 megawatts or more will be included in the program. Debate on similar programs is taking place at the national level in Congress.
Depending on your point of view, climate change action plans either complicate electricity planning or create a market-based approach to reducing emis-sions. Decisions on this issue will have an impact on generation sources in the future. We are interested to know what you think.
Renewable Portfolio Standards and Sys-tem Benefit ChargesA Renewable Portfolio Standard (RPS) is a require-ment, usually implemented through legislation, for
Vermont and Climate ChangeThe combustion of hydrocarbon-based fuels—in-cluding gasoline, natural gas, oil, and coal—releases greenhouse gases, which trap heat in the atmosphere and cause temperatures to rise. Global impacts of cli-mate change could include rising sea levels, the ex-tinction of species, and extreme weather events.
Those in favor of aggressive climate change action plans say that if preventative measures are not tak-en, global warming could impact the landscape and economy of Vermont—from the number of skiing days to the habitat of the sugar maples.
They point out that a number of energy sources—so-lar, wind, geothermal, efficiency, and nuclear genera-tion—do not create greenhouse gases or contribute to climate change.
Two-thirds of the electricity in Vermont comes from nuclear and hydro power (which are carbon-neutral) and the State’s vast quantity of trees helps to offset its greenhouse gases. Nonetheless, Vermonters have undertaken a number of measures to stabilize global climate change.
In 2001, New England Governors and Eastern Cana-dian Premiers signed an agreement to reduce green-house gas emissions in the region to 1990 levels by 2010, to 10% below 1990 levels by 2020, and even-tually to reduce emissions by 75%. These reductions will occur in all sectors—transportation, electricity, agriculture, and industry.
In 2005, Governor Douglas issued Executive Order 07-05, establishing a Governor’s Commission on Cli-mate Change (GCCC) and a broad-based group of Vermont leaders to develop a comprehensive Vermont Climate Change Action Plan by Fall 2007.
The GCCC is to oversee a public effort to examine climate change impacts on the state. This includes securing input from all sectors regarding existing, planned, and potential ways to reduce greenhouse gas emissions, helping to educate the public about such opportunities, and considering ways to save money, conserve energy, and bolster Vermont’s economy, nat-ural resources, and public health.
Vermont’s Energy Future ��
Federal support includes funding for research and de-velopment, federal insurance, tax credits for produc-tion, favorable tax treatment in the form of acceler-ated depreciation, and assistance in projects that cross state lines. Some examples:
Nuclear power has received federal insurance and federal support for research and develop-ment. Further, the federal government has as-sumed responsibility for finding the long-term solution for spent nuclear fuel.Wind power has received support for research and development, and receives tax credits for each kW produced.Oil and gas production receives accelerated de-preciation.The production of energy from landfill gas has received tax credits.
Federal energy legislation passed by Congress extend-ed some of these programs, including tax credits for wind, and created some new programs to encourage the construction of new nuclear plants.
Additionally, pending legislation in Congress would extend support to various kinds of generation as an indication of the importance of energy development to national security, economic, and environmental goals.
Also under consideration is a national renewable portfolio standard similar to programs passed by sev-eral states.
Putting the Need in Context—How Much Power (Buy or Build) Do We Need to Plan For?You can now begin to apply some of the terms and concepts this section has introduced.
Vermont relies on contract and purchased power, and its needs are often stated in terms of megawatt-hours (MWh). Electric sales in Vermont totaled 5.8 mil-lion MWh in 2005. Vermont Yankee provided 35% of this, and Hydro-Québec provided an additional 28%.
•
•
•
•
utilities to obtain a percentage of their energy from renewable sources.
Utilities unable to secure sufficient supplies must pay default charges into a renewable energy development fund. All New England states except Vermont have an RPS.
However, Vermont does have System Benefit Charges (SBC), which collect a portion of utility rates to fund efficiency programs. Other states also have SBC funds for renewable resources.
Power Supply Contracts Versus Invest-ments in Power PlantsEssentially, there are three ways utilities obtain the electricity delivered to customers. A utility can:
Build and operate a power plant that generates electricityEnter into a contract to purchase electricity from another supplierBuy electricity on the market as it is consumed, known as “pay as you go”
Almost all Vermont utilities practice some combina-tion of these three methods. The differences between them relate less to the particular fuel source itself than to the degree of future price certainty desired and the ability of the utility to borrow, invest, or put up secu-rity for long-term contracts.
Some utilities in Vermont do not have the financial capacity (the credit rating or investment capital) to consider all options. Some energy suppliers can only sign short term contracts, while others may be unwill-ing to enter into long-term construction programs due to the risks inherent in such ventures.
Federal Level Support for Different Types of GenerationSupport for various types of generation has been pro-vided at the federal level because Congress believes it advances the public interest.
1.
2.
3.

Vermont’s Energy Future �2
State-negotiated contracts with Independent Power Producers (consisting of several small hydro and wood facilities) provided another 8%. As each of these contracts expire, a total of 3.9 million MWh (out of 5.8 million MWh) will need to be replaced, mostly within the 2012–2015 time frame.
This can be accomplished by taking any one, or a combination of, the following actions:
Renewing existing contracts with updated terms; Signing new contracts; Building new generation facilities; Reducing demand through energy efficiency; or,Purchasing power on the spot market.
Demand in Vermont is projected to reach 1,274 MW (megawatts) in 2012. Even if new genera-tion sources are built, Vermont will still need an additional 700 MW to meet this demand. While energy need grows an additional 20-30 MW per year, efficiency programs and demand reduction are projected to more than offset such growth.
It is likely that Vermont will meet its needs through a combination of new contracts, increased energy efficiency programs, and the construction of new generation sources.
As you will see in the next chapters, all options have both benefits and drawbacks. •
1.
2.3.4.
5.
Understanding Units of Electrical EnergyThe following units of electricity may be thought of in terms of the amount of electricity needed for a specific use and duration, such as powering a light:
Watt The lowest common unit of power, such as a 100-watt bulb (or 5 20-watt CFL).
Kilowatt (kW) 1,000 watts. The power, or gener-ating capacity, necessary to light ten traditional 100-watt light bulbs (or 50 20-watt compact fluo-rescent lights).
Megawatt (MW) 1,000 kilowatts. This measure of electricity is used to discuss resource needs. For example, a typical electrical generating plant burn-ing natural gas would be sized to provide 50 to 250 MW of capacity. Vermont uses 1100 MW elec-trical power at the time of the peak demand; the average load is 700-750 MW. Utilities keep about 15% of a reserve margin to ensure reliability in the event that power is unavailable.
Kilowatt-hour (kWh) The electric energy con-sumed to light ten 100-watt light bulbs (or 50 20-watt CFLs) for one hour. A typical home in Vermont averages about 600 kilowatt-hours of electricity per month, and you can find your monthly usage ex-pressed in kWh on your electric bill.
Megawatt-hour (MWh) The energy in one mega-watt of power consumed for one hour, or the en-ergy consumed when 10,000 100-watt light bulbs are lit for one hour.
Capacity The ability to generate electricity. Ca-pacity is usually discussed in relation to the abil-ity to provide enough electricity for peak times. The measurement for capacity is either kilowatts or megawatts. Costs for constructing capacity are usually thought of as fixed costs, such as construc-tion costs. New generating plants being discussed will have a capacity rating that indicates the amount of electricity they could produce at full output.
Energy The amount of power generated and con-sumed over a period of time. Energy has a time el-ement and is measured in kilowatt-hours or mega-watt-hours. Energy production costs are usually thought of as variable costs, as in the cost to start up and shut down plants and the fuel required to generate electricity.

Vermont’s Energy Future ��
Chapter 2: Comparing Attributes of Resource Options
and the total cost in cents/kWh in 2007 dollars. These costs do not include “externality costs.”
The energy efficiency numbers in the figure are pre-sented two ways—both including non-electric savings from reduced operation, maintenance and replace-ment and other resource savings (water and fossil fuel) and without those savings. Please note that the renewable resources in the chart (solar, wind, wood and hydro) generally benefit from the ability to sell renewable energy certificates (RECs) at 2-3 cents/kWh—which would effectively reduce their costs be-low those shown in Figure G, but you would not be able to claim the source as renewable.
The cost table in this chapter was derived from a more detailed table in the Appendix.
Risk Resources come with varying amounts of risk. Risk can often be managed through practices such as diver-sification—spreading out investments and contracts. Potentially, diversification could mean committing less to a source than would be attractive. To what extent should diversification be a priority in future resource investment?
In addition to the relative cost of various re-source options for Vermont, there are a variety of oth-er attributes and factors that may influence how you feel about the resource choices facing Vermont. These include environmental impacts, sustainability, price fluctuation risk, and local control, among others. In this chapter we highlight some of the factors you may want to consider, and provide comparative tables on two of them: cost and environmental attributes.
WHICH ATTRIBUTES ARE MOST IMPORTANT TO YOU?
Cost Think about the upfront costs and operating costs of each option. For example, coal-based options cost more to build than gas or oil-based options, but have cheaper fuel. Nuclear uses cheap fuel, but also entails long-term waste disposal costs. Wind and solar fuel is free, but not always available, so they are often paired with other generation options. Contracts for energy will likely have no upfront costs, but will obligate the utility to pay in the future.
Figure G compares the relative cost of resource op-tions for Vermont. The data was compiled by the Vermont Department of Public Service, based on a variety of recent peer review studies. The numbers are generally averaged over a range of different technolo-gies and plant sizes. Figure G includes the capital costs (includ-ing the cost to build a power plant or manu-facture and install en-ergy efficiency devices); the operating costs to run a generating plant (including fuel, opera-tion and maintenance, and emissions permits);
Cap
ital
Cos
tsce
nts/
kwh
Ope
ratin
gC
osts
cent
s/kw
hTo
tal C
ost
cent
s/kw
h
Coal: Pulverized/Circulating Fluidized Bed 3 4 7Coal: Gasification with CO2 Sequestration 5 6 11Energy Efficiency 3 0 3Hydro 6-10 2 8-12Natural Gas / Oil: Combustion Turbine 7 8 15Natural Gas / Oil: Combined Cycle 1 6 7Nuclear 4 2 6Solar 30 0 30Wind 9 0 9Wood 4 5 9
Notes
SourceVT Department of Public Service (in many cases costs are averaged across range of technologies and plant sizes)
Relative Costs for New Electricity Options in Vermont(in 2007 cents/kwh)
Captial costs include the cost to build the power plant or manufacture and install the energy
Renewable resources (solar, wind, wood, and hydro) also benefit from the ability to sell RECs at 2-3 cents/kwh -- which would effectively reduce costs.
Operating costs include the costs of running the plant including fuel, operation, and maintenance, and emissions permits.
Energy efficiency non-electric savings include reduced operation, maintenance and replacement and other resource savings (water, fossil fuels)
Figure G: Relative Costs for New Electricity Options in Vermont (in 200� cents/KWh)
For more information about these technologies, see Chapter � and separate appendices document.

Vermont’s Energy Future ��
its fuel source is regularly available (which is an issue in the case of wind, solar, and water). The reliability of a particular technology can also significantly impact the overall electric grid in the event that the source fails—the larger the resource that might fail (a major base load shuts down unexpectedly), the greater the impact would likely be. For instance, contract reliabil-ity can signify the credit worthiness of the business. As an example, large operators with cash reserves and greater access to capital may be better able to weather financial ups and downs.
Least Local Environmental Impact Local environmental impacts range from emissions of particulates, nitrous oxides (NOx) and sulfur dioxides (SO2), visual impacts of wind turbines and transmis-sion lines, to waste management. Larger generation plants have greater footprints, and some plants re-quire water for cooling.
Plants located in other U.S. states or in Canada obvi-ously have little visual or land impacts on Vermont, but can still impact the air quality of the state if up-wind. A contract often has no particular fuel or power source associated with it and therefore has no clear emissions impact. Preferred attributes, however, can be purchased in the market for a premium.
Least Impact on Climate Change Any option involving the combustion and release of carbon dioxide can impact climate change. Natural gas plants have less impact than coal plants, but much more impact than wind or hydro. Coal plants with new technologies are predicted to have much less impact than traditional plants, but are considerably more expensive.
Wood burning plants operated in a sustainable man-ner can offset carbon dioxide with the carbon absorb-ing properties of trees. Contract power, once again, may or may not be associated with a fuel type.
For some, climate change considerations have become the primary concern. As carbon controls are imple-mented with increasing intensity, this consideration may increasingly merge with cost.
Predictable Bills In recent years, gas costs have been unpredictable. Oil also shares that unpredictability. While long-term contracts for either fuel or power as a combined prod-uct can provide more certainty, they often come at a premium when sellers demand some of the upside. The price of wood, even as a byproduct, varies based upon conditions in the forest products industry.
A look at current Vermont power supplies indicates a strong preference for price certainty.
The contract with Hydro-Québec includes price terms that were set at the beginning of the contract and are completely disconnected from fossil fuels. The con-tract with Entergy Vermont Yankee is also a stable price with no fossil fuel connection. In addition, Ver-mont utilities obtain a significant amount of power from local hydro and biomass sources that have had stable prices disconnected from fossil fuels.
These outcomes, however, have not come about by chance. Regulators, utilities, and political leaders of prior decades have voiced a preference for Vermont to manage risk by locking in price terms or minimizing correlation with fossil fuels, even if it means paying more at some times. We will be interested to see if you agree with these choices.
Least Consumption of Finite Resources The sustainability of a resource can also be a consid-eration. While the debate continues over exactly how much gas and oil remain in the world, it is clear that these resources will eventually expire.
Both coal and nuclear fuels will likely be available be-yond our lifetimes, but they are, nevertheless, finite resources. Solar and wind, on the other hand, are re-newable resources. Some say that our consumption will have implications for future generations, others will argue that Vermont is so small that its impact is negligible.
Greatest ReliabilityReliability refers to the stability of a particular tech-nology, whether it needs frequent maintenance, and if
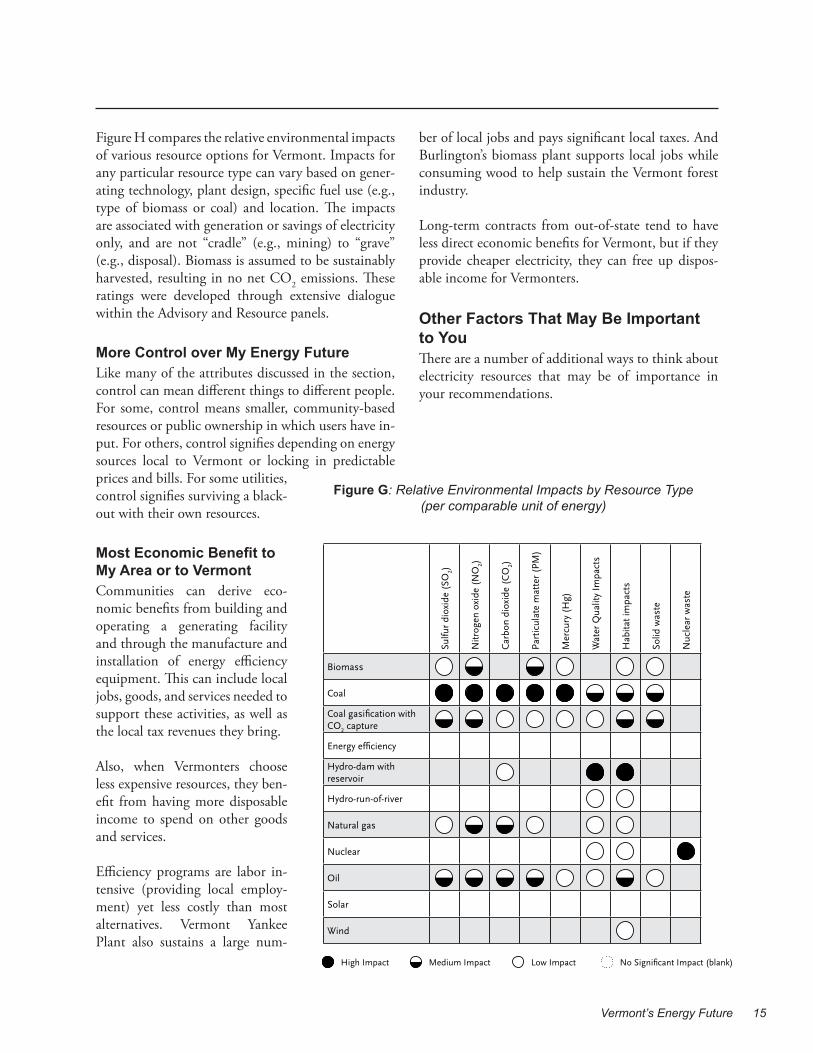
Vermont’s Energy Future ��
ber of local jobs and pays significant local taxes. And Burlington’s biomass plant supports local jobs while consuming wood to help sustain the Vermont forest industry.
Long-term contracts from out-of-state tend to have less direct economic benefits for Vermont, but if they provide cheaper electricity, they can free up dispos-able income for Vermonters.
Other Factors That May Be Important to YouThere are a number of additional ways to think about electricity resources that may be of importance in your recommendations.
Figure H compares the relative environmental impacts of various resource options for Vermont. Impacts for any particular resource type can vary based on gener-ating technology, plant design, specific fuel use (e.g., type of biomass or coal) and location. The impacts are associated with generation or savings of electricity only, and are not “cradle” (e.g., mining) to “grave” (e.g., disposal). Biomass is assumed to be sustainably harvested, resulting in no net CO2 emissions. These ratings were developed through extensive dialogue within the Advisory and Resource panels.
More Control over My Energy Future Like many of the attributes discussed in the section, control can mean different things to different people. For some, control means smaller, community-based resources or public ownership in which users have in-put. For others, control signifies depending on energy sources local to Vermont or locking in predictable prices and bills. For some utilities, control signifies surviving a black-out with their own resources.
Most Economic Benefit to My Area or to Vermont Communities can derive eco-nomic benefits from building and operating a generating facility and through the manufacture and installation of energy efficiency equipment. This can include local jobs, goods, and services needed to support these activities, as well as the local tax revenues they bring.
Also, when Vermonters choose less expensive resources, they ben-efit from having more disposable income to spend on other goods and services.
Efficiency programs are labor in-tensive (providing local employ-ment) yet less costly than most alternatives. Vermont Yankee Plant also sustains a large num-
High Impact Medium Impact Low Impact No Significant Impact (blank)
Relative Environmental Impacts by Resource Type (per comparable unit of energy)
Sulfu
r di
oxid
e (S
O2)
Nitr
ogen
oxi
de (
NO
2)
Car
bon
diox
ide
(CO
2)
Part
icul
ate
mat
ter
(PM
)
Mer
cury
(H
g)
Wat
er Q
ualit
y Im
pact
s
Hab
itat i
mpa
cts
Solid
was
te
Nuc
lear
was
te
Biomass
Coal
Coal gasification with CO
2 capture
Energy efficiency
Hydro-dam with reservoir
Hydro-run-of-river
Natural gas
Nuclear
Oil
Solar
Wind
NotesImpacts are not cradle (e.g., mining) to grave (e.g., disposal) but associated with generation or saving of electricity only.Impacts can vary within a particular fuel type based on technology, design, specific fuel used (e.g., type of biomass or coal) and location.Biomass is assumed to be sustainably harvested, resulting in no net C0
2 emissions.
1.
2.
3.
Figure G: Relative Environmental Impacts by Resource Type (per comparable unit of energy)

Vermont’s Energy Future �6
facilities. Generation built away from load centers, even in modest quantities, may require significant transmission to deliver the power to the grid. Some wind sites have this characteristic.
New transmission raises significant financial and environmental issues and thus has a negative bias. For these reasons, new transmission requires a Certificate of Public Good before it can be constructed. Community concerns about transmission systems typically include route, visual aesthetics, impact on property values, and potential health effects from herbicides and electro-magnetic fields (EMF).
Because of these complexities, Vermont has instituted a new least cost transmission planning process. Before a new transmission line can be authorized, those involved must evaluate alternatives such as efficiency, demand response programs, or distributed generation that might allow for the deferral or down-sizing of the transmission line.
Impact on Future Generations Different energy options will impact future genera-tions by emitting pollutants that accumulate in the environment (such as greenhouse gases or mercury), leaving nuclear waste, or consuming finite resources.
Moving Toward Distributed Generation Some may prefer the benefits of distributed genera-tion—producing power in smaller amounts closer to delivery points—over traditional, centralized gen-eration. They would prefer options such combined heat and power systems, small hydro, small gas or oil peakers, and community scale wind installations, all of which are candidates for distributed generation. In some cases, smaller scale resources come at a higher price.
Moving Toward Market-Based Pricing and Solutions Some believe energy decisions are better based upon market signals than on government policy. Advocates for market-based systems would argue that retail pric-es adequately balance consumption and the need for new generation sources. They would say the market-
Impact on Large Volume Users Some generation options—such as environmentally favorable options—can cause electricity bills to in-crease. Often, customers impacted most by price in-creases are those who use large volumes of power. A price increase that is digestible for a family may be beyond the reach of a manufacturer in a competitive market. Additionally, the shared costs of transmission line construction greatly impact those who use large volumes of power.
Impact on Low and Fixed Income Users While some families may be willing to pay more for certain attributes, price increases are more challeng-ing for those with low or fixed incomes. Low or fixed income families may find the attribute of lowest cost more important.
Impact on Energy Independence, Self-reliance, and National Security Some Vermonters may prefer not to rely on imported oil or gas, as a way to improve national security. Some may prefer renewable and efficiency options for their contribution to energy independence and sustainabil-ity. Still others may support Vermont-based options that encourage self-reliance.
Impact on TransmissionImpact on the transmission system is another cross cutting issue impacting the various resource options to a greater or lesser extent. Resources built in remote areas tend to require new transmission lines.
Large-scale resources tend to require either new transmission, or transmission upgrades. The two existing large-scale contracts, Hydro-Québec and Vermont Yankee, already have transmission systems in place.
New large-scale contracts for the import of additional power could require new transmission or additional electric import capacity. Generation resources built near the load, as in distributed generation, can often relieve strain on a transmission system.
Efficiency programs and Demand Response programs generally defer the need for additional transmission
�6 Vermont’s Energy Future

Vermont’s Energy Future ��
Role of the Local Utility and Ownership Structure Some argue that local utilities (especially those owned by investors) are in a better position to absorb risks from large-scale projects and make decisions based on market economics.
Others argue that government-owned or community-based energy suppliers have a better ability to match local preferences and lifestyles with energy choices.
It differs from time to time which types of entity can obtain the lowest cost investment funds.
The Buy Versus Build DecisionVermont utilities are responsible for procuring power resources to meet the electrical needs (including reserves for reliability) of their service territories. Regardless of the fuel source, power supply may be obtained by contracting with the owners of a generation source or by investing in power plants.
The principal differences between contracting and building are: 1. The degree of future price certainty of a power supply and 2. The effect of each option on utility credit ratings and access to capital. There is also concern regarding the ability of a utility to effectively manage ownership of power generation.
CREATING A MIX OF OPTIONS OR PORTFOLIOSVermont currently operates with a mix of energy resources in the form of a portfolio, and is likely to continue in the future. In the current portfolio, two-thirds of the energy consumed comes from either Ver-mont Yankee or Hydro-Québec.
Because both contracts expire in the near future, there is both a need to replace that power and an opportunity to adjust the portfolio. The amount of power sources built in Vermont, the amount obtained through con-tracts or purchases in the spot market, and the types of resoureces utilized can all be adjusted.
The recommendations you make with regard to Ver-mont’s portfolio will depend upon which attributes you believe are most important. •
place reinforces consumer values, citing as an example the price stabilization of long-term contracts.
Market-based solutions would advocate for green choice programs, where only those customers desiring renewables would pay for them and, in turn, receive them. Central Vermont Public Service’s Cow Power Program is one such green choice program.
Others would argue, however, that markets do not include all policy objectives and that relying on them too much creates unintended consequences. Market barriers, for instance, often require government ac-tion—such as net metering, statewide energy efficien-cy programs, or renewable portfolio standards.
Vermont-Based Energy Resources Some people value a resource that is Vermont-based. This preference may stem from a desire for local con-trol, a belief that self-sufficiency is important, or a view that some technologies provide Vermont with economic benefits.
Others discuss this issue in terms of “doing our part.” Is it right for Vermont to lean heavily on surround-ing states and provinces for a large share of its energy, shifting to them the burdens of generation siting? The counter view would say, if other places are better gen-erator sites, that’s OK. It is an ethical versus practical dilemma.
Making It Easier to Site, Build, and Invest in Vermont Some argue that it is too difficult to build new gen-eration sources in Vermont and that siting processes create uncertainty and long delays. Certain wind de-velopments in Vermont could be examples of this. Energy developments and their economic benefits, they would say, go instead to other states, where it is easier to build.
Others would argue that the lifestyles and scenic beauty in Vermont need protection, and that the high standards of the siting process reflect these values.

Vermont’s Energy Future ��

Vermont’s Energy Future ��
Chapter 3: Resource Options
In the following pages of this chapter, you will find descriptions of ten different resource options that Vermont can use in combination to meet its future electricity needs. These options include:
Natural GasCoalNuclearOilBiomassHydroWindSolarCombined Heat and PowerEnergy Efficiency
For each resource option there is a brief description and status report followed by a bulleted list of that option’s advantages and disadvantages. Comparative charts showing the relative costs and environmental characteristics of these options can be found in the previous chapter. For a much more in-depth discussion of each of these options, see the Appendix (in separate document).
The lists of advantages and disadvantages were compiled by the Advisory Committee and Resource Panel of Vermont’s Energy Future. •
••••••••••

Vermont’s Energy Future 20
Natural Gas
BriefNatural gas as an electric generation fuel has great flexibility and burns cleaner and the technology is more ef-ficient than either coal or oil. It is economical both as a peaking fuel (simple cycle) and as an intermediate and base load fuel (combined cycle).
In terms of installed capacity, 38% of the generation capacity in New England is fueled by gas. The amount of natural gas generation grew in the late 1990s when gas was cheaper ($2 per MCF) than it is now, and inefficient oil units were replaced.
Gas is now in the $5-7 per MCF (per thousand cubic feet) range and future prices are difficult to predict. Gas is available in the northwestern portion of Vermont but there is no natural gas-fired electricity generation in Vermont. The combustion of natural gas contributes to greenhouse gases.
Right now in New England, wholesale market electricity prices are strongly correlated with natural gas prices. The largest global natural gas reserves are in the Middle East and the former Soviet Union. 80% of New Eng-land’s natural gas supply comes from North America while 100% of Vermont’s supply comes from Canada.
Several terminals to import liquefied natural gas (LNG) are either under construction or in permitting. Advo-cates say LNG might stabilize natural gas prices.
Advantages
Low construction costFlexibility in unit sizeShort construction periodFewer emissions than coal or oilNo need for fuel storage or fuel handling areas like coal or wood; has a smaller footprint (back-up fuel is usually oil)
•••••
Disadvantages
Contributes to greenhouse gases; has some emis-sions of NOx
Natural gas prices are less predictable than other fuel sourcesNatural gas is imported into the region and thus can be subject to transportation or supply dis-ruptions caused by unforeseen environmental or political actionsThere is a finite supply of gasMay require water for cooling for larger com-bined-cycle plants
•
•
•
••

Vermont’s Energy Future 2�
Coal
BriefWhile there is no coal-fired generation in Vermont, the state purchased 14% of its electricity in 2006 from the New England Power Pool, which includes coal generation.
In 2006, coal made up 14% of the electricity generated in New England. In the U.S., about 50% of the electric-ity is generated with coal. New technology might make coal a cleaner burning fuel and lower its contribution to greenhouse gases, but this will also increase the costs of using coal.
Advocates say that, due to the scale of new generation required and the impact of foreign fuels on national security, coal must be an element of the U.S. energy solution. Opponents say current pulverized coal technol-ogy should be discontinued due to environmental impact, and that the jury is still out on the feasibility and performance of new coal technologies.
If coal is selected as an element of the future Vermont electricity portfolio, it would likely be obtained through contract rather than building a new coal plant in Vermont.
Advantages
U.S.-based fuel sourceCoal can be stored on-site in large quantitiesPotential for long-term contractsLess price volatility than gas200 or more year supplyGenerating plants using coal can be built in large size (700-1,000 MW), achieving economies of scale
••••••
Disadvantages
Greater emissions than all other generation types (NOx, SOx, particulates, mercury)Major contributor to greenhouse gasesNew technology (IGCC) to burn coal cleanly is untested and cost is unclearNew technology to capture CO2 is untested and cost is unclearTakes longer to build and site (5-7 years) than other optionsCoal plants only come in large sizesTransportation costs and available infrastructure to support new transportation are limiting fac-tors
•
••
•
•
••

Vermont’s Energy Future 22
Nuclear Power
BriefThe Vermont Yankee Nuclear Plant currently provides 35% of the electricity consumed in Vermont, which is about 46% of Vermont Yankee’s total output (the other 54% is exported to other states. As a significant portion of our base load power (the other being Hydro-Québec), it often meets as much as 50% of our daily demand for energy.
Vermont Yankee was granted a 40-year license to operate, beginning in 1972, by the U.S. Nuclear Regulatory Commission (NRC). Under consideration now is whether the plant will be given permission to operate for another twenty years beyond 2012 and, if so, whether Vermont utilities will continue to purchase power from Vermont Yankee. Vermont utilities could also purchase power from other operating nuclear plants in New England if available. Proponents of nuclear power in the U.S. are advocating new nuclear plants and license extensions at existing plants as a way to combat greenhouse gases, offer stable prices, and increase energy independence.
Opponents of nuclear power say there are other options available. They cite concerns about the safety of nuclear plants as they age and the possibility of accidents. They point out that nuclear plants are considered possible targets for terrorists. Opponents also cite the absence of a national waste disposal site as a serious concern.
If the Vermont Yankee plant is not relicensed and new power contracts for Vermont Yankee Power are not ne-gotiated past 2012, alternate measures will be needed to meet Vermont’s electricity needs and its greenhouse gas reduction goals. Advantages
No greenhouse gases or emissions from power generation, since nuclear plants do not burn fos-sil fuelReliable base load power, meaning it is part of our everyday energy supplyPotential to negotiate a long-term (up to 20-year) contract for powerEconomic benefits to Vermont in the form of taxes, revenue sharing, and 650 jobsThe plant already exists, along with the needed transmission infrastructure; it is an in-state gen-eration sourceIf the plant is re-licensed, a prior regulatory order requires revenue sharing for Vermont customers when prices exceed $61 per MWH The plant has a 35-year track record of high reli-ability and consistent power outputOver the past five years, the plant has been ret-rofitted with multiple equipment upgrades and large component replacements
•
•
•
•
•
•
•
•
Disadvantages
There is currently no long-term solution (nation-ally) for safe storage of nuclear waste. There are currently more than one million pounds of high-level nuclear waste being stored at Vermont Yankee in a pool approximately 26 feet wide and 40 feet long. Continued operation creates even more spent fuel stored on-siteOperation of a nuclear facility always poses some degree of risk for potentially serious accidentsThe plant, like any other mechanical or industrial facility, has experienced mechanical failuresAs a unit-contingent contracted facility, power from Vermont Yankee is predicated on the reli-ability of a single facility, meaning that a plant shut-down would have a greater impact on customers than would be the case if power were received from multiple resourcesNuclear fuel is finite; reprocessing nuclear spent fuel is practiced in other countries but is not currently available in the U.S. If nuclear genera-tion expands worldwide, the price of nuclear fuel could go up, with increased demand
•
•
•
•
•
•

Vermont’s Energy Future 2�
Oil
BriefNew England has long depended on oil as an important fuel, but recently consumers have displaced some oil usage in favor of natural gas, where available. Oil provided 2% of Vermont’s in-state generation capacity in 2006 and 9% of the electricity produced in New England.
The system mix purchased from the New England Power Pool includes oil. In terms of emissions and greenhouse gases, oil falls between gas and coal. Since it can be delivered by truck, oil is flexible, making it a potential fuel source for distributed generation and combined heat and power systems.
Oil can also be used in peaking plants that usually run less than 100 hours per year. During the past decade oil prices have more than tripled.
Advantages
Less pollution and fewer greenhouse gases than coalCan serve as a backup or replacement for natural gasCan be transported by truck to areas where natural gas is not availableHas good dispatchability; starts quickly and can decide when to runPossible fuel source for distributed generation
•
•
•
•
•
Disadvantages
Price can be volatile and tends to be more expensive than gasLimited oil supply globallyOil consumption is a negative for national security and energy independenceContributes to greenhouse gasesContributes to other air emissions (SOx, NOx, particulates, and mercury)
•
••
••

Vermont’s Energy Future 2�
Biomass
BriefVermont is one of the leading states in the use of biomass to generate electricity—mostly from wood by-prod-ucts. With 78% of the state forested, the rate of consumption is sustainable (less is used than is replaced).
In 2006, wood provided 8% of the electricity consumed in Vermont. Wood generation units can range from 50-60 MW down to 1-3 MW. Wood has economic benefits in terms of jobs, but prices can also fluctuate based on changes in the forest products industry.
Burning wood emits greenhouse gases. However, the CO2 from biomass is recycled as the next generation of trees mature. Generation from farm-based wastes (such as manure) that have been turned into methane is a new and developing source. While farm methane projects are not economical just for electricity production alone, the associated benefits of odor and runoff control make the process feasible.
Advantages
Wood is a renewable fuel in VermontLandfill gas or methane from a farms is gener-ated from waste productsCreates jobs and provides another revenue stream for forest industries and agricultureIs neutral to beneficial on greenhouse gases (wood is neutral if sustainably harvested, and beneficial if used instead of natural gas; methane fuel sources are beneficial when they prevent methane from escaping into the atmosphere)At current natural gas prices, the cost for wood generation is competitive
••
•
•
•
Disadvantages
Biomass is usually waste wood from another process, so price and supply can fluctuateMust be transported from the forest to the plantWhile emissions have improved, there remains some concern over particulatesSome say wood products should be dedicated to combined heat and power systems (where both electricity and useful heat is generated) rather than used for large-scale generation
•
••
•

Vermont’s Energy Future 2�
Hydroelectric
BriefHydroelectric power is a large scale energy source in Vermont, second only to nuclear power. The current contract with Hydro-Québec provides 27% of Vermont’s electricity. Other hydro sources, mostly in Vermont, provide an additional 12%. Hydro has environmental benefits related to air pollutants because it has low emis-sions and creates few greenhouse gases.
Hydro built in Vermont can have economic benefits, but by most estimates less than 100 MW of potential new or refurbished hydro sites exist in the state, and most are small. Hydro is expensive to site, permit, and build, but the fuel itself is free.
The Hydro-Québec contracts begin to expire in 2012, but Hydro-Québec has indicated a willingness to discuss terms of a new contract with a price to be negotiated. Other large scale hydro resources are potentially available from other providers outside of Vermont, both in the U.S. and Canada.
If a new contract is not put in place, Vermont will need to replace this relatively large and inexpensive power source. Vermont would also have to factor in the loss of this non-greenhouse gas emitting source into its plan to reduce greenhouse gas emissions.
Advantages
Low emissions, low greenhouse gas, renewable sourceMay be able to enter into longer duration con-tracts more easily than sources with less fuel price predictabilityStable pricing can be negotiated in long-term contract (because the fuel price does not fluctu-ate)Contributes to goal of energy independence from oilA contract with Hydro-Québec provides system power as a backup, therefore reliable and dis-patchable deliveries; transmission infrastructure is in placeSome hydroelectric is a local resource
•
•
•
•
•
•
Disadvantages
Small and new hydro projects are expensive to permit and build and can disrupt/limit existing stream flows, often significantly harming wildlife habitatsSmall hydro power can be intermittent, so needs to be combined with another resource type Hydro-Québec contract or other large scale hy-dro contracts means direct economic benefits don’t reside in Vermont; a contract with Hydro-Québec does not produce local economic ben-efits in the form of tax payments and jobsCanada or Québec could change energy export policiesContract will likely renew based on joint fore-casts of future market prices. Thus the price paid under a negotiated contract could be more or less than the actual market prices turn out to be.
•
•
•
•
•

Vermont’s Energy Future 26
Wind
BriefAcross the U.S., wind power is the fastest growing source of new generation (annual growth rate of 25%). Successful projects require attractive wind speeds, sites that can be permitted, and access to economically competitive markets for the electricity generated. Experience with Vermont’s only commercial-scale wind power facility, the 6 megawatt Green Mountain Power wind facility in Searsburg, has generally been good. Searsburg verified the feasibility of operating wind power in cold climates.
It has been asserted by wind industry proponents that the technical potential for utility-scale wind power could reach 200 MW of rated power, or up to 20% of the state’s current electricity peak demand, over the next decade. This projection is based largely on the assessment of wind resources, the proximity to the bulk transmission system, and the elimination of sites that are part of either state, federal or other conserved lands. However, this projection may not reflect the amount of commercial wind that can ultimately be sited in Vermont. Vermont’s predominant wind sites are along higher elevation ridge lines, thus placing them potentially in highly visible parts of Vermont’s communities. Wind power could also be purchased from outside Vermont under contract. Wind power is competitive with other sources of generation.
Implementing new wind-powered generation in New England has been problematic due to siting and permitting concerns. As beauty is in the eye of the beholder, wind power advocates believe large wind farms are visually attractive and increasing their use will improve air quality by displacing greenhouse gas emissions from fossil fuel-driven electricity. Advocates point out there are clear precedents for mitigation where wildlife impacts exist. They say wind farms provide economic benefits to the regional and local economies. In contrast, opponents contend that wind turbines are a significant intrusion on landscapes, that they spoil views, alter Vermont’s “Green Mountain State” ridge lines, and could have wildlife impacts at higher elevations.
Presently, plans by independent developers to install over 100 megawatts of new wind power in Vermont are being considered. So far, the Vermont Public Service Board has approved the Searsburg Wind Power Facility, the region’s first utility-scale project with 11 turbines, and, more recently, a 16-turbine project in Sheffield. PPM Energy recently submitted a petition to site a 45-megawatt project with 17 turbines in the towns of Readsboro and Searsburg.
Advantages
No air emissionsNo greenhouse gasesWind is a renewable resourceFuel is free, enabling stably priced contractsVermont-based wind farms would produce local economic benefits in the form of tax payments and installation jobsCan be built or expanded in manageable increments of 20-50 megawatts as needed
Disadvantages
Wind turbines can be an intrusion on the landscapeWind farms may cause wildlife or habitat damage
•••••
•
•
•
from either construction or operation because windy ridgelines are often wild and undevelopedWind power is only available when the wind blows, so is not dispatchableWindy locations are often remote from electric load centers and may require transmission lines to be upgraded or constructedPermitting timeframes are uncertain in Vermont (true for all fuels); this can make projects more expensive and, in an active market like wind, encourage wind developers to go elsewhereSome may like wind as an option but feel that it is better for wind power to come from outside Vermont (New England, Canada, or New York), where the wind resource may be better, it may be less expensive to develop wind projects, and the projects can achieve economies of scale
•
•
•
•

Vermont’s Energy Future 2�
Solar
BriefSolar energy can be captured by using photovoltaics (PVs) and thermal collectors. PVs convert sunlight into electricity and have many applications. Thermal collectors are used to heat water or air for domestic or commercial use.
As this report focuses on electricity, we will focus our description on PVs. PVs produce electricity any time the sun is shining, but more electricity is produced when the light is more intense and is striking the PV modules directly.
Solar electricity is the most expensive generation technology under consideration in Vermont. Because of the expense, it is currently cost competitive only for specialized and remote applications when compared with large scale options. But photovoltaics are coming down in price as technology and markets advance. (By contrast, using the sun to heat water is already cost competitive.)
Most of the cost for solar systems is upfront (fuel is free) and the systems often need incentives and/or net metering to make the economics more attractive.
The near-term potential to supply electricity for Vermont is enormous. Enough sun hits the average house roof in Vermont to supply 10 times the electricity used by the average homeowner. Current practical limitations, however, will likely keep the contribution of solar power to small levels (estimates are in the range of under 5%). Technological advances and policy driven incentives could change that potential.
Advantages
No emissions; no greenhouse gas; renewable sourceFuel is freeEconomic benefits from installation jobsDistributed generationSolar power works best on hot summer days and cold clear winter days when electricity prices are the highest
•
••••
Disadvantages
Solar generation is comparatively expensive and only cost competitive for remote locations (off grid) or specialized applications (to offset the cost of running a line)All costs are front-loaded, requiring a multiple year payback
•
•

Vermont’s Energy Future 2�
Combined Heat and Power (CHP) Systems
BriefCombined heat and power systems (also known as co-generation) are a growing source of electric generation in Vermont with the added benefit of offsetting other energy needed for heating buildings. A CHP system is one where the waste heat from a combustion-type generator is used to provide space heat or process heat for a building.
An example of this system would be an internal combustion engine where the heat from the radiator provides space heat to a building or steam in industrial applications. The advantage of CHP is greater efficiency than if the electric generation and heating were done separately. Vermont is estimated to have 21 MW of electric generation from CHP, with more growth potential, depending on the site.
Advantages
Greater efficiency means lower fuel use, fewer emissions and fewer greenhouse gasesVermont-based resourceCan create local jobs and economic benefitsDistributed generation; can benefit transmission systemCan use biomass from Vermont’s woods and farms
•
•••
•
Disadvantages
Combustion is still required and thus creates environmental impactsSystems are smallUpfront costs may require incentives or ways to spread out cost recovery and payback
•
••

Vermont’s Energy Future 2�
Energy Efficiency
Brief Energy efficiency can be considered as a resource option comparable to traditional generation resources like coal, nuclear, natural gas, and renewables. It is relatively inexpensive and clean compared to generation options.
It can also be considered as an alternative resource in transmission and distribution (T&D) planning. In the past decade, utility ratepayer investments in energy efficiency resources have reduced overall electric consumption in New England by about 3-5% and in Vermont by over 5%.
Since 2000, energy efficiency services have been provided in Vermont by the nation’s first energy efficiency utility1. A 2006 study done for the Department of Public Service concluded that nearly 15% of Vermont’s electricity needs in 2015 can be met through cost-effective efficiency programs (20% if fuel-switching occurs).
Advocates say efficiency should be the first choice for meeting Vermont’s electricity needs due to its low cost and associated environmental and economic development benefits. There is little opposition to efficiency as a concept.
However, some are concerned about increased rates and costs on near-term bills (especially for non-participants) and about ensuring the accountability and cost-effectiveness of the delivery mechanisms.
Efficiency Vermont (“EVT”) provides energy efficiency services statewide, with the exception that the Burlington Electric Department (“BED”) provides these services in its service territory. Both EVT and BED are part of the Energy Efficiency Utility (“EEU”) structure that is currently funded through the Energy Efficiency Charge (“EEC”).
1.
Advantages
Significantly lower cost than other resource options Lowers everyone’s power costs by displacing the most expensive resource at any given timeLarge quantity of both energy (kWh) and capacity (kw) available from energy efficiency in VermontImproved electric sector reliabilityCan defer or avoid costs to upgrade electric transmission and distribution systemCan be deployed or scaled back relatively quicklyNo significant greenhouse gas emissions or other pollutantsJob creation and local economic development impactsImproves the value, public health, and comfort of Vermont’s homes and buildings.Reduces our dependence upon foreign energy sourcesReduces natural gas price volatility
•
•
•
••
••
•
•
•
•
Disadvantages
Requires coordination among many people to be most effectiveCan initially raise rates and bills for non-participants if costs are not spread over the period of benefitsThe effects of efficiency on overall energy usage can be difficult to quantify. Requires an infrastructure of knowledgeable and skilled efficiency service and product providers
•
•
•
•

Vermont’s Energy Future �0

Appendix F: Regional Workshop Background Document Appendices

VERMONT’S ENERGY FUTURE
APPENDICES


APPENDICES TO REGIONAL WORKSHOP REPORT (SEE SEPARATE DOCUMENT)APPENDIX A PART I: NATURAL GAS, COAL, NUCLEAR, AND OIL Natural Gas.................................................................................................................5 Coal.............................................................................................................................8 Nuclear......................................................................................................................10 Oil..............................................................................................................................14
PART 2: bIOMASS, HYDRO, WIND, SOLAR, AND COMbINED HEAT AND POWER biomass.....................................................................................................................17 Hydro.........................................................................................................................21 Wind..........................................................................................................................23 Solar..........................................................................................................................31 Combined Heat and Power.......................................................................................33
PART 3: ENERGY EFFICIENCY AND DEMAND REDUCTION...............................37
APPENDIX b: CROSS CUTTING ISSUES...........................................................................43
APPENDIX C: COMPARATIVE RESOURCE COST ASSUMPTIONS................................51
Table of Contents


Vermont’s Energy Future �
in permitting in the Northeast. Advocates say LNG might stabilize natural gas prices. Advantages
Low construction costFlexibility in unit sizeShort construction periodFewer emissions than coal or oilNo need for fuel storage or fuel handling areas like coal or wood; has a smaller footprint (backup fuel is usually oil)Dispatchable
Disadvantages
Contributes to greenhouse gases; has some emissions of NO
x
Natural gas prices are less predictable than other fuel sourcesNatural gas is imported into the region and thus can be subject to transportation or supply disruptions caused by unforeseen environmental or political actionsThere is a finite supply of gasMay require water for cooling for larger combined-cycle plants
Natural gas is a flexible fuel. It is readily available in much of the U.S. and transported by pipeline. Natural gas burns cleaner than traditional coal plants (in which coal is pulverized and combusted in a boiler—see coal section for prospective improved technologies).
Over the last ten years, it has increased in efficiency by about 30%. Prior to 2000, there was a boom in the construction of natural gas generation in New England and the U.S. for these reasons.
•••••
•
•
•
•
••
This section of the materials discusses four options for electric generation. The options differ largely on fuel type and each option has advantages and disadvantages.
NATURAL GAS
Brief
Natural gas as an electric generation fuel has great flexibility and burns cleaner and the technology is more efficient than either coal or oil. It is economical both as a peaking fuel (simple cycle) and as an intermediate and base load fuel (combined cycle).
In terms of electricity generated in 2006, 38% of the generation in New England was fueled by gas. The amount of natural gas generation grew in the late 1990s when gas was cheaper ($2 per MCF) than it is now, and inefficient oil units were replaced.
Gas is now in the $5-7 per MCF (per thousand cubic feet) range and future prices are difficult to predict. Gas is available in the northwestern portion of Vermont, but there is no natural gas-fired electricity generation in Vermont. The combustion of natural gas contributes to greenhouse gases.
Right now in New England, wholesale market electricity prices are strongly correlated with natural gas prices. While the largest global natural gas reserves are in the Middle East and the former Soviet Union, 80% of New England’s natural gas comes from North America, and Vermont’s natural gas comes from Canada.
Several terminals to import liquefied natural gas (LNG) are either under construction or
Appendix A: Full Resource Option DescriptionsPart 1—Natural Gas, Coal, NuClEar, aNd oil

� Vermont’s Energy Future
note that natural gas turbines in smaller sizes are interchangeable with aircraft engines.
The recent improvements in efficiency have made the efficiency differential between peaking plants and intermediate plants less important for natural gas. There have been natural gas units proposed for Vermont in the past—they ran into opposition, and development plans were dropped. As noted earlier, none has been permitted or sited to date.
The nature of the opposition centered around placement of the proposed units and the proposed large size of the units (produced more power than was needed in the area or Vermont). Some opponents stated that Vermont would suffer the disadvantages of power plant location for power that was to be shipped to other states.
Supporters observe Vermont interests could get all the power that they would want from such projects and would benefit from the economies of scale associated with producing more for export. Others believe smaller units, sized for the local Vermont needs, might not suffer the opposition that plagued the earlier proposals.
In the comparative tables found in Appendix C, we use three gas plants as examples.
The first is a small (25 MW) simple-cycle combustion turbine (CT). This plant is designed for peak load purposes. The second is a larger 50 MW combustion turbine (CT).
The third option is a larger (200 MW) combined-cycle plant (CTCC) that is appropriate for either intermediate load or base load purposes.
The boom, however, has since declined because gas has become more expensive.
A major disadvantage of natural gas is the unpredictability of its prices. Gas prices are often stated in the cost of a thousand cubic feet (MCF). While gas prices are currently in the range of $6-$7 per MCF, over the past decade prices have fluctuated from $2 per MCF to $13 per MCF.
Vermont has little control over price swings of this magnitude. Natural gas plants are typically built to be 50-250 MW in size. They are estimated to cost between $525-$730 per kW of capacity, with the larger plants having the lowest cost per MW to construct.
There are three types of natural gas technology:
Steam Generator/Steam Turbines - Typically large units that serve as baseload or intermediate load units.Simple-Cycle Gas Combustion Turbines - The least expensive to construct but expensive to operate (requires more fuel). They are typically used as peaking units.Combined-Cycle Gas Turbines - Recycle exhaust gases from a combustion turbine, producing steam to generate additional electricity in a steam turbine. They are more expensive to build than simple cycle units but are more efficient and have lower fuel costs. They are typically used for intermediate portions of the load curve.
The advances in natural gas efficiency have come largely through improvement in gas turbine technology and the efficient use of recycled exhaust gases. It is interesting to
•
•
•

Vermont’s Energy Future �
Figure L: Vermont Gas distribution line and service territory - 200�

� Vermont’s Energy Future
Disadvantages
Greater emissions than all other generation types (NO
x, SO
x, particulates,
mercury)Major contributor to greenhouse gasesNew technology (IGCC) to burn coal cleanly is untested and cost is unclearNew technology to capture CO
2 is
untested and cost is unclearTakes longer to build and site (5-7 years) than other optionsCoal plants only come in large sizesTransportation costs and available infrastructure to support new transportation are limiting factors
The main advantages of coal are its abundant supply in the U.S., stable prices, and consistency (its technology has been used for over 50 years).
While coal plants are more expensive and take longer to build than natural gas plants, they produce power at a cheaper rate per megawatt hour, due largely to stable fuel prices. States in the U.S. with large amounts of coal generation tend to have cheaper electricity.
The primary disadvantage of coal is emissions. While coal is doing significantly better on air emissions (NO
x, SO
x, and
particulates), efforts to control mercury are only now underway and coal still emits far more of these than natural gas.
The overwhelming concern for coal is its contribution to climate change through carbon dioxide emissions.
•
••
•
•
••
COAL
Brief
While there is no coal-fired generation in Vermont, the state purchased 14% of its electricity in 2006 from the New England Power Pool, which includes coal generation.
In terms of the electricity generated in 2006, coal made up 14% of the generation in New England. In the U.S., about 50% of the electricity is generated with coal. New technology might make coal a cleaner burning fuel and lower its contribution to greenhouse gases, but this will also increase the cost of using coal.
Advocates say coal must be an element of the U.S. energy solution due to the large amount of new generation required and the impact on national security. Opponents say current pulverized coal technology should be discontinued due to environmental impact, and that the jury is out on the feasibility and performance of new coal technologies.
If coal is selected as an element of the future Vermont electricity portfolio, it would likely be through contract rather than a building a new coal plant in Vermont.
Advantages
U.S.-based fuel sourceCoal can be stored on-site in large quantitiesPotential for long-term contractsLess price volatility than gas200 or more year supplyGenerating plants using coal can be built in large sizes (700-1,000 MW), achieving economies of scale
••
••••
Vermont’s Energy Future �
design offers more efficiency in fuel conversion and less pollution than conventional plants. However, it is unclear whether there is any viable solution to removing CO
2 from the
emissions of this design.
A few IGCC plants are operating in a demonstration phase, but most experts would agree we lack commercial experience with the technology. Several companies believe their technology is ready for commercial adoption and are proposing IGCC plants. One of these is a 680 MW IGCC plant proposed by NRG (a company specializing in generation) in western New York.
According to news releases, the plant would go into operation in 2013. NRG was the winner of the competition to build an IGCC plant and sell to the New York Power Authority. However, the costs of these new plants is uncertain until we have more experience. Some say the costs of IGCC plants with sequestration will be twice that of a pulverized coal plant, others even more.
Assuming the technological challenges can be resolved, coal has additional advantages. because it is a domestic resource, coal has implications for energy independence in the U.S.
Coal plants are generally larger (700-1,000 MW) and can achieve economies of scale. Coal is typically transported to plants by rail and barge and can be stored on site, avoiding supply shortages. While the ash produced from burning coal has many chemicals and needs proper disposal, it has found use in the construction industry. About 50% of the electricity produced in the U.S. is from coal.
As a consequence, permitting of new pulverized coal plants has significantly slowed in the U.S. and Canada, as most wait for improved technology.
If coal is to have a significant future as a generation source, then technological changes will likely be required to reduce carbon emissions. Since the coal itself has a fixed amount of carbon, techniques for reducing CO
2 emissions involve either
increasing efficiency or capturing the CO2
before it leaves the exhaust stack.
The most-discussed technology for efficiency improvement is called Integrated Gasification Combined-Cycle (IGCC). In a IGCC, a chemical process converts the coal to a gas that is cleaner to combust, enabling the CO
2
to be more easily captured. The coal/gas is then burned in a combined-cycle plant, which is an efficient way to burn gas.
The current challenge is to make the two processes work together on a day-in-day-out basis, especially when coal does not have a consistent molecular structure (like gas).
Another consideration with new coal technologies is how to capture the carbon dioxide and what to do with it. Some propose to use it commercially in process manufacturing or enhanced oil field recovery.
Others propose a process called sequestration, or storing it long-term in abandoned gas and oil wells or at sea. Several companies say their technology for sequestration is ready for commercial use.
A less dramatic technology employs a conventional boiler combusting pulverized coal to produce ultra supercritical steam and scrubbers to clean the exhaust gas. The

10 Vermont’s Energy Future
sequestration of carbon dioxide). The environmental chart in Appendix C compares current coal technology with an IGCC plant and includes sequestration.
NUCLEAR POWER
Brief
The Vermont Yankee Nuclear Plant currently provides 35% of the electricity consumed in Vermont, which is about 46% of Vermont Yankee’s total output (the other 54% is exported to other states). As a significant portion of our base load power (the other being Hydro-Québec), it often meets as much as 50% of our daily demand for energy.
Vermont Yankee was granted a 40-year license to operate, beginning in 1972, by the U.S. Nuclear Regulatory Commission (NRC). Under consideration now is whether the plant will be given permission to operate for another twenty years following 2012 and, if so, whether Vermont utilities will continue to purchase power from Vermont Yankee. Vermont utilities could also possibly purchase power from other operating nuclear plants in New England if available. Proponents of nuclear power in the U.S. are advocating new nuclear plants and license extensions at existing plants as a way to combat greenhouse gases, offer stable prices, and increase energy independence.
Opponents of nuclear power say there are other options available. They cite concerns about safety of nuclear plants as they age and the possibility of accidents and point out nuclear plants are considered possible
The disadvantage of coal is its emission profile, especially carbon. Another current disadvantage is the uncertainty over the cost for new technology, such as IGCC. because of the large size of typical coal plants, coal may be an unlikely option for location in Vermont.
The cost of transportation for coal is a significant variable, and the availability of transportation has experienced limitations in some parts of the country. Coal, especially the IGCC version, has a much larger footprint than does a natural gas plant and takes much longer to build (5-7 years).
The issue then becomes the desirability of coal as a fuel type in a portfolio of purchased power contracts that electric utilities in Vermont may select. Some may say that if the coal plant is in another state, then that is not a Vermont impact, especially if the price is stable and lower than other energy generation contract options.
Others say it depends on which way the wind blows regarding things like acid rain, but that climate change is a global problem regardless of plant location. They say that, in any case, Vermont should be responsible about its emissions profile.
The comparative chart in Appendix C looks at three coal options. The first is a traditional pulverized coal plant that would form the basis of advantages and disadvantages for existing coal-based power.
The second option is an IGCC plant (without sequestration). The third option is a circulating fluidized bed (CFb) plant that uses an advanced form of combustion to reduce emissions (it also does not include

Vermont’s Energy Future 11
There is currently more than one million pounds of high-level nuclear waste being stored at Vermont Yankee in a pool approximately 26 feet wide and 40 feet long. Continued operation creates even more spent fuel stored on-siteOperation of a nuclear facility always poses some degree of risk for potentially serious accidentsThe plant, like any other mechanical or industrial facility, has experienced mechanical failuresAs a unit-contingent contracted facility, power from Vermont Yankee is predicated on the reliability of a single facility, meaning that a plant shut-down would have a greater impact on customers than would be the case if power were received from multiple resourcesNuclear fuel is finite; reprocessing nuclear spent fuel is practiced in other countries but is not currently available in the U.S. If nuclear generation expands worldwide, the price of nuclear fuel could go up, with increased demand
The most likely option for nuclear power for Vermont on an ongoing basis primarily revolves around the Vermont Yankee Plant operated by Entergy Nuclear Northeast in the town of Vernon, VT.
Vermont utilities could purchase the output from other nuclear facilities in New England, but Vermont’s degree of leverage and long-term relationship is with Vermont Yankee.
Entergy Nuclear is a specialized nuclear plant operator that owns and operates several nuclear plants in the northeast.
•
•
•
•
•
terrorist targets. Opponents also cite the considerable issue that absence of a national waste disposal site represents.
If the Vermont Yankee plant is not relicensed and new power contracts for Vermont Yankee Power are not negotiated past 2012, alternate measures will be needed to meet Vermont’s electricity needs and to meet its greenhouse gas reduction goals. Advantages
No greenhouse gases or emissions from power generation, since nuclear plants do not burn fossil fuelReliable base load power, meaning it is part of our every day energy supplyPotential to negotiate a long-term (up to 20 years) contract for powerEconomic benefits to Vermont in the form of taxes, revenue sharing, and 650 jobsThe plant already exists along with the needed transmission infrastructure; it is an in-state generation sourceIf the plant is re-licensed, a prior regulatory order requires revenue sharing for Vermont customers when prices are above $61 per MWH The plant has a 35-year track record of high reliability and consistent power outputOver the past five years, the plant has been retrofitted with multiple equipment upgrades and large component replacements
Disadvantages
There is currently no long-term solution (nationally) for safe storage of nuclear waste.
•
•
•
•
•
•
•
•
•

12 Vermont’s Energy Future
tax incentives for those interested in building new nuclear plants, the option for a new plant anywhere in New England is beyond the 5-10 year timespan we are considering (a new nuclear plant would likely take at least 10 years to permit and build).
Vermont’s major utilities have indicated an interest in discussing the continuation of new power contracts after 2012. Terms and conditions for such an extension are unknown at this time, but preliminary negotiations are expected to begin in the next several months.
Those in favor of relicensing and new power contracts past 2012 say:
Vermont Yankee is a good in-state source for a large quantity of Vermont’s base load electricityThe plant already exists, along with existing distribution and transmission needed to move the power; no new construction is requiredThe plant’s operation creates no greenhouse gas emission since a nuclear plant is a non-fossil fuel generation sourceContinuing a reliable long-term contract could provide stable, predictable power prices; the contract currently in effect has saved Vermont customers more than $250 million over the past five years, compared to what the power would have cost at market prices, and has contributed significantly to Vermont having the lowest electric rates in New EnglandThe plant provides economic benefits to Vermont estimated at about $200 million per year, including an employee payroll
•
•
•
•
•
The issues are whether the plant will be relicensed by the U.S. Nuclear Regulatory Commission (NRC) for an additional twenty years of operation, receive a Certificate of Public Good (CPG) from the Vermont Public Service board (both are needed under federal and state laws), and whether additional storage of nuclear fuel waste will be approved by the state Legislature before the current license expires in 2012.
The capacity of the original, water-filled “spent fuel pool” is nearly exhausted. On-going operation is being conducted by moving some of the older fuel assemblies from the spent fuel pool into separate concrete and steel canisters, or dry cask storage. Even if the plant were to be closed in 2012, additional dry cask storage would be needed in order to empty the reactor and the spent fuel pool.
An additional consideration will be whether suitable contracts for purchase of the power can be negotiated between Entergy and Vermont’s distribution utilities.
The requirement for legislative and regulatory relicensing approvals suggest that a future contract with Vermont utilities could be obtained on favorable terms (e.g. lower price, easier credit requirements, etc.) or other benefits obtained for Vermont. Vermont Yankee currently provides approximately 35% of the electricity used in Vermont at a fixed price of $40 per MWh. In comparison, nuclear power provides 14% of the power in New England and 20% of the power in the U.S.
While there is renewed interest in new nuclear plants across the U.S., and the federal government has created a program of

Vermont’s Energy Future 13
The issue of storing and disposing of nuclear fuel is of major concern. by law, spent nuclear fuel is the responsibility of the federal government.
The federal government has failed to build an adequate waste disposal site despite more than two decades of research and investment (the fuel is radioactive for many thousand years). Until a national repository is opened, spent nuclear fuel is stored at the nuclear plants.
Nuclear plant operators say the technology for plant storage is safe and reliable until the national issue is resolved.
Opponents of the Vermont Yankee extension are not convinced and say it is irresponsible to continue producing nuclear waste if there is no reliably safe long-term solution currently available.
In the final analysis, it is perhaps overly simplistic to cast the issue of long-term waste disposal in terms of how opponents or proponents see it.
In deciding upon an extended life for Vermont Yankee in Vermont, the state and its citizens will need to balance the very real benefits of reliable base load power at stable prices against the possibility that the spent fuel will be stored in Vermont for an as yet defined period of time. This is the ultimate risk and benefit calculation that we all have to make.
of 650, significant state and local tax payments, and purchases of goods and services from in-state businessesVermont Yankee produces benefits to the state, whether or not Vermont utilities take the power from the plant
An existing regulatory order requires plant sales after 2012, which are at prices above $61 per MWH, to be shared with certain Vermont utilities. Depending upon future market prices, these benefits could be tens of millions of dollars annually.
Those in favor say the issue of storing spent nuclear fuel is ultimately the responsibility of the federal government. While limited action has taken place at the federal level, the technology and funding is in place to safely store spent fuel at the Vermont Yankee site until the federal government takes ownership.
Those who oppose the Vermont Yankee nuclear power plant cite ongoing safety concerns about the plant (and nuclear power in general) and concerns about storing spent nuclear fuel. They point out that other nuclear plants in the region have been shut down.
They say the economic benefits of the plant (such as jobs and tax payments) do not offset the potential for an accident. They believe the economic benefits of alternative energy sources are as good or better, especially in job creation.
While the debate continues, analysis of the economic benefits of alternative energy sources (with the exception of biomass) appears to be contained to early construction and, after completion, very limited as compared to the overall workforce.
•

14 Vermont’s Energy Future
Oil consumption is a negative for national security and energy independenceContributes to greenhouse gasesContributes to other air emissions (SO
x,
NOx, particulates, and mercury)
Oil is an older fuel and, in many cases, has been replaced by natural gas. Oil made up 34% of New England’s generative capacity in 2000 and only 24% by 2006.
New oil plants in Vermont would likely serve peak demand. It is a relatively efficient fuel for peak load, and small oil-fired turbines have benefited from the technological advances in natural gas turbines.
Oil can be transported by truck to remote locations that do not have natural gas. However, disadvantages include price volatility (which fluctuate with natural gas and world oil) and its emission levels. Oil is a hydrocarbon and burning oil releases carbon dioxide to the atmosphere at levels above natural gas and below coal.
Those arguing for oil to serve demand point out that peaking units typically operate less than 100 hours per year.
•
••
OIL
Brief
Oil has long been an important fuel in New England, but recently has been displaced by natural gas where it is available. It provided 2% of Vermont’s in-state generation capacity in 2006 and 9% of the electricity produced in New England.
Oil is also part of the system mix purchased from the New England Power Pool. It is between gas and coal in terms of emissions and greenhouse gases. Oil is flexible, in that it can be delivered by truck, making it a potential fuel source for distributed generation and combined heat and power systems.
Oil can also be used in peaking plants that usually run less than 100 hours per year. Oil prices have more than tripled over the past decade. Advantages
Less pollution and greenhouse gases than coalCan serve as a backup or replacement to natural gasCan be transported by truck to areas where natural gas is not availableHas good dispatchability; starts quickly and can decide when to runPossible fuel source for distributed generation
Disadvantages
Price can be volatile and tends to be more expensive than gasLimited oil supply globally
•
•
•
•
•
•
•

Vermont’s Energy Future 1�
provide part of a single home’s usage. The very small projects are often dedicated to a particular load and are termed, “behind the meter.”
If there is more power produced than the load requires, net metering is sometimes allowed for small projects. These small projects essentially turn the meter backwards reducing the amount of electricity one needs to buy from their local utility, thus called net-metering. If more electricity is produced than is needed, it can be sold to the electric utility at wholesale prices.
Net metering is a simplified billing method which does not take into account the fact that energy produced at different times is of different values. Net metering is designed to encourage very small, homeowner-sized renewable generation sources.
Many of the options in this section are also eligible for Renewable Energy Certificates (RECs), another method used to stimulate small renewable sources (see below).
RENEWABLE ENERGY CERTIFICATES
In the U.S., a growing recognition of the importance of renewable energy has resulted in a number of federal, state, and utility initiatives to encourage the growth of the renewables sector and to incorporate more energy from renewable resources into the nation’s power grids.
Some of these initiatives are voluntary, like green pricing programs, and some are mandatory, like renewable portfolio standards.
This section considers a broad range of generation options that are smaller in size and typically do not depend on finite fuels. Finite fuels are those with limited amounts remaining, including oil, natural gas, coal, and nuclear.
It is estimated there is oil and natural gas for another 20-50 years, coal for 200-plus years, and nuclear for several hundred years. Instead, the options in this section tend to rely on renewable fuels. The terms renewable and renewable fuels can have multiple definitions.
As commonly stated, a renewable is a fuel source that is inexhaustible, such as wind, water, geothermal and solar, or one that regenerates at a rate greater than or equal to the rate it is consumed—as in many forms of biomass.
For the purpose of discussion, renewable projects come in two basic sizes: utility scale and smaller scale.
Utility scale projects share many characteristics with other utility generation. Utility scale projects can include large wind farms, large scale hydro, large scale biomass, and geothermal. 20-50 MW would be a large, utility scale renewable installation for Vermont (such as a large wind farm, or the burlington wood chip plant). It is also possible to purchase power from large renewable projects located outside Vermont (Hydro-Québec is an example). Utility scale solar is under development in the southwestern U.S. but is several years away from commercial operation.
Smaller scale renewable projects range from several MW to very small projects used to
Appendix A: Full Resource Option DescriptionsPart 2—bioMass, hYdro, wiNd, solar, aNd CoMbiNEd hEat aNd PowEr

1� Vermont’s Energy Future
ensures that those paying for the renewable attribute get the credit.
For a utility, RECs represent a convenient way to demonstrate compliance with any regulatory requirements regarding quantities of renewable energy. They also ensure customers get what they pay for, since only one REC is issued for each MWh of renewable energy produced.
For an owner of a renewable project, RECs represent an additional source of income to justify the construction of a project and encourage additional projects are built.
For policy makers, RECs inject market forces into the procurement of renewable energy. Competition would suggest that the most cost-effective renewable projects will be built under such a system.
For consumers of electricity, RECs represent a way to ensure that their utility is actually delivering renewable energy to them.
The market price of RECs depends on the relationship between the demand for RECs and the supply of RECs. The demand is a function of the region’s various renewable portfolio standard requirements. Most REC requirements will likely increase over the next several years.
The price is also influenced by the demand for voluntary green pricing programs, such the Cow Power program offered by CVPS. The supply is driven by the pace of new construction of projects that qualify. At present, supply is lagging demand in many areas, so prices for RECs from new projects are high.
Almost all of these initiatives require the operator of the New England electric system to carefully account for the amount of renewable energy sold to customers. One feature of this accounting is the use of Renewable Energy Certificates (RECs).
One REC represents the attributes of one MWh of renewable energy—but not the electricity itself.
Generation from renewable sources can be separated from the commodity electricity to create two products—each of which can be sold separately:
A utility with requirements to meet a certain percentage of its supply with renewable energy is able to demonstrate compliance either by creating RECs with its own resources or by purchasing them from owners of other renewable facilities. When RECs are combined with electricity from any source, it is considered renewable electricity.
For example, if a utility receives 100% of its electricity from a coal plant but combines it with the purchase of an equivalent number of RECs, that electricity would be considered renewable energy for their reporting requirements. Conversely, if a utility chooses to sell the RECs from a renewable project, it no longer can claim that resource as renewable in its portfolio.
A strict rule which prohibits double counting retains the integrity of the system and

Vermont’s Energy Future 1�
The requirements for renewable portfolio standards are enacted by elected officials who are concerned about the pollution associated with generating electricity and want to see renewable energy business grow in their state. The additional costs, which are passed on to consumers, represent those societal values as perceived by the various state legislators, and they serve to send a price signal to consumers regarding their use of electricity.
BIOMASS
Brief
Vermont is one of the leading states in the use of biomass to generate electricity—most is from wood by-products. With 78% of the state forested, the rate of consumption is sustainable (less is used than replaced).
In 2006, wood provided 8% of the electricity consumed in Vermont. Wood generation units can range from 50-60 MW down to 1-3 MW. Wood has economic benefits in terms of jobs, but price can also fluctuate based on what is going on in the forest products industry.
burning wood emits greenhouse gases. However, the CO
2 from biomass is recycled
as the next generation of trees mature. Generation from farm-based wastes (such as manure) that have been turned into methane is a new and growing source. While farm methane projects are not economic just for electricity production, the associated benefits of odor and runoff control make the process feasible.
Referring to the discussion on externalities, the price of RECs internalizes through a combination of policy and markets what used to be thought of as an externality.
Each state defines the type of generation that qualifies as a renewable resource in that state. Generally, RECs are tradeable within the New England region.
EXTERNALITIES
The production of electricity involves many costs—some of which are borne by the consumer and some of which are passed on to society at large.
Costs typically borne by the consumer include the fuel and capital costs of generating electricity. Whereas those costs passed on to society at large include emissions from power plants (particulates and mercury) and the related healthcare costs that follow—these are called externalities.
There have been efforts to include a greater portion of externalities in the production costs of electricity. Initial efforts included requiring emitters to clean the sulfur from flue gases with scrubbers or by purchasing lower sulfur fuel. More recently, permits have become required in order to emit various pollutants into the air.
The annual amount of permits issued is limited, thereby reducing the aggregate pollution from a particular generation type. RECs are a similar device, in that the externality costs for cleaner generation are included into the costs we pay for renewable resources.

1� Vermont’s Energy Future
because the range of options in biomass energy is so broad, these materials will concentrate in two areas: 1. wood chips and 2. Methane gas from farms and landfills.
The potential for wood chips or wood as a fuel is all around us—about 78% of Vermont’s land is forested. Vermont electric utilities have long considered wood as a source of fuel to generate electricity and as a source of energy for combined heat and power systems.
The technology for using wood as a fuel is advancing and is becoming more efficient and cleaner. but the source of wood for large electric generation can be uncertain as it tends to be a by-product produced from other industries. For example, wood availability and price suffers at times because of the close and obvious linkage to the forest products industry. As the forest products business goes through cycles, wood-fueled power is directly impacted.
Wood
According to the Vermont Department of Public Service, wood provided 8% of our electricity supply in 2006. Vermont currently has two wood-fired power plants and one more in a conceptual stage.
The McNeil Generation Station in burlington is owned by the burlington Electric Department (50%) and other Vermont utilities. It has a rated capacity of 53 MW and has operated since 1984. McNeil was the largest wood-fired generator in the world when it came on-line.
After the plant opened, its fuel price was not competitive with low oil prices beginning in 1986, and thus it operated at a low capacity of
Advantages
Wood as a fuel in Vermont is renewableLandfill gas or methane from a farm is generated from a waste productCreates jobs and provides another revenue stream for forest industries and agricultureIs neutral to beneficial on greenhouse gases (wood is neutral if sustainably harvested, beneficial if used instead of natural gas; methane fuel sources are beneficial when they prevent methane from escaping to the atmosphere)At current natural gas prices, the cost for wood generation is competitive
Disadvantages
biomass is usually waste wood from another process and price and supply can fluctuateMust be transported from the forest to the plantWhile emissions have improved, there remains some concern over particulatesSome say wood products should be dedicated to combined heat and power systems (where both electricity and useful heat is generated) rather than used for large-scale generation
Vermont is a leader in the use of electrical energy produced from biomass sources.
The following discussion about advantages and disadvantages of biomass energy is taken largely from the Vermont Energy digest published in April 2007 by the Vermont Council on Rural Development (brenda Hausauer, author) and from the work of the biomass Energy Resource Center and their Vermont wood Fuel supply Study.
••
•
•
•
•
•
•
•

Vermont’s Energy Future 1�
may increase in the future, the creation of wood chips as a by-product is not likely to increase.
Production of wood chips requires significant investment in a wood chipper for a low value product. This creates a market that is not straightforward, and prices and reliability of supply can change. Developments in the pulp and paper industry impact wood energy prices. Wood chip prices have gone from $18 per ton in 1984 to $29 per ton today. This price change is similar in pattern to coal, smaller than the change in other fuels such as gas, but is less volatile.
Vermont has enough wood to increase its use for the large-scale generation of electric energy, but the state may not have enough loggers and equipment. Landowner and harvesting issues also exist. The sizes of land parcels are shrinking, and there is a new generation of landowners purchasing properties. Harvesting wood often has no significant financial advantage to landowners.
Farm-Based Biogas Energy Systems
When Vermont’s cows are fed a ration of grain, corn silage, and hay, they extract the energy they need from the feed to provide for their own growth and sustenance and to produce milk. However, because no biological process (including a cow’s stomach) is 100% efficient, the manure it excretes contains a significant amount of additional potential energy.
by employing the process of anaerobic digestion, farmers can extract this potential energy in the form of biogas. The biogas can, in turn, be used to create electricity and heat.
about 20% for a time. In 1989, McNeil added the capability to fire its boiler using natural gas when wood was not economic. With today’s high natural gas and oil prices, McNeil is now fairly competitive and basically burns no oil or gas except for startup purposes.
The McNeil plant provides 39 jobs at the power plant, including four procurement foresters. There are about twice that number of full-time jobs associated with wood harvesting, transportation, etc. It has contributed over $200 million to the local economy through January 2007 (not including the construction of the plant).
It also uses sawdust, chips and bark from local sawmills, and processed urban wood waste. Local residents contribute between 2,000-3,000 tons per year of yard trimmings and 3,000-4,000 tons per year of pallets (Irving, 2007).
A second wood-fired generation plant in Ryegate came online in 1992, with a capacity of 20 MW. The Ryegate plant is an Independent Power Producer (IPP) selling power through the Vermont purchasing agent, similar to in-state hydroelectric facilities. When Ryegate’s contract ends in 2012, the company hopes to sell power through the New England power grid.
There are several new wood-fired generation plants currently under consideration in Vermont, including one that plans to supply heat and power to an existing industrial facility.
Wood chips are a low value product produced from sawmill residue or concurrently with a forestry logging operation. Sawmills generally try to minimize their creation of wood chips. So while demand for wood chips

20 Vermont’s Energy Future
Additional projects are due to come on-line in the coming months. The overall potential for farm methane systems in Vermont is estimated to be fairly small.
Landfill Biogas
Landfill biogas is created when municipal solid waste decomposes. The gas is about 35% methane (much of the rest is carbon dioxide) and has roughly one-half the energy value of natural gas. This landfill biogas can be captured, converted, and used as an energy source.
This not only reduces odors and other local air pollution problems, it also prevents the gas from migrating into the atmosphere and contributing to smog and global warming. (Methane has about 21-times the global warming impact of carbon dioxide.)
Today, only two major landfills operate in Vermont—in Coventry and brattleboro.
Coventry is Vermont’s only operating landfill that has a biogas project. That project currently has 6.4 MW of capacity, and could grow to 8 MW. The current project is expected to produce power for about 25 years.
The Waste System’s Moretown landfill has the largest untapped potential for a biogas project. The Moretown landfill has capacity for a 3 MW landfill biogas project. Sewage treatment may offer a source of biomass generated electricity in the next decade.
Anaerobic Digestion of Biodegradable Wastes
Anaerobic digestion is the bacteriological breakdown of organic (carbon-containing) material in an oxygen-free environment.
Manure-to-energy projects collect manure from the cows into a large airtight concrete tank and hold it there for about three weeks.
bacteria already present in the excreted manure further digests the manure in virtually the same process as was occurring in the cow’s stomach. biogas, produced by the bacterial breakdown of the manure, builds up in the tank and a pipe delivers it to an internal combustion engine where it is burned to make electricity.
Anaerobic digester systems are unique in that their benefits are a result not only of the renewable nature of the energy produced, but also because they have a significant positive impact on existing farm manure management practices.
The anaerobic digestion process leads to improved water quality, a significant reduction in farm odor emissions, improved farm nutrient management practices, and, perhaps most significant given our current understanding of global climate change, a reduction in total farm methane emissions.
Currently, there are four anaerobic digester systems in operation on Vermont dairy farms with a capacity of 1 MW. because the feedstock is available 24 hours per day, throughout the entire year, the systems produce power on a nearly continuous basis.

Vermont’s Energy Future 21
term contract (because the fuel price does not fluctuate)Contributes to goal of energy independence from oilA contract with Hydro-Québec provides system power as a backup, therefore reliable and dispatchable deliveries; transmission infrastructure is in placeSome hydroelectric is a local resource
Disadvantages
Small and new hydro projects are expensive to permit and build and can disrupt existing stream flowsSmall hydro power can be intermittent, so needs to be combined with another resource type Hydro-Québec contract or other large scale hydro contracts means direct economic benefits don’t reside in Vermont; a contract with Hydro-Québec does not produce local economic benefits in the form of tax payments and jobsCanada or Québec could change energy export policiesContract will likely renew at a multiple (above or below) of then market price forecasts so can be above or below market price in future yearsNew hydro projects can significantly harm wildlife habitats and limit stream flows
There are many sizes of hydroelectric facilities. Large hydroelectric facilities, usually owned by utilities, generally impound water behind a dam. The water is controlled and released to turn turbines and run generators when electricity is needed. Facilities with impounded areas are more economically attractive, but they have greater environmental impacts due to the flooding of lands to create lakes and fluctuating water levels.
•
•
•
•
•
•
•
•
•
HYDROELECTRIC
Brief
Hydroelectric power is a large scale energy source in Vermont, second only to nuclear power. The current contract with Hydro-Québec provides 27% of Vermont’s electricity. Other hydro sources, mostly in Vermont, provide an additional 12%. Hydro has environmental benefits related to air pollutants because it has low emissions and creates few greenhouse gases.
Hydro built in Vermont can have economic benefits, but by most estimates less than 100 MW of potential new or refurbished hydro sites exist, and most are small. Hydro is expensive to site, permit, and build, but the fuel is free.
The Hydro-Québec contracts begin to expire in 2012, but Hydro-Québec has indicated a willingness to discuss terms of a new contract with a price to be negotiated. Other large scale hydro resources are potentially available from other providers outside of Vermont, both in the U.S. and Canada.
If a new contract is not put in place, Vermont will need to replace this relatively large and inexpensive power source and factor in the loss of this non-greenhouse gas generation source into the Vermont plan to reduce greenhouse gas. Advantages
Low emissions; low greenhouse gas; renewable sourceMay be able to enter into longer duration contracts more easily than sources with less fuel price predictabilityStable pricing can be negotiated in long-
•
•
•

22 Vermont’s Energy Future
producers selling power to utilities owned about twenty hydro stations with a total capacity of 54 MW.
In 2003-2004, the state declined an opportunity to purchase a network of hydroelectric facilities with 567 MW of capacity on the Connecticut River between Vermont and New Hampshire and the Deerfield River in Southern Vermont. Instead, the dams were purchased by TransCanada Corporation for $505 million, who sold the power into the New England electricity grid, though not directly to Vermont utilities.
There has been a new interest in considering whether nonworking in-state hydro sites can be redeveloped, whether working hydro sites can be repowered (their output levels increased), and whether more micro-hydro and mini-hydro facilities can be built.
Costs, permitting, and environmental constraints are significant barriers to small hydro development in Vermont. Hydro projects that use public waters, even small rivers and brooks, require several permits, including permits from the Vermont Public Service board, the Agency of Natural Resources, and the Federal Energy Regulatory Commission.
Many of the permits are required to mitigate environmental impacts. Projects can take from 3-5 years to develop and are expensive, making it prohibitive for small projects.
A pico-hydro-sized system (less than 5 kW) in Vermont costs around $20,000 installed (including the grid interconnection) without permitting costs. On a project of under 1 MW, permitting costs add about $2,000 per kW to the total cost, bringing the total cost of a 5 kW system up to $30,000.
Small hydroelectric projects often refer to facilities with 1-5 MW capacity. In general, small hydroelectric projects have fewer environmental impacts than large projects due to their use of run-of-river design. (Opponents of specific projects, such as the Peterson Dam, might disagree.)
run-of-river hydroelectric projects generate power as the water flows through the facilities, requiring little or no impoundment. Small hydropower systems have other benefits as well—they do not displace people, the technology is not complex and can be easily transferred to communities, and the technology can provide power for locations that are not connected to larger grids.
Small hydropower sometimes includes the classifications of very small projects, including mini-hydro (less than 1 MW), micro-hydro (less than 100 kW). These smaller projects almost always use run-of-river designs. Some can be installed in farm ponds and water supply pipes. The projects can produce enough power for a single home, a block of homes, a school, or a municipal building.
About 2,321 GWh, or 37%, of Vermont’s electricity supply came from hydro sources in 2005. About 28% came through contracts with Hydro-Québec; 8% from Vermont utility-owned and privately-owned Vermont plants; and 1% from New York plants. Starting in 2015, the quantity of contracts Vermont will hold with Hydro-Québec decreases sharply.
In 2005, Vermont had 138 MW of small in-state hydroelectric capacity providing electricity. Utilities owned 84 MW, of which 51 MW came from a run-of-river stations, and 32 MW from facilities that have the ability to store water for use when electricity demand is at its peak. Independent power

Vermont’s Energy Future 23
Hydro-Québec has indicated an interest in negotiating a new long-term contract with the possibility of additional hydro resources. Terms and conditions for such new contract are unknown at this time, but any contract will depend upon regional electric market conditions anticipated at the time.
One would assume at this early point that Vermont might enjoy a small advantage when it comes to price, as alternate purchases of the Hydro-Québec power might require additional transportation costs to reach markets to the south. A new contract brings the benefits of hydropower to the Vermont portfolio such as no emissions, dispatchability (within contract terms), and the potential for a pricing formula that could include stable prices or prices with low variability.
The existing Hydro-Québec contract already demonstrates some of the advantages and disadvantages of long-term pricing. At times, during the current Hydro-Québec contract, prices paid for the power were above market price and at times (more recently) prices charged for the power were below market prices in New England—Vermont consumers benefited.
WIND Brief
Across the U.S., wind power is the fastest growing source of new generation (annual growth rate of 25%). Successful projects require attractive wind speeds, sites that can be permitted, and access to economically competitive markets for the electricity generated.
Studies on the economic potential for small hydro in Vermont show that it can range from 93 MW (barg, 2007) to 10 to 15 MW at existing dams ranging in size from 500 kW to 2 MW (Warshow, 2007). (Note: the previous section drew from and excerpts from the Vermont Energy digest, brenda Hausauer, April 2007, Vermont Council on Rural Development.)
Negotiation of a New Long-Term Contract with Hydro-Québec
The Hydro-Québec contract provides 28% of the electric energy used in Vermont. The bulk of the contract is scheduled to decrease sharply beginning in October, 2015. The current Hydro-Québec contract totals 309 MW. It is divided into six schedules with expiration dates as follows.
Each schedule has a 75% annual capacity requirement on energy deliveries. GMP has a resale agreement under which they annually sellback some of their energy to HQ at contract energy prices.
Roughly half of the cost is a fixed capacity payment (minor variation among schedules) and the other half is an energy payment that changes with an inflation-based index. The current energy cost is about 3.1¢ and the average capacity cost is about $20 per kW a month. Total cost is on average about 6.8¢ per kwh (some variation among schedules).
Schedule b 175 MW expires 10/31/2015Schedule C-1 57 MW expires 10/31/2012 (27MW sellback)Schedule C-2 28 MW expires 10/31/2012Schedule C-3 47 MW expires 10/31/2015Schedule C-4a 25 MW expires 10/31/2016Schedule C-4b 6 MW expires 10/31/2020

24 Vermont’s Energy Future
turbines are a significant intrusion on landscapes, that they spoil views, alter Vermont’s “Green Mountain State” ridge lines, and could have wildlife impacts at higher elevations.
There are plans being considered by independent developers to install over 100 megawatts of new wind power in Vermont at the present time. So far, the Vermont Public Service board has approved the Searsburg Wind Power Facility, the region’s first utility-scale project with 11 turbines, and, more recently, a 16-turbine project in Sheffield. PPM Energy recently submitted a petition to site a 45-megawatt project with 17 turbines in the towns of Readsboro and Searsburg.
Advantages
No air emissionsNo greenhouse gasesWind is a renewable resourceFuel is free, enabling stably-priced contractsVermont-based wind farms would produce local economic benefits in the form of tax payments and installation jobsCan be built or expanded in manageable increments of 20-50 megawatts as needed
Disadvantages
Wind turbines can be an intrusion on the landscapeWind farms may cause wildlife or habitat damage from either construction or operation because windy ridgelines are often wild and undevelopedWind power is only available when the wind blows, so is not dispatchableWindy locations are often remote from
••••
•
•
•
•
•
•
Experience with Vermont’s only commercial-scale wind power facility, the 6 megawatt Green Mountain Power wind facility in Searsburg, has generally been good. Searsburg verified the feasibility of wind power operating in cold climates.
It has been asserted by wind industry proponents that the technical potential for utility scale wind power could reach 200 MW of rated power, or up to 20% of the state’s current electricity peak demand, over the next decade. However, this projection is based largely on the assessment of wind resources, the proximity to the bulk transmission system, and eliminating sites that are part of either state, federal or other conserved lands and may not reflect what amount of commercial wind can ultimately be sited in Vermont.
Vermont’s predominant wind sites are along higher elevation ridge lines, thus placing them potentially in higher visible parts of Vermont’s communities. Wind power could also be purchased from outside Vermont under contract. Wind power is competitive with other sources of generation.
Implementing new wind-powered generation in New England has been problematic due to siting and permitting concerns.
As beauty is in the eye of the beholder, wind power advocates believe large wind farms are visually attractive and increasing their use will improve air quality by displacing greenhouse gas emissions from fossil fuel-driven electricity. Advocates point out there are clear precedents for mitigation should wildlife impacts exist. They say wind farms provide economic benefits to the regional and local economies.
In contrast, opponents contend that wind

Vermont’s Energy Future 2�
wholesale market price for electricity is in the range of 6¢ (this is a dynamic number effected by a variety of factors, most notably fluctuation in natural gas and other commodity prices), the difference is often made up by the value of the renewable energy certificates wind can attain. The second factor driving growth is that wind turbine technology has proven to be much more reliable than turbines just a decade ago, allowing the financial community to become comfortable investing in wind.
The third factor is federal and state policy initiatives, including financial incentives that have been implemented over this past decade, encouraging forms of renewable energy development.
Variability of Wind
because wind generation is a variable resource (similar to small hydro but with much greater short-term variability), wind can only provide a portion of electric system load requirements. 20-25% of a regional system’s energy needs may be a practical limit for the technology (some European systems already have higher percentages).
Wind power in New England currently produces less than 1% of our electricity, so this should not present a practical constraint in the near term.
Modern wind farms generate electricity 70-80% of the time, but, due to changing wind speeds, they generate over a year 30-40% of their full, theoretical name-plate capacity (if they were able to run 100% of the time at full output—something no generation source is capable of doing).
electric load centers and may require transmission lines to be upgraded or constructedPermitting timeframes are uncertain in Vermont (true for all fuels); this can make projects more expensive and, in an active market like wind, encourage wind developers to go elsewhereSome may like wind as an option but feel that it is better for wind power to come from outside Vermont (New England, Canada, or New York), where the wind resource may be better, it may be less expensive to develop wind projects, and the projects can achieve economies of scale
Over the past decade, wind turbines have become larger in terms of physical size and power generated. Production size per turbines have gone from less than 1 MW and are now between 1.5-2 MW. Off shore machines are bigger.
Wind turbine towers come in a variety of heights. 262 feet is a common size, and one of the taller sizes is 328 feet. blades can be 120 feet longer, so the tower and blade would be 260-430 feet (depending on the height of the tower and the position of the blade).
Wind power costs can be competitive relative to other forms of generating electricity. Wind power can be produced for as low as 6-8¢ per kWh. because the costs of a wind project do not vary year to year, a wind developer is more likely to enter into a stably-priced contract than the owner of a fossil fueled plant.
However, there are often cases where wind generated energy is priced according to the going wholesale market price. If the current
•
•

2� Vermont’s Energy Future
The Wind Power Resource in New England
The fact that wind blows the strongest and steadiest at the higher elevations in interior New England is well documented. This effect can be seen visually in the wind map for New England included in this section. (This map was produced by AWS Truewind).
Stonger annual wind speeds are illustrated by the red-hued colors on Figure l and show the best resources are concentrated off the coast and at the summit of the higher mountain ranges.
Regardless of the theoretical potential in Vermont, most planners, environmental agencies, and organizations that have looked closely at Vermont’s potential for wind power acknowledge that a relatively small percentage of this theoretical resource will be developed due to land use conflicts and economic reasons.
Some say that 250-300 MW could be installed in Vermont over the next decade. If each turbine had rated capacity of 1.5-2.5 MW, this level of development would require between 5-7% of Vermont’s ridgelines.
Utility Scale Wind
Most large wind developments have been built by independent, non-utility companies. Typical size across the U.S. and Canada is now around 100 MW, with big projects in the range of 200-300 MW. Projects in New England are smaller, in the range of 20-50 MW.
Wind power’s greatest value will be on electrical systems that have at least an equal amount of variable generation (gas peaking units or storage, such as hydro storage) to fill in when the wind is not blowing.
When paired with another variable generation source, wind acts as a “fuel saver” on the system, preventing the burning of fossil fuels and generation of attendant air emissions. An electrical system with a significant amount of hydro storage or natural gas or oil-fired generation like the New England system is a good match for expanding wind power generation.
Wind power can therefore be readily integrated into the existing regional electric generation system. Geographic diversity provided by multiple wind installations will also serve to dampen the intermittent nature of any single project.
Transmission Issues
because the best wind locations are often located remote from load centers, transmission of the power can be a significant and sometimes limiting issue for wind development.
The transmission infrastructure near a wind development must be capable of carrying the peak output load of the wind facility. The costs and other impacts of strengthening these wires can, for some sites, be prohibitive.
An active issue in the New England electric system is to determine what portion of these upgrading costs should be shouldered by the developer and what portion should be allocated to all electric users in the region.

Vermont’s Energy Future 2�
Figure L: wind speed Map of New England with Electric transmission lines

2� Vermont’s Energy Future
Local Area Wind
These wind facilities involve one or several large modern turbines installed close to where the power is needed. Capital is provided through local investors, banks, or municipal utilities. The electrical output can be supplied as bulk power to the regional grid or can be used on local power systems.
The cost of energy produced by these facilities is higher than utility scale wind because fixed costs are spread among fewer turbines and there are often lower quality wind regimes.
However, municipal electric utilities sometimes have access to low cost tax exempt financing and/or some ability to sell the output at retail prices to offset this cost disadvantage. Presently, there are no such installations in Vermont.
Examples are the town of Hull, Massachusetts (Figure N), 8 miles to the southeast of boston, where a 660 kW turbine was installed in 2001 and a 1.8 MW turbine in 2006.
A privately-owned example is provided by the summer 2007 installation of a 1.5 MW wind turbine at Jiminy Peak Mountain Resort in the berkshires of western Massachusetts (Figure o).
Local area wind development may be constrained in the future due to lack of technical knowledge of the resources, siting, and competition for wind turbines and constructors. There is currently a world-wide shortage of wind turbines, especially for small projects.
Electricity from these large projects is usually sold at wholesale prices, under long-term contracts to electric utility companies, or on regional electricity spot markets. The cost of electricity from these large wind facilities is lower than for smaller local area projects or residential scale projects.
Quantity pricing results in lower turbine prices, and a facility’s fixed costs, such as interconnection, permitting, and operation and maintenance, can be spread over many more units of output. These large wind projects require careful siting, especially considering their higher elevations, to mitigate environmental and aesthetic impacts.
Vermont is unique in that its electric utility companies remain vertically integrated businesses. Utility companies, private entities, municipalities, and cooperatives can all invest in generation plants in Vermont. It is possible for Vermont utilities to participate directly in large wind plants by agreeing to finance a portion of the cost of the facility in return for a similar portion of the output of the facility or other returns.
For wind to reach it full potential in Vermont, the price of the electricity produced must be competitive. Like other sources of generation, the contract or spot market prices paid for wind are not related to the amount spent, but rather to prevailing wholesale market conditions on the New England electric system.
Prevailing policy in Vermont has been focused on obtaining stable-priced contracts to take full advantage of wind power not being subject to fuel price fluctuations.

Vermont’s Energy Future 2�
For example, it would take as many as 1,400 residential scale turbines in Chittenden County to produce the same amount of power as one large wind turbine on a windy ridge.
These installations are usually financed by the homeowners or small business that use the power themselves. Over the last three years, there have been over 70 Homeowner Scale wind turbines installed across Vermont at farms, homes, and schools.
Many of these have received substantial federal subsidies provided through state agencies. However, because they can offset retail electric prices, which are about twice as high as wholesale prices, some can enjoy economic practicality in the best circumstances.
Residential Scale Installations
This scale of development involves small wind turbines, 25-100 kilowatts in size, to meet the needs of an individual home or small business owner or small groups of homes and businesses.
Existing Vermont electric regulations usually permit net billing where small projects sell excess electricity back to the utility company at retail prices (roll the meter backwards).
The cost of energy from this scale of wind turbine is the highest of the three categories (they are over twice as expensive per kilowatt to purchase as large wind turbines and the electrical output is significantly lower per dollar invested because they are generally installed in less windy areas).
Figure M: simulation of a large wind Project from along interstate �1 in Sheffield, Vermont in the Northern Part of the State.

30 Vermont’s Energy Future
Figure N: �00 Kw turbine developed, Financed, and installed by the hull Municipal light Plant in 2001 on the Coastline beside its Elementary school.
Figure O: 1.� Mw wind turbine installed at the Jiminy Peak resort in western Massachusetts in July 200� to help Provide the resort’s Electric usage.

Vermont’s Energy Future 31
Advantages
No emissions; no greenhouse gas; renewable sourceFuel is freeEconomic benefits from installation jobsDistributed generationSolar power works best on hot summer days and cold clear winter days when electricity prices are the highest
Disadvantages
Solar generation is comparatively expensive and only cost competitive for remote locations (off grid) or specialized applications (offset the cost of running a line)All the costs are front-loaded, requiring a multiple year payback
Solar energy as a technology and as an option for generating electricity in Vermont is still evolving. In the comparative charts, solar options have some of the highest prices. Most of the costs are equipment-based, since the fuel is essentially free.
Solar energy will likely generate only a portion of Vermont’s electricity, in the 1% or below range, over the next 5-10 years.
Most of the solar activity is in the area of displacing electricity used to heat water. About 37% of the water in Vermont is still heated with electricity.
•
••••
•
•
SOLAR
Brief
Solar energy can be captured by using photovoltaics (PVs) and thermal collectors. PVs convert sunlight into electricity and have many applications. Thermal collectors are used to heat water or air for domestic or commercial use.
As this report focuses on electricity, we will focus our description on PVs. PVs produce electricity any time the sun is shining, but more electricity is produced when the light is more intense and is striking the PV modules directly.
Solar electricity is the most expensive generation technology under consideration in Vermont. because of the expense, it is currently cost competitive only for specialized and remote applications when compared with large scale options. but photovoltaics are coming down in price as technology and markets advance. (by contrast, using the sun to heat water is already cost competitive.)
Most of the cost for solar systems is upfront (fuel is free) and the systems often need incentives and/or net metering to make the economics more attractive.
The near-term potential to supply electricity for Vermont is enormous. Enough sun hits the average house roof in Vermont to supply 10 times the electricity used by the average homeowner. Current practical limitations, however, will likely keep the contribution of solar power to small levels (estimates are in the range of under 5%). Technological advances and policy driven incentives could change that potential.

32 Vermont’s Energy Future
installations in Vermont, including NRG Systems and groSolar, but this is not a large sector of use currently.
Vermont provides incentives for solar installations. the Vermont solar and small wind incentive Program was established in 2003. Under the program, individuals and businesses can receive $1.75 per watt for approved solar PV projects, with a maximum of $8,750 or 5 kW. the Clean Energy development Fund has provided support for larger projects.
While some solar systems are cost-effective over the long run, about 95% of their lifecycle cost is up front, making them difficult to afford for many people.
For example, residential solar water heaters, with or without current Vermont incentives, are less expensive than electric or propane water heaters over their 25-year lifetime ($13,500 for solar with incentives on a typical residential system, compared to about $21,000 or more for electric or propane).
but the up-front capital cost is considerably higher (about $6,250 for a solar system with incentives and propane backup, compared to $750 for a propane or electric system).
Some states such as New Jersey have decided to dramatically encourage solar systems and have created special solar RECs.
Some have decided to target the flat roofs typical of commercial or industrial buildings and are working with chain stores owned by companies looking to make a difference in climate change.
In the cost comparison chart in Appendix C, we look at solar for a commercial installation (50 KW to 1 MW). Similar to small wind power systems and small hydro power systems, solar potential in Vermont in the near term will not likely provide bulk electricity supplies to the regional electric grid, but rather provide for part or all of a residence’s or small business’s electricity needs.
Photovoltaics (PVs) convert sunlight into electricity and have many applications. PVs produce electricity any time the sun is shining, but more electricity is produced when the light is more intense and is striking the PV modules directly. Unlike solar thermal systems, PVs do not use the sun’s heat to make energy, but instead produce electricity directly from the electrons freed by the interaction of photons of sunlight with semiconductor materials in the PV cells.
When domestic PV systems are installed on homes that are independent of the utility grid (called off-grid), they use battery banks to provide power when the sun is not out; domestic PV systems on homes or businesses connected to the grid can use electricity from the utility when the sun is not shining. The market has largely shifted from remote, off-grid, and consumer products to a majority of grid-connected, distributed power.
Vermont had 240 net-metered solar PV systems, providing 673 kW of capacity, as of March 2007. It is estimated that Vermonters have installed about 300 PV systems not connected to the electricity grid.
In addition, there are an estimated 500 solar water heater systems in the state. There are a few commercial facilities with solar

Vermont’s Energy Future 33
Disadvantages
Combustion is still required so there are environmental impactsSystems are smallUpfront costs may require incentives or ways to spread out cost recovery and payback
Vermont has several Combined Heat and Power (CHP) applications operating in the state. The Department of Public Service estimates approximately 21 megawatts of CHP capacity is installed in Vermont.
The definition of CHP is the sequential or simultaneous generation of multiple forms of useful energy, usually in the form of electric and thermal. Another name for CHP is co-generation. Normally, for CHP to be a viable option, it requires a host site that has the need for both electrical and thermal energy concurrently, which typically is an industrial site or large commercial building.
CHP is a specific form of distributed generation (DG); DG refers to locating electrical generating units in or near a facility to supply or augment the onsite electrical needs of the facility. DG offers the host site many advantages, such as energy security, improved energy reliability, and cost savings.
but CHP goes a step further than DG by giving the host site the simultaneous production of electric power and useful thermal output which greatly increases overall system efficiency (see Figure P).
•
••
COMBINED HEAT AND POWER (CHP) SYSTEMS
Brief
Combined heat and power systems (also known as co-generation) are a growing source of electric generation in Vermont with the added benefit of offsetting other energy needed for heating buildings. A CHP system is one where the waste heat from a combustion-type generator is used to provide space heat or process heat for a building.
An example of this system would be an internal combustion engine where the heat from the radiator provides space heat to a building or steam in industrial applications. The advantage of CHP is greater efficiency than if the electric generation and heating were done separately. Vermont is estimated to have 21 MW of electric generation from CHP with more growth potential, depending on the site. Advantages
Greater efficiency means lower fuel use, fewer emissions and less greenhouse gasesVermont-based resourceCan create local jobs and economic benefitsDistributed generation; can benefit transmission systemCan use biomass from Vermont’s woods and farms
•
••
•
•

34 Vermont’s Energy Future
powers a generator to produce electricity, and the waste heat from the engine is recovered through a heat exchanger to produce useful thermal energy.
This thermal energy output can be in the form of steam or hot water and can be used for a host of different applications depending on the needs of the site, such as heating, domestic hot water, laundries, or process use like drying. The thermal energy can also be used for cooling needs by using a absorption chiller.
In a electric generator set up using a fossil fueled boiler and a steam turbine, the efficiency would be approximately 30-35% just to generate the electric power.
If none of the waste heat is captured, that means that 65-70% is wasted. But in a CHP set up, this waste heat is captured and turned into useful thermal output, which can double the efficiency of the process.
The advantages of the CHP systems over a traditional set up of electric energy received from the utility and on site thermal systems are greater efficiencies and potential cost savings.
CHP technology could benefit any customer that has the requirement of both electrical and thermal loads, such as schools, hospitals, apartment buildings, commercial buildings, universities, industrial buildings, health clubs, laundries, nursing homes, etc.
A typical CHP system will include three major components: the prime mover, the electric generator, and the heat recovery system. The prime movers for CHP systems can be gas turbines, micro turbines, steam turbines, reciprocating engines, and fuel cells.
The CHP system can be designed to use a variety of fuels, such as natural gas, propane, fuel oil, and biomass. An example of a typical CHP system may consist of a reciprocating engine running on natural gas. The engine
Figure P: Efficiency of Conventional vs. Combined Heat and Power Generation

Vermont’s Energy Future 3�
The brattleboro Kiln Dry company system was installed in 1989. The system uses boilers fired by wood waste from the site. The steam from the boilers powers a steam turbine generator rated at 380 KW, and waste heat from the turbine is used in their kiln drying process.
Green Mountain Coffee Roasters installed a 280 KW CHP system in 2003. The CHP system uses a Waukesha engine running on propane. The heat recovered from the engine is used for heat and hot water for their building.
The CHP system at North Country Hospital was installed in 2005. The CHP system consists of a wood chip fired boiler and a 274 KW steam turbine generator. Waste heat from the steam turbine serves a variety of the hospital’s heating needs.
The benefits of this improved efficiency is that the host site saves money, conserves fuel, and has less air-polluting emissions.
In 2000, The Department of Energy completed a study to estimate the market and technical potential for CHP systems in the United States. This study estimated a technical potential of 179 megawatts of CHP capacity in Vermont.
It is important to note that this number is technical potential, meaning that there is enough industrial and commercial sites to support 179 megawatts of capacity. This does not mean 179 megawatts of CHP capacity could be installed that is cost effective and economically viable for the host site.
The economics of the CHP systems revolve around cost of the fuel and price of the electricity which is being displaced and avoided, operating and maintenance costs, and any financing costs that where required to purchase and construct the system.
The host site must weigh the costs and benefits of a CHP system versus a more traditional set up before deciding to move forward on a CHP project. The host site would normally only install a CHP system if it was economical to do so. In addition, large upfront capital costs have also been a barrier to CHP project development.
Some sites that have CHP systems installed in Vermont are the brattleboro Kiln Dry Company, Green Mountain Coffer Roasters, and North Country Hospital.


Vermont’s Energy Future 3�
Advantages
Significantly lower cost than other resource options Lowers everyone’s power costs by displacing the most expensive resource at any given timeLarge quantity of both energy (kwh) and capacity (kw) available from energy efficiency in VermontImproved electric sector reliabilityCan defer or avoid costs to upgrade electric transmission and distribution systemCan be deployed or scaled back relatively quicklyNo significant greenhouse gas emissions or other pollutantsJob creation and local economic development impactsImproves the value, public health, and comfort of Vermont’s homes and buildings.Reduces our dependence upon foreign energy sourcesReduces natural gas price volatility
Disadvantages
Requires coordination among many to be most effectiveCan initially raise rates and bills for non-participants if costs are not spread over the period of benefitsThe effects of efficiency on overall energy use can be difficult to quantifyRequires an infrastructure of knowledgeable and skilled efficiency service and product providers
•
•
•
••
•
•
•
•
•
•
•
•
•
•
Brief
Energy efficiency can be considered as a resource option comparable to traditional generation resources like coal, nuclear, natural gas, and renewables. It is relatively inexpensive and clean compared to generation options.
It also is considered an alternative resource in transmission and distribution (T&D) planning. In the past decade, utility ratepayer investments in energy efficiency resources have reduced overall electric consumption in New England by about 3-5% and in Vermont by over 5%.
Since 2000, energy efficiency services have been provided in Vermont by the nation’s first energy efficiency utility1. A 2006 study done for the Department of Public Service concluded that nearly 15% of Vermont’s electricity needs in 2015 can be met through cost-effective efficiency programs (it would be 20% if fuel switching occurs).
Advocates say efficiency should be the first choice for meeting Vermont’s electricity needs due to its low cost and associated environmental and economic development benefits. There is little opposition to efficiency as a concept.
However, some are concerned about increased rates and costs on near-term bills (especially for non-participants) and ensuring the accountability and cost-effectiveness of the delivery mechanisms.
�Efficiency Vermont (“EVT”) provides energy efficiency services statewide, with the exception that the Burlington Electric Department (“BED”) provides these services in its service territory. Both EVT and BED are part of the Energy Efficiency Utility (“EEU”) structure that is currently funded through the Energy Efficiency Charge (“EEC”).
Appendix A: Full Resource Option DescriptionsPart iii— ENErGY EFFiCiENCY aNd dEMaNd rEduCtioN

3� Vermont’s Energy Future
Energy efficiency programs are primarily paid for by customers through their electric rates or as a surcharge on their electric bills. Vermont is a national leader in the development and delivery of efficiency programs for residential, commercial, and industrial electricity customers.
Efficiency efforts in Vermont began with programs run by Vermont’s electric utilities in the 1980s and 90s and were continued by Efficiency Vermont, the nation’s first energy efficiency utility, and the Burlington Electric Department (bED).
Electricity Savings To-Date
Over the last decade in Vermont, savings from efficiency programs and investments have helped to reduce the growth rate of electricity requirements. Efficiency savings along with changing economic conditions have cut the rate of electric demand growth from 2% to 1% (see Figure Q).
Energy efficiency includes: 1. using less energy by making buildings and the energy-using devices in them more efficient (their design, lighting, motors, appliances, etc.) 2. using energy-consuming devices less (conservation) and 3. reducing the peak demand for electricity (through load shifting, self-generation, or interruption).
It may be helpful to think of cars and highways as a way to understand these strategies. Just as certain cars get more miles per gallon, buildings and devices can be made more efficient. Driving less would be an example of conservation, and rush-hour traffic the equivalent of peak demand.
Energy efficiency can be as simple as installing additional insulation in buildings and switching incandescent lights with fluorescents. Or it can be as complex as installing computerized energy management systems in commercial buildings.
Figure Q: Efficiency Savings in Vermont since 1999
0
2,000
4,000
6,000
1999 2000 2001 2002 2003 2004 2005 2006
GW
h

Vermont’s Energy Future 3�
demand could be reduced by nearly 20% by 2015 and 30% by 2028 (Figure s).
Cost and Benefits of Efficiency Investments
In 2004, Vermont electric customers spent around $15 million on efficiency programs to save electricity, leading the nation with an investment of $25 per person. After extensive review of its potential, the Vermont Public Service Board significantly increased the efficiency investment.
by 2008, customer expenditures on energy efficiency should be approximately $30 million per year, or approximately $49 per person.
The board largely targeted this increased funding toward geographically constrained areas of the state in an effort to avoid or defer costly investments in transmission facilities.
Vermont businesses and homeowners who worked with Efficiency Vermont from 2000-2006 to make cost-effective efficiency investments saved almost 315 million kilowatt hours (kWh) in annual electric energy (approximately 5% of total sales).
Households and businesses are expected to see savings continue for at least a decade—the average life of the efficiency measures.
The effect of investing in energy efficiency is cumulative and, over the years, can contribute significantly to offset energy and demand. Comparing efficiency to an electric plant generator, such as burlington Electric’s McNeil Generating Plant, demonstrates the savings each year (Figure r).
Efficiency Savings Potential
Vermont recently completed studies of electric energy efficiency potential and concluded that, with an increase in investment, electricity
Figure R:
Source: Efficiency Vermont, Annual Report, 2004

40 Vermont’s Energy Future
can increase rates in the short run. This is because existing costs are spread over fewer kilowatt hour sales. This can doubly impact non-participants, who do not reduce use and whose rates increase.
Rates can increase in the short term because efficiency costs are paid as they are incurred. In traditional utility investments, like power stations or transmission lines, costs are spread out. One issue under consideration is whether efficiency investments should be funded with a similar, longer-term approach.
Benefits from efficiency include:
Reduces greenhouse gas emissions and local air pollutionComes in small units and can be accelerated or decelerated quickly Can act as an alternative to the costs or visual impacts of transmission systems Creates in-state jobs and economic development opportunitiesImproves the value, public health, and comfort of the state’s homes and buildings Can enhance physical infrastructure and worker productivity (i.e, through better lighting)Provides short and long-term savings to building owners
•
•
•
•
•
•
•
Vermont Electric Efficiency Program Expenditures
Year Amount (in millions)
2000 $92001 $102002 $122003 $142004 $152005 $162006 $162007 $24 (budgeted)2008 $31 (budgeted)
Source: VT DPS (EVT and BED expenditures)
In 2006, investments made by Efficiency Vermont cost approximately 3.5¢ per kWh. This includes money contributed by state ratepayers and additional amounts paid by Efficiency Vermont customers and reflects the savings in water, maintenance, and other costs resulting from measure installation. This combined expenditure reduces Vermont’s annual need for electricity generation by 52,950 MWh and 7.8 MW at summer peak demand and 7.2 MW at winter peak demand.
One challenge related to utility-funded energy efficiency programs is that, although they reduce average electricity bills, they
Figure S: Achievable Cost Effective Electric Energy Efficiency Potential by 201� in Vermont

Vermont’s Energy Future 41
These schemes generally include some form of advanced metering that can register not only how much electricity is consumed, but when it is consumed.
Dynamic pricing schemes could be simple, such as charging residential customers a higher price from noon to 6 p.m. every day, with prices set annually or by season.
Or they could be more complex, with customers having a real-time price that differs every hour of the year based on the current cost to produce electricity in New England.
There is little opposition to efficiency as a concept. Some are concerned, however, about increased rates and costs on near-term bills (especially for non-participants), and the need to ensure the accountability and cost-effectiveness.
Demand Reduction
Reducing energy use, especially during peak hours, is important, as the costs to generate electricity are highest at those times and the electricity system has the greatest potential for outages.
To the extent that energy efficiency reduces consumption during peak periods, it is an important demand reduction tool.
Demand reduction can also occur by shifting consumption from peak to off-peak periods, such as an industry moving its production schedule from a summer afternoon to the evening, a home using a timer to run its dishwasher in the middle of the night, or businesses running generators during peak periods to reduce the demand on the electricity system.
One method that states are considering to reduce energy use at peak periods is called dynamic pricing. Although there are numerous ways to implement dynamic pricing, customers would pay more for electricity use during peak periods and less during off-peak periods.
Currently, most Vermont customers pay the same price for electricity at every hour. Dynamic pricing is similar to phone plans that charge less for nights and weekends when demand is lower.


Vermont’s Energy Future 43
exactly what your are paying for that power for the duration of the contract.
Market prices could rise to 10 or 15¢ per kilowatt hour, but you would still pay 8¢ until the expiration of the contract. Alternately, market prices can go down. If prices were to fall to 2¢, you would pay more than four times the market price.
For utility investments, price certainty with regard to future costs can also be obtained from utility investment (ownership) of those fuel sources that have no or relatively low fuel costs or fuel costs with little or no correlation to fossil fuel commodities, such as wind, hydro or, to a lesser extent, nuclear power. Most of the costs for these facilities are for the initial permitting and construction.
Utilities would collect these costs from customers over the life of the plant. Future rate changes arising from these investments would be very low, whether future market costs of power declined or rose. Of course, if wholesale market power supply prices declined substantially, then the power produced from these plants could end up being well above market prices.
Cost volatility in gas/oil plants tend to be greater because the price of fuel represents a significantly higher percentage of these plants’ total costs. Fossil fuel prices have, at least on a near-term basis, experienced substantial volatility.
But since any price change would reflect underlying fuel costs, there is much less risk that wholesale market prices would be substantially different from the price of output from these plants.
Appendix b: Cross Cutting Issues
In previous sections of these materials, we looked at specific options for providing electricity in Vermont. To the extent possible, the options were compared side by side based upon a series of attributes such as cost, time to build, footprint, typical size, environmental impact, potential to create jobs, etc.
In this section of the materials, we look at some of the issues that are common to many of the options. In that regard, the issues discussed in this section cut across the spectrum of options.
The Buy versus Build Decision: Power Supply Contracts versus Investments in Power Plants
Vermont utilities are responsible for procuring power resources to meet the electrical needs (including reserves for reliability) of their service territories. Regardless of the fuel source, power supply may be obtained by contracting with the owners of a generation source or by investing in power plants.
The principal differences between contracting and building are: 1. the degree of future price certainty of a power supply and 2. the effect of each option on utility credit ratings and access to capital. There is also concern regarding the ability of a utility to effectively manage ownership of power generation.
Price Certainty and Contracted Power
Price certainty represents the predictability of future power supply costs. For example, if your utility company entered into a long-term contract to buy energy for 8¢ per kilowatt hour for twenty years, you would know

44 Vermont’s Energy Future
economies of scale, smaller scale plants are typically more expensive to construct.
The efficiency (output) of larger plants tends to grow as the size of the plant increases. There may be opportunities for Vermont utilities to obtain a small ownership share of a large scale investment, but only if owners of that facility are seeking investors. Should this opportunity arise, the larger scale investments are likely to be out of state.
Types of Contracts
Power supply contracts can be firm power delivery (meaning it can come from any plant) or unit contingent. unit contingent means that the utility and its customers only pay for the power that is produced by that particular power plant. If something unexpected occurs that takes the plant out of service, customers would be exposed to market prices during the time the plant is not operating.
Market power contracts are not based on a specific source and require all energy purchased to be delivered regardless of the performance of the seller’s plants. Therefore, unit contingent power is less valuable than system power and should be priced lower.
Of course, when a utility invests in a power plant, the power derived from that plant is completely dependent on that plant operating at optimum levels. Plants with more predictable production are therefore worth more than contracts or investments in units with less predictable output.
Term of Contracts
The length of a power contract is important if customers value price certainty above the lost opportunity of riding the market when
Financial Effects of Contracts
Consumers may see little difference in rates whether a utility owns a plant or whether it enters into a twenty year (or longer) fixed price contract. On the other hand, because of the way credit rating agencies view long-term contracts, utilities that invest in a plant will generally enjoy better credit treatment.
Rating agencies sometimes look at long-term power supply contracts as debt obligations—this can potentially increase the cost of borrowing for utilities, who pass that cost to consumers. Additionally, if the utility has a poor credit rating, it may not even be able to obtain long-term power supply contracts.
Termination of Contracts
When a contract ends, other costs and benefits become apparent. For instance, had the utility invested in a plant rather than contracting, it would likely own the site. It could potentially extend the life of the plant or undertake other plant development.
However, ownership would entail its own burdens, such as assuming any liability risks of owning the plant/site, including plant removal at the end of the plant’s life. In a contract, by contrast, there are no such obligations on either party at the conclusion of a contract.
Ability of Vermont Utilities to Develop Investment Opportunities
Opportunities for Vermont utilities to invest in plants are limited due to their size (Vermont utilities are among the smallest utilities in the nation). Therefore, the number of investment opportunities and the nature of those opportunities are likely to be limited. Due to

Vermont’s Energy Future 4�
voiced a preference for Vermont to manage risk by locking in price terms or minimizing correlation with fossil fuels, even if it means paying a more at some times. We will be interested to see if you agree.
In-State versus Out-of-State
A second issue related to the theme of cross cutting has to do with whether a generation resource (either built or purchased under contract) is located in Vermont or out-of-state is of concern to Vermonters.
The issue of in-state versus out-of-state has a different impact on the various resource options. For some resources, the answer is clear cut and based upon previous decisions or the nature of the resource. For example, the Vermont Yankee Plant is already in Vermont and that in-state location has its own advantages and disadvantages.
If a new nuclear plant were built, it would more likely be outside of Vermont. If large-scale hydro were selected as a resource, it would likely come from outside Vermont, most likely from Canada. If the energy efficiency or demand control resources were favored, those resources would likely come from inside Vermont (although it may be possible to contract for energy efficiency or demand response resources from outside the state—it would not be typical).
Coal-based resources would likely come from plants outside Vermont because coal plants tend to come in sizes that surpass the demand in Vermont. In addition, siting coal in Vermont would likely be more difficult than it would in other states. Generalizing across the set of resources, there are several ways to think about the in-state versus out-of-state issue.
energy prices decline. A longer duration contract along with a fixed price obtains price certainty. Shorter-term fixed price contracts would generally result in prices closer to the average market price than would longer-term contracts.
Price Terms of Contracts
Power supply contracts do not always have fixed prices. They can be tied (entirely or in part) to the market price in energy, capacity, or even Renwable Energy Certificates (RECs). They can contain both fixed and variable components. For example, a contract could move with market prices within a certain range, but stay at a predetermined price outside of that range (or vice versa).
Utility investment in plants can have similar features. For example, utilities can buy future gas supplies for a gas plant investment or let the price float with the market.
Summary – Price Certainty
A look at current Vermont power supplies indicates a strong preference for price certainty.
The contract with Hydro-Québec includes price terms that were set at the beginning of the contract and are completely disconnected from fossil fuels. The contract with Entergy Vermont Yankee is also a stable price with no fossil fuel connection. In addition, Vermont utilities obtain a significant amount of power from local hydro and biomass sources that have had stable prices disconnected from fossil fuels.
These outcomes, however, have not come about by chance. Regulators, utilities, and political leaders of prior decades have

4� Vermont’s Energy Future
and power project might be a local university or school district.
Control Over the Resource - Self-Sufficiency
The issue can also be considered in terms of control and self-sufficiency. Many are proud that Vermont does things its own way, and they would like to ensure that the priorities of other states do not interfere with their own. They would argue that the way for Vermont to control its energy supply is to build and retain generation sources within the state. Others would argue, however, that control and self-sufficiency are elusive and that contracts provide security.
Generation Ownership
The question in the third cross cutting issue is whether the type of entity that owns the generation sources matters to Vermonters. The first way to think about the issue is public ownership (state, municipal, or special purpose entity) versus investor-based, private ownership. Some practical and philosophical questions can include:
What type of entity has the management capacity to oversee the project? What type of entity can raise the investment capital at the least expensive rate? What type of entity is better able to assume risk? What types of activities are best handled in the private sector versus the public sector?
Some options, such as local area or residential scale wind, tend to be community-based and work well under public ownership.
•
•
•
•
Economic Impact
If a generation resource or contract has positive economic impacts such as tax revenues or creation of jobs, then one might argue for an in-state location. biomass resources would be a good example, as would nuclear projects, or smaller oil or gas peaking plants. Energy efficiency also adds local economic value.
Environmental Impact
Environmental impacts on Vermont’s air quality, land use, water use, and visuals could be lessened by purchasing electricity generated out of state. However, buying electricity from facilities outside of Vermont will not reduce the impact of emissions, but merely put them in someone else’s back yard. Moreover, the location of generating facilities has no global impact in terms of greenhouse gas emissions. Other Local Impacts
A second way to think about the in-state versus out-of-state issue is to consider local impact. On the negative side, many of the local impacts are environmental. Pollutants, land use, water use, and visual impact are examples.
There can also be positive local impacts. An example might be the positive side effects of extending a natural gas line to fuel a peaking plant. With the natural gas peaking unit as the anchor tenant, natural gas is then available to customers along the way.
A combined heat and power project built in Vermont can have positive local impact in the form of lower rates and overall energy costs. An example of a local combined heat

Vermont’s Energy Future 4�
requires a Certificate of Public Good before it can be constructed. Community concerns about transmission systems can include their route, visual aesthetics, impact on property values, and potential health effects from herbicides and electro-magnetic fields (EMF).
because of these complexities, Vermont has instituted a new least cost transmission planning process. before a new transmission line can be authorized, those involved must evaluate alternatives such as efficiency, demand response programs, or distributed generation that might allow for the deferral or down-sizing of the transmission line.
Distributed versus Centralized Generation Sources
As generation plants have grown larger to achieve economies of scale, the tendency in the U.S. has been to move towards centralized generation. Vermont, however, is an example of a different trend.
Other than the obvious example of Vermont Yankee, much of the generation in Vermont is small-scale, and there are a number of cases of distributed generation built close to the load. These include small hydro and biomass projects.
While centralized generation has certain attributes, such as economies of scale (and therefore relatively lower costs), distributed generation has a different set of advantages.
Those advantages include less impact on the transmission system, more local control, localized economic benefit, and less risk, since each increment of generation is of a smaller size.
Other options are larger than a particular community can handle. Investor-based ownership can have advantages in terms of risk. If a generation plant has problems in a regulated setting, regulators can assign the risk and cost to the shareholders. New technologies, such as coal IGCC, are good examples. If the owners are independent power producers, such as out-of-state entities specializing in generation ownership, assigning risk is even easier—it is assumed by the market.
Impact on Transmission
Impact on the transmission system is a another cross cutting issue impacting the various resource options to a greater or lesser extent. Resources built in remote areas tend to require new transmission.
Large-scale resources tend to require either new transmission, or transmission upgrades. The two existing large-scale contracts, Hydro-Québec and Vermont Yankee, already have transmission systems in place. New large-scale contracts for the import of additional power could require new transmission or additional electric import capacity. Generation resources built near the load, as in distributed generation, often relieve strain on a transmission system.
Efficiency programs and Demand Response programs generally defer the need for additional transmission facilities. Generation built away from load centers, even in modest quantities, may require significant transmission to deliver the power to the grid. Some wind sites have this characteristic.
New transmission raises significant financial and environmental issues and has a negative bias. For these reasons, new transmission

4� Vermont’s Energy Future
provide revenue beyond the spot market sale price, the development of renewable resources in Vermont is stimulated.
The cross cutting issue is that environmental benefits and energy value can be traded separately. So a utility can either use the money from the sale of RECs to lower its costs or claim the environmental benefits of the renewable generation, but not both.
If Vermont were required, through state or federal action, to obtain 20% of its portfolio from renewable sources, it could either: 1. build enough renewable generation to provide that amount or 2. Purchase enough renewable energy certificates to represent 20% of its portfolio.
How Vermonters feel about satisfying renewable requirements with RECs and how they feel about Vermont’s RECs being sold in other states where their value is higher are important considerations. Many feel that in buying renewables, the resource should be within transmission distance.
Others insist that the impact of renewables on the system as a whole is more important–they are satisfied if the renewable power enters the system and less concerned who uses the electrons.
Another issue facing Vermont is what to do with its qualifying facilities (QFs). Qualifying facilities are hydro and wood plants built under previous federal legislation, designed to stimulate more efficient generation.
The contracts expire in the 2012-2015
When a large, centralized resource fails (i.e. an 1100 MW generator or a heavily loaded power line), the impact can be widespread. When a small, decentralized generation resource fails, the impact tends to be limited to the local area and is more quickly and routinely managed.
The centralized versus decentralized issue cuts across the entire spectrum of resources because each of the generation options tends to fall in one of the two groups (e.g. nuclear and coal are used in centralized generation, and solar, wind, CHP and biomass tend to be more decentralized).
Favoring centralized or decentralized can be a factor in the generation source one recommends.
Renewable Energy Certificates (RECs)
Renewable energy certificates (RECs) are a way to influence generation choices by placing a value on the benefits of renewable sources. Since many of the renewable benefits are shared by all, RECs create a market value for those benefits and spread the costs.
The REC program enables societal benefits and the value of energy to be sold separately. For example, the energy output from wind power in Vermont can be sold to the New England grid at the same price as electricity from any other source.
The resulting RECs can be sold separately to entities needing to meet renewable energy portfolio requirements. This includes entities in states where the REC value can be higher, such as Massachusetts. Purchasing a renewable credit is how a utility proves renewable purchases. Since RECs can

Vermont’s Energy Future 4�
timeframe. It is possible that many of these will not survive in a pure power market without the beneficial contracts, which utilize elements similar to RECs. If Vermonters care about the circumstances surrounding these 20 facilities, which total 70 MW, a test could be developed to determine if these projects require RECs to continue.
Summary on Cross Cutting Issues
There are differences as you look down the list of options to meet the need for generation. We have called those attributes or advantages and disadvantages.
There are also multiple ways to implement each of the options—long-term versus short-term, build versus contract, in-state versus out-of-state, etc. These multiple ways to implement are the cross cutting issues in this appendix.


Vermont’s Energy Future �1
Appendix C: Comparative Resource Cost Assumptions
costs shown.Nuclear - These costs would be for a new nuclear unit.solar - This is for a photovoltaic system. They are currently the most expensive option considered but are used in specialized applications where they offset an even higher cost, such as a transmission or distribution line.wind - This is for a utility scale wind project. Small projects are considerably more expensive.
Wood-Circulating Fluidized Bed (CFB) - As with coal (CFb), this is a more advanced form of combustion. It is more expensive but with lower emissions.
wood-stoker - This is more typical wood combustion.
DSM (with non-electric savings) - This option includes both electric savings and collateral savings from associated resources such as water and other fuels, as well as a reduction in costs for operation, maintenance, and replacement.
DSM (without non-electric savings) - This option looks strictly at electricity savings.
hydro - This option shows costs for two sizes of small hydro that might be built in Vermont.
Each of the options is evaluated on a series of cost comparisons. They are:
total Plant investment (without a return to the utility during construction or aFudC) - This cost is measured in
�.
�.
�.
10.
11.
12.
13.
14.
a.
Figure t deals with costs for a new generating plant. The chart uses 2007 as a way to use consistent dollars, but several of the options have long lead times. For example, a coal plant might have a lead time of 5-7 years, and a nuclear plant of 10-15 years. The 2007 costs shown in the table would be subject to inflation in those later years. This cost structure impacts either a generation plant built by a Vermont utility or the cost of a contract for the plant’s output. The types of plants covered are:
Coal-Circulating Fluidized Bed (CFB) - This is a more advanced form of combustion.Coal-Pulverized - This is current technology of most coal plants and is less expensive than CFb.Natural Gas Combustion Turbine (CT) - This is the standard design for gas peaking units. Two sizes are shown—25 MW and 50 MW. both are relatively small.Natural Gas Combustion turbine Combined Cycle (CTCC) - This is a more efficient natural gas generator. It captures waste heat to generate more electricity. It costs more to build but uses less fuel.Fuel Cell - This is an advanced technology that is still in development stages. Most fuel cells use natural gas as a feedstock. They are a good candidate for distributed generation but, as you can see, are the second (to solar) most expensive option.Coal-Integrated Gasification Combined Cycle (IGCC) - This is the new technology being discussed for using coal. The coal is gasified and then put through a combined cycle turbine. These numbers do not include sequestration, which would approximately double the
1.
2.
3.
4.
�.
�.

�2 Vermont’s Energy Future
Fig
ure T
:
Total Plant Investm
entN
o AFU
DC
($/kW
)
Real
Levelizedcapacitycost w
ith A
FUD
C($/M
Wh)
Real
Levelizedenergycost($/M
Wh)
Real
Levelizedall-in cost($/M
Wh)
Real
LevelizedR
EC value
($/MW
h)
Real
Levelizedem
issionscosts,included inall-in($/M
Wh)
Coal (C
FB)2426
35.9540.92
76.870
5.37C
oal (Pulverized)1936
29.5633.35
62.910
5.02C
T (25MW
)662
79.8984.79
164.670
3.38C
T (50MW
)524
65.9284.79
150.710
3.38C
TCC
73010.19
55.3565.55
02.04
Fuel Cell
5820198.08
225.25423.33
01.82
IGC
C2058
35.7831.16
66.940
4.25N
uclear2633
42.2317.81
60.040
0.00Solar
6040296.27
0.00296.27
25.030.00
Wind
205988.83
0.0088.83
25.030.00
Wood (C
FB)2518
37.1547.66
84.8225.03
0.36W
ood (Stoker)2385
37.0853.34
90.4325.03
0.71Energy Efficiency (w
/ non-electric savings)32.00
00.00
Energy Efficiency (w/o non-electric savings)
35.000
0.00H
ydro 2 MW
250063.79
19.0082.79
25.030.00
Hydro 500 kW
4000102.06
19.00121.06
25.030.00
Coal Sequestered
287942.96
39.2582.21
0.00
Summ
ary results for a plant that would com
e on line in 2007R
eal levelized 2007 dollars
A new
nuclear plant has not been proposed or built in the US
in 15 years. The ability of a utility or developer
to finance such a large project and to cost effectively manage the construction of a plant w
ould be a challenge. b
ecause of this, the nuclear cost estimate is subject to additional uncertainty.

Vermont’s Energy Future �3
dollars per kW. The figure shown is what it costs to build a kW of generating capacity for each option.Real Levelized Capacity Cost with aFudC - This column looks at what it costs per MWh and assumes the utility is allowed to earn a return on its investment during construction. This way of viewing the cost allows contracts for power and building plants to be compared. These are the costs to construct or capacity costs.Real Levelized Energy Costs - These are the costs per MWh to operate the plant—most are either fuel or operations and maintenance.Real Levelized All-In Cost - This is combined dollars per MWh to build and operate or cost for both capacity and energy.Real Levelized REC Value - This is the estimated value for renewable energy credits.Real Levelized Emissions Costs (included in all-in costs) - This column shows the cost for emission allowances that were included in the all-in column.
b.
C.
d.
E.
F.