Embed Size (px)
Citation preview
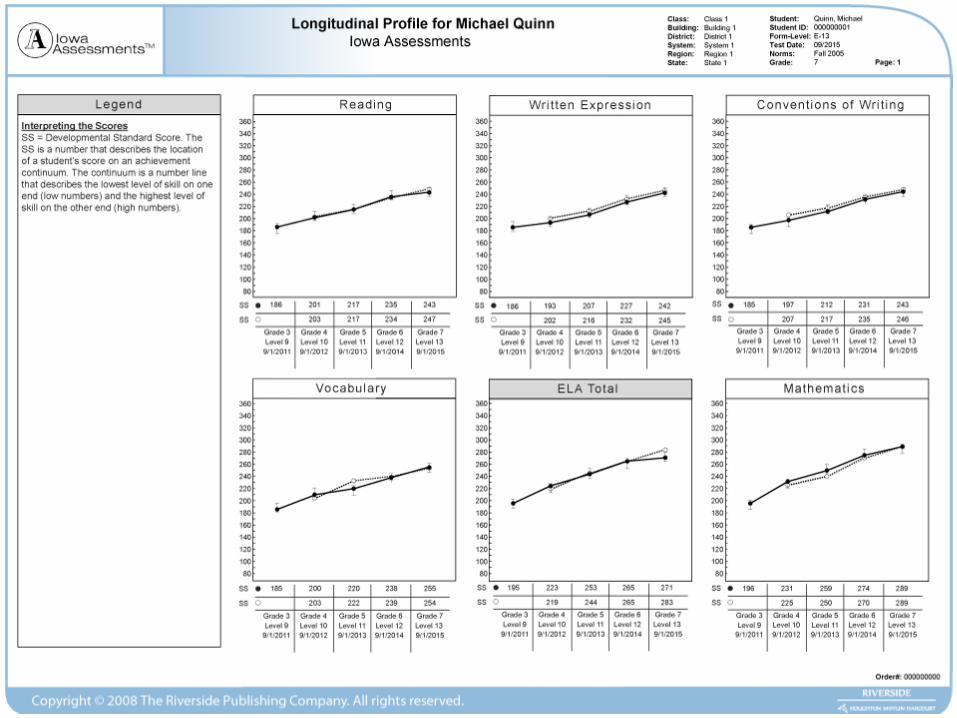
Vertical Scales and the Assessment of Growth
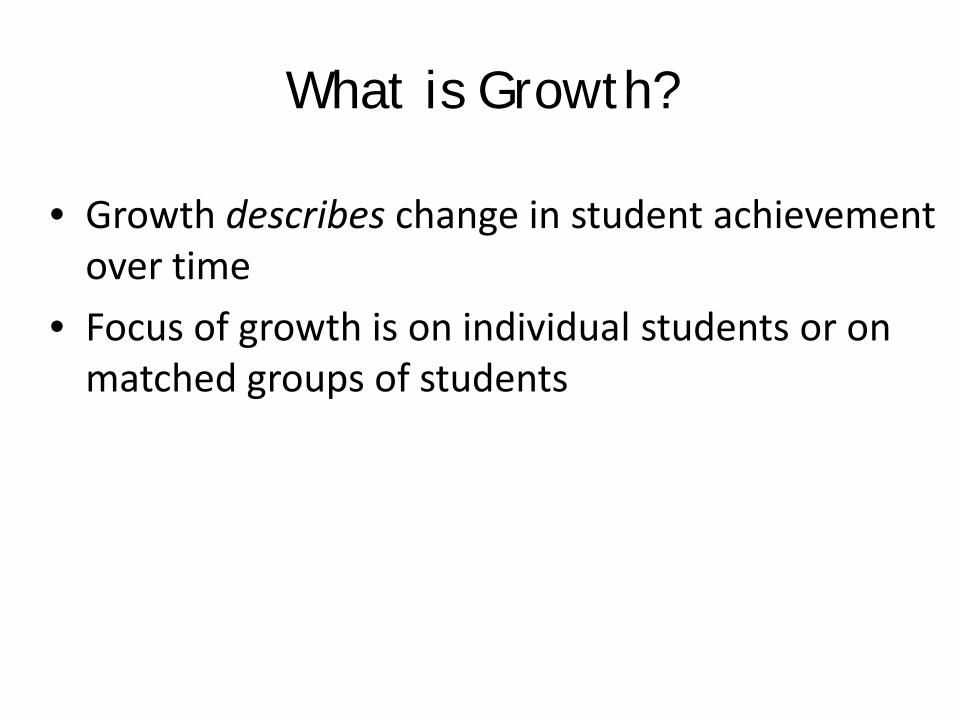
What is Growth?
• Growth describes change in student achievement over time
• Focus of growth is on individual students or on matched groups of students
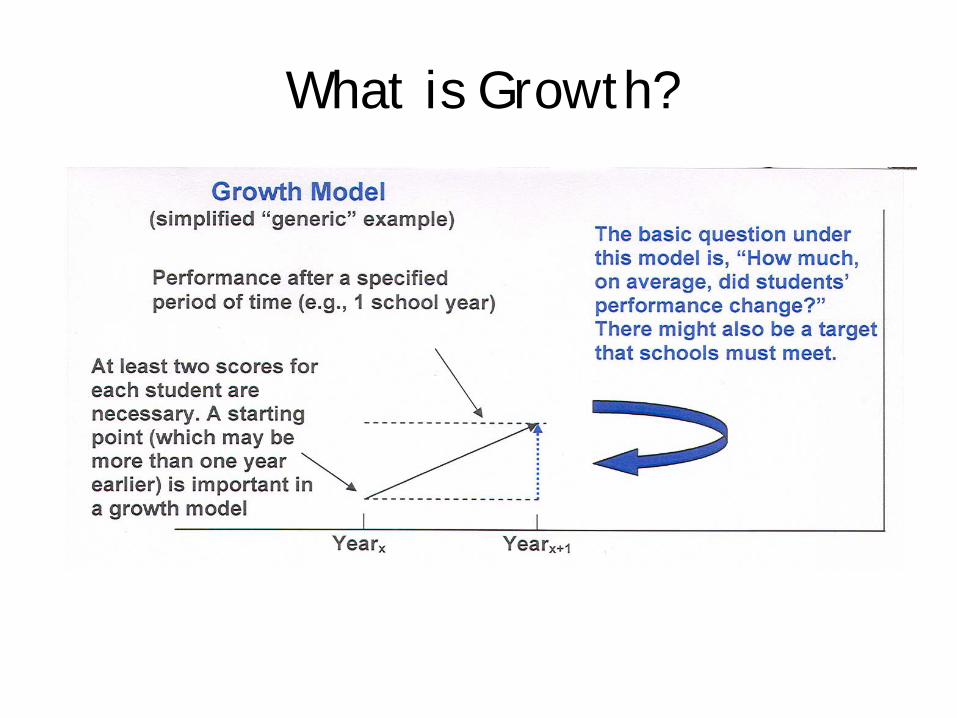
What is Growth?
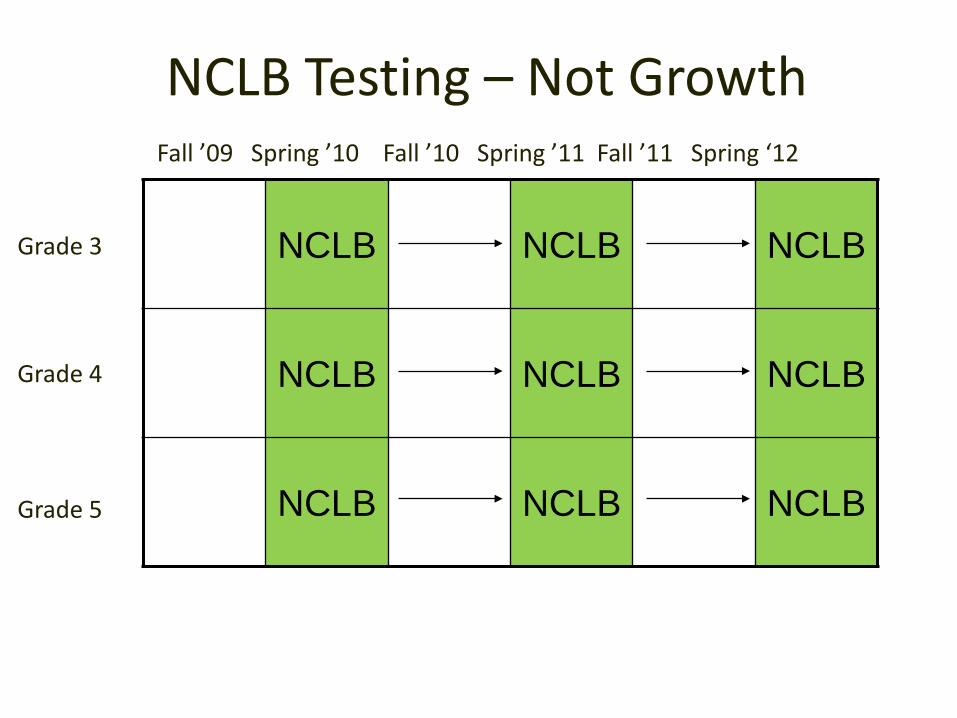
NCLB Testing – Not Growth
NCLB NCLB NCLB
NCLB NCLB NCLB
NCLB NCLB NCLB
Fall ’09 Spring ’10 Fall ’10 Spring ’11 Fall ’11 Spring ‘12
Grade 3
Grade 4
Grade 5
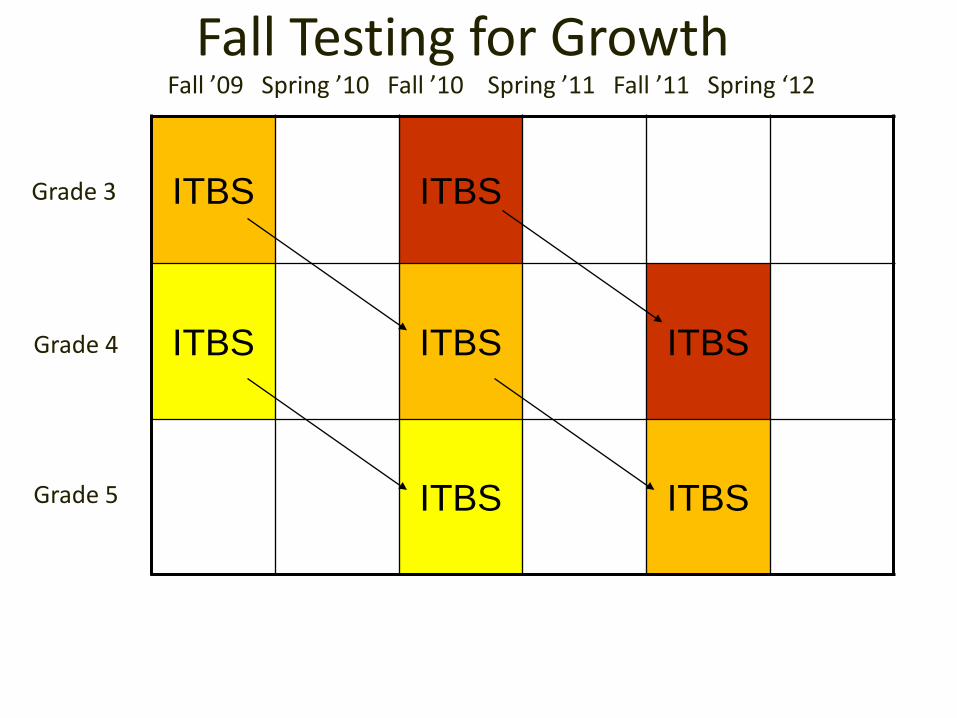
Fall Testing for Growth
ITBS ITBS
ITBS ITBS ITBS
ITBS ITBS
Fall ’09 Spring ’10 Fall ’10 Spring ’11 Fall ’11 Spring ‘12
Grade 3
Grade 4
Grade 5
Measuring Growth
• Determining expected growthfor all students
• Setting goals basedon any starting place
• Measuring student growth using vertically articulatedstandards
Why is Growth Important?
• Individuals learn at different rates• Learning is continuous• Focus on growth avoids arbitrary labels• Puts focus on setting long-term goals• Understanding progress towards college- and
career-readiness
What is required of an assessment to measure growth?
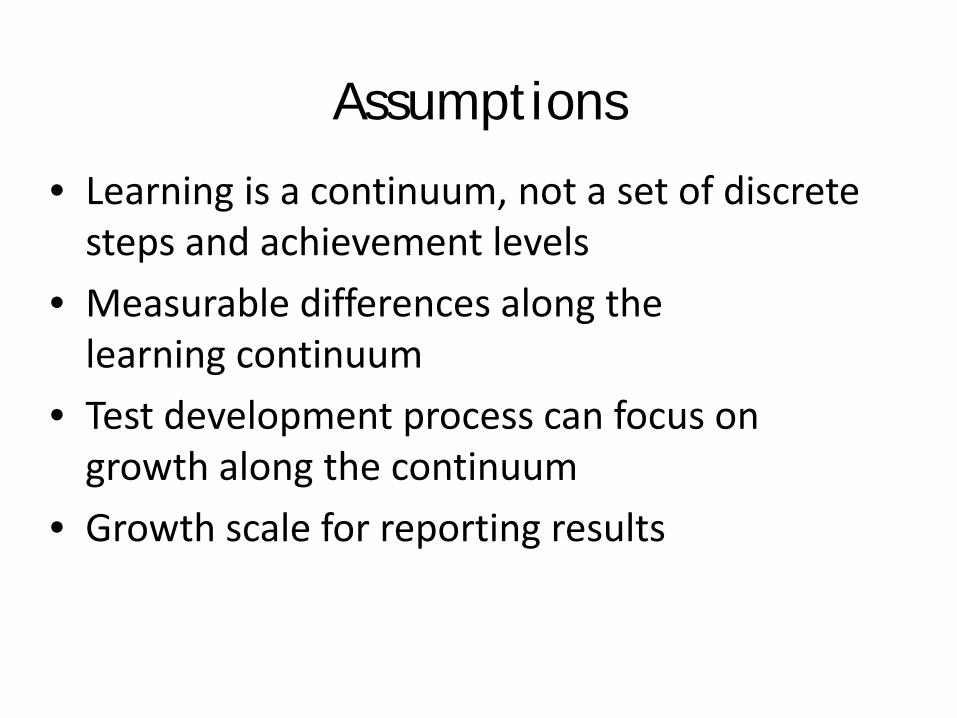
Assumptions
• Learning is a continuum, not a set of discrete steps and achievement levels
• Measurable differences along the learning continuum
• Test development process can focus on growth along the continuum
• Growth scale for reporting results
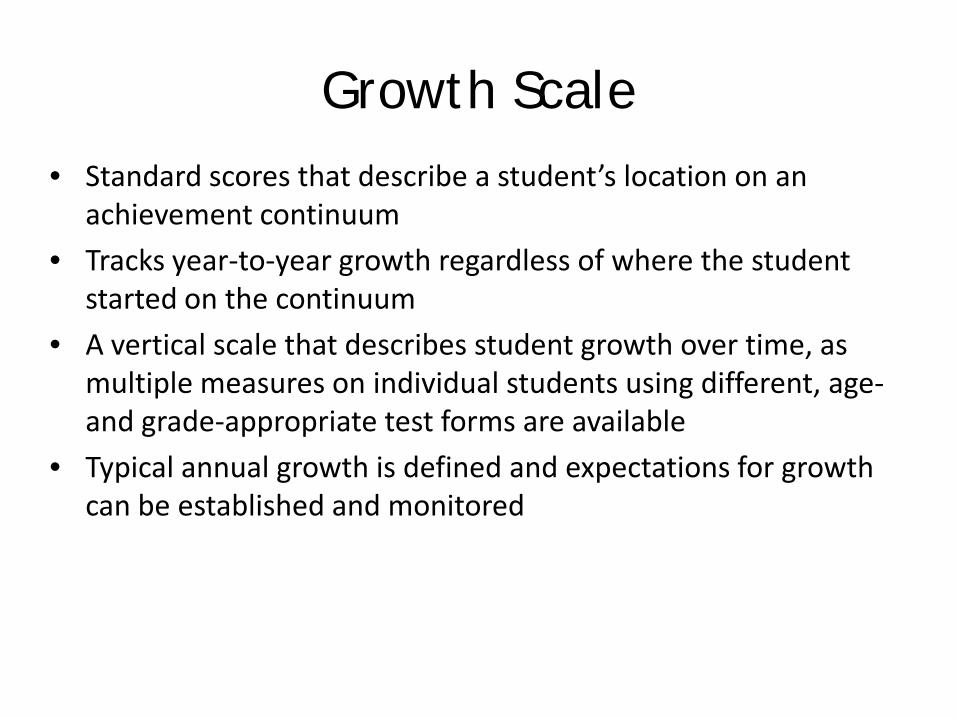
Growth Scale• Standard scores that describe a student’s location on an
achievement continuum • Tracks year-to-year growth regardless of where the student
started on the continuum • A vertical scale that describes student growth over time, as
multiple measures on individual students using different, age-and grade-appropriate test forms are available
• Typical annual growth is defined and expectations for growth can be established and monitored
130
180
230
280
330
2 3 4 5 6 7 8 9 10 11
Vert
ical
Sc
ale
Sco
re
Grade
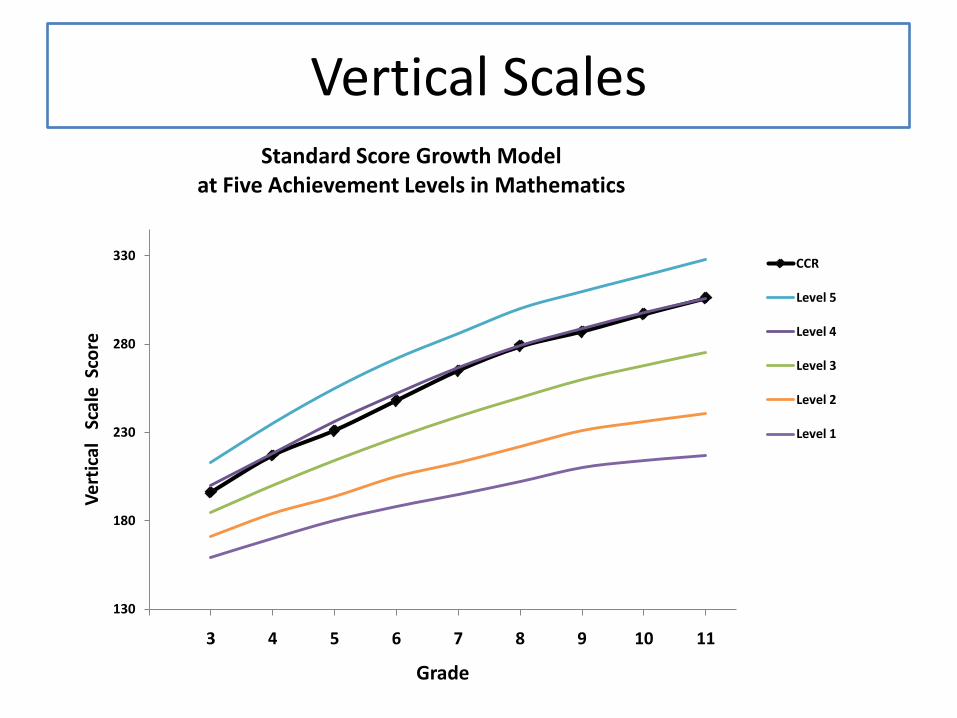
Standard Score Growth Model at Five Achievement Levels in Mathematics
CCR
Level 5
Level 4
Level 3
Level 2
Level 1
Vertical Scales
How can information on growth be used to help students and teachers?
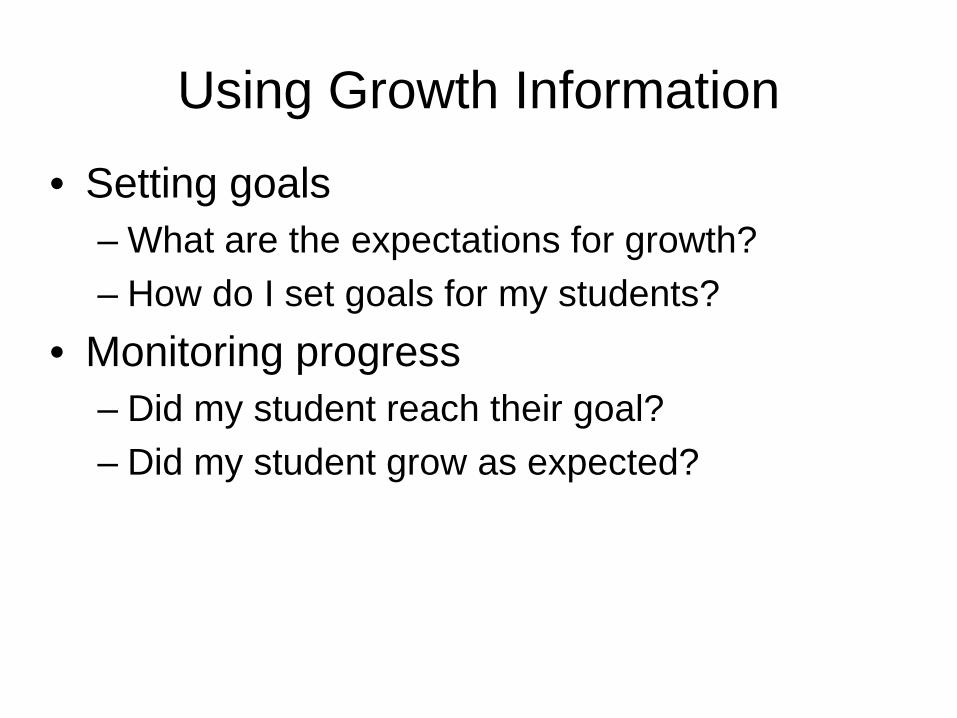
Using Growth Information
• Setting goals– What are the expectations for growth?– How do I set goals for my students?
• Monitoring progress– Did my student reach their goal?– Did my student grow as expected?
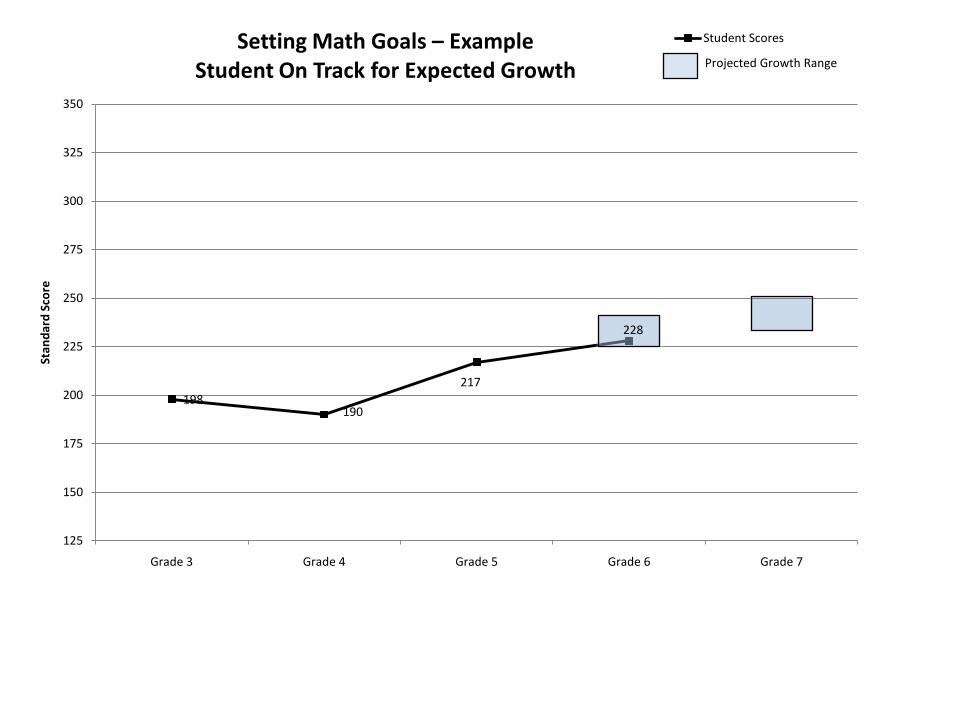
198190
217
228
125
150
175
200
225
250
275
300
325
350
Grade 3 Grade 4 Grade 5 Grade 6 Grade 7
Stan
dard
Sco
reSetting Math Goals – Example
Student On Track for Expected GrowthStudent Scores
Projected Growth Range
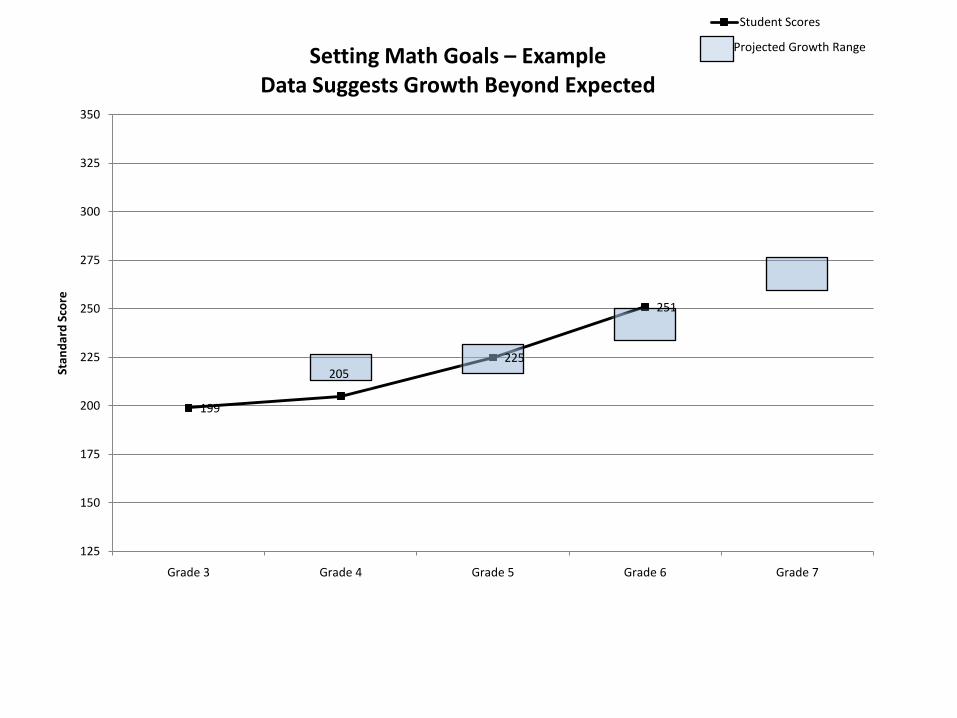
199
205225
251
125
150
175
200
225
250
275
300
325
350
Grade 3 Grade 4 Grade 5 Grade 6 Grade 7
Stan
dard
Sco
reSetting Math Goals – Example
Data Suggests Growth Beyond Expected
Student Scores
Projected Growth Range
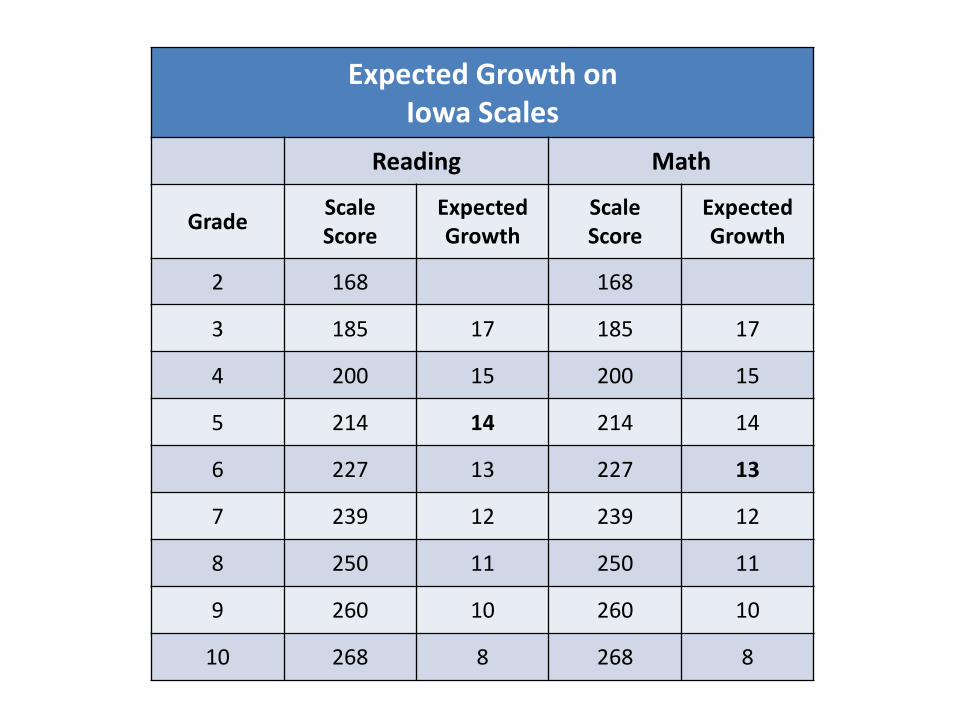
Expected Growth onIowa Scales
Reading Math
Grade ScaleScore
ExpectedGrowth
ScaleScore
ExpectedGrowth
2 168 168
3 185 17 185 17
4 200 15 200 15
5 214 14 214 14
6 227 13 227 13
7 239 12 239 12
8 250 11 250 11
9 260 10 260 10
10 268 8 268 8
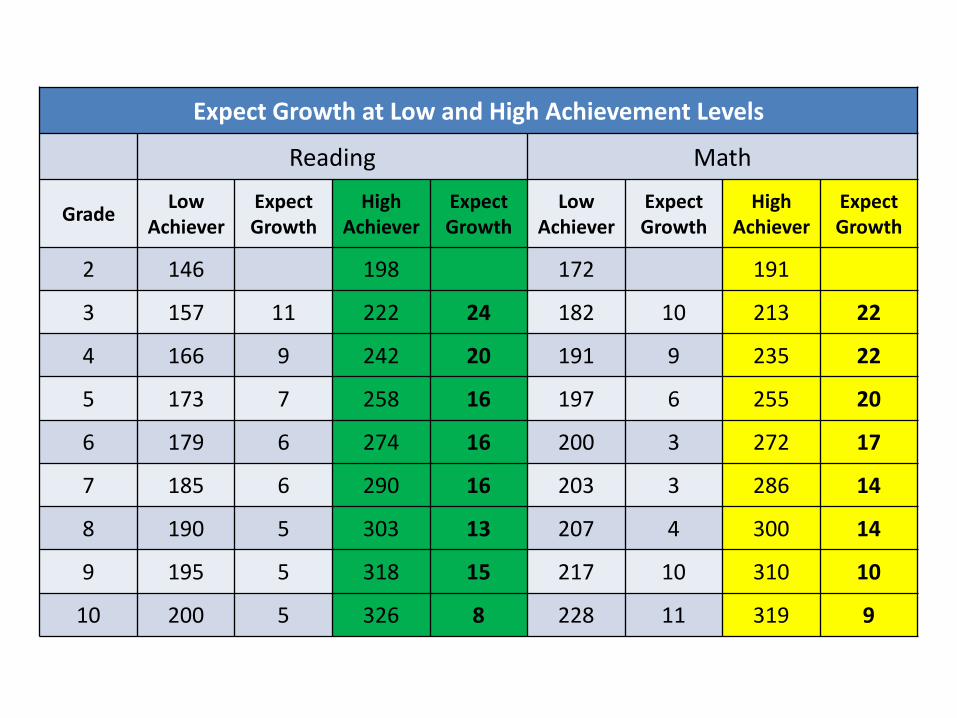
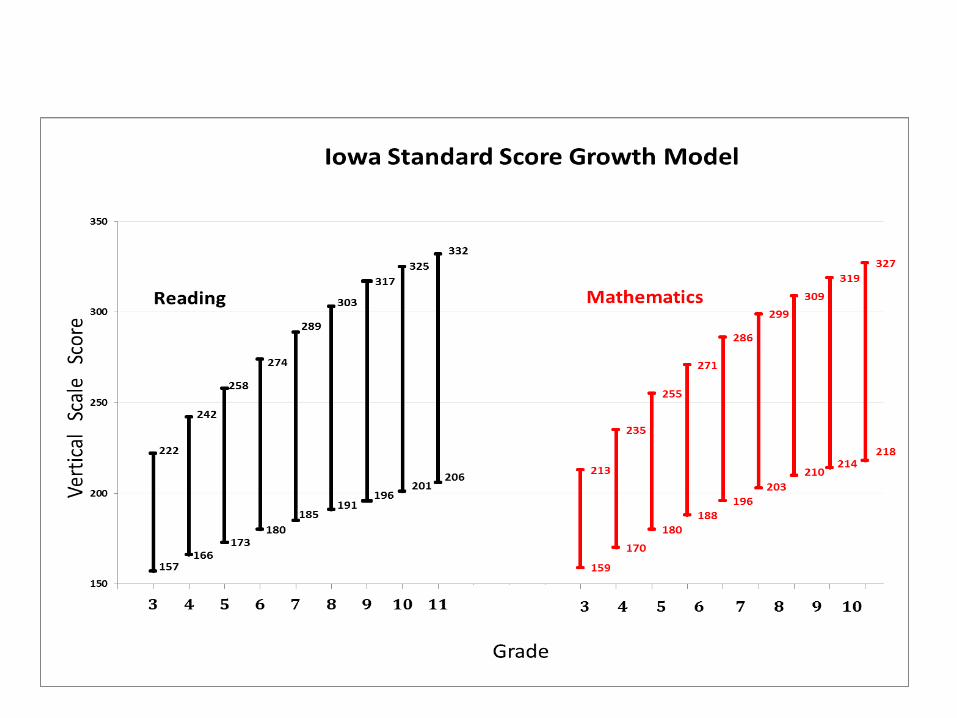
Expect Growth at Low and High Achievement Levels
Reading Math
Grade LowAchiever
ExpectGrowth
HighAchiever
ExpectGrowth
LowAchiever
ExpectGrowth
HighAchiever
ExpectGrowth
2 146 198 172 191
3 157 11 222 24 182 10 213 22
4 166 9 242 20 191 9 235 22
5 173 7 258 16 197 6 255 20
6 179 6 274 16 200 3 272 17
7 185 6 290 16 203 3 286 14
8 190 5 303 13 207 4 300 14
9 195 5 318 15 217 10 310 10
10 200 5 326 8 228 11 319 9
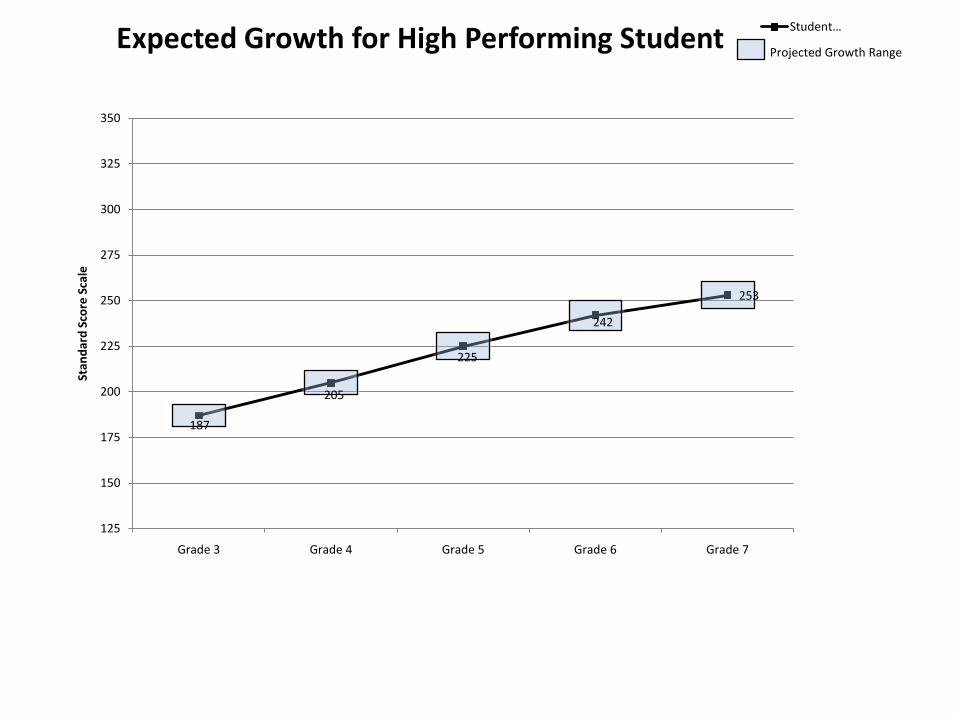
187
205
225
242
253
125
150
175
200
225
250
275
300
325
350
Grade 3 Grade 4 Grade 5 Grade 6 Grade 7
Stan
dard
Sco
re S
cale
Expected Growth for High Performing Student Student …
Projected Growth Range
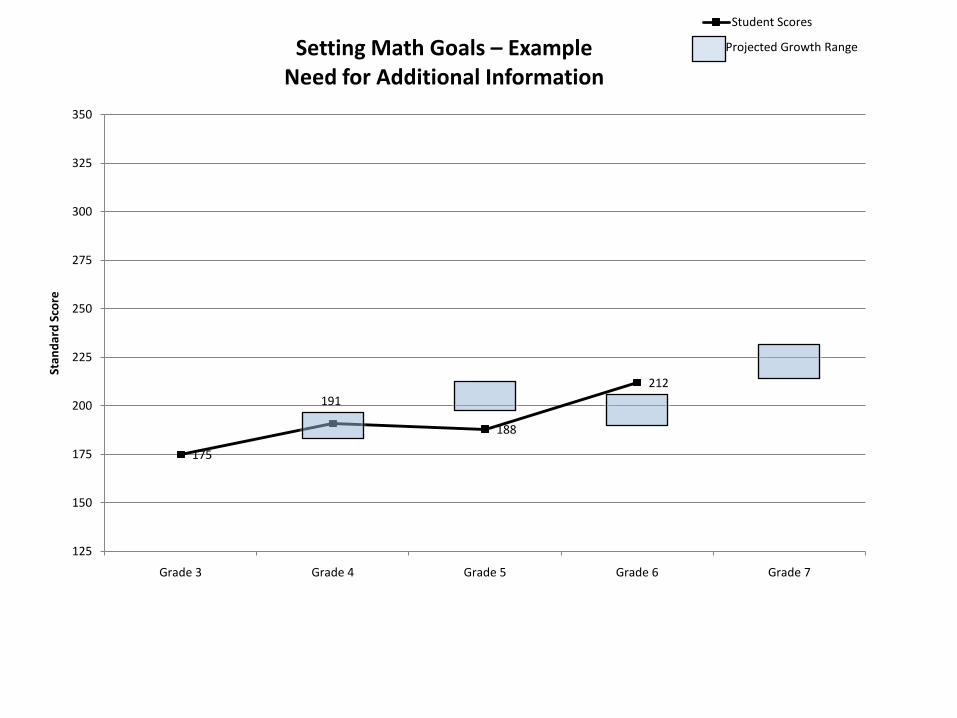
175
191
188
212
125
150
175
200
225
250
275
300
325
350
Grade 3 Grade 4 Grade 5 Grade 6 Grade 7
Stan
dard
Sco
reSetting Math Goals – Example
Need for Additional Information
Student Scores
Projected Growth Range
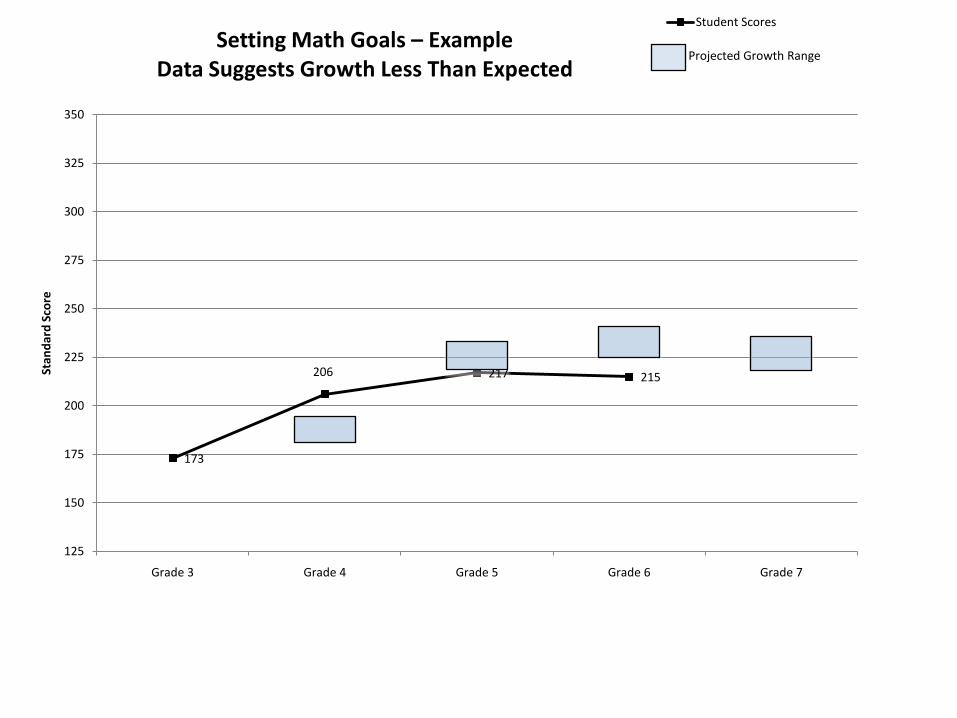
173
206 217 215
125
150
175
200
225
250
275
300
325
350
Grade 3 Grade 4 Grade 5 Grade 6 Grade 7
Stan
dard
Sco
reSetting Math Goals – Example
Data Suggests Growth Less Than Expected
Student Scores
Projected Growth Range
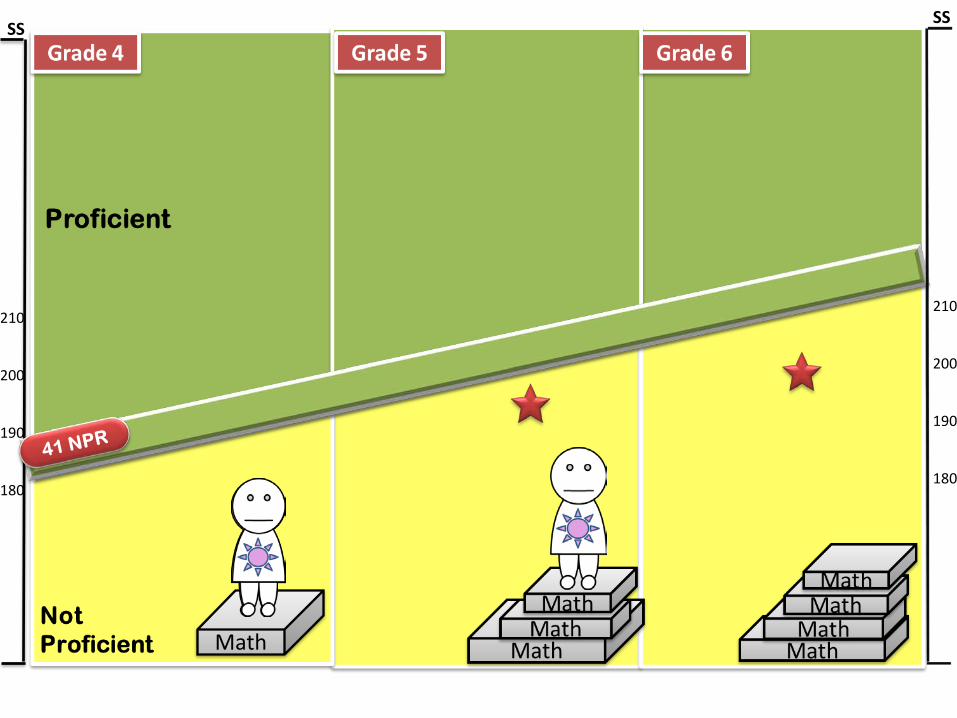
SS
210
200
190
180
SS
210
200
190
180
SS
210
200
190
180
SS
210
200
190
180
SS
210
200
190
180
SS
210
200
190
180
Math
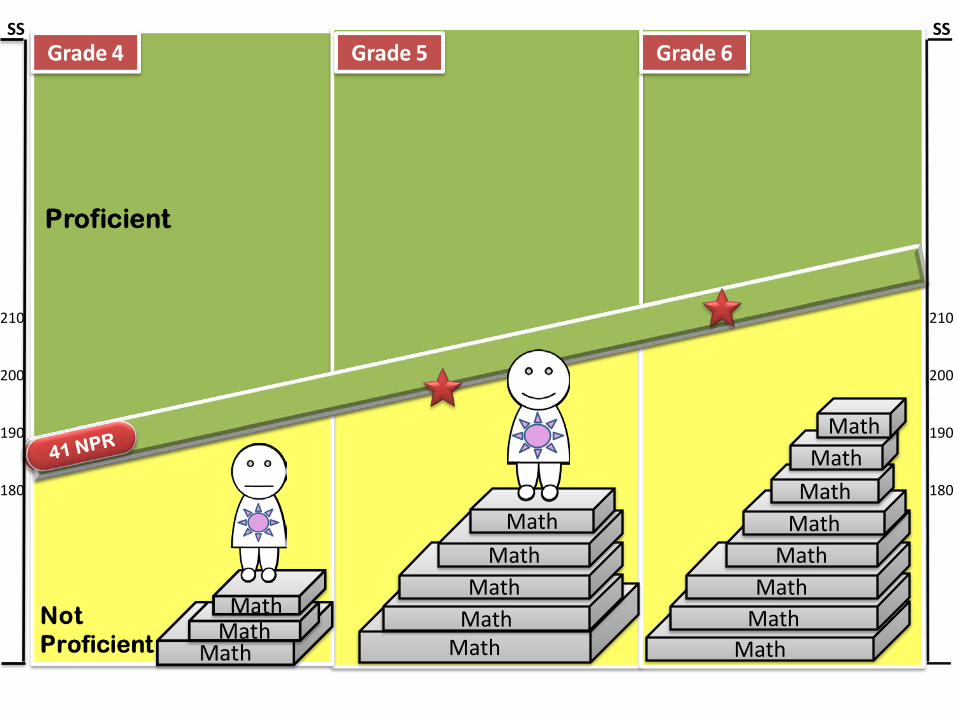
MathMathMath
MathMath
MathMath
Math
SS
210
200
190
180
MathMathMath
MathMath
SS
210
200
190
180
Resources for Monitoring Growth
• Longitudinal Reports on Iowa Assessments• eITP• Iowa DE Data Warehouse• New onliine tools from Iowa Testing Programs
(2011-2012)
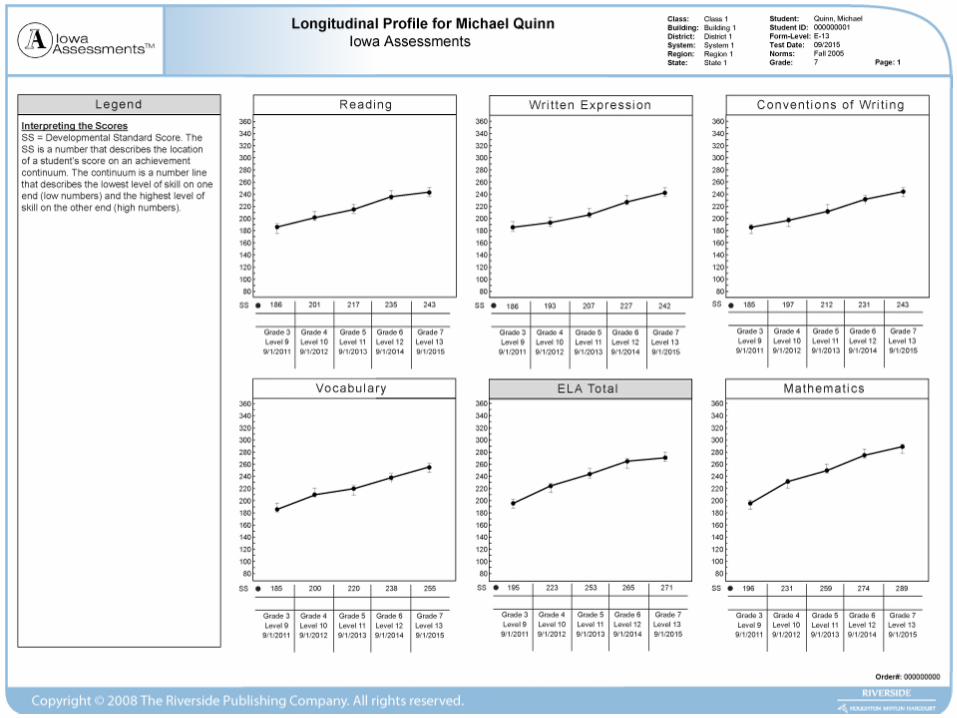
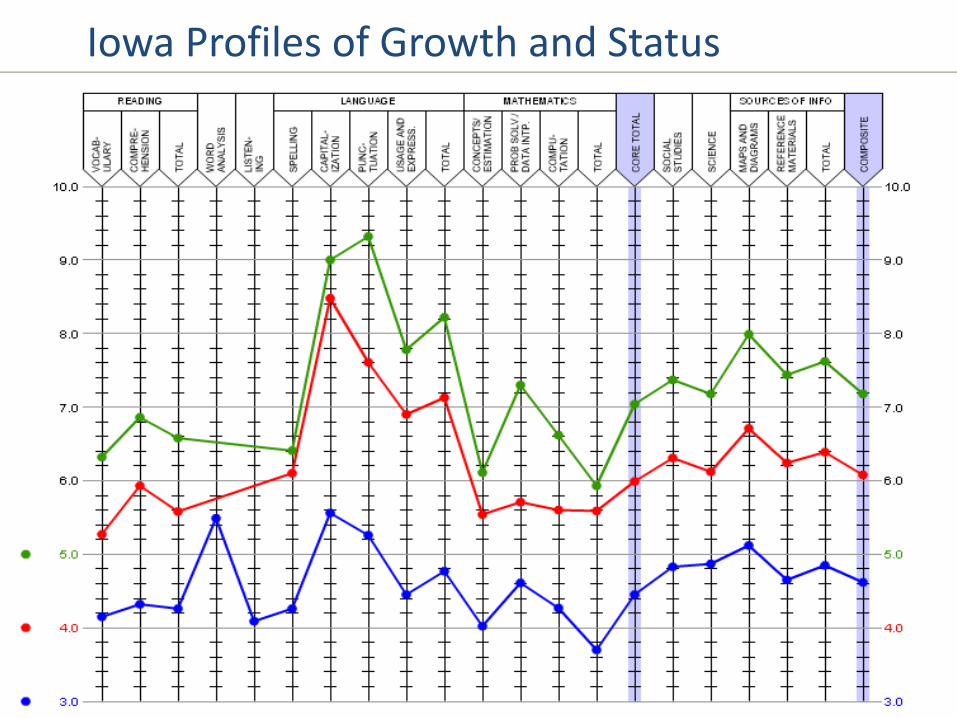
Iowa Profiles of Growth and Status
Sources of Additional Information
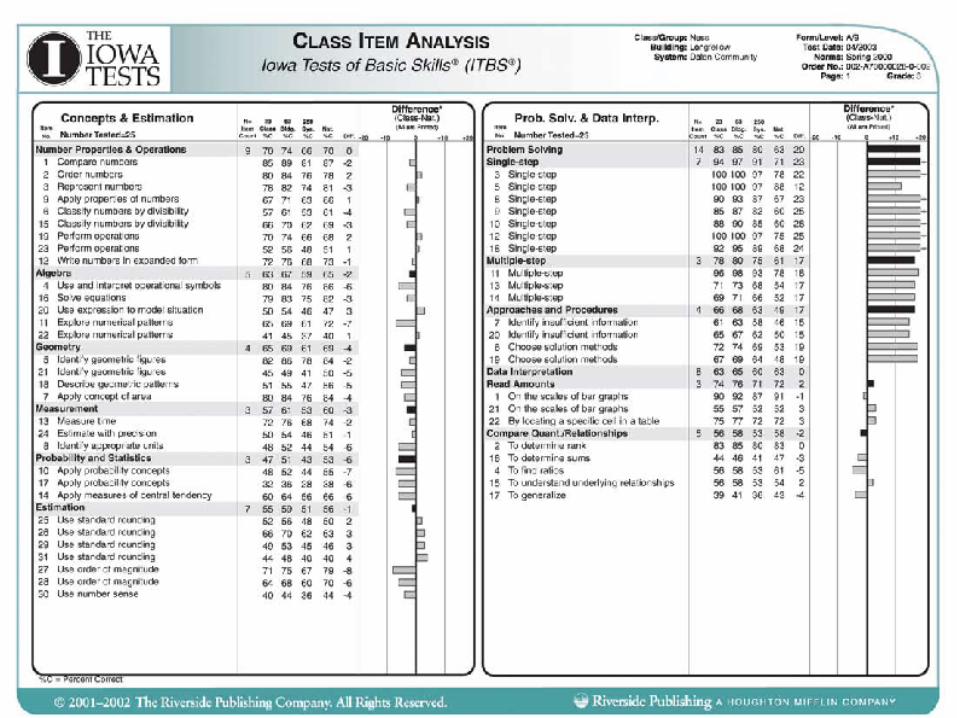
• Overall information from student profile• Iowa Reports
• Individual/Group Performance Profile• Class Item Analysis• Class Item Response Record
• Multiple measures
Use of Multiple Measures• Growth information can be obtained from a
variety of sources.• Multiple measures of student learning, such
as assessments, essays, portfolios of students’ work, group projects that require analysis, investigation, and written, oral, or graphic presentation of findings, should be combined to measure growth.

![HANGING SCALES/CRANE SCALES - Aviga HFO 159 page 166 1020,-from € Hanging scales/Crane scales Lisa Mayer Product specialist Hanging scales/Crane scales Tel. +49 [0] 7433 9933 - 219](https://img.pdfslide.net/doc/110x75/5afd22507f8b9a68498c727e/hanging-scalescrane-scales-hfo-159-page-166-1020-from-hanging-scalescrane.jpg)