Embed Size (px)
Citation preview
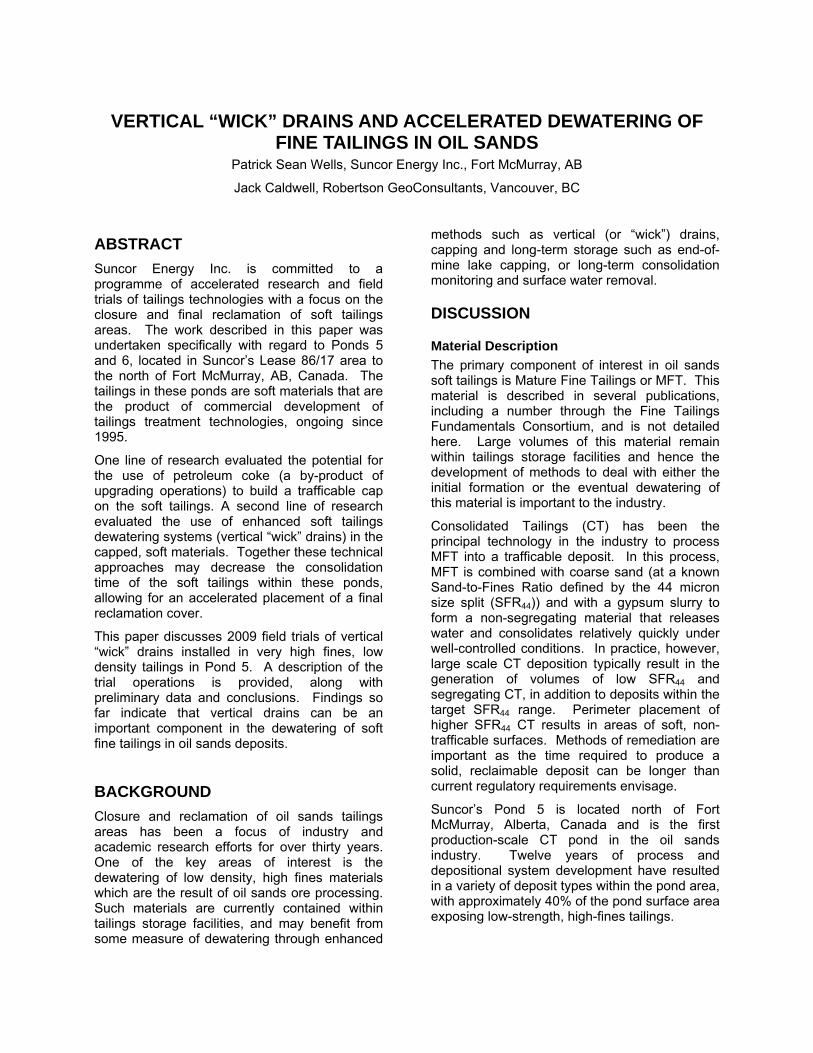
VERTICAL “WICK” DRAINS AND ACCELERATED DEWATERING OF FINE TAILINGS IN OIL SANDS
Patrick Sean Wells, Suncor Energy Inc., Fort McMurray, AB
Jack Caldwell, Robertson GeoConsultants, Vancouver, BC
ABSTRACT Suncor Energy Inc. is committed to a programme of accelerated research and field trials of tailings technologies with a focus on the closure and final reclamation of soft tailings areas. The work described in this paper was undertaken specifically with regard to Ponds 5 and 6, located in Suncor’s Lease 86/17 area to the north of Fort McMurray, AB, Canada. The tailings in these ponds are soft materials that are the product of commercial development of tailings treatment technologies, ongoing since 1995.
One line of research evaluated the potential for the use of petroleum coke (a by-product of upgrading operations) to build a trafficable cap on the soft tailings. A second line of research evaluated the use of enhanced soft tailings dewatering systems (vertical “wick” drains) in the capped, soft materials. Together these technical approaches may decrease the consolidation time of the soft tailings within these ponds, allowing for an accelerated placement of a final reclamation cover.
This paper discusses 2009 field trials of vertical “wick” drains installed in very high fines, low density tailings in Pond 5. A description of the trial operations is provided, along with preliminary data and conclusions. Findings so far indicate that vertical drains can be an important component in the dewatering of soft fine tailings in oil sands deposits.
BACKGROUND Closure and reclamation of oil sands tailings areas has been a focus of industry and academic research efforts for over thirty years. One of the key areas of interest is the dewatering of low density, high fines materials which are the result of oil sands ore processing. Such materials are currently contained within tailings storage facilities, and may benefit from some measure of dewatering through enhanced
methods such as vertical (or “wick”) drains, capping and long-term storage such as end-of-mine lake capping, or long-term consolidation monitoring and surface water removal.
DISCUSSION
Material Description The primary component of interest in oil sands soft tailings is Mature Fine Tailings or MFT. This material is described in several publications, including a number through the Fine Tailings Fundamentals Consortium, and is not detailed here. Large volumes of this material remain within tailings storage facilities and hence the development of methods to deal with either the initial formation or the eventual dewatering of this material is important to the industry.
Consolidated Tailings (CT) has been the principal technology in the industry to process MFT into a trafficable deposit. In this process, MFT is combined with coarse sand (at a known Sand-to-Fines Ratio defined by the 44 micron size split (SFR44)) and with a gypsum slurry to form a non-segregating material that releases water and consolidates relatively quickly under well-controlled conditions. In practice, however, large scale CT deposition typically result in the generation of volumes of low SFR44 and segregating CT, in addition to deposits within the target SFR44 range. Perimeter placement of higher SFR44 CT results in areas of soft, non-trafficable surfaces. Methods of remediation are important as the time required to produce a solid, reclaimable deposit can be longer than current regulatory requirements envisage.
Suncor’s Pond 5 is located north of Fort McMurray, Alberta, Canada and is the first production-scale CT pond in the oil sands industry. Twelve years of process and depositional system development have resulted in a variety of deposit types within the pond area, with approximately 40% of the pond surface area exposing low-strength, high-fines tailings.
Dewatering trials starting in mid-2009 were conducted on the soft materials at the south-west corner of the pond. The materials are characterised by the following:
• Sand-to-Fines Ratios (SFR44 defined at 44 micron particle size) between 0.4 and 3:1
• Percent solids by weight: 34 to 70%
• Void ratios ranging from 0.65 to greater than 5.5
• In-situ shear strengths from 0.1 to 2 kPa
SFR44, % solids, and in-situ shear strengths tend to increase with depth below the pond surface. Table 1 lists the basic in-situ material properties with depth in the test area.
The behaviour of these materials ranges from that of a fluid to a semi-fluid state. In terms of standard stress behaviours, these properties result in the following:
• Piezometric readings are equivalent to total stress at depth and are a function of the material densities and depths of the overlying fluid. This is what would be expected for a fluid as compared to a solid where grain-to-grain contact occurs.
• Field measurements consistently indicate zero effective stress for all material below a critical void ratio of approximately 0.65; thus implying an absence of grain-to-grain contact.
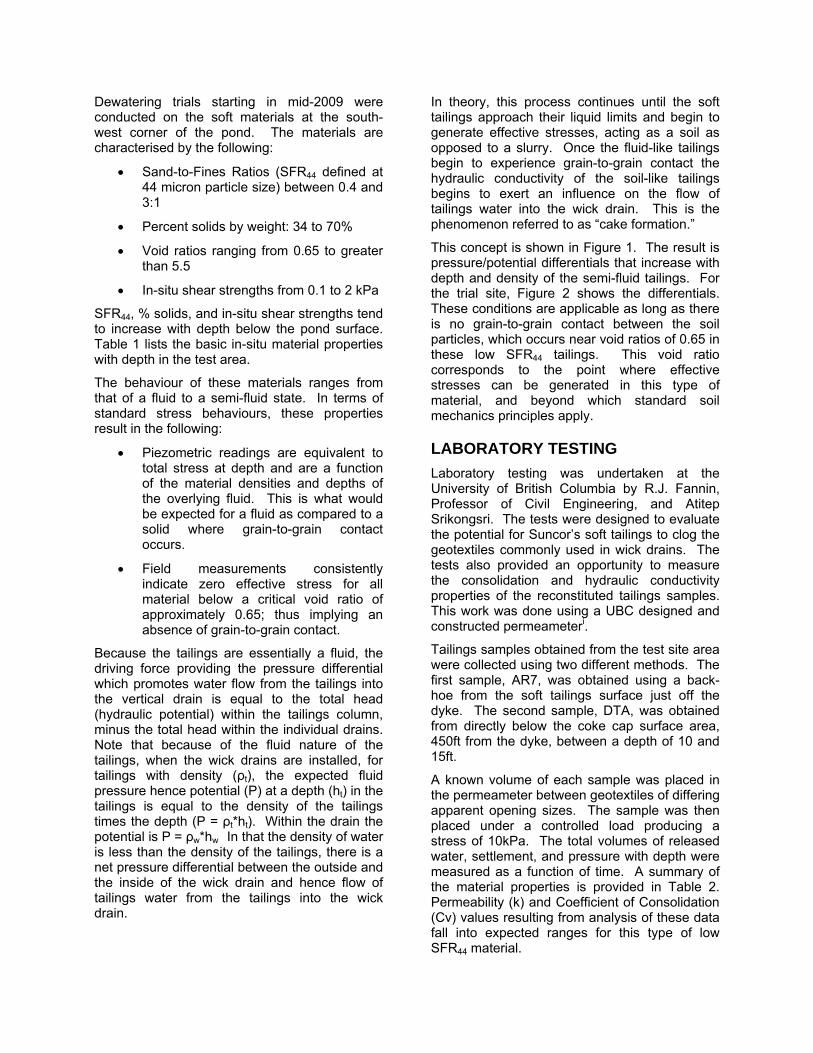
Because the tailings are essentially a fluid, the driving force providing the pressure differential which promotes water flow from the tailings into the vertical drain is equal to the total head (hydraulic potential) within the tailings column, minus the total head within the individual drains. Note that because of the fluid nature of the tailings, when the wick drains are installed, for tailings with density (ρt), the expected fluid pressure hence potential (P) at a depth (ht) in the tailings is equal to the density of the tailings times the depth (P = ρt*ht). Within the drain the potential is P = ρw*hw In that the density of water is less than the density of the tailings, there is a net pressure differential between the outside and the inside of the wick drain and hence flow of tailings water from the tailings into the wick drain.
In theory, this process continues until the soft tailings approach their liquid limits and begin to generate effective stresses, acting as a soil as opposed to a slurry. Once the fluid-like tailings begin to experience grain-to-grain contact the hydraulic conductivity of the soil-like tailings begins to exert an influence on the flow of tailings water into the wick drain. This is the phenomenon referred to as “cake formation.”
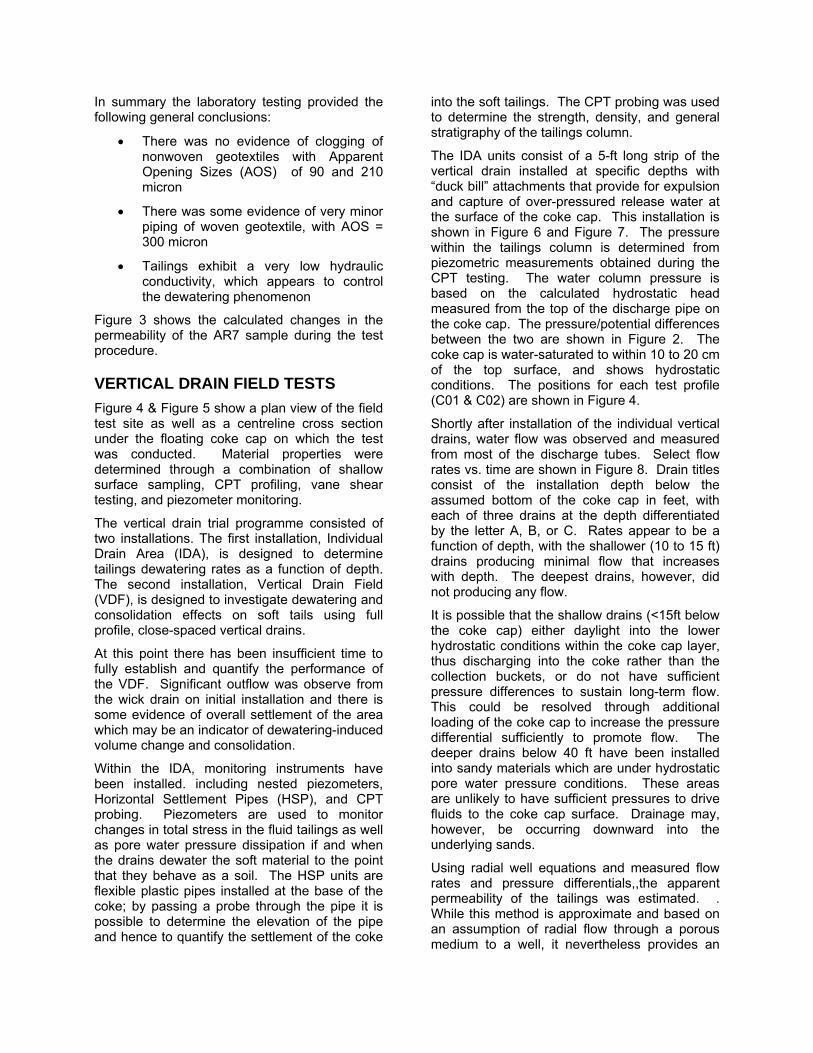
This concept is shown in Figure 1. The result is pressure/potential differentials that increase with depth and density of the semi-fluid tailings. For the trial site, Figure 2 shows the differentials. These conditions are applicable as long as there is no grain-to-grain contact between the soil particles, which occurs near void ratios of 0.65 in these low SFR44 tailings. This void ratio corresponds to the point where effective stresses can be generated in this type of material, and beyond which standard soil mechanics principles apply.
LABORATORY TESTING Laboratory testing was undertaken at the University of British Columbia by R.J. Fannin, Professor of Civil Engineering, and Atitep Srikongsri. The tests were designed to evaluate the potential for Suncor’s soft tailings to clog the geotextiles commonly used in wick drains. The tests also provided an opportunity to measure the consolidation and hydraulic conductivity properties of the reconstituted tailings samples. This work was done using a UBC designed and constructed permeameteri.
Tailings samples obtained from the test site area were collected using two different methods. The first sample, AR7, was obtained using a back-hoe from the soft tailings surface just off the dyke. The second sample, DTA, was obtained from directly below the coke cap surface area, 450ft from the dyke, between a depth of 10 and 15ft.
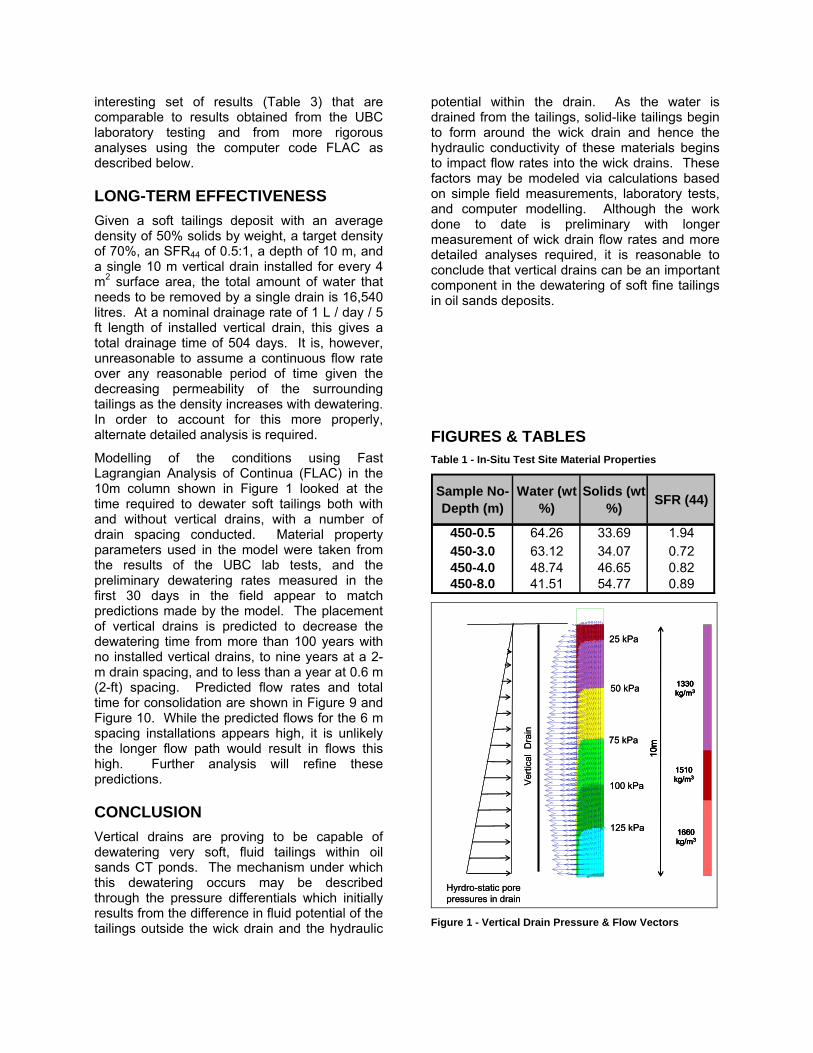
A known volume of each sample was placed in the permeameter between geotextiles of differing apparent opening sizes. The sample was then placed under a controlled load producing a stress of 10kPa. The total volumes of released water, settlement, and pressure with depth were measured as a function of time. A summary of the material properties is provided in Table 2. Permeability (k) and Coefficient of Consolidation (Cv) values resulting from analysis of these data fall into expected ranges for this type of low SFR44 material.
In summary the laboratory testing provided the following general conclusions:
• There was no evidence of clogging of nonwoven geotextiles with Apparent Opening Sizes (AOS) of 90 and 210 micron
• There was some evidence of very minor piping of woven geotextile, with AOS = 300 micron
• Tailings exhibit a very low hydraulic conductivity, which appears to control the dewatering phenomenon
Figure 3 shows the calculated changes in the permeability of the AR7 sample during the test procedure.
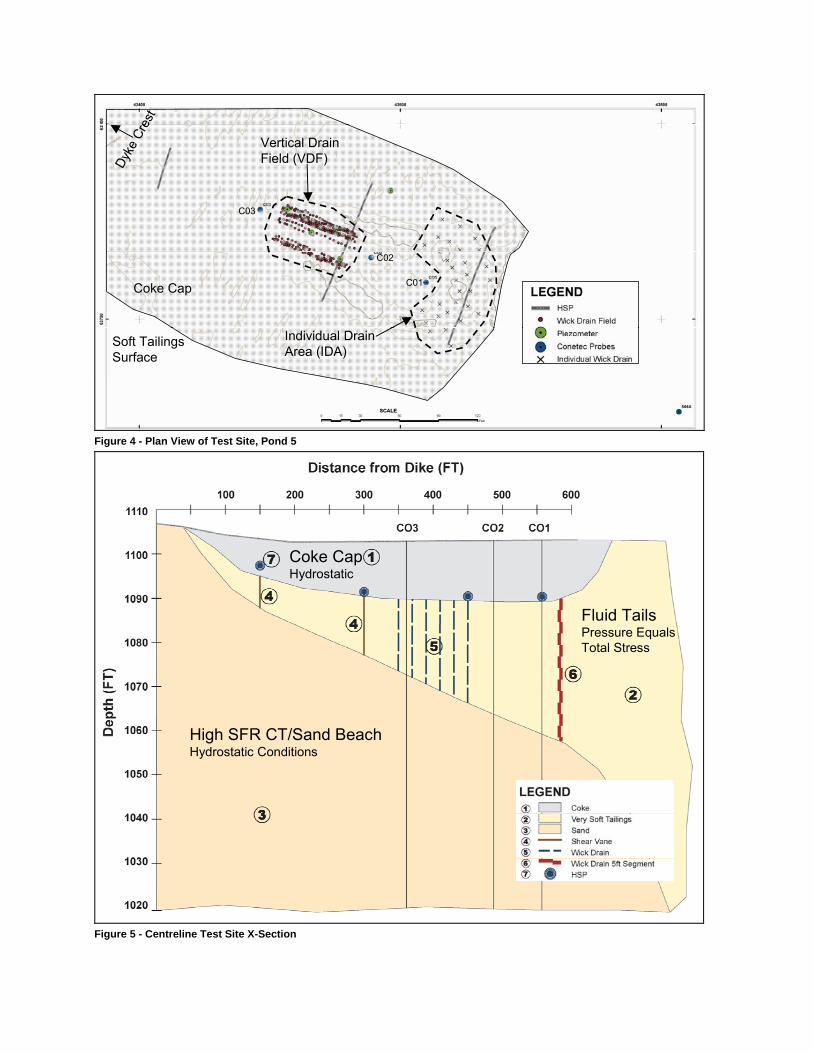
VERTICAL DRAIN FIELD TESTS Figure 4 & Figure 5 show a plan view of the field test site as well as a centreline cross section under the floating coke cap on which the test was conducted. Material properties were determined through a combination of shallow surface sampling, CPT profiling, vane shear testing, and piezometer monitoring.
The vertical drain trial programme consisted of two installations. The first installation, Individual Drain Area (IDA), is designed to determine tailings dewatering rates as a function of depth. The second installation, Vertical Drain Field (VDF), is designed to investigate dewatering and consolidation effects on soft tails using full profile, close-spaced vertical drains.
At this point there has been insufficient time to fully establish and quantify the performance of the VDF. Significant outflow was observe from the wick drain on initial installation and there is some evidence of overall settlement of the area which may be an indicator of dewatering-induced volume change and consolidation.
Within the IDA, monitoring instruments have been installed. including nested piezometers, Horizontal Settlement Pipes (HSP), and CPT probing. Piezometers are used to monitor changes in total stress in the fluid tailings as well as pore water pressure dissipation if and when the drains dewater the soft material to the point that they behave as a soil. The HSP units are flexible plastic pipes installed at the base of the coke; by passing a probe through the pipe it is possible to determine the elevation of the pipe and hence to quantify the settlement of the coke
into the soft tailings. The CPT probing was used to determine the strength, density, and general stratigraphy of the tailings column.
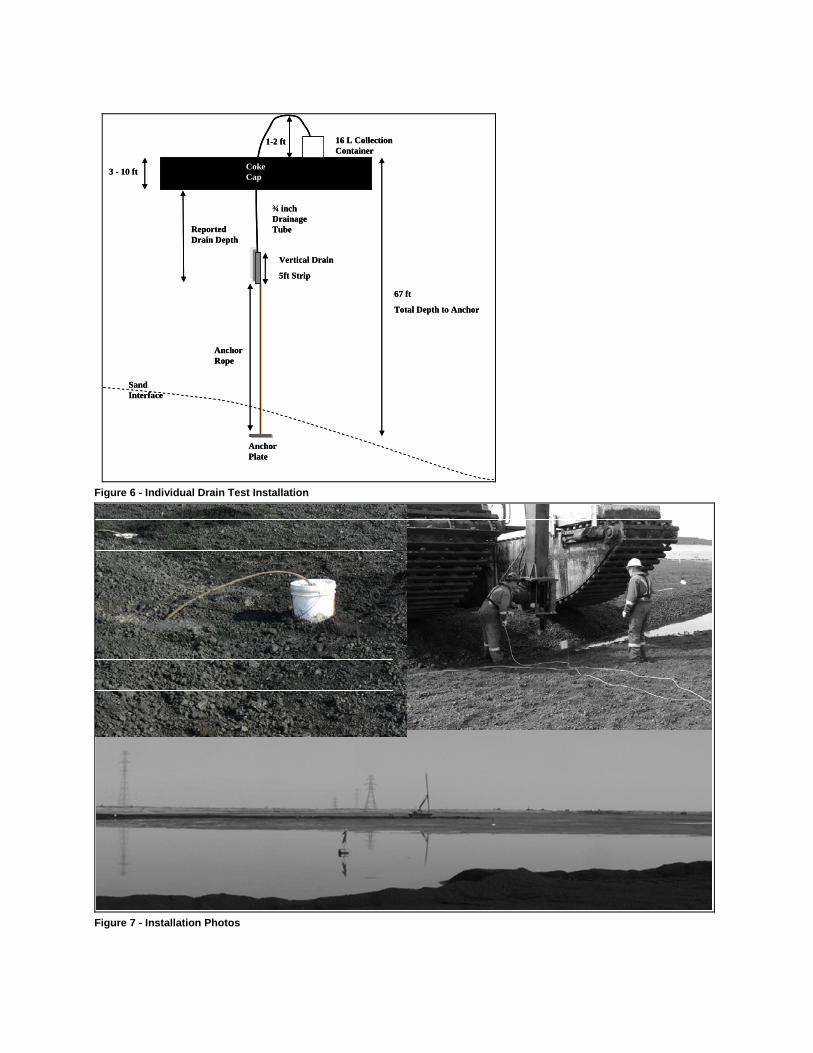
The IDA units consist of a 5-ft long strip of the vertical drain installed at specific depths with “duck bill” attachments that provide for expulsion and capture of over-pressured release water at the surface of the coke cap. This installation is shown in Figure 6 and Figure 7. The pressure within the tailings column is determined from piezometric measurements obtained during the CPT testing. The water column pressure is based on the calculated hydrostatic head measured from the top of the discharge pipe on the coke cap. The pressure/potential differences between the two are shown in Figure 2. The coke cap is water-saturated to within 10 to 20 cm of the top surface, and shows hydrostatic conditions. The positions for each test profile (C01 & C02) are shown in Figure 4.
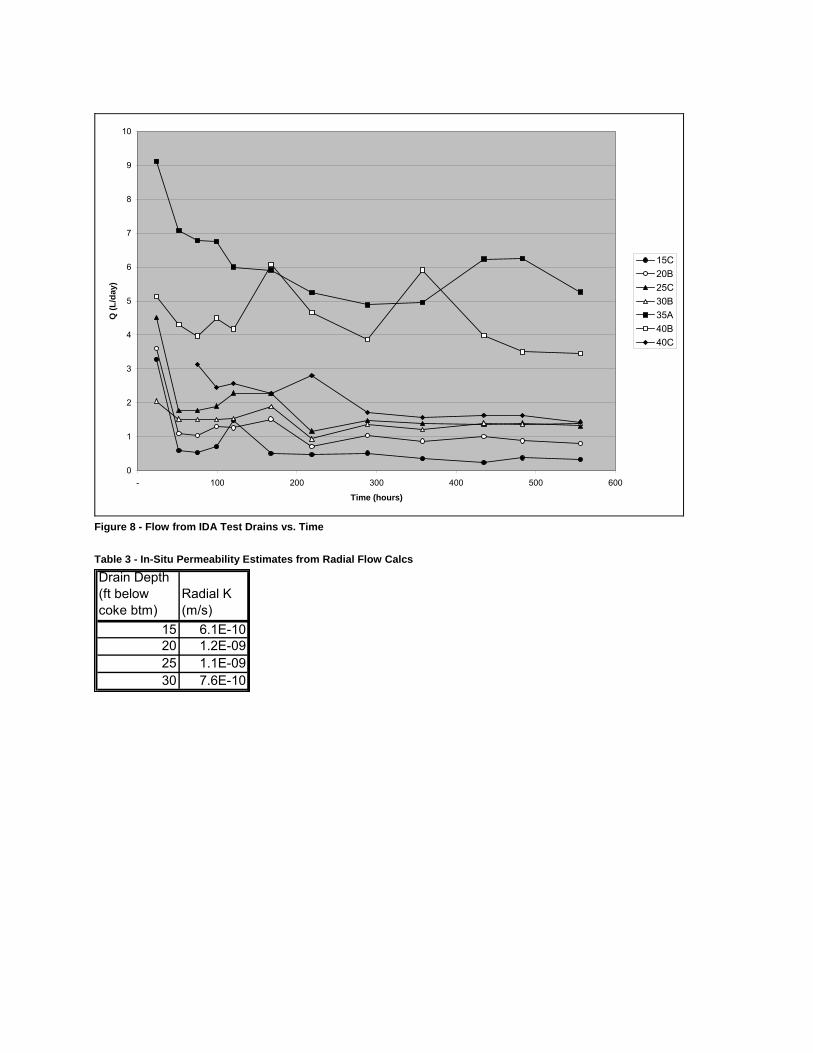
Shortly after installation of the individual vertical drains, water flow was observed and measured from most of the discharge tubes. Select flow rates vs. time are shown in Figure 8. Drain titles consist of the installation depth below the assumed bottom of the coke cap in feet, with each of three drains at the depth differentiated by the letter A, B, or C. Rates appear to be a function of depth, with the shallower (10 to 15 ft) drains producing minimal flow that increases with depth. The deepest drains, however, did not producing any flow.
It is possible that the shallow drains (<15ft below the coke cap) either daylight into the lower hydrostatic conditions within the coke cap layer, thus discharging into the coke rather than the collection buckets, or do not have sufficient pressure differences to sustain long-term flow. This could be resolved through additional loading of the coke cap to increase the pressure differential sufficiently to promote flow. The deeper drains below 40 ft have been installed into sandy materials which are under hydrostatic pore water pressure conditions. These areas are unlikely to have sufficient pressures to drive fluids to the coke cap surface. Drainage may, however, be occurring downward into the underlying sands.
Using radial well equations and measured flow rates and pressure differentials,,the apparent permeability of the tailings was estimated. . While this method is approximate and based on an assumption of radial flow through a porous medium to a well, it nevertheless provides an
interesting set of results (Table 3) that are comparable to results obtained from the UBC laboratory testing and from more rigorous analyses using the computer code FLAC as described below.
LONG-TERM EFFECTIVENESS Given a soft tailings deposit with an average density of 50% solids by weight, a target density of 70%, an SFR44 of 0.5:1, a depth of 10 m, and a single 10 m vertical drain installed for every 4 m2 surface area, the total amount of water that needs to be removed by a single drain is 16,540 litres. At a nominal drainage rate of 1 L / day / 5 ft length of installed vertical drain, this gives a total drainage time of 504 days. It is, however, unreasonable to assume a continuous flow rate over any reasonable period of time given the decreasing permeability of the surrounding tailings as the density increases with dewatering. In order to account for this more properly, alternate detailed analysis is required.
Modelling of the conditions using Fast Lagrangian Analysis of Continua (FLAC) in the 10m column shown in Figure 1 looked at the time required to dewater soft tailings both with and without vertical drains, with a number of drain spacing conducted. Material property parameters used in the model were taken from the results of the UBC lab tests, and the preliminary dewatering rates measured in the first 30 days in the field appear to match predictions made by the model. The placement of vertical drains is predicted to decrease the dewatering time from more than 100 years with no installed vertical drains, to nine years at a 2-m drain spacing, and to less than a year at 0.6 m (2-ft) spacing. Predicted flow rates and total time for consolidation are shown in Figure 9 and Figure 10. While the predicted flows for the 6 m spacing installations appears high, it is unlikely the longer flow path would result in flows this high. Further analysis will refine these predictions.
CONCLUSION Vertical drains are proving to be capable of dewatering very soft, fluid tailings within oil sands CT ponds. The mechanism under which this dewatering occurs may be described through the pressure differentials which initially results from the difference in fluid potential of the tailings outside the wick drain and the hydraulic
potential within the drain. As the water is drained from the tailings, solid-like tailings begin to form around the wick drain and hence the hydraulic conductivity of these materials begins to impact flow rates into the wick drains. These factors may be modeled via calculations based on simple field measurements, laboratory tests, and computer modelling. Although the work done to date is preliminary with longer measurement of wick drain flow rates and more detailed analyses required, it is reasonable to conclude that vertical drains can be an important component in the dewatering of soft fine tailings in oil sands deposits.
FIGURES & TABLES Table 1 - In-Situ Test Site Material Properties
Sample No-Depth (m)
Water (wt %)
Solids (wt %) SFR (44)
450-0.5 64.26 33.69 1.94450-3.0 63.12 34.07 0.72450-4.0 48.74 46.65 0.82450-8.0 41.51 54.77 0.89
Verti
cal
Dra
in
Hyrdro-static pore pressures in drain
100 kPa
75 kPa
50 kPa
125 kPa
25 kPa10
m
1330 kg/m3
1660 kg/m3
1510 kg/m3
10m
1330 kg/m3
1660 kg/m3
1510 kg/m3Ve
rtica
l D
rain
Hyrdro-static pore pressures in drain
100 kPa
75 kPa
50 kPa
125 kPa
25 kPa10
m
1330 kg/m3
1660 kg/m3
1510 kg/m3
10m
1330 kg/m3
1660 kg/m3
1510 kg/m3
Figure 1 - Vertical Drain Pressure & Flow Vectors
Soft Tailings Stress vs. Depth from CPT Profiles C01 & C02
0
2
4
6
8
10
12
14
-10 0 10 20 30 40 50 60 70 80 90 100 110 120 130 140 150 160 170 180 190
Stress (kPa)
Dep
th B
elow
Cok
e S
urfa
ce (m
)
Total Pressure (CPT C01)
Total Pressure (CPT C02)
Differential Pressure (CPTC01 -Hydrostatic)Differential Pressure (CPTC02 -Hydrostatic)
Coke Cap
C02 Soft Tailings Zone
C01 Soft Tailings Zone
Figure 2 - Total Stress and Vertical Drain Stress Differentials Table 2- Laboratory Sample Properties from UBC Testing
SampleInitial solids by weight (%)
Final solids by weight (%)
Sand-to-Fines Ratio (SFR(44))
Bitumen content (wt %)
Clay Content (wt %) Cv (m2/yr) k (m/s)
AR7 (SGS-SA3) 62% 76% 1.0 6% 10% 0.11 7E-10DTA (MDH-A1786 450-3.0) 34% 65% 0.7 7% 15% 1.63 1E-08
AR 7 Sample Permeability Calculations
1.0E‐08
1.0E‐07
1.0E‐06
1.0E‐05
0 50 100 150 200 250 300Time (hr)
Perm
eability (cm/s)
TOP
BOTTOM
Figure 3 - AR7 Sample Permeability
Vertical Drain Field (VDF)
Individual Drain Area (IDA)
Dyke
Cre
st
Soft Tailings Surface
Coke Cap
C03
C02
C01
Vertical Drain Field (VDF)
Individual Drain Area (IDA)
Dyke
Cre
st
Soft Tailings Surface
Coke Cap
Vertical Drain Field (VDF)
Individual Drain Area (IDA)
Dyke
Cre
st
Soft Tailings Surface
Coke Cap
C03
C02
C01
Figure 4 - Plan View of Test Site, Pond 5
Coke CapHydrostatic
High SFR CT/Sand BeachHydrostatic Conditions
Fluid TailsPressure Equals Total Stress
Coke CapHydrostatic
High SFR CT/Sand BeachHydrostatic Conditions
Fluid TailsPressure Equals Total Stress
Figure 5 - Centreline Test Site X-Section
3 - 10 ft
67 ft
Total Depth to Anchor
Vertical Drain
5ft Strip
Anchor Rope
¾ inch Drainage Tube
Anchor Plate
Coke Cap
16 L Collection Container
Reported Drain Depth
1-2 ft
Sand Interface
3 - 10 ft
67 ft
Total Depth to Anchor
Vertical Drain
5ft Strip
Anchor Rope
¾ inch Drainage Tube
Anchor Plate
Coke Cap
16 L Collection Container
Reported Drain Depth
1-2 ft
Sand Interface
Figure 6 - Individual Drain Test Installation
Figure 7 - Installation Photos
0
1
2
3
4
5
6
7
8
9
10
- 100 200 300 400 500 600
Time (hours)
Q (L
/day
)
15C20B25C30B35A40B40C
Figure 8 - Flow from IDA Test Drains vs. Time Table 3 - In-Situ Permeability Estimates from Radial Flow Calcs
Drain Depth (ft below coke btm)
Radial K (m/s)
15 6.1E-1020 1.2E-0925 1.1E-0930 7.6E-10

Figure 9 - Modelled Drain Flow Rates vs. Time
Figure 10 - Modelled 10 m Column Surface Settlement
REFERENCES i A study on the behaviour of soil-geotextile systems in filtration tests, E.M. Palmeira, R.J. Fannin, and Y.P. Vaid, Canadian Geotechnical Journal 33, (1996)