Embed Size (px)
Citation preview
Vi-CELL XR Analysis of Yeast Particle Characterization Application Note
AbstractConsistent yeast performance during the fermentation process is vital for the manufacture of biofuel, food, beverage and any bioprocess involving yeast fermentation. Monitoring the yeast performance requires assessment of accurate cell counts and cellular viability. A common method used to assess the degree of yeast viability is the use of a vital dye and the hemacytometer. Viable yeast cells do not stain; whereas nonviable, non-metabolizing cells stain the color of the selected dye. An operator, using a light microscope, enumerates several hundred cells and calculates the ratio of stained cells to the total number counted (% viability). In addition to being labor-intensive, this technique has substantial accuracy error due to its subjective nature. The following application note provides a repeatable, accurate and easy solution to automate the yeast cell counting and viability determination process.
IntroductionAt the end of the 19th century, Pasteur’s research showed that alcohol production from glucose was linked directly to yeast1. The fermentation property of yeast is utilized in the beer, wine, and ethanol production industries. For optimum yeast
fermentation performance, percentage cell viability and concentration must be monitored.2,3 The Beckman Coulter Vi-CELL XR automates the labor-intensive manual trypan blue viability method.
The Vi-CELL XR software includes the Cell Type feature. Cell Types are files that store the optical settings required to correctly identify and quantify viable versus nonviable cells. This feature helps account for the fact that cells vary in their optical characteristics. Yeast cells in particular can be challenging to count; yeast cells have a broad size distribution, can be difficult to stain, have a high cell concentration, and may contain significant debris from the fermentation process. Therefore, it is important to optimize the Cell Type for yeast in order to obtain accurate and precise cell viability and concentration results. In this application note, we demonstrate Beckman Coulter's best practices for the analysis of yeast cell viability.
Equipment UsedBeckman Coulter Vi-CELL XR Vi-CELL XR reagent pack
DS-18381A
Yeast Sample PreparationFiltration It is important that the yeast fermentation sample is filtered through a 50-micron sieve to remove any large debris.
Dilution The sample must also be diluted to a concentration between 5 x 10⁴ to 1 x 10⁷ cells/mL using growth media or desired buffer as a diluent. One quick way to check the cell concentration prior to running on the Vi-CELL is with a Z series or Multisizer series COULTER COUNTER.
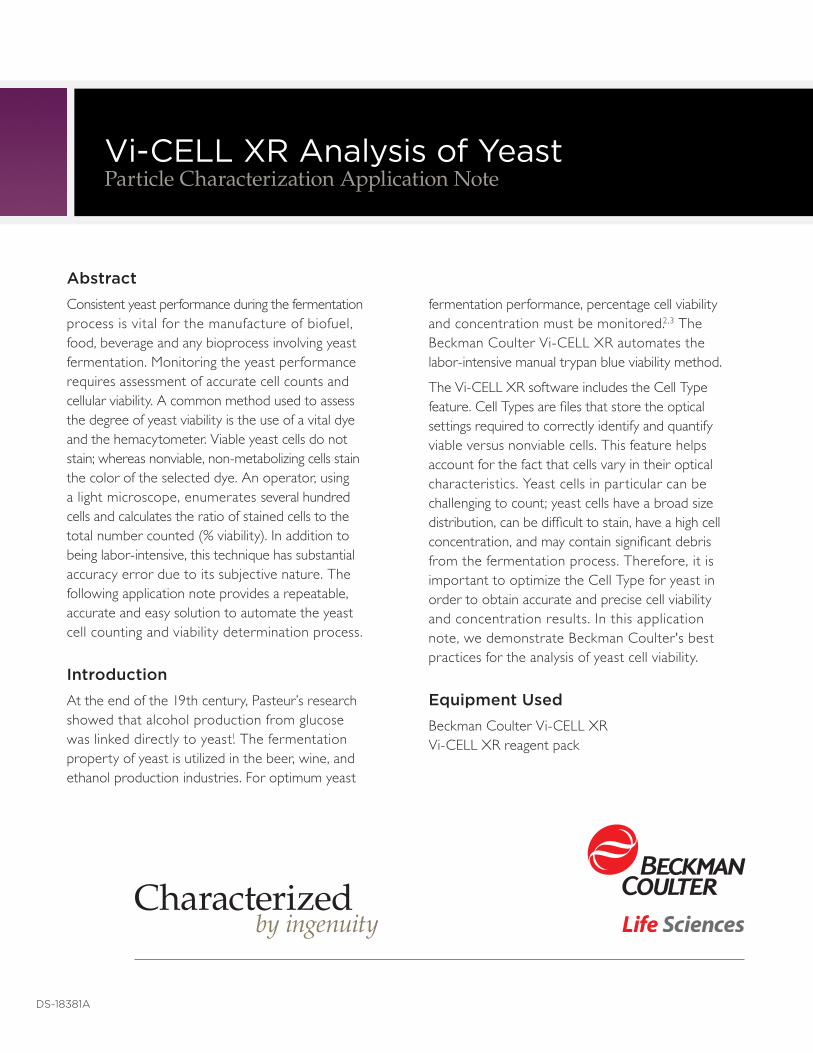
Instrument SettingsCreating an Optimized Yeast Cell Type A yeast sample was analyzed on the Vi-CELL XR using the default Yeast Cell Type. Review of the results determined that the yeast sample contained starch granules from the fermentation process and that the cells were not stained completely. Minor modifications were made to the Yeast Cell Type to correct for this. Table 1 describes the modifications.
AnalysisAnalyzed yeast fermentation samples were pulled from three different fermentation time intervals—two hours, 18 hours and 26 hours. All samples were diluted 500-fold. Five replicates of each time interval were run consecutively on the Vi-CELL XR using the new optimized Yeast Cell Type. The Predicted Outcomes shown in Table 3 were based on feedback from the collaborating bioprocess engineers’ experience with these yeast strains.
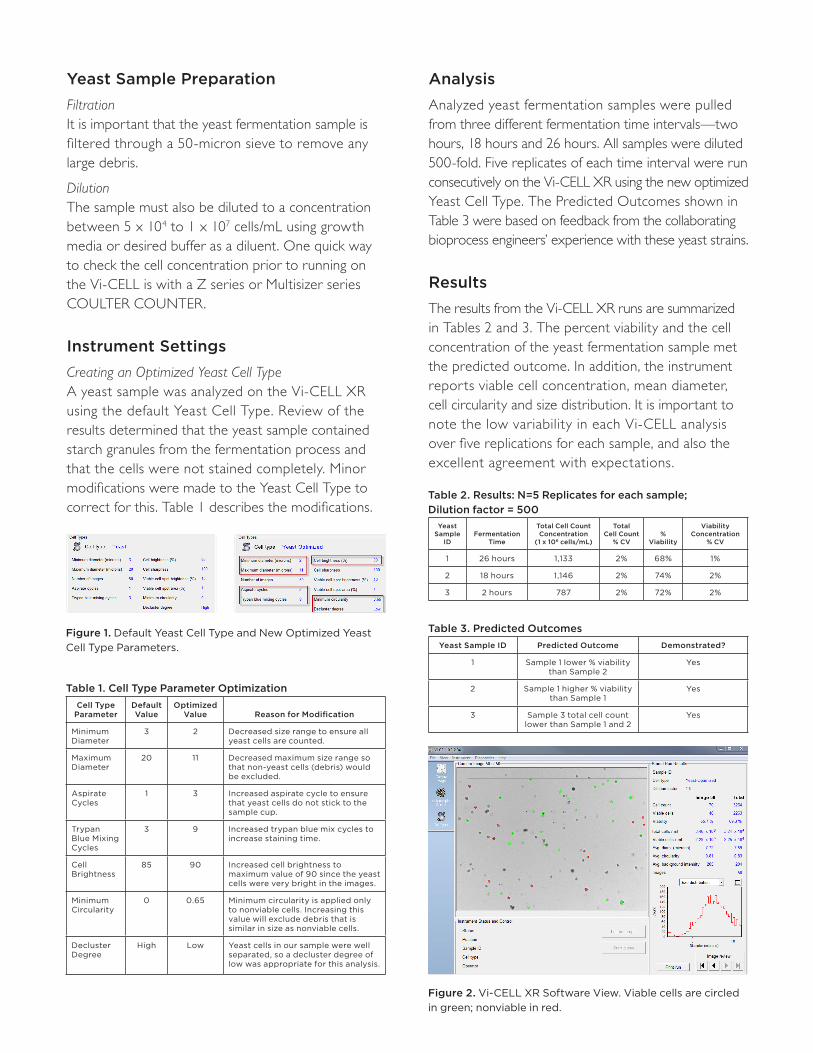
ResultsThe results from the Vi-CELL XR runs are summarized in Tables 2 and 3. The percent viability and the cell concentration of the yeast fermentation sample met the predicted outcome. In addition, the instrument reports viable cell concentration, mean diameter, cell circularity and size distribution. It is important to note the low variability in each Vi-CELL analysis over five replications for each sample, and also the excellent agreement with expectations.
Figure 1. Default Yeast Cell Type and New Optimized Yeast Cell Type Parameters.
Figure 2. Vi-CELL XR Software View. Viable cells are circled in green; nonviable in red.
Table 1. Cell Type Parameter Optimization
Table 3. Predicted Outcomes
Table 2. Results: N=5 Replicates for each sample; Dilution factor = 500
Cell Type Parameter
Default Value
Optimized Value
Reason for Modification
Minimum Diameter
3 2 Decreased size range to ensure all yeast cells are counted.
Maximum Diameter
20 11 Decreased maximum size range so that non-yeast cells (debris) would be excluded.
Aspirate Cycles
1 3 Increased aspirate cycle to ensure that yeast cells do not stick to the sample cup.
Trypan Blue Mixing Cycles
3 9 Increased trypan blue mix cycles to increase staining time.
Cell Brightness
85 90 Increased cell brightness to maximum value of 90 since the yeast cells were very bright in the images.
Minimum Circularity
0 0.65 Minimum circularity is applied only to nonviable cells. Increasing this value will exclude debris that is similar in size as nonviable cells.
Decluster Degree
High Low Yeast cells in our sample were well separated, so a decluster degree of low was appropriate for this analysis.
Yeast Sample ID Predicted Outcome Demonstrated?
1 Sample 1 lower % viability than Sample 2
Yes
2 Sample 1 higher % viability than Sample 1
Yes
3 Sample 3 total cell count lower than Sample 1 and 2
Yes
Yeast Sample
ID
Fermentation
Time
Total Cell Count Concentration
(1 x 10⁶ cells/mL)
Total Cell Count
% CV
%
Viability
Viability Concentration
% CV
1 26 hours 1,133 2% 68% 1%
2 18 hours 1,146 2% 74% 2%
3 2 hours 787 2% 72% 2%
Why the Vi-CELL XR is Superior to Manual Trypan Blue for Yeast Analysis
As mentioned, the standard method for measuring cell viability is the Trypan Blue Dye Exclusion method. Trypan blue stain (0.4%) is mixed with an equal volume of cells. Viable cells, given their intact membranes, exclude the trypan blue stain; nonviable cells, membrane permeable, stain dark blue. The manual method, however, requires a technician—using a hemacytometer and microscope—to enumerate both stained and unstained cells and manually calculate the percent viability. In addition to being labor-intensive, this technique has substantial accuracy error due to its subjective nature.
An evaluation of manual versus automated Trypan Blue Dye Exclusion method for cell counting was previously conducted by the Industrial BioDevelopment Laboratory (IBDL). IBDL found a significant variability between cell counts determined by different people using the hemacytometer. The variation may be due to variability in sample preparation and/or decisions regarding viability/non-viability of individual cells. “The cell concentrations and viabilities determined by the Vi-CELL were reproducible throughout the course of the experiment and close to the mean values of the individual participants, without suffering from the wide variability of the human counts. We therefore conclude that the use of the Vi-CELL is an accurate, reproducible, and effective tool for cell counting.4”
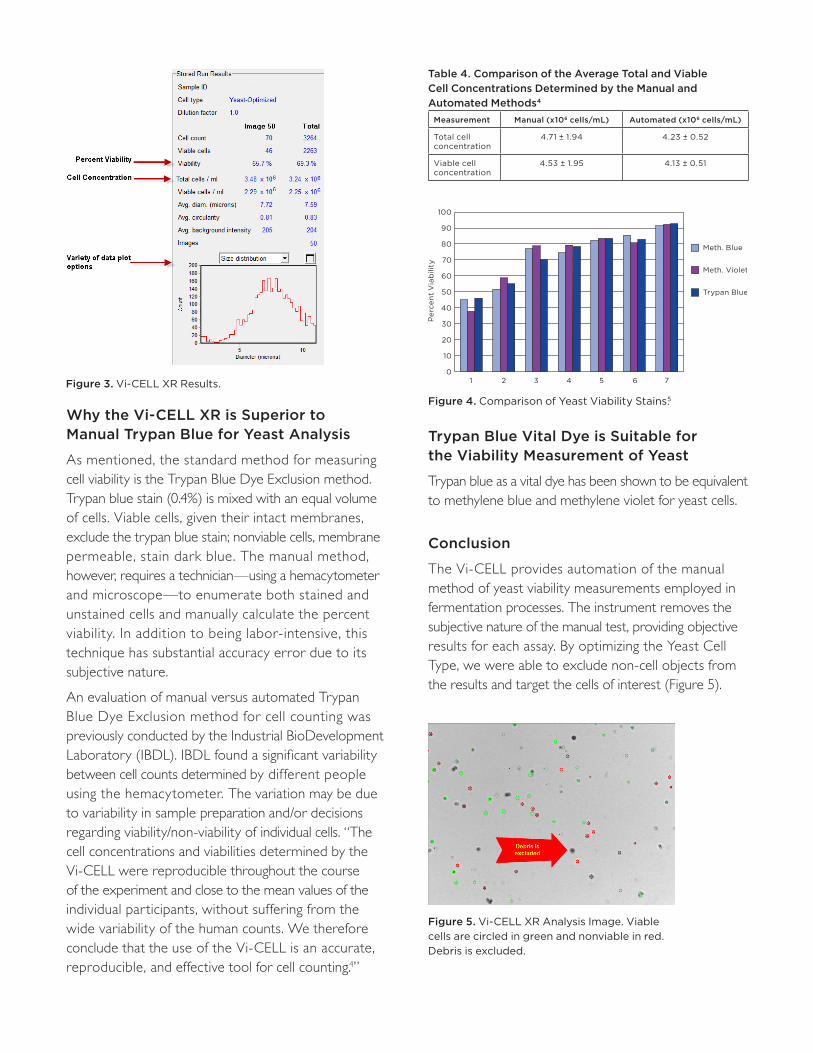
Trypan Blue Vital Dye is Suitable for the Viability Measurement of Yeast
Trypan blue as a vital dye has been shown to be equivalent to methylene blue and methylene violet for yeast cells.
Conclusion
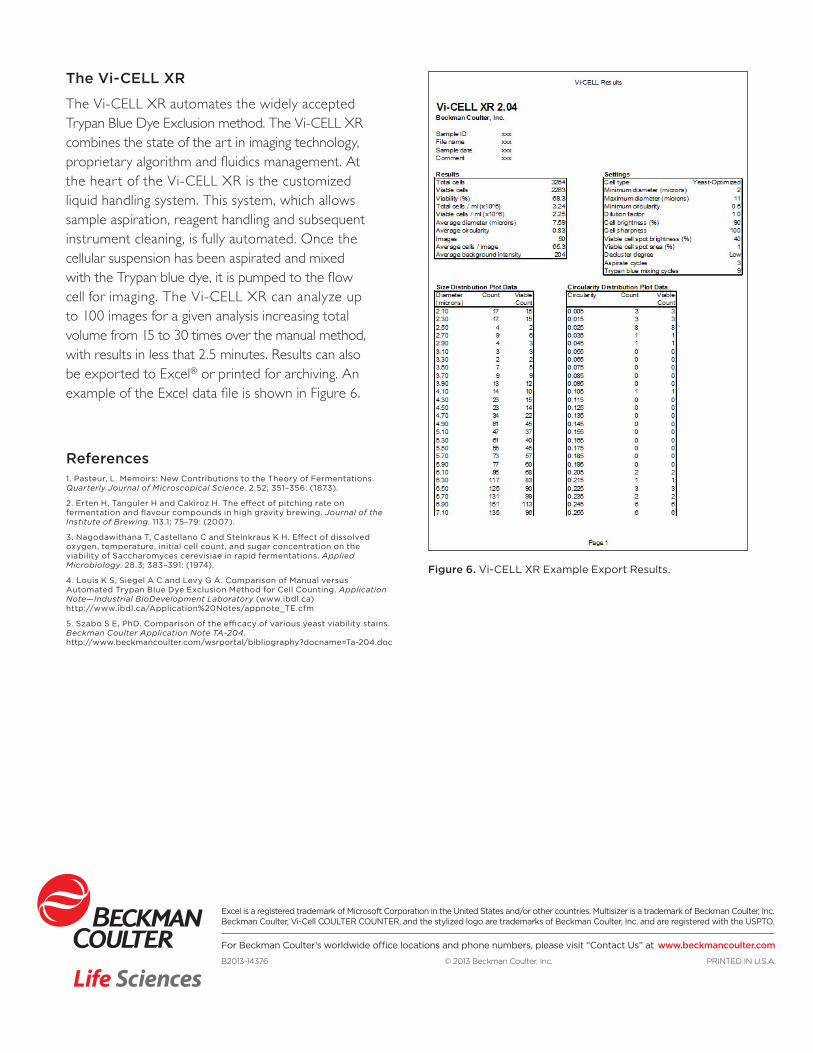
The Vi-CELL provides automation of the manual method of yeast viability measurements employed in fermentation processes. The instrument removes the subjective nature of the manual test, providing objective results for each assay. By optimizing the Yeast Cell Type, we were able to exclude non-cell objects from the results and target the cells of interest (Figure 5).
Figure 3. Vi-CELL XR Results.
Table 4. Comparison of the Average Total and Viable Cell Concentrations Determined by the Manual and Automated Methods4
Measurement Manual (x106 cells/mL) Automated (x106 cells/mL)
Total cell concentration
4.71 ± 1.94 4.23 ± 0.52
Viable cell concentration
4.53 ± 1.95 4.13 ± 0.51
Figure 4. Comparison of Yeast Viability Stains.5
Figure 5. Vi-CELL XR Analysis Image. Viable cells are circled in green and nonviable in red. Debris is excluded.
The Vi-CELL XR
The Vi-CELL XR automates the widely accepted Trypan Blue Dye Exclusion method. The Vi-CELL XR combines the state of the art in imaging technology, proprietary algorithm and fluidics management. At the heart of the Vi-CELL XR is the customized liquid handling system. This system, which allows sample aspiration, reagent handling and subsequent instrument cleaning, is fully automated. Once the cellular suspension has been aspirated and mixed with the Trypan blue dye, it is pumped to the flow cell for imaging. The Vi-CELL XR can analyze up to 100 images for a given analysis increasing total volume from 15 to 30 times over the manual method, with results in less that 2.5 minutes. Results can also be exported to Excel® or printed for archiving. An example of the Excel data file is shown in Figure 6.
References1. Pasteur, L. Memoirs: New Contributions to the Theory of Fermentations.Quarterly Journal of Microscopical Science. 2.52; 351–356: (1873).
2. Erten H, Tanguler H and Cakiroz H. The effect of pitching rate on fermentation and flavour compounds in high gravity brewing. Journal of the Institute of Brewing. 113.1; 75–79: (2007).
3. Nagodawithana T, Castellano C and Steinkraus K H. Effect of dissolved oxygen, temperature, initial cell count, and sugar concentration on the viability of Saccharomyces cerevisiae in rapid fermentations. Applied Microbiology. 28.3; 383–391: (1974).
4. Louis K S, Siegel A C and Levy G A. Comparison of Manual versus Automated Trypan Blue Dye Exclusion Method for Cell Counting. Application Note—Industrial BioDevelopment Laboratory (www.ibdl.ca) http://www.ibdl.ca/Application%20Notes/appnote_TE.cfm
5. Szabo S E, PhD. Comparison of the efficacy of various yeast viability stains. Beckman Coulter Application Note TA-204. http://www.beckmancoulter.com/wsrportal/bibliography?docname=Ta-204.doc
Figure 6. Vi-CELL XR Example Export Results.
Excel is a registered trademark of Microsoft Corporation in the United States and/or other countries. Multisizer is a trademark of Beckman Coulter, Inc.Beckman Coulter, Vi-Cell COULTER COUNTER, and the stylized logo are trademarks of Beckman Coulter, Inc. and are registered with the USPTO.
For Beckman Coulter’s worldwide office locations and phone numbers, please visit “Contact Us” at www.beckmancoulter.com
B2013-14376 © 2013 Beckman Coulter, Inc. PRINTED IN U.S.A.