Embed Size (px)
Citation preview
Third Quarter 2008/09 42
VI. EXTERNAL SECTOR DEVELOPMENTS 6.1 Overall Balance of Payments
The balance of payments recorded a surplus of USD 309.9 million in the third quarter of
20080/9 compared with deficits of USD 43.9 million in the preceding quarter and USD
175 million in the same quarter last year. A
significant drop in the trade deficit coupled with a modest increase in the surplus of the
capital account were responsible for the registered surplus offsetting declines in the
surplus of the service account and net private and public transfers.
Table 6.1 Balance of Payments (Millions of USD)
2007/08 2008/09
Particulars QIII QII QIII Percentage Change
A B C D=C/B E=C/A Trade Balance -1297.1 -1671.5 -1321.6 -20.9 1.9 Exports 474.3 270.9 401.6 48.2 -15.3 Imports 1771.4 1942.4 1723.1 -11.3 -2.7Net Services 59.2 166.5 103.4 -37.9 74.6 Travel 42.8 49.1 57.7 17.5 34.9 Transportation 21.9 84.1 36.8 -56.2 67.9 Government (n.i.e.) 20.6 60.4 49.0 -18.8 138.3 Investment Income 7.9 -9.6 -6.0 -37.3 -176.3 Interest 9.4 -1.5 -0.4 -73.3 -104.3 Cash (net) 9.4 -1.5 -0.4 -73.3 -104.3 Arrears 0.0 0.0 0.0 - - Dividend -1.6 -8.1 -5.6 -30.9 259.0
Other Services -33.9 -17.5 -34.1 95.1 0.6
Private Transfers 563.9 777.3 640.8 -17.6 13.6Current Account Balance(excl. public transfers) -674.0 -727.7 -577.3 -20.7 -14.3
Public Transfers* 331.7 515.4 322.7 -37.4 -2.7Current Account Balance(incl. public transfers) -342.3 -212.3 -254.7 20.0 -25.6Non-Monetary Capital 185.3 416.3 418.7 0.6 125.9 Long-Term (net) 50.0 179.7 184.7 2.8 269.4
Third Quarter 2008/09 43
Disbursements 63.9 188.8 187.1 -0.9 193.0 Repayments 13.9 9.1 2.4 -73.6 -82.7 Cash 13.9 9.1 2.4 -73.6 -82.7 Arrears 0.0 0.0 0.0 - - Direct Investment (net) 176.9 226.8 215.6 -5.0 21.8 Short-Term (net) -41.6 9.8 18.4 88.7 -144.2Net Errors & Omissions -18.0 -247.9 146.0 -158.9 -911.3Overall Balance -175.0 -43.9 309.9 -806.2 -277.1Financing 175.0 43.9 -309.9 -806.2 -277.1 Reserves (-:increase) 175.0 43.9 -309.9 -806.2 -277.1 NBE net foreign assets 329.9 -103.0 -245.0 138.0 -174.3 CBs net foreign assets -155.0 146.9 -64.9 -144.2 -58.1
Source: NBE Staff compilation
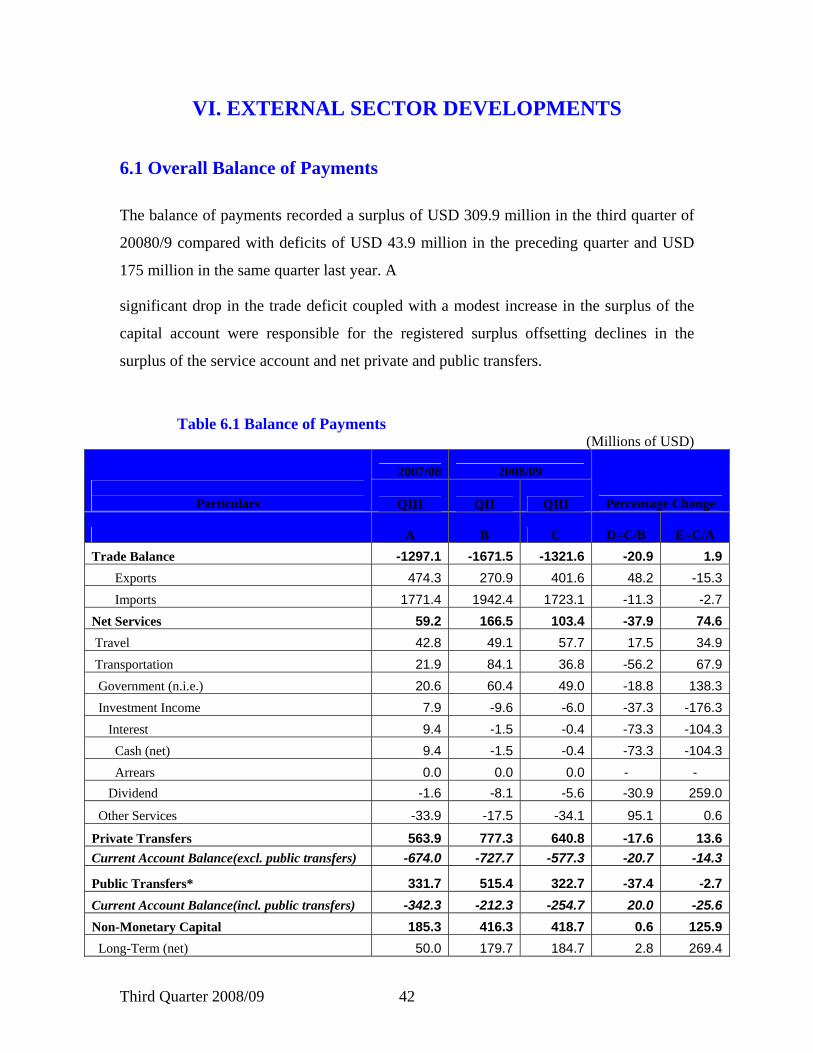
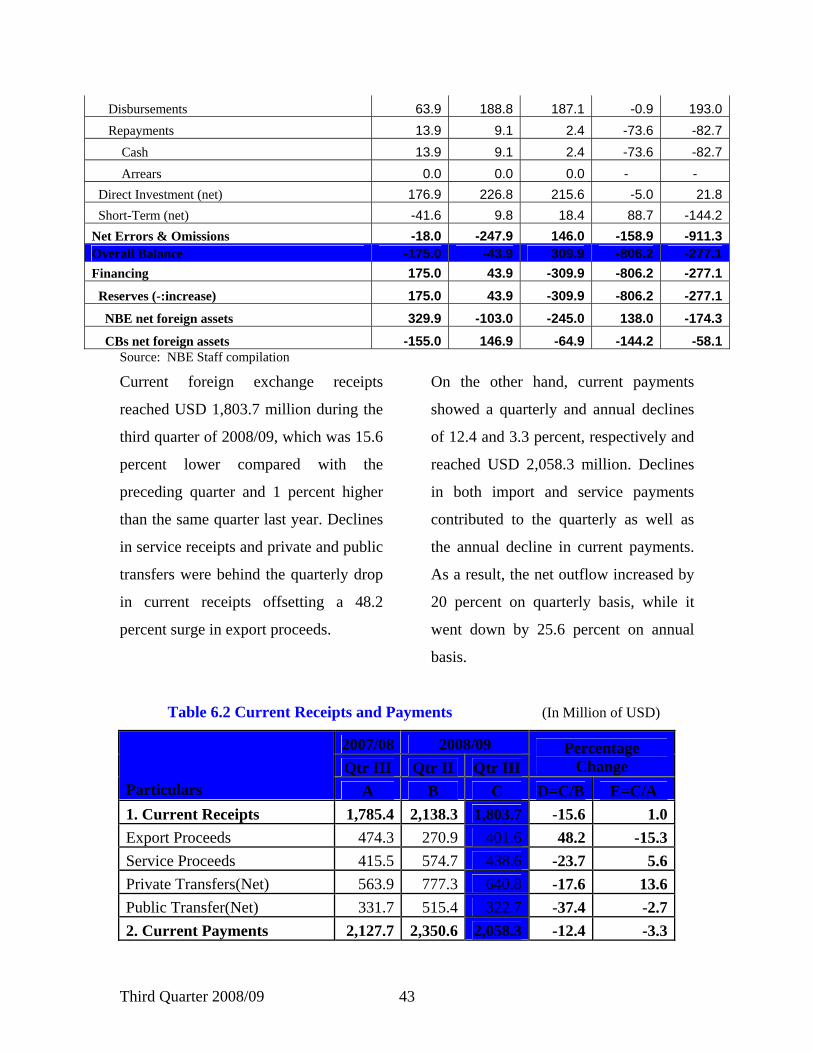
Current foreign exchange receipts
reached USD 1,803.7 million during the
third quarter of 2008/09, which was 15.6
percent lower compared with the
preceding quarter and 1 percent higher
than the same quarter last year. Declines
in service receipts and private and public
transfers were behind the quarterly drop
in current receipts offsetting a 48.2
percent surge in export proceeds.
On the other hand, current payments
showed a quarterly and annual declines
of 12.4 and 3.3 percent, respectively and
reached USD 2,058.3 million. Declines
in both import and service payments
contributed to the quarterly as well as
the annual decline in current payments.
As a result, the net outflow increased by
20 percent on quarterly basis, while it
went down by 25.6 percent on annual
basis.
Table 6.2 Current Receipts and Payments (In Million of USD)
2007/08 2008/09 Qtr III Qtr II Qtr III
Percentage Change
Particulars A B C D=C/B E=C/A 1. Current Receipts 1,785.4 2,138.3 1,803.7 -15.6 1.0Export Proceeds 474.3 270.9 401.6 48.2 -15.3Service Proceeds 415.5 574.7 438.6 -23.7 5.6Private Transfers(Net) 563.9 777.3 640.8 -17.6 13.6Public Transfer(Net) 331.7 515.4 322.7 -37.4 -2.72. Current Payments 2,127.7 2,350.6 2,058.3 -12.4 -3.3
Third Quarter 2008/09 45
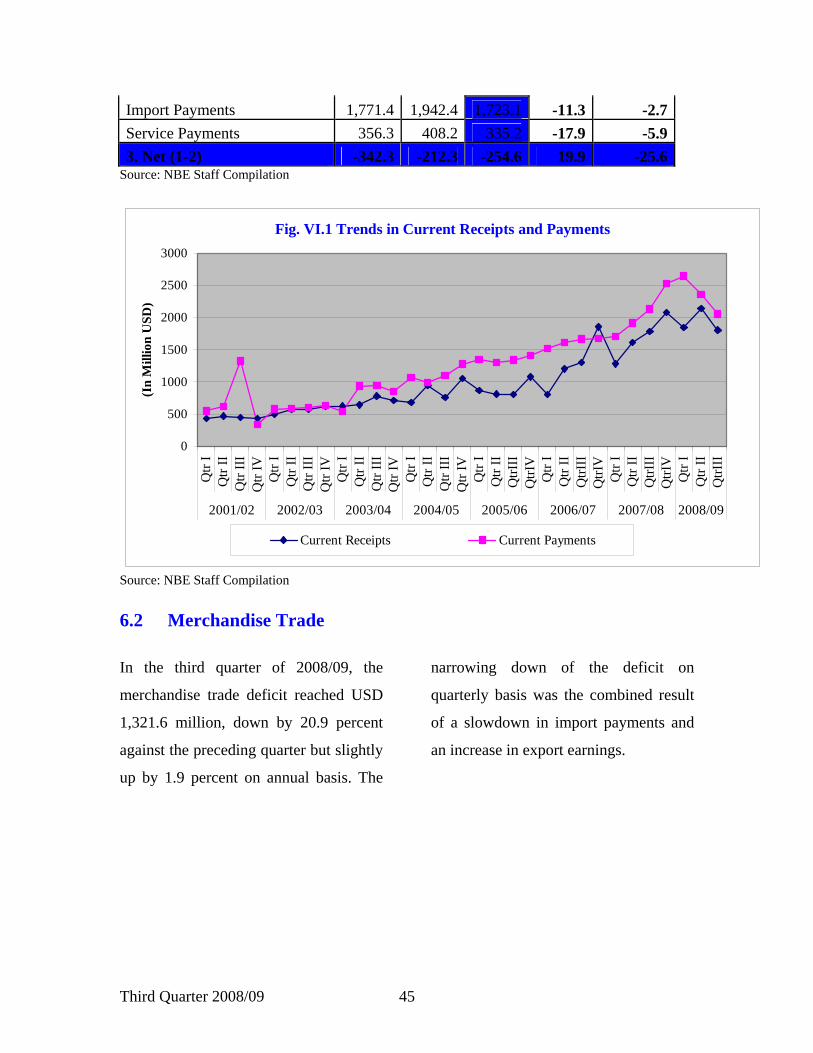
Import Payments 1,771.4 1,942.4 1,723.1 -11.3 -2.7Service Payments 356.3 408.2 335.2 -17.9 -5.93. Net (1-2) -342.3 -212.3 -254.6 19.9 -25.6
Source: NBE Staff Compilation
Fig. VI.1 Trends in Current Receipts and Payments
0
500
1000
1500
2000
2500
3000
Qtr
IQ
tr II
Qtr
IIIQ
tr IV
Qtr
IQ
tr II
Qtr
IIIQ
tr IV
Qtr
IQ
tr II
Qtr
IIIQ
tr IV
Qtr
IQ
tr II
Qtr
IIIQ
tr IV
Qtr
IQ
tr II
QtrI
IIQ
trIV
Qtr
IQ
tr II
QtrI
IIQ
trIV
Qtr
IQ
tr II
QtrI
IIQ
trIV
Qtr
IQ
tr II
QtrI
II
2001/02 2002/03 2003/04 2004/05 2005/06 2006/07 2007/08 2008/09
(In
Mill
ion
USD
)
Current Receipts Current Payments
Source: NBE Staff Compilation 6.2 Merchandise Trade
In the third quarter of 2008/09, the
merchandise trade deficit reached USD
1,321.6 million, down by 20.9 percent
against the preceding quarter but slightly
up by 1.9 percent on annual basis. The
narrowing down of the deficit on
quarterly basis was the combined result
of a slowdown in import payments and
an increase in export earnings.
Third Quarter 2008/09 45
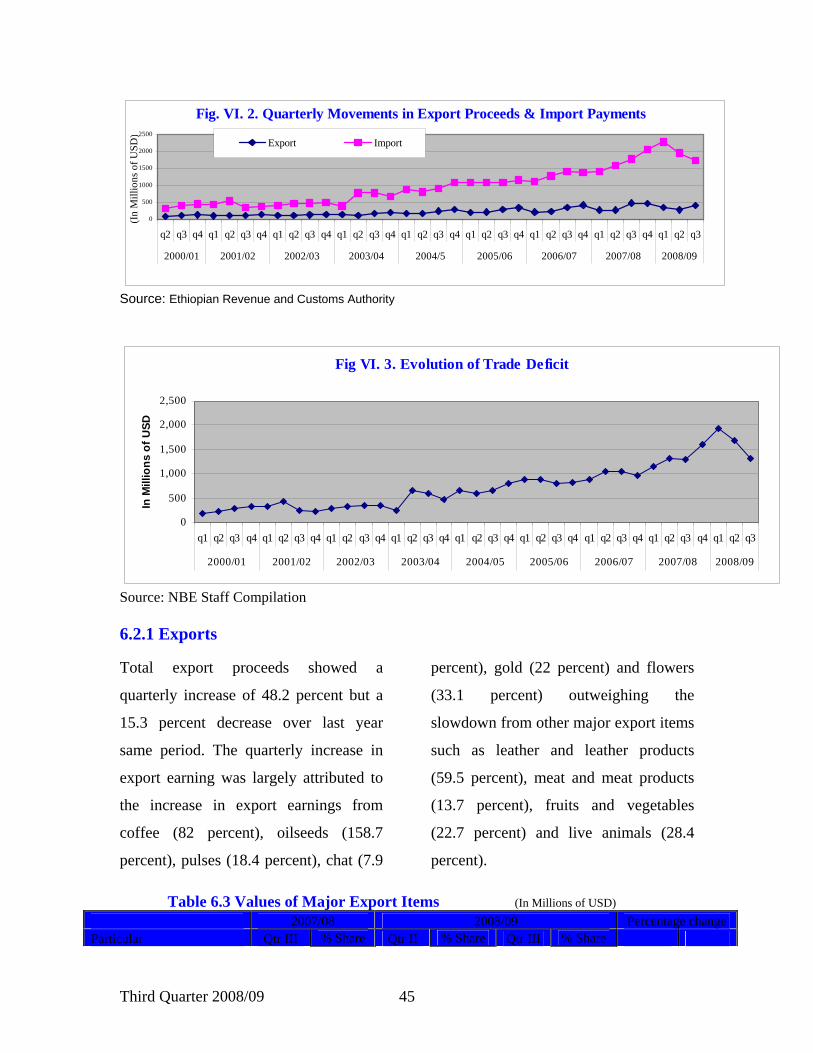
Fig. VI. 2. Quarterly Movements in Export Proceeds & Import Payments
0
500
1000
1500
2000
2500
q2 q3 q4 q1 q2 q3 q4 q1 q2 q3 q4 q1 q2 q3 q4 q1 q2 q3 q4 q1 q2 q3 q4 q1 q2 q3 q4 q1 q2 q3 q4 q1 q2 q3
2000/01 2001/02 2002/03 2003/04 2004/5 2005/06 2006/07 2007/08 2008/09
(In
Mill
ions
of U
SD)
Export Import
Source: Ethiopian Revenue and Customs Authority
Fig VI. 3. Evolution of Trade Deficit
0
500
1,000
1,500
2,000
2,500
q1 q2 q3 q4 q1 q2 q3 q4 q1 q2 q3 q4 q1 q2 q3 q4 q1 q2 q3 q4 q1 q2 q3 q4 q1 q2 q3 q4 q1 q2 q3 q4 q1 q2 q3
2000/01 2001/02 2002/03 2003/04 2004/05 2005/06 2006/07 2007/08 2008/09
In M
illio
ns o
f USD
Source: NBE Staff Compilation
6.2.1 Exports
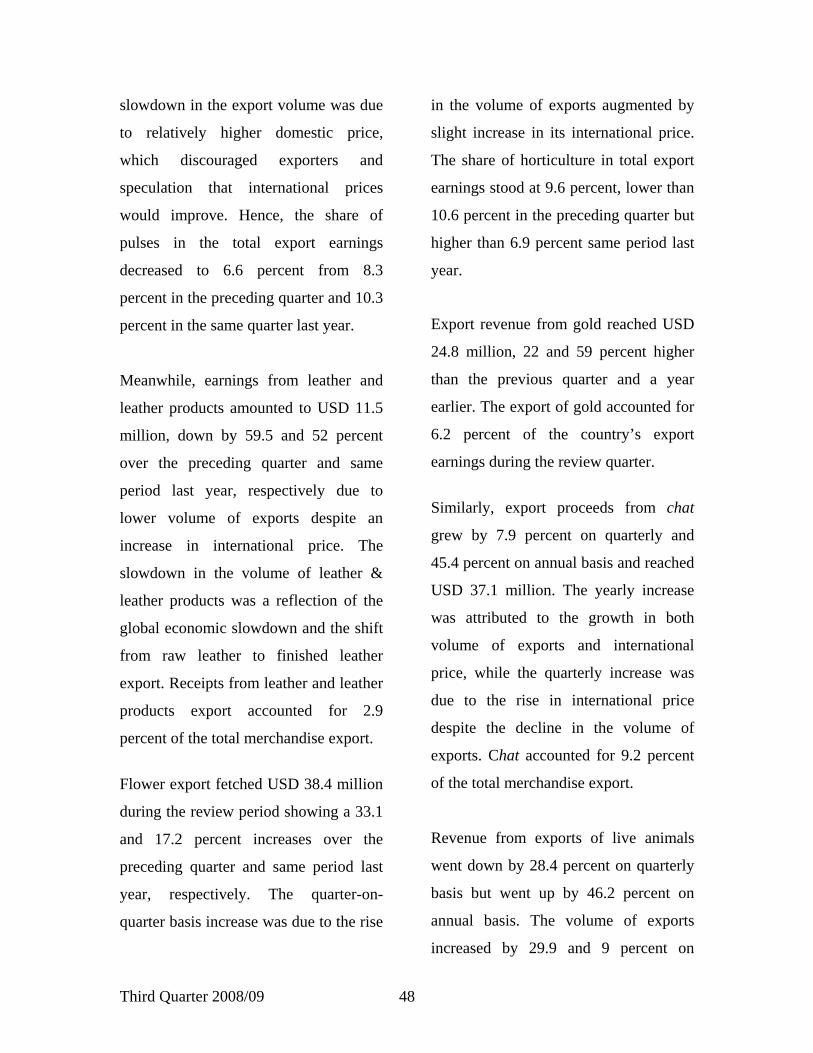
Total export proceeds showed a
quarterly increase of 48.2 percent but a
15.3 percent decrease over last year
same period. The quarterly increase in
export earning was largely attributed to
the increase in export earnings from
coffee (82 percent), oilseeds (158.7
percent), pulses (18.4 percent), chat (7.9
percent), gold (22 percent) and flowers
(33.1 percent) outweighing the
slowdown from other major export items
such as leather and leather products
(59.5 percent), meat and meat products
(13.7 percent), fruits and vegetables
(22.7 percent) and live animals (28.4
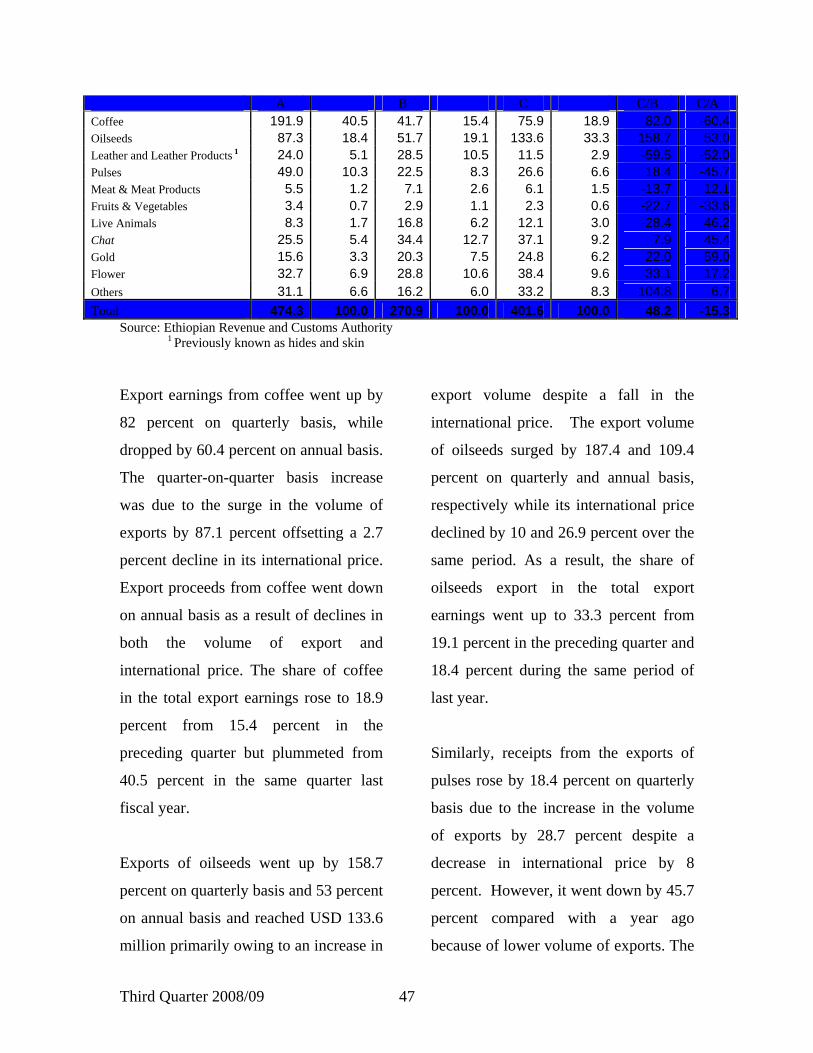
percent). Table 6.3 Values of Major Export Items (In Millions of USD)
2007/08 2008/09 Percentage change Particular Qtr III % Share Qtr II % Share Qtr III % Share
Third Quarter 2008/09 47
A B C C/B C/A Coffee 191.9 40.5 41.7 15.4 75.9 18.9 82.0 -60.4Oilseeds 87.3 18.4 51.7 19.1 133.6 33.3 158.7 53.0Leather and Leather Products 1 24.0 5.1 28.5 10.5 11.5 2.9 -59.5 -52.0Pulses 49.0 10.3 22.5 8.3 26.6 6.6 18.4 -45.7Meat & Meat Products 5.5 1.2 7.1 2.6 6.1 1.5 -13.7 12.1Fruits & Vegetables 3.4 0.7 2.9 1.1 2.3 0.6 -22.7 -33.6Live Animals 8.3 1.7 16.8 6.2 12.1 3.0 -28.4 46.2Chat 25.5 5.4 34.4 12.7 37.1 9.2 7.9 45.4Gold 15.6 3.3 20.3 7.5 24.8 6.2 22.0 59.0Flower 32.7 6.9 28.8 10.6 38.4 9.6 33.1 17.2Others 31.1 6.6 16.2 6.0 33.2 8.3 104.8 6.7Total 474.3 100.0 270.9 100.0 401.6 100.0 48.2 -15.3
Source: Ethiopian Revenue and Customs Authority 1 Previously known as hides and skin
Export earnings from coffee went up by
82 percent on quarterly basis, while
dropped by 60.4 percent on annual basis.
The quarter-on-quarter basis increase
was due to the surge in the volume of
exports by 87.1 percent offsetting a 2.7
percent decline in its international price.
Export proceeds from coffee went down
on annual basis as a result of declines in
both the volume of export and
international price. The share of coffee
in the total export earnings rose to 18.9
percent from 15.4 percent in the
preceding quarter but plummeted from
40.5 percent in the same quarter last
fiscal year.
Exports of oilseeds went up by 158.7
percent on quarterly basis and 53 percent
on annual basis and reached USD 133.6
million primarily owing to an increase in
export volume despite a fall in the
international price. The export volume
of oilseeds surged by 187.4 and 109.4
percent on quarterly and annual basis,
respectively while its international price
declined by 10 and 26.9 percent over the
same period. As a result, the share of
oilseeds export in the total export
earnings went up to 33.3 percent from
19.1 percent in the preceding quarter and
18.4 percent during the same period of
last year.
Similarly, receipts from the exports of
pulses rose by 18.4 percent on quarterly
basis due to the increase in the volume
of exports by 28.7 percent despite a
decrease in international price by 8
percent. However, it went down by 45.7
percent compared with a year ago
because of lower volume of exports. The
Third Quarter 2008/09 48
slowdown in the export volume was due
to relatively higher domestic price,
which discouraged exporters and
speculation that international prices
would improve. Hence, the share of
pulses in the total export earnings
decreased to 6.6 percent from 8.3
percent in the preceding quarter and 10.3
percent in the same quarter last year.
Meanwhile, earnings from leather and
leather products amounted to USD 11.5
million, down by 59.5 and 52 percent
over the preceding quarter and same
period last year, respectively due to
lower volume of exports despite an
increase in international price. The
slowdown in the volume of leather &
leather products was a reflection of the
global economic slowdown and the shift
from raw leather to finished leather
export. Receipts from leather and leather
products export accounted for 2.9
percent of the total merchandise export.
Flower export fetched USD 38.4 million
during the review period showing a 33.1
and 17.2 percent increases over the
preceding quarter and same period last
year, respectively. The quarter-on-
quarter basis increase was due to the rise
in the volume of exports augmented by
slight increase in its international price.
The share of horticulture in total export
earnings stood at 9.6 percent, lower than
10.6 percent in the preceding quarter but
higher than 6.9 percent same period last
year.
Export revenue from gold reached USD
24.8 million, 22 and 59 percent higher
than the previous quarter and a year
earlier. The export of gold accounted for
6.2 percent of the country’s export
earnings during the review quarter.
Similarly, export proceeds from chat
grew by 7.9 percent on quarterly and
45.4 percent on annual basis and reached
USD 37.1 million. The yearly increase
was attributed to the growth in both
volume of exports and international
price, while the quarterly increase was
due to the rise in international price
despite the decline in the volume of
exports. Chat accounted for 9.2 percent
of the total merchandise export.
Revenue from exports of live animals
went down by 28.4 percent on quarterly
basis but went up by 46.2 percent on
annual basis. The volume of exports
increased by 29.9 and 9 percent on
Third Quarter 2008/09 49
quarterly and annual bases, respectively.
Their international prices also went up
by 2.2 and 60.6 percent over the same
period.
Export earning from meat and meat
products decreased by 13.7 percent on
quarterly basis to USD 6.1 million as
both volume of exports and international
price declined by 7.6 percent and 6.6
percent, respectively. Year-on-year
basis, however, export earnings from
meat and meat products went up by 12.1
percent.
Similarly, revenue from fruits and
vegetables showed a respective fall of
22.7 and 33.6 percent on quarterly and
annual bases and amounted to USD 2.3
million. As a result, their share in the
total export earnings dropped to a mere
0.6 percent.
Fig VI.4. Export Proceeds from Selected Commodities
-
50.00
100.00
150.00
200.00
q1 q2 q3 q4 q1 q2 q3 q4 q1 q2 q3 q4 q1 q2 q3 q4 q1 q2 q3 q4 q1 q2 q3 q4 q1 q2 q3
2002/03 2003/04 2004/05 2005/06 2006/07 2007/08 2008/09
(In
Mill
ions
of U
SD)
Coffee Oilseeds Leather & leather products Pulses Chat Gold
Source: Ethiopian Revenue and Customs Authority
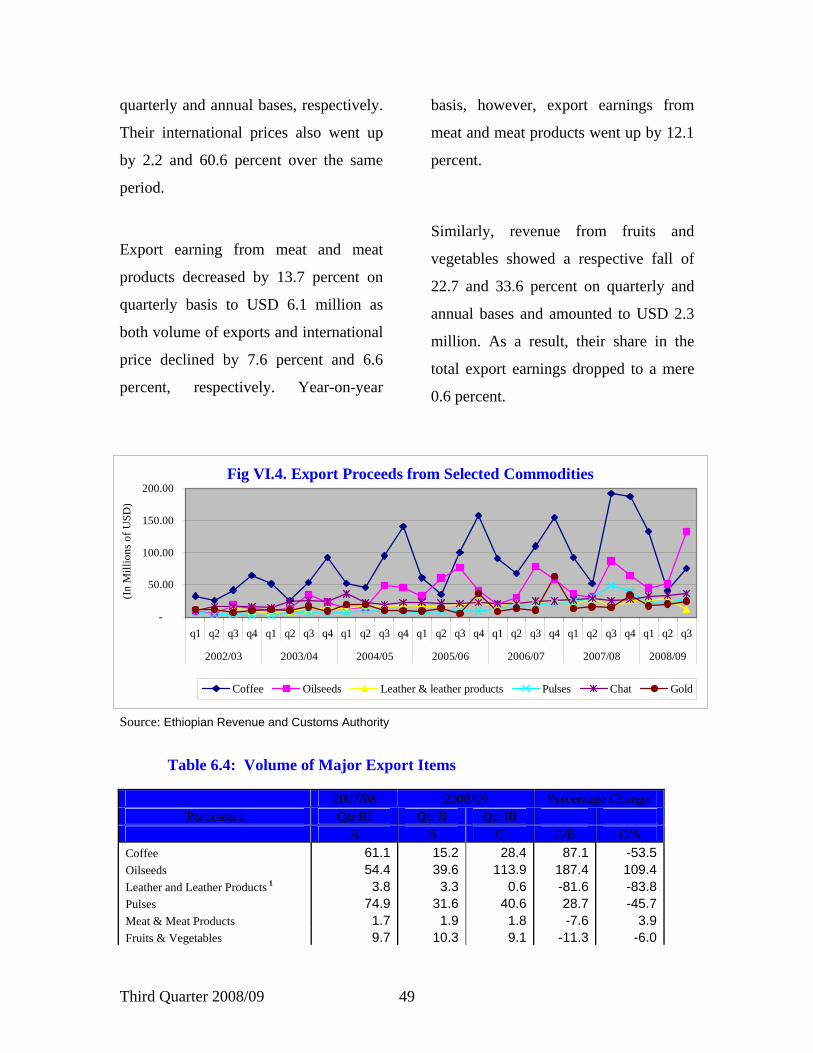
Table 6.4: Volume of Major Export Items
illions of Kg) 2007/08 2008/09 Percentage Change
Particulars Qtr III Qtr II Qtr III A B C C/B C/A
Coffee 61.1 15.2 28.4 87.1 -53.5Oilseeds 54.4 39.6 113.9 187.4 109.4Leather and Leather Products 1 3.8 3.3 0.6 -81.6 -83.8Pulses 74.9 31.6 40.6 28.7 -45.7Meat & Meat Products 1.7 1.9 1.8 -7.6 3.9Fruits & Vegetables 9.7 10.3 9.1 -11.3 -6.0
Third Quarter 2008/09 50
Live Animals 8.8 11.4 8.0 -29.9 -9.0Chat 5.0 6.8 6.3 -6.5 26.0Gold 0.0006 0.0011 0.0012 13.1 90.0Flower 6.1 6.6 8.8 32.8 45.2
Source: Ethiopian Revenue and Customs Authority 1 Previously known as hides and skin
Fig. VI. 5 Export Volume, Selected Commodties
0102030405060708090
100110120
q2 q3 q4 q1 q2 q3 q4 q1 q2 q3 q4 q1 q2 q3 q4 q1 q2 q3 q4 q1 q2 q3 q4 q1 q2 q3 q4 q1 q2 q3 q4 q1 q2 q3
2000/01 2001/02 2002/03 2003/04 2004/05 2005/06 2006/07 2007/08 2008/09
In M
illio
ns o
f Kg
Coffee Leather & Leather Products Chat Pulses Oilseeds
Source: Ethiopian Revenue and Customs Authority
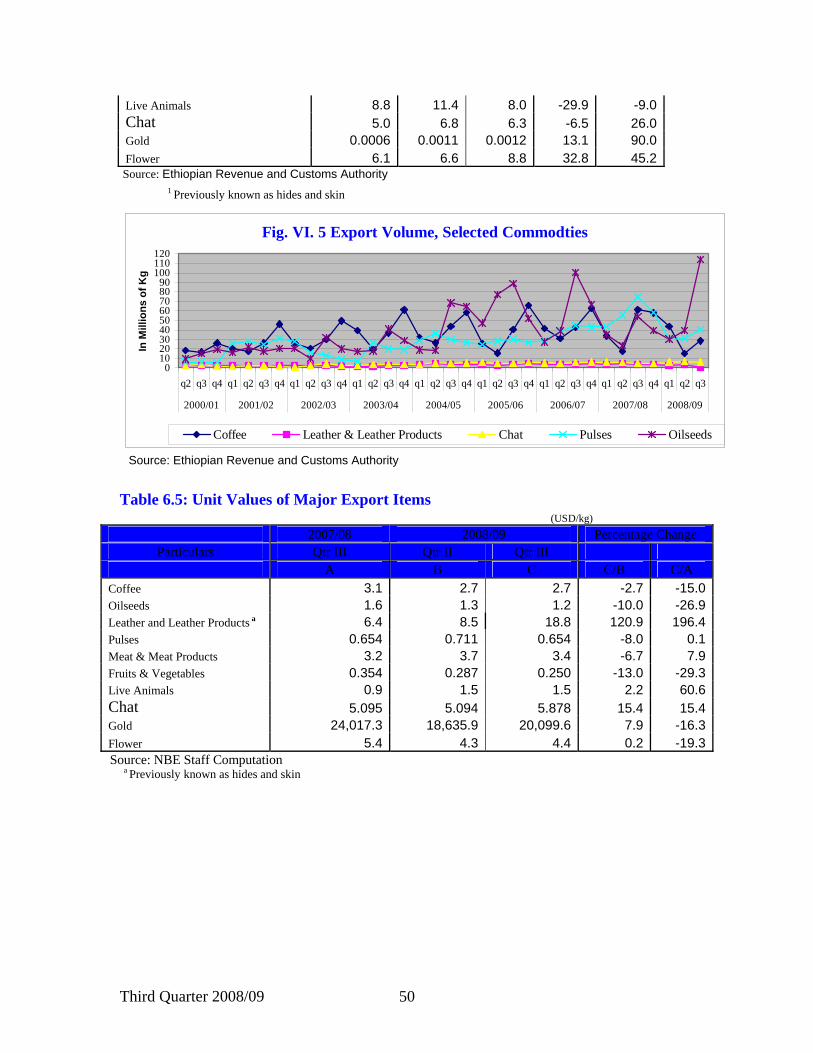
Table 6.5: Unit Values of Major Export Items (USD/kg)
2007/08 2008/09 Percentage Change Particulars Qtr III Qtr II Qtr III
A B C C/B C/A Coffee 3.1 2.7 2.7 -2.7 -15.0Oilseeds 1.6 1.3 1.2 -10.0 -26.9Leather and Leather Products a 6.4 8.5 18.8 120.9 196.4Pulses 0.654 0.711 0.654 -8.0 0.1Meat & Meat Products 3.2 3.7 3.4 -6.7 7.9Fruits & Vegetables 0.354 0.287 0.250 -13.0 -29.3Live Animals 0.9 1.5 1.5 2.2 60.6Chat 5.095 5.094 5.878 15.4 15.4Gold 24,017.3 18,635.9 20,099.6 7.9 -16.3Flower 5.4 4.3 4.4 0.2 -19.3 Source: NBE Staff Computation
a Previously known as hides and skin
Third Quarter 2008/09 51
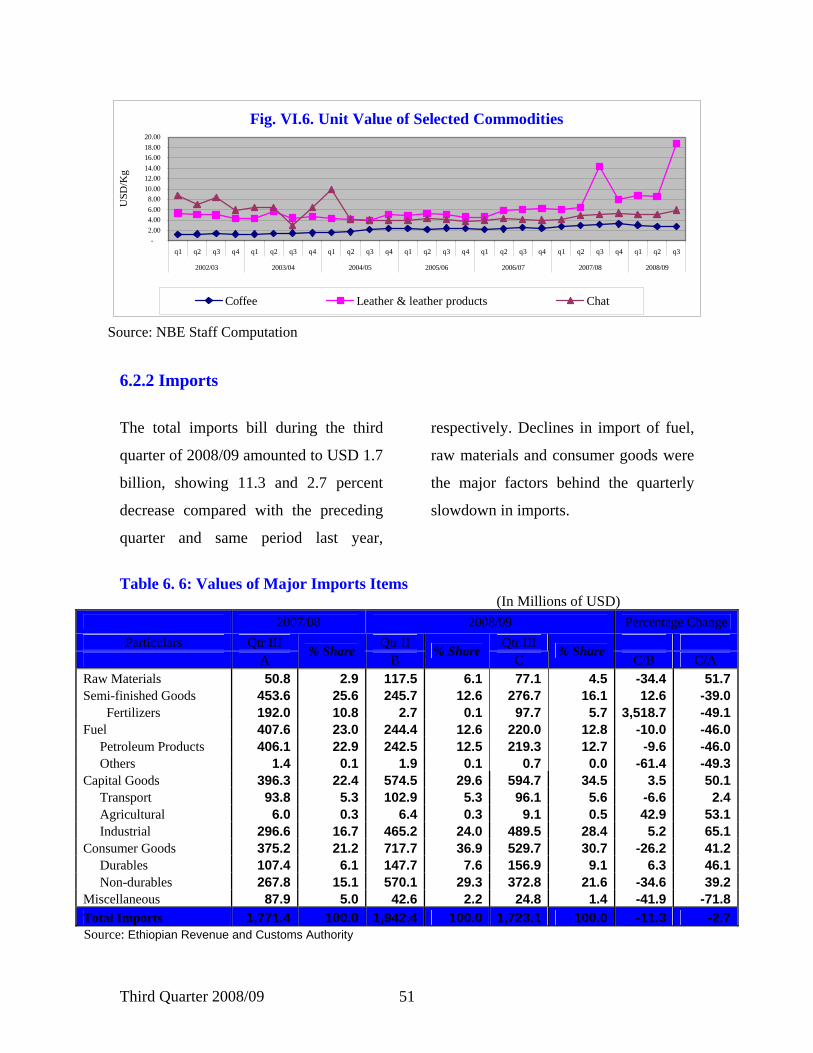
Fig. VI.6. Unit Value of Selected Commodities
-2.004.006.008.00
10.0012.0014.0016.0018.0020.00
q1 q2 q3 q4 q1 q2 q3 q4 q1 q2 q3 q4 q1 q2 q3 q4 q1 q2 q3 q4 q1 q2 q3 q4 q1 q2 q3
2002/03 2003/04 2004/05 2005/06 2006/07 2007/08 2008/09
USD
/Kg
Coffee Leather & leather products Chat
Source: NBE Staff Computation
6.2.2 Imports
The total imports bill during the third
quarter of 2008/09 amounted to USD 1.7
billion, showing 11.3 and 2.7 percent
decrease compared with the preceding
quarter and same period last year,
respectively. Declines in import of fuel,
raw materials and consumer goods were
the major factors behind the quarterly
slowdown in imports.
Table V.6: Values of Table 6. 6: Values of Major Imports Items (In Millions of USD)
2007/08 2008/09 Percentage Change Particulars Qtr III Qtr II Qtr III
A % Share
B % Share
C % Share
C/B C/A Raw Materials 50.8 2.9 117.5 6.1 77.1 4.5 -34.4 51.7Semi-finished Goods 453.6 25.6 245.7 12.6 276.7 16.1 12.6 -39.0 Fertilizers 192.0 10.8 2.7 0.1 97.7 5.7 3,518.7 -49.1Fuel 407.6 23.0 244.4 12.6 220.0 12.8 -10.0 -46.0 Petroleum Products 406.1 22.9 242.5 12.5 219.3 12.7 -9.6 -46.0 Others 1.4 0.1 1.9 0.1 0.7 0.0 -61.4 -49.3Capital Goods 396.3 22.4 574.5 29.6 594.7 34.5 3.5 50.1 Transport 93.8 5.3 102.9 5.3 96.1 5.6 -6.6 2.4 Agricultural 6.0 0.3 6.4 0.3 9.1 0.5 42.9 53.1 Industrial 296.6 16.7 465.2 24.0 489.5 28.4 5.2 65.1Consumer Goods 375.2 21.2 717.7 36.9 529.7 30.7 -26.2 41.2 Durables 107.4 6.1 147.7 7.6 156.9 9.1 6.3 46.1 Non-durables 267.8 15.1 570.1 29.3 372.8 21.6 -34.6 39.2Miscellaneous 87.9 5.0 42.6 2.2 24.8 1.4 -41.9 -71.8Total Imports 1,771.4 100.0 1,942.4 100.0 1,723.1 100.0 -11.3 -2.7Source: Ethiopian Revenue and Customs Authority
Third Quarter 2008/09 52
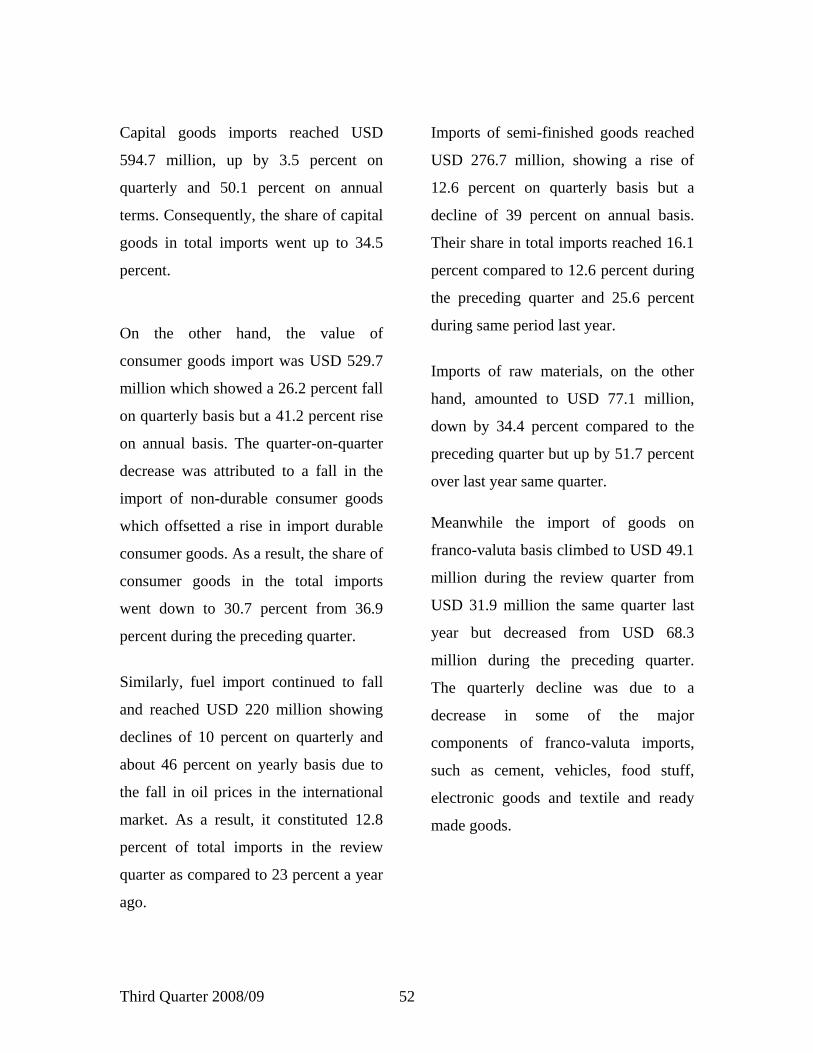
Capital goods imports reached USD
594.7 million, up by 3.5 percent on
quarterly and 50.1 percent on annual
terms. Consequently, the share of capital
goods in total imports went up to 34.5
percent.
On the other hand, the value of
consumer goods import was USD 529.7
million which showed a 26.2 percent fall
on quarterly basis but a 41.2 percent rise
on annual basis. The quarter-on-quarter
decrease was attributed to a fall in the
import of non-durable consumer goods
which offsetted a rise in import durable
consumer goods. As a result, the share of
consumer goods in the total imports
went down to 30.7 percent from 36.9
percent during the preceding quarter.
Similarly, fuel import continued to fall
and reached USD 220 million showing
declines of 10 percent on quarterly and
about 46 percent on yearly basis due to
the fall in oil prices in the international
market. As a result, it constituted 12.8
percent of total imports in the review
quarter as compared to 23 percent a year
ago.
Imports of semi-finished goods reached
USD 276.7 million, showing a rise of
12.6 percent on quarterly basis but a
decline of 39 percent on annual basis.
Their share in total imports reached 16.1
percent compared to 12.6 percent during
the preceding quarter and 25.6 percent
during same period last year.
Imports of raw materials, on the other
hand, amounted to USD 77.1 million,
down by 34.4 percent compared to the
preceding quarter but up by 51.7 percent
over last year same quarter.
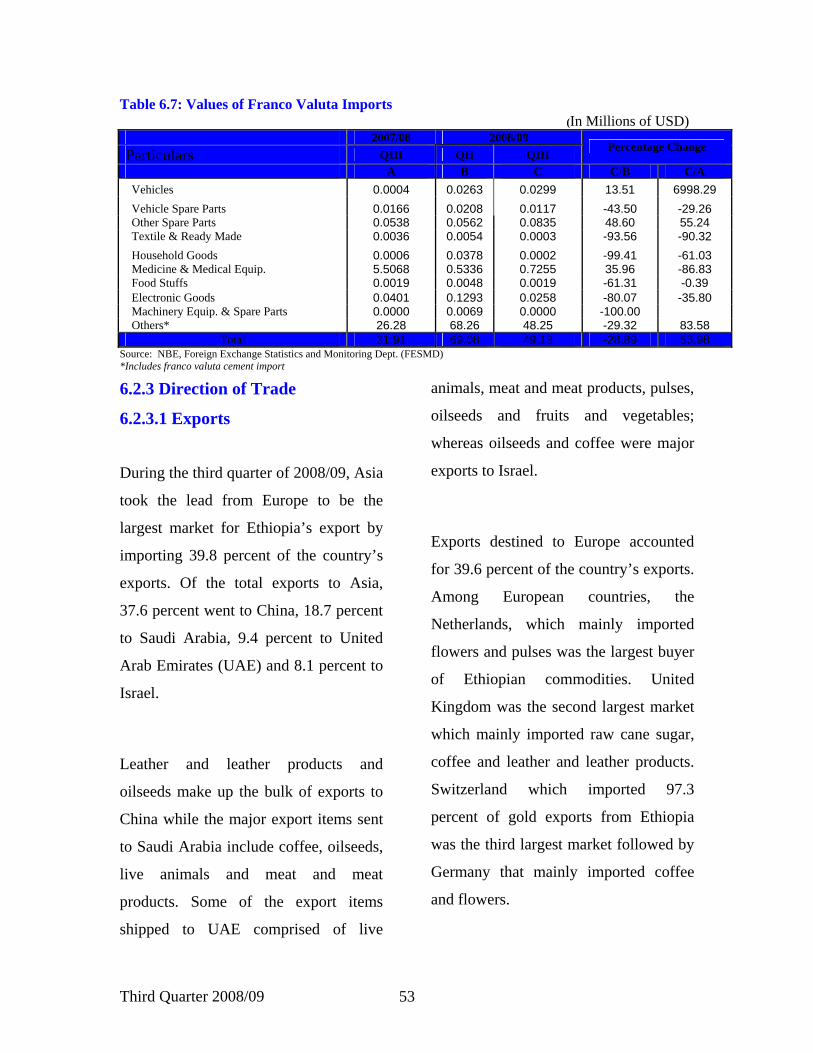
Meanwhile the import of goods on
franco-valuta basis climbed to USD 49.1
million during the review quarter from
USD 31.9 million the same quarter last
year but decreased from USD 68.3
million during the preceding quarter.
The quarterly decline was due to a
decrease in some of the major
components of franco-valuta imports,
such as cement, vehicles, food stuff,
electronic goods and textile and ready
made goods.
Third Quarter 2008/09 53
Table 6.7: Values of Franco Valuta Imports (In Millions of USD)
2007/08 2008/09 Particulars QIII QII QIII
Percentage Change
A B C C/B C/A Vehicles 0.0004 0.0263 0.0299 13.51 6998.29 Vehicle Spare Parts 0.0166 0.0208 0.0117 -43.50 -29.26 Other Spare Parts 0.0538 0.0562 0.0835 48.60 55.24 Textile & Ready Made 0.0036 0.0054 0.0003 -93.56 -90.32 Household Goods 0.0006 0.0378 0.0002 -99.41 -61.03 Medicine & Medical Equip. 5.5068 0.5336 0.7255 35.96 -86.83 Food Stuffs 0.0019 0.0048 0.0019 -61.31 -0.39 Electronic Goods 0.0401 0.1293 0.0258 -80.07 -35.80 Machinery Equip. & Spare Parts 0.0000 0.0069 0.0000 -100.00 Others* 26.28 68.26 48.25 -29.32 83.58
Total 31.91 69.08 49.13 -28.89 53.98 Source: NBE, Foreign Exchange Statistics and Monitoring Dept. (FESMD) *Includes franco valuta cement import
6.2.3 Direction of Trade
6.2.3.1 Exports
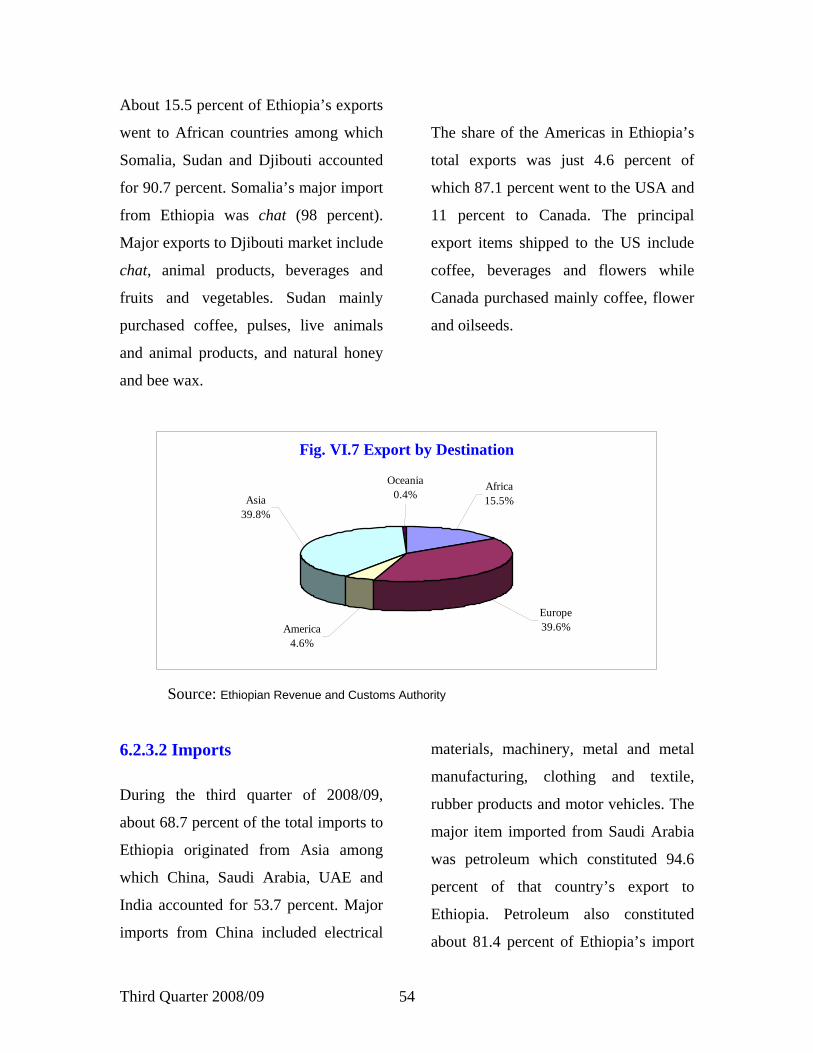
During the third quarter of 2008/09, Asia
took the lead from Europe to be the
largest market for Ethiopia’s export by
importing 39.8 percent of the country’s
exports. Of the total exports to Asia,
37.6 percent went to China, 18.7 percent
to Saudi Arabia, 9.4 percent to United
Arab Emirates (UAE) and 8.1 percent to
Israel.
Leather and leather products and
oilseeds make up the bulk of exports to
China while the major export items sent
to Saudi Arabia include coffee, oilseeds,
live animals and meat and meat
products. Some of the export items
shipped to UAE comprised of live
animals, meat and meat products, pulses,
oilseeds and fruits and vegetables;
whereas oilseeds and coffee were major
exports to Israel.
Exports destined to Europe accounted
for 39.6 percent of the country’s exports.
Among European countries, the
Netherlands, which mainly imported
flowers and pulses was the largest buyer
of Ethiopian commodities. United
Kingdom was the second largest market
which mainly imported raw cane sugar,
coffee and leather and leather products.
Switzerland which imported 97.3
percent of gold exports from Ethiopia
was the third largest market followed by
Germany that mainly imported coffee
and flowers.
Third Quarter 2008/09 54
About 15.5 percent of Ethiopia’s exports
went to African countries among which
Somalia, Sudan and Djibouti accounted
for 90.7 percent. Somalia’s major import
from Ethiopia was chat (98 percent).
Major exports to Djibouti market include
chat, animal products, beverages and
fruits and vegetables. Sudan mainly
purchased coffee, pulses, live animals
and animal products, and natural honey
and bee wax.
The share of the Americas in Ethiopia’s
total exports was just 4.6 percent of
which 87.1 percent went to the USA and
11 percent to Canada. The principal
export items shipped to the US include
coffee, beverages and flowers while
Canada purchased mainly coffee, flower
and oilseeds.
Fig. VI.7 Export by Destination
Asia39.8%
America4.6%
Europe39.6%
Africa15.5%
Oceania0.4%
Source: Ethiopian Revenue and Customs Authority
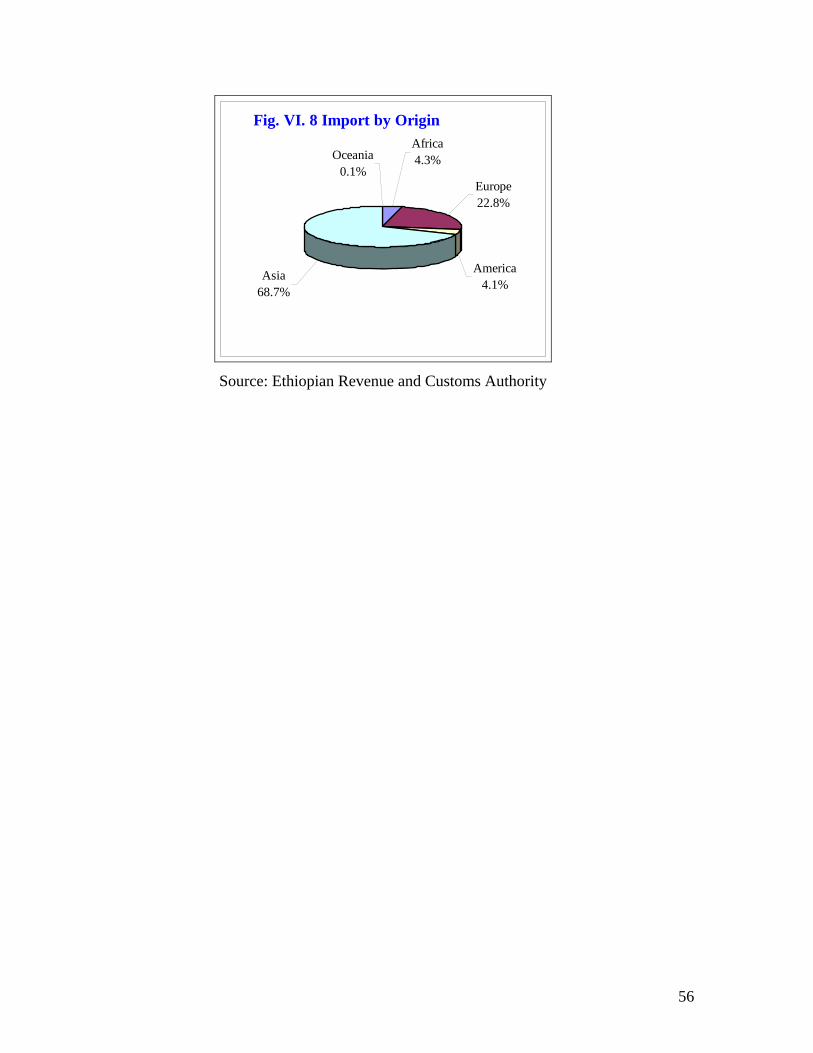
6.2.3.2 Imports
During the third quarter of 2008/09,
about 68.7 percent of the total imports to
Ethiopia originated from Asia among
which China, Saudi Arabia, UAE and
India accounted for 53.7 percent. Major
imports from China included electrical
materials, machinery, metal and metal
manufacturing, clothing and textile,
rubber products and motor vehicles. The
major item imported from Saudi Arabia
was petroleum which constituted 94.6
percent of that country’s export to
Ethiopia. Petroleum also constituted
about 81.4 percent of Ethiopia’s import
Third Quarter 2008/09 55
from UAE. Medical and pharmaceutical
products, machinery, electrical materials,
metals and metal products were the main
items imported from India.
Meanwhile, imports from Europe
accounted for 22.8 percent of total
imports among which Italy, Russia,
Turkey, Germany, Netherlands, France
and Romania were the major suppliers.
Import items from Italy comprised of
machinery, electrical materials, metal,
vehicles and grain. Russia mainly
exported fertilizer and grain which
constituted a respective 90.2 and 7.5
percent of that country’s export to
Ethiopia. Metal and metal products were
the principal import items from Turkey
constituting 67.4 percent of Ethiopia’s
import from that country. Similarly,
imports from Germany were mainly
electrical materials, vehicles and
machinery. The principal import items
from the Netherlands were medical and
pharmaceutical products. Import items
from France comprised of machinery,
electrical materials and vehicles,
whereas almost all imports from
Romania was grain.
The share of imports from the Americas
was 4.1 percent among which three
countries; namely, the USA, Canada and
Brazil accounted over 95 percent. Grain
and food products were the major import
items from the US followed by
machinery. Machineries were the main
items imported both from Canada and
Brazil.
The share of African countries from
total imports accounted 4.3 percent of
which 92.8 percent came from five
countries; namely, Egypt, Sudan, South
Africa, Libya and Kenya. Fertilizer,
petroleum products, soap and polish and
tobacco constituted the major import
items from African nations.
56
Fig. VI. 8 Import by OriginAfrica4.3%
Europe22.8%
America4.1%
Asia68.7%
Oceania0.1%
Source: Ethiopian Revenue and Customs Authority

Third Quarter 2008/09 56
6.3 Services and Transfers
During the third quarter of 2008/09, the
surplus in the service account went down
by 38 percent to USD 103.4 million
compared with the preceding quarter.
This quarterly decline in the surplus of
the service account was the result of 56.2
and 18.9 percent fall in net receipts from
transportation and government services,
respectively coupled with a surge in net
payments for other services by 94.8
percent.
On annual basis, the surplus in the
service account in the review quarter
went up by 74.7 percent due to the surge
in net receipts from travel, transportation
and government services.
Fig VI.9. Trends in Net Services
-50
0
50
100
150
200
Qtr
IQ
tr II
Qtr
III
Qtr
IVQ
tr I
Qtr
IIQ
tr II
IQ
tr IV
Qtr
IQ
tr II
Qtr
III
Qtr
IVQ
tr I
Qtr
IIQ
tr II
IQ
tr IV
Qtr
IQ
tr II
Qtr
III
Qtr
IVQ
tr I
Qtr
IIQ
tr II
IQ
tr IV
Qtr
IQ
tr II
Qtr
III
2002/03 2003/04 2004/05 2005/06 2006/07 2007/08 2008/09
mill
ion
USD
Total Service
Travel
Transportation
Government
Source: NBE Staff Computation
Table 6.8: Trends in Service Accounts (In Millions of USD)
2007/08 2008/09 Percentage
Change Qtr III Qtr II Qtr III
Particulars A %
Share B % Share C %
Share C/B C/A
Receipts 415.5 100.0 574.7 100.0 438.6 100.0 -23.7 5.6

Third Quarter 2008/09 57
Travel 79.7 19.2 87.2 15.2 89.5 20.4 2.7 12.3 Transportation 208.4 50.1 308.1 53.6 205.8 46.9 -33.2 -1.3 Government (n.i.e) 32.3 7.8 68.4 11.9 50.8 11.6 -25.7 57.2 Investment Income 10.9 2.6 4.8 0.8 2.9 0.7 -38.9 -73.3 Interest 10.9 2.6 4.8 0.8 2.9 0.7 -38.9 -73.3 Dividend 0.0 0.0 0.0 0.0 0.0 0.0 - - Other Services 84.2 20.3 106.2 18.5 89.6 20.4 -15.6 6.4 Communication Services 18.4 4.4 23.9 4.2 23.6 5.4 -1.3 28.3 Construction Services 3.6 0.9 8.1 1.4 5.1 1.2 -36.6 42.9 Insurance Services 0.5 0.1 0.1 0.0 0.0 0.0 -50.1 -93.6 Financial Services 2.3 0.6 14.4 2.5 8.9 2.0 -37.7 291.4 Computer and Information Service 0.1 0.0 1.3 0.2 0.2 0.0 -86.6 151.6 Other Business Services 59.3 14.3 58.3 10.1 51.7 11.8 -11.3 -12.8 Personal, Cultural and Recreational 0.0 0.0 0.2 0.0 0.0 0.0 - - Payments 356.3 100.0 408.2 100.0 335.2 100.0 -17.9 -5.9 Travel 37.0 10.4 38.0 9.3 31.8 9.5 -16.5 -14.0 Transportation 186.5 52.3 224.1 54.9 169.0 50.4 -24.6 -9.4 Government (n.i.e) 11.8 3.3 8.0 2.0 1.9 0.6 -76.9 -84.3 Investment Income 3.0 0.9 14.3 3.5 9.0 2.7 -37.6 193.7 Interest 1.5 0.4 6.3 1.5 3.3 1.0 -47.0 125.4 cash (Banks & MOF) 1.5 0.4 6.3 1.5 3.3 1.0 -47.0 125.4 arrears 0.0 0.0 0.0 0.0 0.0 0.0 - - relief 0.0 0.0 0.0 0.0 0.0 0.0 - - Dividend 1.6 0.4 8.1 2.0 5.6 1.7 -30.2 257.5Other Services 118.1 33.1 123.7 30.3 123.7 36.9 0.0 4.7 Communication Services 4.4 1.2 3.8 0.9 4.7 1.4 22.9 6.8 Construction Services 39.6 11.1 80.9 19.8 88.8 26.5 9.8 124.1 Insurance Services 1.7 0.5 1.1 0.3 1.3 0.4 19.6 -25.8 Financial Services 0.0 0.0 0.1 0.0 0.3 0.1 256.1 793.5 Computer and Information Service 1.0 0.3 1.0 0.2 2.0 0.6 104.1 97.3 Other Business Services 71.3 20.0 36.9 9.0 26.6 7.9 -27.9 -62.7 Personal, Cultural and Recreational 0.0 0.0 0.0 0.0 0.0 0.0 - - Net Services 59.2 166.5 103.4 -37.9 74.7
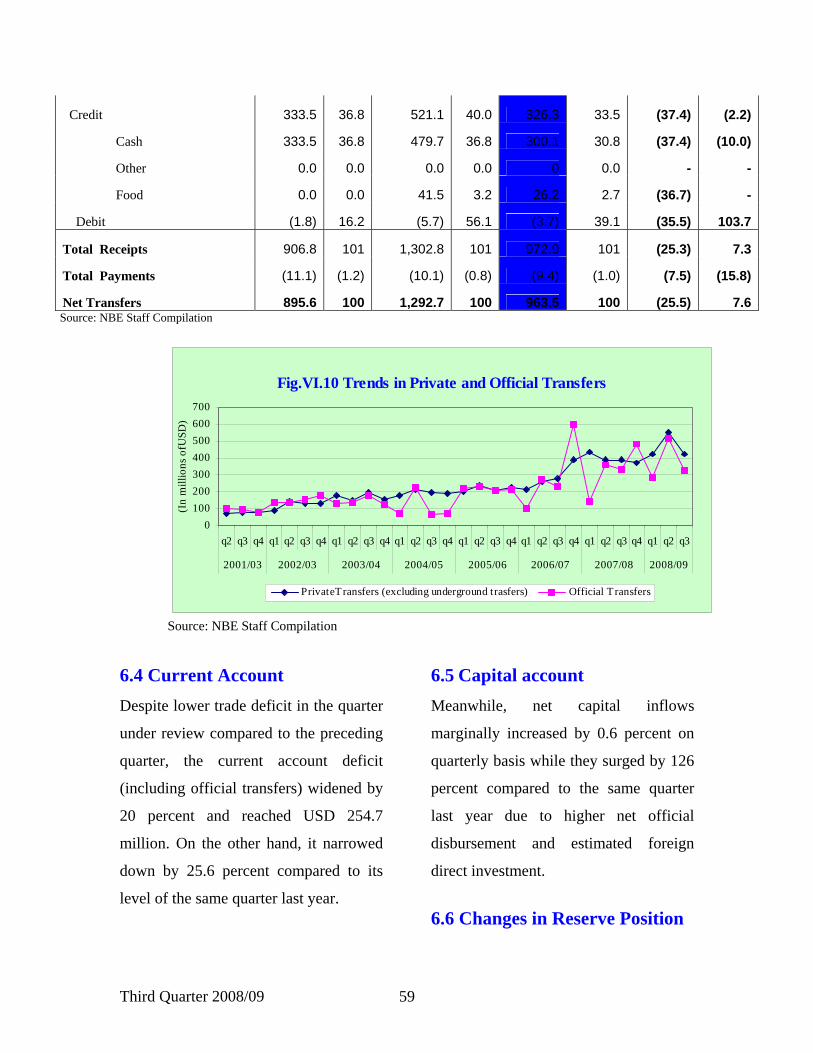
Source: NBE Staff Compilation Total net transfers went down by 25.5
percent compared to the preceding
quarter due to 37.4 percent decline in net
official transfers. Of the total official
transfers, only 8 percent was food
transfers while the rest was in cash.
On the other hand, net private transfers
(including transfers through NGOs) fell
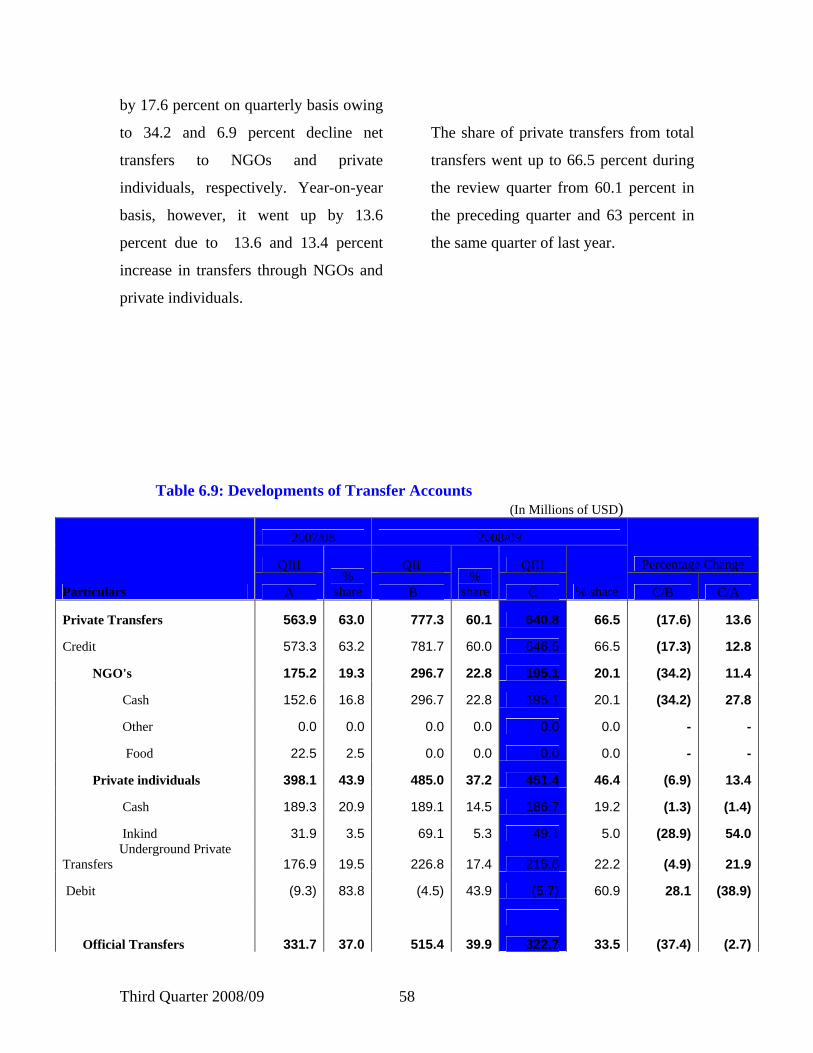
Third Quarter 2008/09 58
by 17.6 percent on quarterly basis owing
to 34.2 and 6.9 percent decline net
transfers to NGOs and private
individuals, respectively. Year-on-year
basis, however, it went up by 13.6
percent due to 13.6 and 13.4 percent
increase in transfers through NGOs and
private individuals.
The share of private transfers from total
transfers went up to 66.5 percent during
the review quarter from 60.1 percent in
the preceding quarter and 63 percent in
the same quarter of last year.
Table 6.9: Developments of Transfer Accounts (In Millions of USD)
2007/08 2008/09
QIII QII QIII Percentage Change
Particulars A %
share B %
share C % share C/B C/A
Private Transfers 563.9 63.0 777.3 60.1 640.8 66.5 (17.6) 13.6
Credit 573.3 63.2 781.7 60.0 646.5 66.5 (17.3) 12.8
NGO's 175.2 19.3 296.7 22.8 195.1 20.1 (34.2) 11.4
Cash 152.6 16.8 296.7 22.8 195.1 20.1 (34.2) 27.8
Other 0.0 0.0 0.0 0.0 0.0 0.0 - -
Food 22.5 2.5 0.0 0.0 0.0 0.0 - -
Private individuals 398.1 43.9 485.0 37.2 451.4 46.4 (6.9) 13.4
Cash 189.3 20.9 189.1 14.5 186.7 19.2 (1.3) (1.4)
Inkind 31.9 3.5 69.1 5.3 49.1 5.0 (28.9) 54.0 Underground Private Transfers 176.9 19.5 226.8 17.4 215.6 22.2 (4.9) 21.9
Debit (9.3) 83.8 (4.5) 43.9 (5.7) 60.9 28.1 (38.9)
Official Transfers 331.7 37.0 515.4 39.9 322.7 33.5 (37.4) (2.7)
Third Quarter 2008/09 59
Credit 333.5 36.8 521.1 40.0 326.3 33.5 (37.4) (2.2)
Cash 333.5 36.8 479.7 36.8 300.1 30.8 (37.4) (10.0)
Other 0.0 0.0 0.0 0.0 0 0.0 - -
Food 0.0 0.0 41.5 3.2 26.2 2.7 (36.7) -
Debit (1.8) 16.2 (5.7) 56.1 (3.7) 39.1 (35.5) 103.7
Total Receipts 906.8 101 1,302.8 101 972.9 101 (25.3) 7.3
Total Payments (11.1) (1.2) (10.1) (0.8) (9.4) (1.0) (7.5) (15.8)
Net Transfers 895.6 100 1,292.7 100 963.5 100 (25.5) 7.6 Source: NBE Staff Compilation
Fig.VI.10 Trends in Private and Official Transfers
0100200300400500600700
q2 q3 q4 q1 q2 q3 q4 q1 q2 q3 q4 q1 q2 q3 q4 q1 q2 q3 q4 q1 q2 q3 q4 q1 q2 q3 q4 q1 q2 q3
2001/03 2002/03 2003/04 2004/05 2005/06 2006/07 2007/08 2008/09
(In
mill
ions
ofU
SD)
PrivateTransfers (excluding underground trasfers) Official T ransfers
Source: NBE Staff Compilation
6.4 Current Account
Despite lower trade deficit in the quarter
under review compared to the preceding
quarter, the current account deficit
(including official transfers) widened by
20 percent and reached USD 254.7
million. On the other hand, it narrowed
down by 25.6 percent compared to its
level of the same quarter last year.
6.5 Capital account
Meanwhile, net capital inflows
marginally increased by 0.6 percent on
quarterly basis while they surged by 126
percent compared to the same quarter
last year due to higher net official
disbursement and estimated foreign
direct investment.
6.6 Changes in Reserve Position
Third Quarter 2008/09 60
As a result of the surplus in the overall
balance of payments, the foreign
exchange reserves of the banking system
increased on quarterly basis. Net foreign
assets of NBE increased by USD 245
million while that of commercial banks
went up by USD 64.9 million.
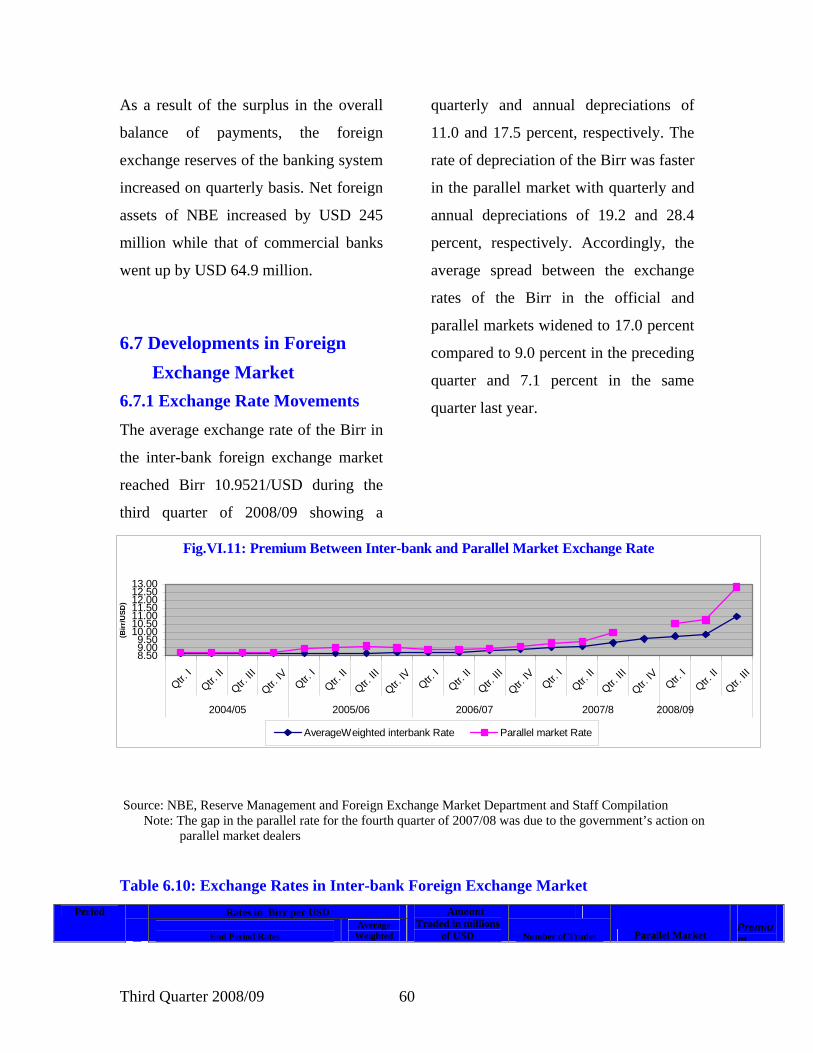
6.7 Developments in Foreign Exchange Market 6.7.1 Exchange Rate Movements
The average exchange rate of the Birr in
the inter-bank foreign exchange market
reached Birr 10.9521/USD during the
third quarter of 2008/09 showing a
quarterly and annual depreciations of
11.0 and 17.5 percent, respectively. The
rate of depreciation of the Birr was faster
in the parallel market with quarterly and
annual depreciations of 19.2 and 28.4
percent, respectively. Accordingly, the
average spread between the exchange
rates of the Birr in the official and
parallel markets widened to 17.0 percent
compared to 9.0 percent in the preceding
quarter and 7.1 percent in the same
quarter last year.
Fig.VI.11: Premium Between Inter-bank and Parallel Market Exchange Rate
8.509.009.50
10.0010.5011.0011.5012.0012.5013.00
Qtr. I
Qtr. II
Qtr. III
Qtr. IV
Qtr. I
Qtr. II
Qtr. III
Qtr. IV
Qtr. I
Qtr. II
Qtr. III
Qtr. IV
Qtr. I
Qtr. II
Qtr. III
Qtr. IV
Qtr. I
Qtr. II
Qtr. III
2004/05 2005/06 2006/07 2007/8 2008/09
(Birr
/USD
)
AverageWeighted interbank Rate Parallel market Rate
Source: NBE, Reserve Management and Foreign Exchange Market Department and Staff Compilation Note: The gap in the parallel rate for the fourth quarter of 2007/08 was due to the government’s action on
parallel market dealers
Table 6.10: Exchange Rates in Inter-bank Foreign Exchange Market
Rates in Birr per USD Period
End Period Rates Average
Weighted
Amount Traded in millions
of USD Number of Trades Parallel Market Premium
Third Quarter 2008/09 61
Weighted
Rate Highest Lowest
Rate
Total
o/w Among
CBs Total
o/w Among
CBs End Period Average
m
2007/08
Qtr. III C 9.4925 9.4935 9.4917 9.3192 28.9 0.0 512 0.0 10.3300 9.9822 7.11
January 9.2436 9.2436 9.2401 9.2113 11.50 0.0 166 0.0 9.8000 9.6773 5.06
February 9.3402 9.3402 9.3357 9.2937 10.50 0.0 183 0.0 10.2150 9.9393 6.95 March 9.4925 9.4935 9.4917 9.4526 6.85 0.0 163 0.0 10.3300 9.28
2008/09 Qtr. II B 9.9566 9.9566 9.9566 9.8670 6.0 0.0 531 0.0 11.4000 10.7540 8.99
October 9.9040 9.9040 9.9040 9.7456 2.3 0.0 203 10.6750 10.5160 7.91
November 9.9238 9.9238 9.9238 9.9144 2.0 0.0 181 0.0 10.7000 10.6630 7.55
December 9.9566 9.9566 9.9566 9.9409 1.7 0.0 147 0.0 11.4000 11.0830 11.49
Qtr. III A 11.1109 11.1109 11.1109 10.9521 3.0 0.0 387 0.0 13.4000 12.8163 17.02
January 11.0181 11.0181 11.0181 10.7380 1.00 0.00 119 0.0 12.4000 12.2640 14.21
February 11.0527 11.0527 11.0527 11.0364 1.00 0.00 129 0.0 13.1000 12.9500 17.34
March 11.1109 11.1109 11.1109 11.0820 1.00 0.00 139 0.0 13.4000 13.2350 19.43 A/B 11.59 11.59 12.59 11.00 -50.00 -27.12 17.54 19.18 89.34
Percentage changes
A/C 17.05 17.04 17.06 17.52 -89.60 -24.41 29.72 28.39 139.35
Source: NBE Reserve Management and Foreign Exchange Market Department and Staff Compilation
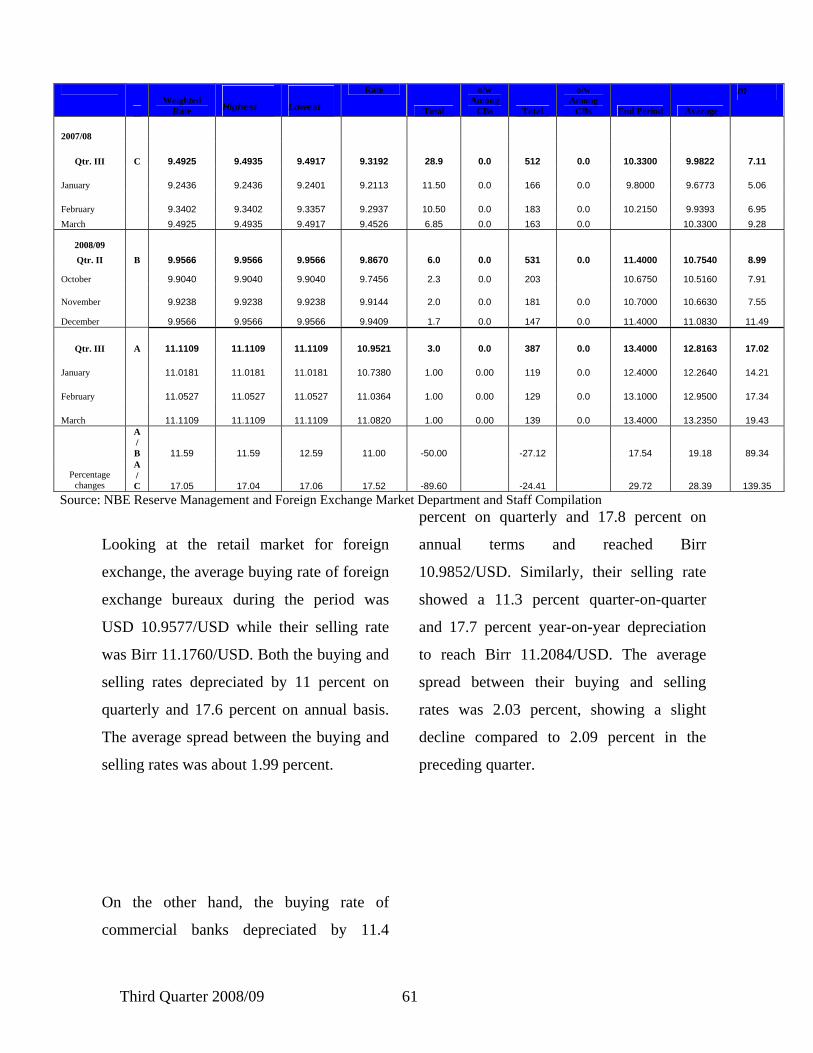
Looking at the retail market for foreign
exchange, the average buying rate of foreign
exchange bureaux during the period was
USD 10.9577/USD while their selling rate
was Birr 11.1760/USD. Both the buying and
selling rates depreciated by 11 percent on
quarterly and 17.6 percent on annual basis.
The average spread between the buying and
selling rates was about 1.99 percent.
On the other hand, the buying rate of
commercial banks depreciated by 11.4
percent on quarterly and 17.8 percent on
annual terms and reached Birr
10.9852/USD. Similarly, their selling rate
showed a 11.3 percent quarter-on-quarter
and 17.7 percent year-on-year depreciation
to reach Birr 11.2084/USD. The average
spread between their buying and selling
rates was 2.03 percent, showing a slight
decline compared to 2.09 percent in the
preceding quarter.
Third Quarter 2008/09 62
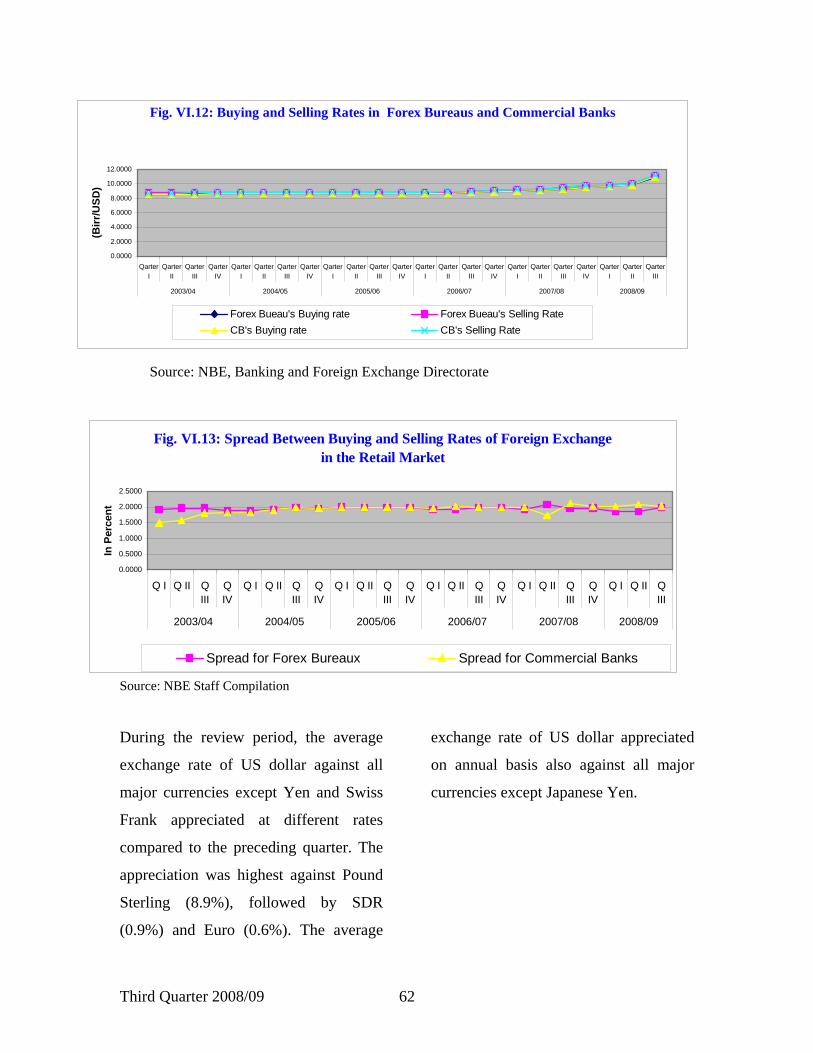
Fig. VI.12: Buying and Selling Rates in Forex Bureaus and Commercial Banks
0.0000
2.0000
4.0000
6.0000
8.0000
10.0000
12.0000
QarterI
QarterII
QarterIII
QarterIV
QarterI
QarterII
QarterIII
QarterIV
QarterI
QarterII
QarterIII
QarterIV
QarterI
QarterII
QarterIII
QarterIV
QarterI
QarterII
QarterIII
QarterIV
QarterI
QarterII
QarterIII
2003/04 2004/05 2005/06 2006/07 2007/08 2008/09
(Birr
/USD
)
Forex Bueau's Buying rate Forex Bueau's Selling Rate CB's Buying rate CB's Selling Rate
Source: NBE, Banking and Foreign Exchange Directorate
Fig. VI.13: Spread Between Buying and Selling Rates of Foreign Exchange in the Retail Market
0.0000
0.5000
1.0000
1.5000
2.0000
2.5000
Q I Q II QIII
QIV
Q I Q II QIII
QIV
Q I Q II QIII
QIV
Q I Q II QIII
QIV
Q I Q II QIII
QIV
Q I Q II QIII
2003/04 2004/05 2005/06 2006/07 2007/08 2008/09
In P
erce
nt
Spread for Forex Bureaux Spread for Commercial Banks
Source: NBE Staff Compilation
During the review period, the average
exchange rate of US dollar against all
major currencies except Yen and Swiss
Frank appreciated at different rates
compared to the preceding quarter. The
appreciation was highest against Pound
Sterling (8.9%), followed by SDR
(0.9%) and Euro (0.6%). The average
exchange rate of US dollar appreciated
on annual basis also against all major
currencies except Japanese Yen.
Third Quarter 2008/09 63
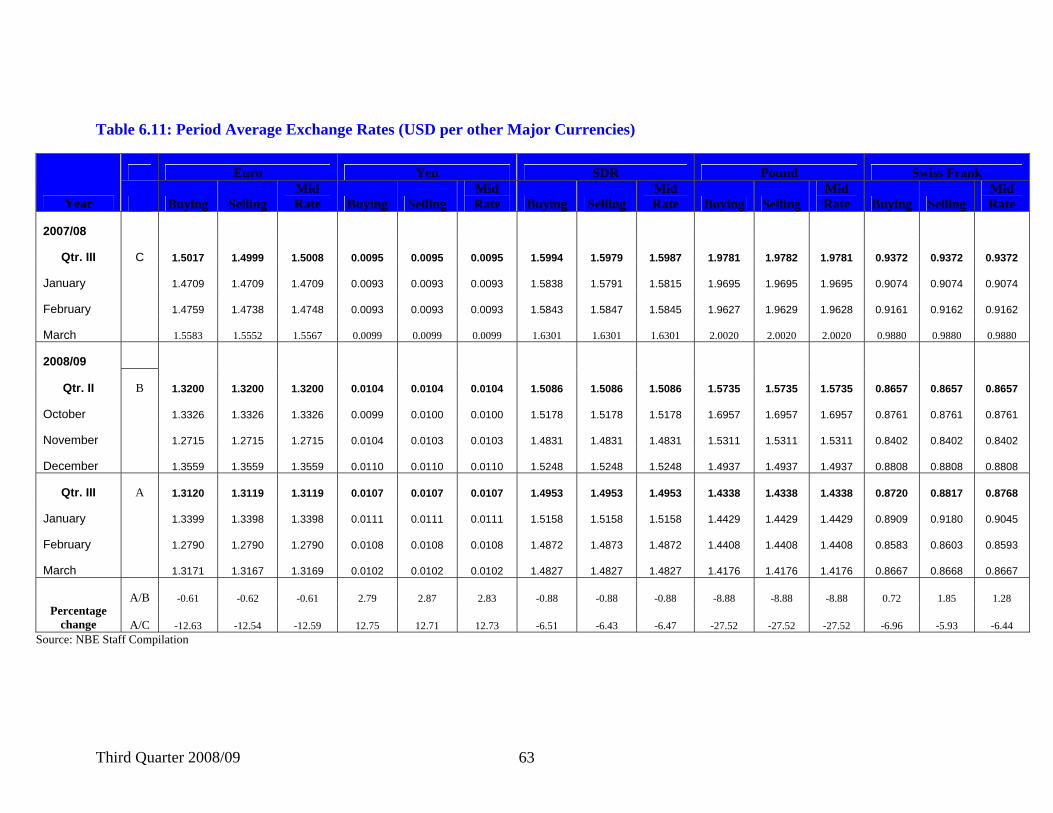
Table 6.11: Period Average Exchange Rates (USD per other Major Currencies)
Euro Yen SDR Pound Swiss Frank
Year Buying Selling Mid Rate Buying Selling
Mid Rate Buying Selling
Mid Rate Buying Selling
Mid Rate Buying Selling
Mid Rate
2007/08
Qtr. III C 1.5017 1.4999 1.5008 0.0095 0.0095 0.0095 1.5994 1.5979 1.5987 1.9781 1.9782 1.9781 0.9372 0.9372 0.9372
January 1.4709 1.4709 1.4709 0.0093 0.0093 0.0093 1.5838 1.5791 1.5815 1.9695 1.9695 1.9695 0.9074 0.9074 0.9074
February 1.4759 1.4738 1.4748 0.0093 0.0093 0.0093 1.5843 1.5847 1.5845 1.9627 1.9629 1.9628 0.9161 0.9162 0.9162
March 1.5583 1.5552 1.5567 0.0099 0.0099 0.0099 1.6301 1.6301 1.6301 2.0020 2.0020 2.0020 0.9880 0.9880 0.9880
2008/09
Qtr. II B 1.3200 1.3200 1.3200 0.0104 0.0104 0.0104 1.5086 1.5086 1.5086 1.5735 1.5735 1.5735 0.8657 0.8657 0.8657
October 1.3326 1.3326 1.3326 0.0099 0.0100 0.0100 1.5178 1.5178 1.5178 1.6957 1.6957 1.6957 0.8761 0.8761 0.8761
November 1.2715 1.2715 1.2715 0.0104 0.0103 0.0103 1.4831 1.4831 1.4831 1.5311 1.5311 1.5311 0.8402 0.8402 0.8402
December 1.3559 1.3559 1.3559 0.0110 0.0110 0.0110 1.5248 1.5248 1.5248 1.4937 1.4937 1.4937 0.8808 0.8808 0.8808
Qtr. III A 1.3120 1.3119 1.3119 0.0107 0.0107 0.0107 1.4953 1.4953 1.4953 1.4338 1.4338 1.4338 0.8720 0.8817 0.8768
January 1.3399 1.3398 1.3398 0.0111 0.0111 0.0111 1.5158 1.5158 1.5158 1.4429 1.4429 1.4429 0.8909 0.9180 0.9045
February 1.2790 1.2790 1.2790 0.0108 0.0108 0.0108 1.4872 1.4873 1.4872 1.4408 1.4408 1.4408 0.8583 0.8603 0.8593
March 1.3171 1.3167 1.3169 0.0102 0.0102 0.0102 1.4827 1.4827 1.4827 1.4176 1.4176 1.4176 0.8667 0.8668 0.8667
A/B -0.61 -0.62 -0.61 2.79 2.87 2.83 -0.88 -0.88 -0.88 -8.88 -8.88 -8.88 0.72 1.85 1.28 Percentage
change A/C -12.63 -12.54 -12.59 12.75 12.71 12.73 -6.51 -6.43 -6.47 -27.52 -27.52 -27.52 -6.96 -5.93 -6.44 Source: NBE Staff Compilation
Third Quarter 2008/09 64
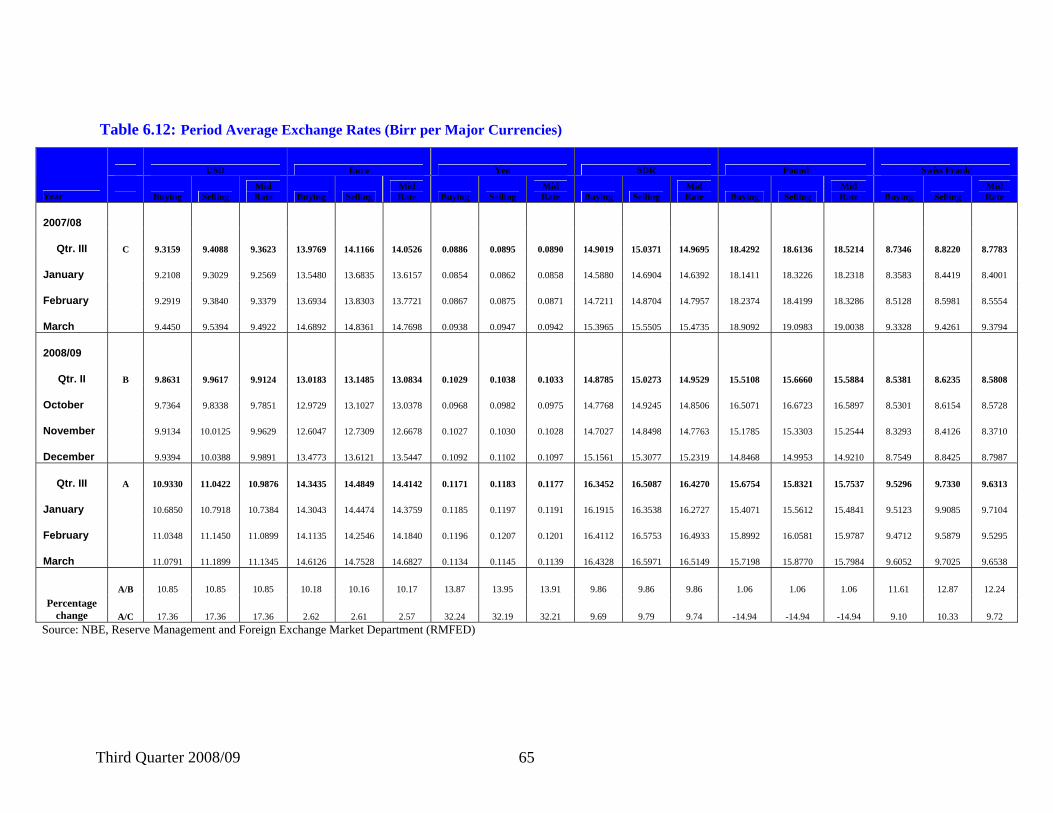
On the other hand, the Birr depreciated
against all major currencies on quarterly
basis as well as on annual terms. The
annual depreciation was highest against
Japanese Yen (32.2%) followed by USD
(17.4%), SDR (9.7%), Swiss Frank
(9.7%) and Euro (2.6 %).
Third Quarter 2008/09 65
Table 6.12: Period Average Exchange Rates (Birr per Major Currencies)
USD Euro Yen SDR Pound Swiss Frank
Year Buying Selling Mid Rate Buying Selling
Mid Rate Buying Selling
Mid Rate Buying Selling
Mid Rate Buying Selling
Mid Rate Buying Selling
Mid Rate
2007/08
Qtr. III C 9.3159 9.4088 9.3623 13.9769 14.1166 14.0526 0.0886 0.0895 0.0890 14.9019 15.0371 14.9695 18.4292 18.6136 18.5214 8.7346 8.8220 8.7783
January 9.2108 9.3029 9.2569 13.5480 13.6835 13.6157 0.0854 0.0862 0.0858 14.5880 14.6904 14.6392 18.1411 18.3226 18.2318 8.3583 8.4419 8.4001
February 9.2919 9.3840 9.3379 13.6934 13.8303 13.7721 0.0867 0.0875 0.0871 14.7211 14.8704 14.7957 18.2374 18.4199 18.3286 8.5128 8.5981 8.5554
March 9.4450 9.5394 9.4922 14.6892 14.8361 14.7698 0.0938 0.0947 0.0942 15.3965 15.5505 15.4735 18.9092 19.0983 19.0038 9.3328 9.4261 9.3794
2008/09
Qtr. II B 9.8631 9.9617 9.9124 13.0183 13.1485 13.0834 0.1029 0.1038 0.1033 14.8785 15.0273 14.9529 15.5108 15.6660 15.5884 8.5381 8.6235 8.5808
October 9.7364 9.8338 9.7851 12.9729 13.1027 13.0378 0.0968 0.0982 0.0975 14.7768 14.9245 14.8506 16.5071 16.6723 16.5897 8.5301 8.6154 8.5728
November 9.9134 10.0125 9.9629 12.6047 12.7309 12.6678 0.1027 0.1030 0.1028 14.7027 14.8498 14.7763 15.1785 15.3303 15.2544 8.3293 8.4126 8.3710
December 9.9394 10.0388 9.9891 13.4773 13.6121 13.5447 0.1092 0.1102 0.1097 15.1561 15.3077 15.2319 14.8468 14.9953 14.9210 8.7549 8.8425 8.7987
Qtr. III A 10.9330 11.0422 10.9876 14.3435 14.4849 14.4142 0.1171 0.1183 0.1177 16.3452 16.5087 16.4270 15.6754 15.8321 15.7537 9.5296 9.7330 9.6313
January 10.6850 10.7918 10.7384 14.3043 14.4474 14.3759 0.1185 0.1197 0.1191 16.1915 16.3538 16.2727 15.4071 15.5612 15.4841 9.5123 9.9085 9.7104
February 11.0348 11.1450 11.0899 14.1135 14.2546 14.1840 0.1196 0.1207 0.1201 16.4112 16.5753 16.4933 15.8992 16.0581 15.9787 9.4712 9.5879 9.5295
March 11.0791 11.1899 11.1345 14.6126 14.7528 14.6827 0.1134 0.1145 0.1139 16.4328 16.5971 16.5149 15.7198 15.8770 15.7984 9.6052 9.7025 9.6538
A/B 10.85 10.85 10.85 10.18 10.16 10.17 13.87 13.95 13.91 9.86 9.86 9.86 1.06 1.06 1.06 11.61 12.87 12.24 Percentage
change A/C 17.36 17.36 17.36 2.62 2.61 2.57 32.24 32.19 32.21 9.69 9.79 9.74 -14.94 -14.94 -14.94 9.10 10.33 9.72 Source: NBE, Reserve Management and Foreign Exchange Market Department (RMFED)
Third Quarter 2008/09 66
Table 6. 13 Birr per Unit of Currency End Period Mid Market Rate
Mar-08 Dec-08 Mar-09 Percentage change
Currency C B C C/B C/A
USD 9.5391 10.0049 11.1637 11.6 17.0
Pound 19.0104 14.4451 15.9652 10.5 -16.0
Swedish Kroner 1.6041 1.2896 1.3491 4.6 -15.9
Djibouti Frank 0.0537 0.0563 0.0628 11.5 16.9
Swiss Frank 9.5726 9.4591 9.7397 3.0 1.7
Saudi Riyal 2.5424 2.6652 2.9766 11.7 17.1
UAE Dirham 2.5971 2.7236 3.0392 11.6 17.0
Canadian Dollar 9.3383 8.2088 8.8756 8.1 -5.0
Japanese Yen 0.0957 0.1107 0.1138 2.8 18.9
Euro 15.0679 14.1009 14.7852 4.9 -1.9
SDR 15.7012 15.4856 16.6347 7.4 5.9 Source: National Bank of Ethiopia –BFED
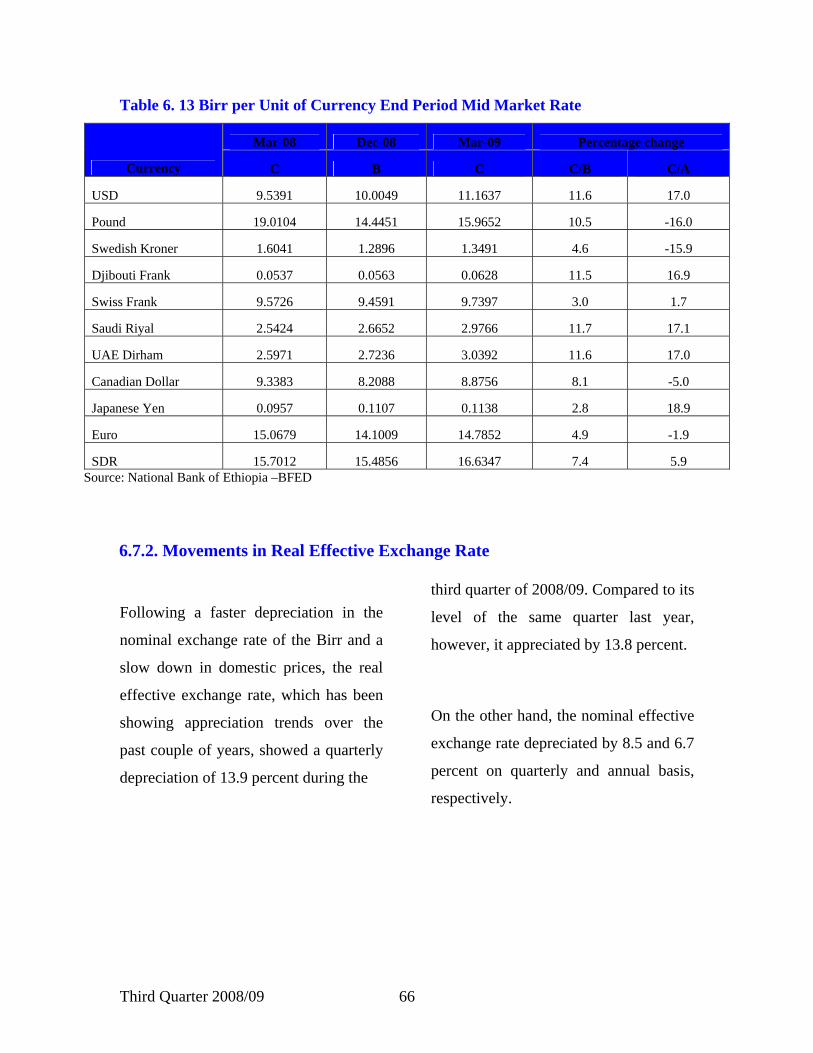
6.7.2. Movements in Real Effective Exchange Rate
Following a faster depreciation in the
nominal exchange rate of the Birr and a
slow down in domestic prices, the real
effective exchange rate, which has been
showing appreciation trends over the
past couple of years, showed a quarterly
depreciation of 13.9 percent during the
third quarter of 2008/09. Compared to its
level of the same quarter last year,
however, it appreciated by 13.8 percent.
On the other hand, the nominal effective
exchange rate depreciated by 8.5 and 6.7
percent on quarterly and annual basis,
respectively.
Third Quarter 2008/09 67
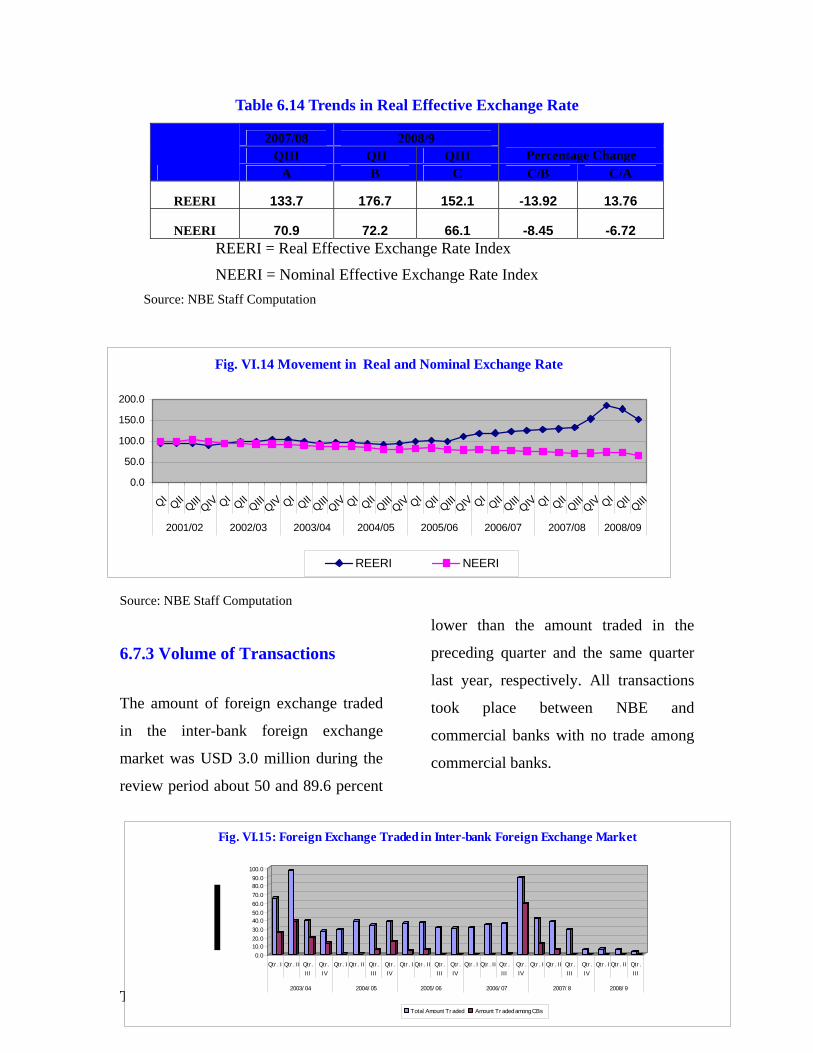
Table 6.14 Trends in Real Effective Exchange Rate
2007/08 2008/9 QIII QII QIII Percentage Change
A B C C/B C/A
REERI 133.7 176.7 152.1 -13.92 13.76
NEERI 70.9 72.2 66.1 -8.45 -6.72 REERI = Real Effective Exchange Rate Index
NEERI = Nominal Effective Exchange Rate Index Source: NBE Staff Computation
Fig. VI.14 Movement in Real and Nominal Exchange Rate
0.0
50.0
100.0
150.0
200.0
QIQII
QIII QIV QIQII
QIII QIV QIQII
QIII QIV QIQII
QIII QIV QIQII
QIII QIV QIQII
QIII QIV QIQII
QIII QIV QIQII
QIII
2001/02 2002/03 2003/04 2004/05 2005/06 2006/07 2007/08 2008/09
REERI NEERI
Source: NBE Staff Computation
6.7.3 Volume of Transactions
The amount of foreign exchange traded
in the inter-bank foreign exchange
market was USD 3.0 million during the
review period about 50 and 89.6 percent
lower than the amount traded in the
preceding quarter and the same quarter
last year, respectively. All transactions
took place between NBE and
commercial banks with no trade among
commercial banks.
0.010.020.030.040.050.060.070.080.090.0
100.0
Qtr . I Qtr . II Qtr .III
Qtr .IV
Qtr . I Qtr . II Qtr .III
Qtr .IV
Qtr . I Qtr . II Qtr .III
Qtr .IV
Qtr . I Qtr . II Qtr .III
Qtr .IV
Qtr . I Qtr . II Qtr .III
Qtr .IV
Qtr . I Qtr . II Qtr .III
2003/ 04 2004/ 05 2005/ 06 2006/ 07 2007/ 8 2008/ 9
Fig. VI.15: Foreign Exchange Traded in Inter-bank Foreign Exchange Market
Total Amount Tr aded Amount Tr aded among CBs
Third Quarter 2008/09 68
Source: NBE, Reserve Management and Foreign Exchange Market Department
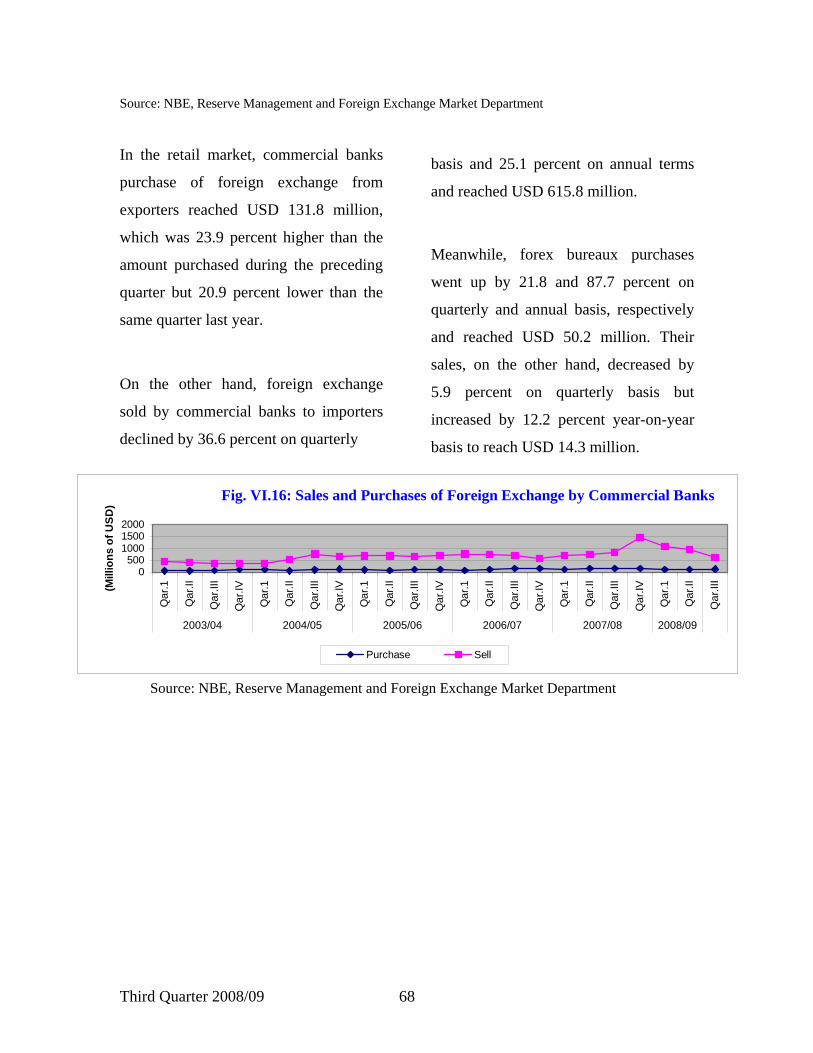
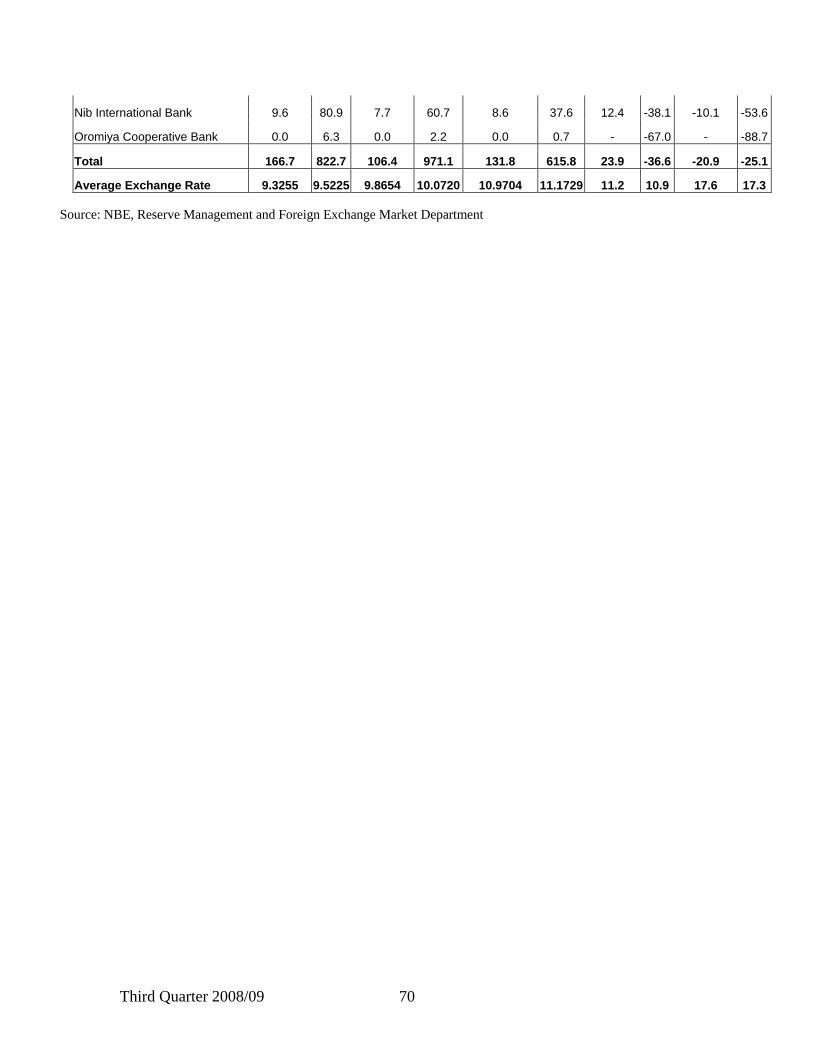
In the retail market, commercial banks
purchase of foreign exchange from
exporters reached USD 131.8 million,
which was 23.9 percent higher than the
amount purchased during the preceding
quarter but 20.9 percent lower than the
same quarter last year.
On the other hand, foreign exchange
sold by commercial banks to importers
declined by 36.6 percent on quarterly
basis and 25.1 percent on annual terms
and reached USD 615.8 million.
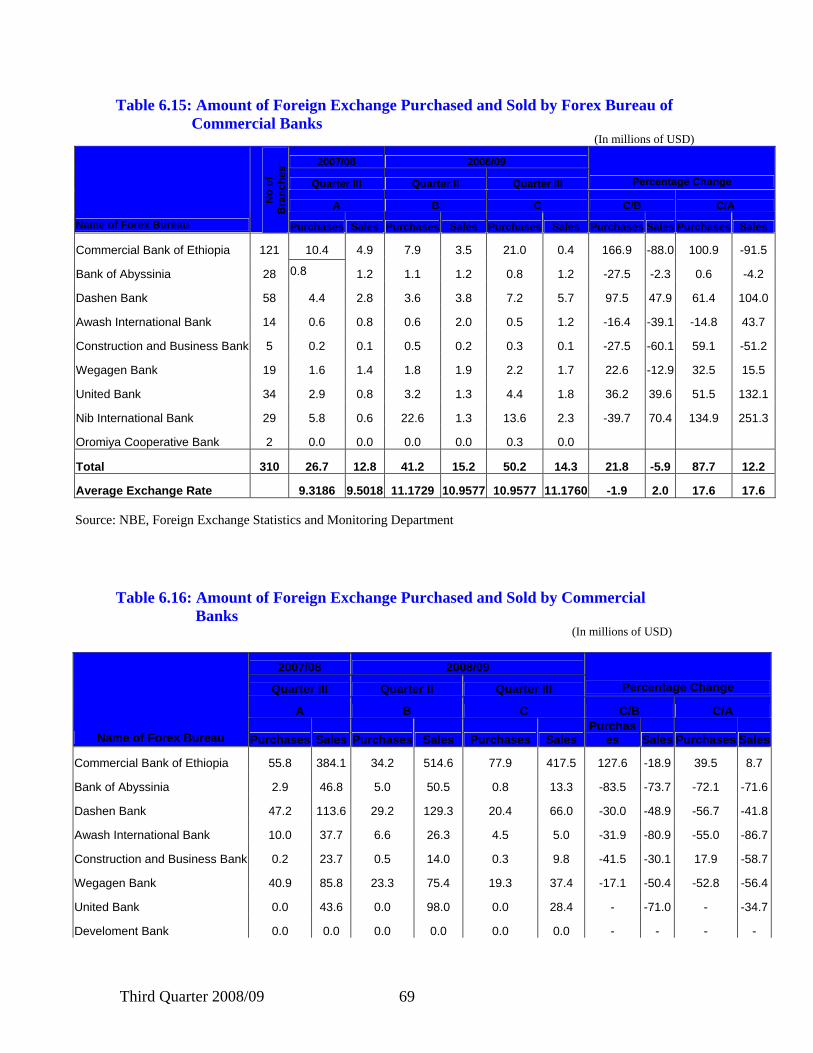
Meanwhile, forex bureaux purchases
went up by 21.8 and 87.7 percent on
quarterly and annual basis, respectively
and reached USD 50.2 million. Their
sales, on the other hand, decreased by
5.9 percent on quarterly basis but
increased by 12.2 percent year-on-year
basis to reach USD 14.3 million.
Fig. VI.16: Sales and Purchases of Foreign Exchange by Commercial Banks
0500
100015002000
Qar
.1
Qar
.II
Qar
.III
Qar
.IV
Qar
.1
Qar
.II
Qar
.III
Qar
.IV
Qar
.1
Qar
.II
Qar
.III
Qar
.IV
Qar
.1
Qar
.II
Qar
.III
Qar
.IV
Qar
.1
Qar
.II
Qar
.III
Qar
.IV
Qar
.1
Qar
.II
Qar
.III
2003/04 2004/05 2005/06 2006/07 2007/08 2008/09
(Mill
ions
of U
SD)
Purchase Sell
Source: NBE, Reserve Management and Foreign Exchange Market Department
Third Quarter 2008/09 69
Table 6.15: Amount of Foreign Exchange Purchased and Sold by Forex Bureau of Commercial Banks
(In millions of USD)
2007/08 2008/09
Quarter III Quarter II Quarter III Percentage Change
A B C C/B C/A
Name of Forex Bureau
No
of
Bra
nche
s
Purchases Sales Purchases Sales Purchases Sales Purchases Sales Purchases Sales
Commercial Bank of Ethiopia 121 10.4 4.9 7.9 3.5 21.0 0.4 166.9 -88.0 100.9 -91.5
Bank of Abyssinia 28 0.8 1.2 1.1 1.2 0.8 1.2 -27.5 -2.3 0.6 -4.2
Dashen Bank 58 4.4 2.8 3.6 3.8 7.2 5.7 97.5 47.9 61.4 104.0
Awash International Bank 14 0.6 0.8 0.6 2.0 0.5 1.2 -16.4 -39.1 -14.8 43.7
Construction and Business Bank 5 0.2 0.1 0.5 0.2 0.3 0.1 -27.5 -60.1 59.1 -51.2
Wegagen Bank 19 1.6 1.4 1.8 1.9 2.2 1.7 22.6 -12.9 32.5 15.5
United Bank 34 2.9 0.8 3.2 1.3 4.4 1.8 36.2 39.6 51.5 132.1
Nib International Bank 29 5.8 0.6 22.6 1.3 13.6 2.3 -39.7 70.4 134.9 251.3
Oromiya Cooperative Bank 2 0.0 0.0 0.0 0.0 0.3 0.0
Total 310 26.7 12.8 41.2 15.2 50.2 14.3 21.8 -5.9 87.7 12.2
Average Exchange Rate 9.3186 9.5018 11.1729 10.9577 10.9577 11.1760 -1.9 2.0 17.6 17.6
Source: NBE, Foreign Exchange Statistics and Monitoring Department
Table 6.16: Amount of Foreign Exchange Purchased and Sold by Commercial Banks (In millions of USD)
2007/08 2008/09
Quarter III Quarter II Quarter III Percentage Change
A B C C/B C/A
Name of Forex Bureau Purchases Sales Purchases Sales Purchases Sales Purchas
es Sales Purchases Sales
Commercial Bank of Ethiopia 55.8 384.1 34.2 514.6 77.9 417.5 127.6 -18.9 39.5 8.7
Bank of Abyssinia 2.9 46.8 5.0 50.5 0.8 13.3 -83.5 -73.7 -72.1 -71.6
Dashen Bank 47.2 113.6 29.2 129.3 20.4 66.0 -30.0 -48.9 -56.7 -41.8
Awash International Bank 10.0 37.7 6.6 26.3 4.5 5.0 -31.9 -80.9 -55.0 -86.7
Construction and Business Bank 0.2 23.7 0.5 14.0 0.3 9.8 -41.5 -30.1 17.9 -58.7
Wegagen Bank 40.9 85.8 23.3 75.4 19.3 37.4 -17.1 -50.4 -52.8 -56.4
United Bank 0.0 43.6 0.0 98.0 0.0 28.4 - -71.0 - -34.7
Develoment Bank 0.0 0.0 0.0 0.0 0.0 0.0 - - - -
Third Quarter 2008/09 70
Nib International Bank 9.6 80.9 7.7 60.7 8.6 37.6 12.4 -38.1 -10.1 -53.6
Oromiya Cooperative Bank 0.0 6.3 0.0 2.2 0.0 0.7 - -67.0 - -88.7
Total 166.7 822.7 106.4 971.1 131.8 615.8 23.9 -36.6 -20.9 -25.1
Average Exchange Rate 9.3255 9.5225 9.8654 10.0720 10.9704 11.1729 11.2 10.9 17.6 17.3
Source: NBE, Reserve Management and Foreign Exchange Market Department