Embed Size (px)
Citation preview
Copyright Castalia Limited. All rights reserved. Castalia is not liable for any loss caused by reliance on this document. Castalia is a part of the worldwide Castalia Advisory Group.
Viability of Liquefied Natural Gas (LNG) in Bermuda
Report to the Government of Bermuda
Submitted September 2015
Final version 11 March 20161
1 Information submitted in confidence has been redacted or made anonymous in this version of the report.
Table of Contents Glossary of Terms i
Executive Summary iii
Executive Summary iii
1 Introduction 1
2 The LNG Market 2
2.1 Natural Gas Prices 2
2.2 Global Market Trends for Natural Gas 3
2.3 Implications of Market Trends for Bermuda 4
3 The Electricity Sector in Bermuda 6
3.1 Policy and Legal Framework for the Electricity Sector 6
3.2 Institutional Structure of the Electricity Sector 6
3.2.1 Ministry of Economic Development 7
3.2.2 Regulatory Authority 7
3.2.3 Bermuda Electric Light Company, Limited 8
3.2.4 SOL and RUBiS 8
3.3 Energy Supply and Demand 9
3.3.1 Supply 9
3.3.2 Demand 9
4 Estimated Demand for Natural Gas in Bermuda 13
5 Cost of Importing LNG to Bermuda 16
5.1 Spread between Oil and Gas Prices 16
5.2 LNG Supply Chain 18
5.2.1 Liquefaction 18
5.2.2 Shipping 19
5.2.3 Regasification and Storage 19
5.2.4 Pipeline to generation plants 20
5.2.5 Converting existing electricity generation plants to gas-fired plants 20
5.2.6 Building new plants for generating electricity 21
5.3 Alternatives for an LNG Supply Chain in Bermuda 21
5.4 Estimated Costs of Alternative Fuels for Baseload Generation in Bermuda 25
5.4.1 Assumptions used in this cost analysis 26
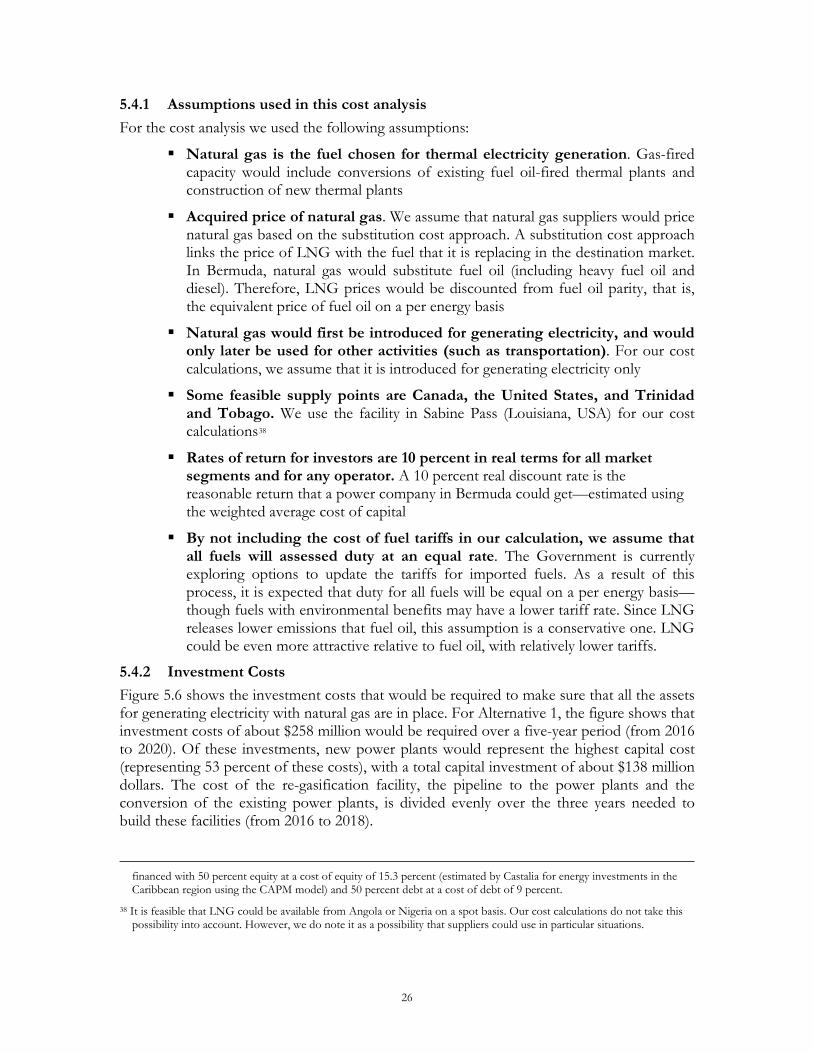
5.4.2 Investment Costs 26
5.4.3 Estimated Cost of Delivered Natural Gas 27
5.4.4 Estimated cost of generating electricity with natural gas 29
5.5 LNG is Viable for Bermuda, but More Information is Needed to Determine the Best Site 32
6 Recommendations for Structuring the Project 34
6.1 Considerations 34
6.2 Market Participants 35
6.3 Options for Procuring LNG and Gas-fired Generation 36
6.3.1 Single supplier builds and manages supply chain, tendering some steps 36
6.3.2 Hold a tender for gas-fired generation 37
6.3.3 Tender only steps in the LNG supply chain that are competitive 38
6.3.4 Requiring access to the Ferry Reach Terminal: Compulsory purchase or the essential facilities doctrine 40
6.3.5 The Swiss challenge 41
6.4 Recommendations to Ensure the Best Outcome for the People and Government of Bermuda 41
6.4.1 Bermuda should attempt to procure LNG and use it for electricity generation 42
6.4.2 The Government will oversee the process for procuring LNG 42
6.4.3 More information is needed to determine the best way to procure LNG and gas-fired generation 42
6.4.4 Process for determining the best way to procure LNG and gas-fired generation 42
6.5 Timeline for Introducing Natural Gas 47
Tables Table 3.1: Primary Energy Sources in Bermuda by Source (2014) 9
Table 3.2: Fossil Fuel Use in Bermuda by Sector (thousand barrels of oil—2014) 10
Table 4.1: Projected Demand for Electricity, 2016-2025 13
Table 4.2: Projected Demand for Electricity, 2016-2025 (GWh) 14
Table 4.3: Projected Natural Gas Demand per Sector, 2019-2024 (MMscf per day) 15
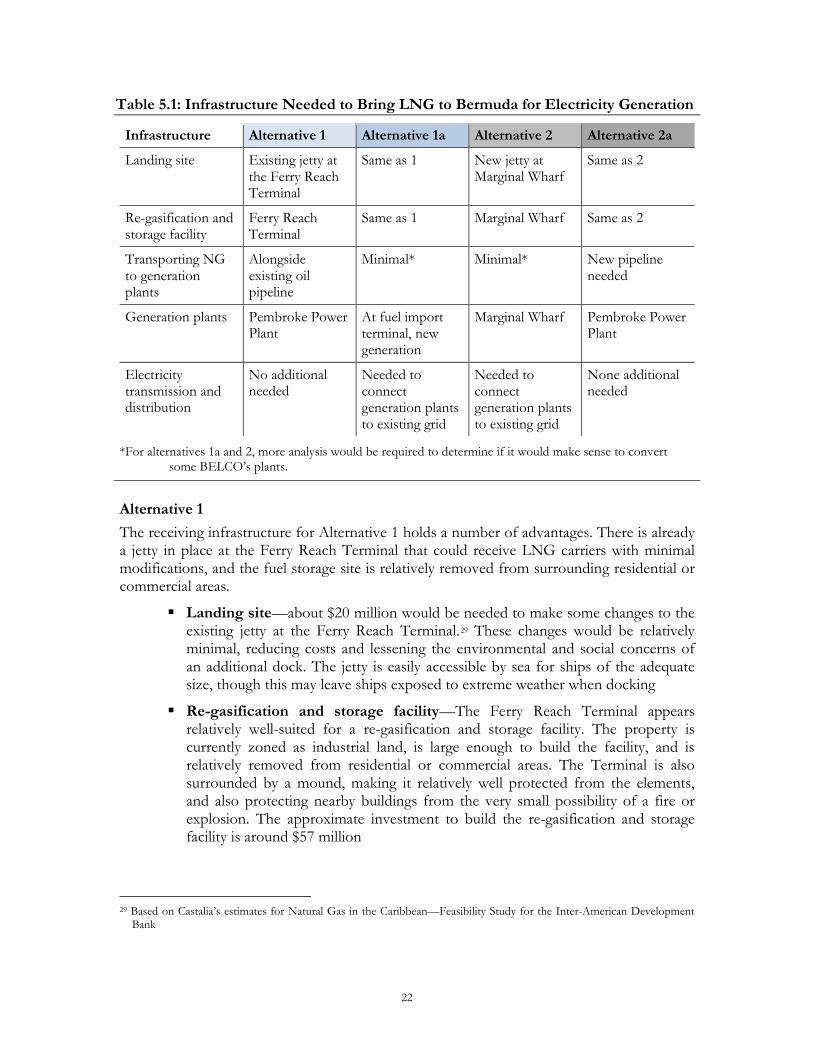
Table 5.1: Infrastructure Needed to Bring LNG to Bermuda for Electricity Generation 22
Table 6.1: Market Structure Scenarios 36
Table 6.2: Comparison of Options for Procuring LNG and Gas-fired Generation 36
Table 6.3: Action Plan and Timeline for Introducing Natural Gas 48
Figures Figure 0.1: Historical and Projected Prices for Bermuda Fuel Options iii
Figure 0.2: LNG Supply Chain to Bermuda (Cost per Million British thermal units) v
Figure 2.1: Historical and Projected Prices for Bermuda Fuel Options 2
Figure 2.2: Projected Natural Gas Exports and Imports in the United States 3
Figure 2.3: Global Natural Gas Trade in 2013 4
Figure 3.1: Institutional Structure of the Electricity Sector in Bermuda 7
Figure 3.2: Electricity Demand by Sector (2003 to 2012) 11
Figure 5.1: Spot Prices of WTI and Henry Hub 2005-2015 17
Figure 5.2: Spread between WTI and Henry Hub, and Price Ratios (Jan 2014-Jan 2015) 17
Figure 5.3: LNG Supply Chain to Bermuda in 2023 (Cost per MMBtu) 18
Figure 5.4: Bahrain Vision—12,000 cubic meter LNG carrier 19
Figure 5.5: Re-gasification and Storage Facility 20
Figure 5.6: Investment Costs, 2016 to 2025 27
Figure 5.7: Cost of Delivered Natural Gas, 2019-2035 28
Figure 5.8: Discount on Fuel Oil Prices 29
Figure 5.9: Costs of Generating Electricity with Natural Gas 30
Figure 5.10: Comparing All-In Cost of Generating with Natural Gas with the All-In Cost of Generating with Fuel Oil 31
Figure 5.11: Generation Savings as a Result of Replacing Fuel Oil with Natural Gas 32
Figure 6.1: Process for Determining Best Procurement Method for LNG and Gas-fired Generation 43
i
Glossary of Terms BEESG—Bermuda Environmental Energy Sustainable Group
BELCO—Bermuda Electric Light Company, Limited
CO2—carbon dioxide, an air pollutant that contributes to global climate change, but is not known have direct local impacts on human health or the environment
Draft Electricity Act—a bill tabled in Parliament in December 2015, now the Electricity Act 2016.
Essential facilities doctrine—a legal doctrine in many common law jurisdictions that allows for economic assets that cannot be easily duplicated by competitors to be accessed on reasonable terms
Ferry Reach Terminal—jetty and terminal at Ferry Reach used to import oil-based fuels. A pipeline for oil-based fuels connects the Ferry Reach Terminal to the Pembroke Power Plant
Pembroke Power Plant—the main power plant in Bermuda, where nearly all electricity in the country is generated. Generation assets at the Pembroke Power Plant are fired by diesel and heavy fuel oil. BELCO owns and operates the Pembroke Power Plant
Henry Hub, Louisiana—major intersection point for North American natural gas pipelines. The highest-volume trading point in the United States
IPP—independent power producer. An entity other than the electricity utility that produces electricity and sells it to the utility or a third-party
Liquefaction—converting natural gas to LNG by cooling it to -160 degrees Celsius
LNG—liquefied natural gas. This is natural gas (natural gas is mainly methane) kept at a very low temperature so that it becomes a liquid. Natural gas is typically ‘frozen’ into LNG to make it easier to transport, since LNG is about 600 times denser than natural gas
Marginal Wharf—currently unused site zoned for mixed use. The site is in St. David’s, visible to the Town of St. George’s
MMBtu—million British thermal units
MMscf—million standard cubic feet per day
National Electricity Sector Policy—adopted 5 June 2015, this document sets out the Government’s vision for the future of the electricity sector and strategy for achieving that vision
NOx—Nitrogen oxides, local air pollutants
PPA—power purchase agreement. A contract between an IPP and a utility or third-party that sets out terms for the sale of electricity, often for ten years or more
Re-gasification—converting LNG into a gaseous state
Regulatory Authority—independent public agency that will regulate the electricity sector once the draft Electricity Act is passed and enacted
SO2—sulphur dioxide, a local air pollutant
ii
SOL—one of the two largest suppliers of oil-based fuels in Bermuda (along with RUBiS). SOL retails fuels for automobiles under the name ESSO
Swiss challenge—a competitive bidding process in which the firm that proposes a project is allowed to match the winning bid, if the firm that proposes the project does not win the initial bid
U.S. EIA—United States Energy Information Administration
Uniquely favourable asset—a fixed asset that is much lower cost than alternatives, has much lower environmental or social impacts than alternatives, or both
iii
Executive Summary Bermuda is at a critical point in planning for a low-cost, reliable, and sustainable electricity sector. Near complete dependence on imported oil for electricity has led to high prices, and left Bermuda vulnerable to price shocks as global oil prices fluctuate. As the country’s existing thermal generation assets near the end of their useful lives, evolving technology and international fuel markets have given Bermuda an opportunity to invest in lower-cost and more sustainable alternatives than oil-fired generation.
Specifically, low natural gas prices and at least two project proposals to import liquefied natural gas (LNG) to Bermuda have led the Government to consider whether switching to natural gas is in the country’s best interest. To help determine its position on LNG, the Government has commissioned this study, which examines the economic viability of LNG for Bermuda. We conclude that importing LNG could lead to lower electricity prices and lower emissions from electricity generation. As a result, we recommend a process for determining the best way for Bermuda to procure LNG.
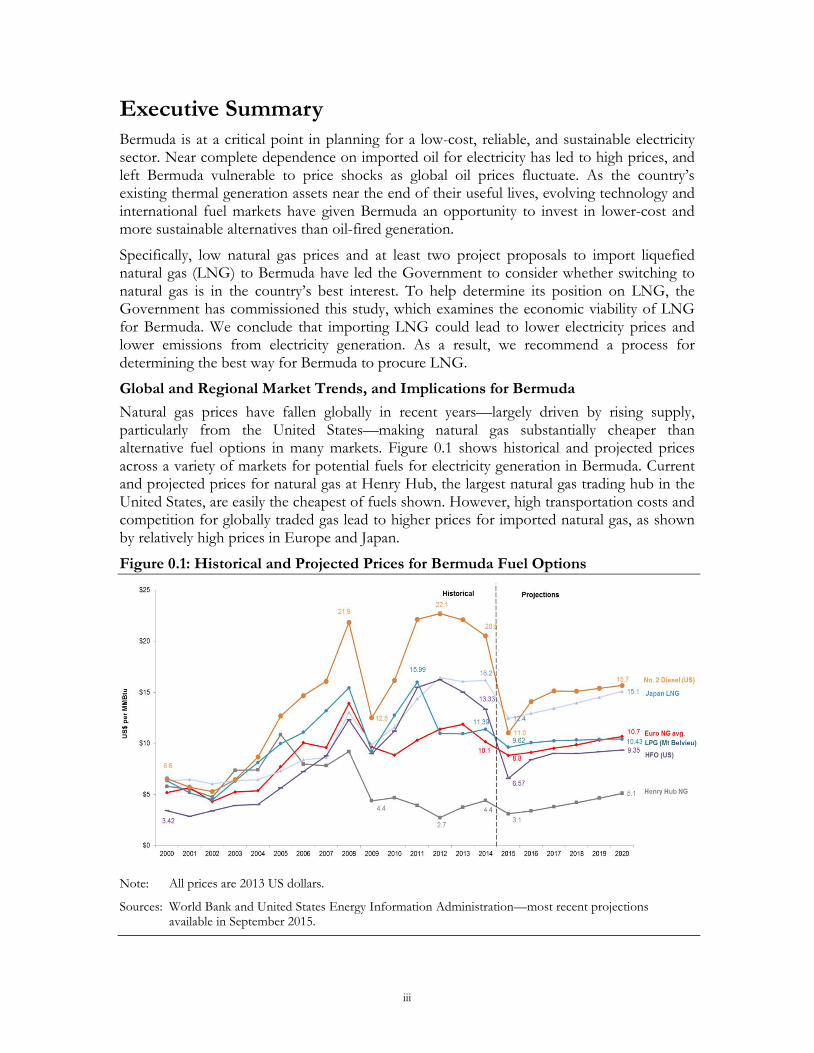
Global and Regional Market Trends, and Implications for Bermuda Natural gas prices have fallen globally in recent years—largely driven by rising supply, particularly from the United States—making natural gas substantially cheaper than alternative fuel options in many markets. Figure 0.1 shows historical and projected prices across a variety of markets for potential fuels for electricity generation in Bermuda. Current and projected prices for natural gas at Henry Hub, the largest natural gas trading hub in the United States, are easily the cheapest of fuels shown. However, high transportation costs and competition for globally traded gas lead to higher prices for imported natural gas, as shown by relatively high prices in Europe and Japan.
Figure 0.1: Historical and Projected Prices for Bermuda Fuel Options
Note: All prices are 2013 US dollars.
Sources: World Bank and United States Energy Information Administration—most recent projections available in September 2015.
iv
In addition to low prices, advances in delivery technology, particularly in small-scale LNG shipping and floating regasification units, are making natural gas a more economical option for small markets, such as Bermuda. For example, since 2006, the global fleet of ships with a capacity of 25,000 cubic meters or less has increased from 5 to 24.2 Further cost reductions are expected as research and development matures the many smaller-scale technologies currently under development.
Natural Gas Releases Lower Emissions than Oil Products when Burned for Electricity Generation Burning natural gas for electricity generation releases lower local and global pollutants than burning oil products. Depending on the exact specifications of the power plants and the fuels used, natural gas emits about 56 percent less NOx and 38 percent less CO2 than oil products, and almost no SO2.3
Energy Supply and Demand in Bermuda Bermuda imports oil products—1.6 million barrels in 2014—to meet nearly all of its energy needs. Electricity generation accounts for 54 percent of oil use in the country. Waste-to-energy (which supplies about 2 percent of electricity on the national grid) and a small amount of distributed solar (less than 1 percent of electricity supply) are the only renewable energy sources in the country. The transportation sector is the second-highest consumer of oil products, at 44 percent. Commercial and residential users directly consume the remaining 2 percent of oil products.
Potential Demand for Natural Gas in Bermuda In Bermuda, demand for natural gas is expected to be determined primarily by its use for electricity generation, for two main reasons. First, electricity generation is the largest potential market for natural gas. Second, an electricity generator, whether an independent power producer or BELCO, represents a large potential offtaker for natural gas, and will have the demand to justify large capital investments in natural gas import infrastructure without partnering with other energy users. If LNG is imported for electricity generation, investment to use natural gas in other sectors could come afterwards.
Using information provided by BELCO, we project that electricity demand will grow slowly in coming years, from 620GWh in 2016 to 647GWh in 2025. Between 14 and 15 million standard cubic feet (MMscf) of natural gas per day would been needed to meet this demand.
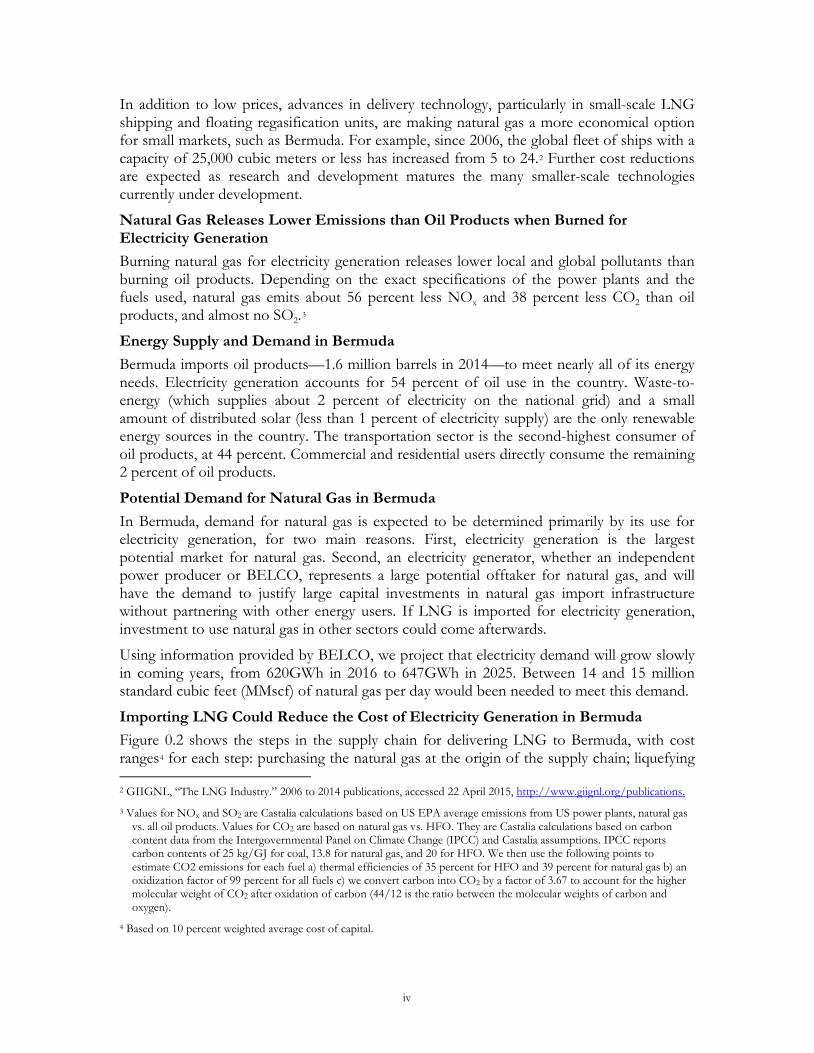
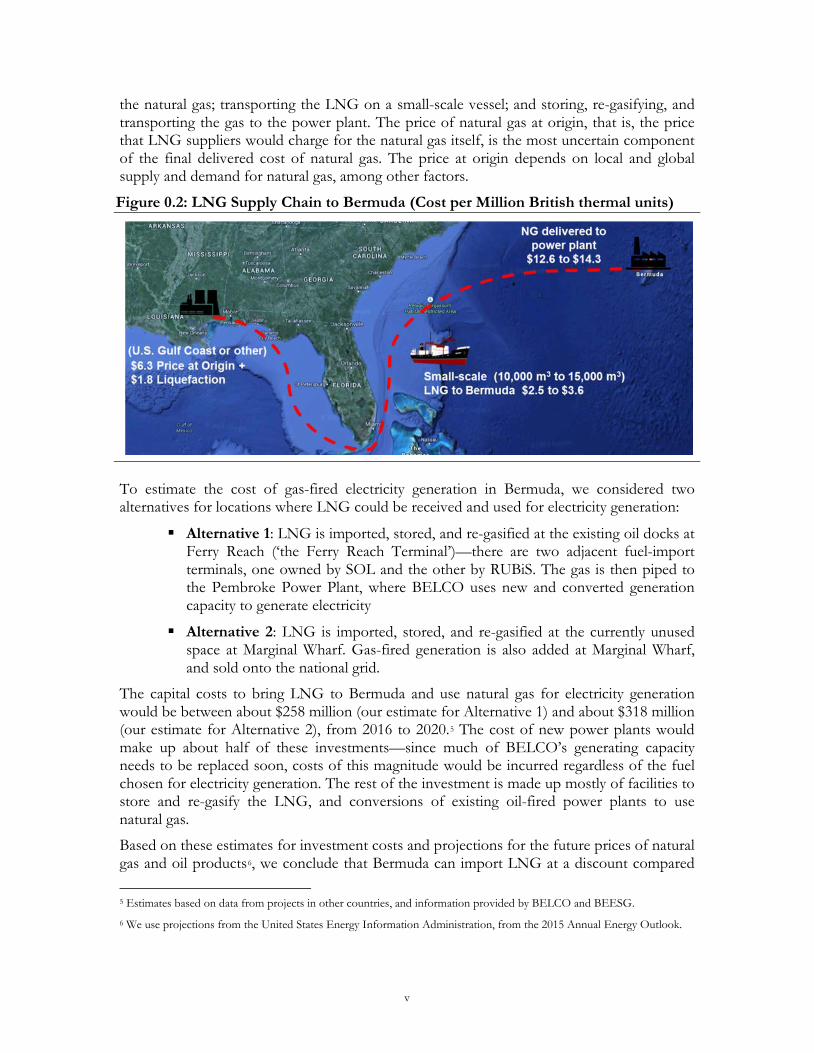
Importing LNG Could Reduce the Cost of Electricity Generation in Bermuda Figure 0.2 shows the steps in the supply chain for delivering LNG to Bermuda, with cost ranges4 for each step: purchasing the natural gas at the origin of the supply chain; liquefying 2 GIIGNL, “The LNG Industry.” 2006 to 2014 publications, accessed 22 April 2015, http://www.giignl.org/publications. 3 Values for NOx and SO2 are Castalia calculations based on US EPA average emissions from US power plants, natural gas
vs. all oil products. Values for CO2 are based on natural gas vs. HFO. They are Castalia calculations based on carbon content data from the Intergovernmental Panel on Climate Change (IPCC) and Castalia assumptions. IPCC reports carbon contents of 25 kg/GJ for coal, 13.8 for natural gas, and 20 for HFO. We then use the following points to estimate CO2 emissions for each fuel a) thermal efficiencies of 35 percent for HFO and 39 percent for natural gas b) an oxidization factor of 99 percent for all fuels c) we convert carbon into CO2 by a factor of 3.67 to account for the higher molecular weight of CO2 after oxidation of carbon (44/12 is the ratio between the molecular weights of carbon and oxygen).
4 Based on 10 percent weighted average cost of capital.
v
the natural gas; transporting the LNG on a small-scale vessel; and storing, re-gasifying, and transporting the gas to the power plant. The price of natural gas at origin, that is, the price that LNG suppliers would charge for the natural gas itself, is the most uncertain component of the final delivered cost of natural gas. The price at origin depends on local and global supply and demand for natural gas, among other factors.
Figure 0.2: LNG Supply Chain to Bermuda (Cost per Million British thermal units)
To estimate the cost of gas-fired electricity generation in Bermuda, we considered two alternatives for locations where LNG could be received and used for electricity generation:
Alternative 1: LNG is imported, stored, and re-gasified at the existing oil docks at Ferry Reach (‘the Ferry Reach Terminal’)—there are two adjacent fuel-import terminals, one owned by SOL and the other by RUBiS. The gas is then piped to the Pembroke Power Plant, where BELCO uses new and converted generation capacity to generate electricity
Alternative 2: LNG is imported, stored, and re-gasified at the currently unused space at Marginal Wharf. Gas-fired generation is also added at Marginal Wharf, and sold onto the national grid.
The capital costs to bring LNG to Bermuda and use natural gas for electricity generation would be between about $258 million (our estimate for Alternative 1) and about $318 million (our estimate for Alternative 2), from 2016 to 2020.5 The cost of new power plants would make up about half of these investments—since much of BELCO’s generating capacity needs to be replaced soon, costs of this magnitude would be incurred regardless of the fuel chosen for electricity generation. The rest of the investment is made up mostly of facilities to store and re-gasify the LNG, and conversions of existing oil-fired power plants to use natural gas.
Based on these estimates for investment costs and projections for the future prices of natural gas and oil products6, we conclude that Bermuda can import LNG at a discount compared 5 Estimates based on data from projects in other countries, and information provided by BELCO and BEESG. 6 We use projections from the United States Energy Information Administration, from the 2015 Annual Energy Outlook.
vi
to oil products, reducing the cost of electricity generation on the island. We estimate that LNG could be delivered to Bermuda for between $11.7 per MMBtu and $16 per MMBtu during the period from 2019 to 2035, depending on the year. At this fuel price, electricity could be generated for between $0.16 per kWh and $0.20 per kWh—a discount of between 15 percent and 42 percent, compared to continued use of oil products.
Preliminarily, it appears that Alternative 1 (importing LNG at the Ferry Reach Terminal, and generating electricity at the Pembroke Power Plant) is the lower-cost option. Because the Ferry Reach Terminal is designed to store fuels, and is already correctly zoned to receive LNG, Alternative 1 may also may be more social and environmentally acceptable.
However, we do not have sufficient information to recommend either of the alternatives as the best option for Bermuda. A full evaluation of the possible sites is needed to draw a conclusion. Such an analysis would include a detailed evaluation of costs, social risks, and environmental risks for all sites. From this analysis the Government would be able to conclude which sites are economically, socially, and environmentally viable, and if there would be a major cost difference between potential sites. With the results of such a study, the Government would have the information necessary to determine the best approach to procure LNG.
Recommendations for Structuring an LNG Project in Bermuda Based on our conclusions that LNG would be cheaper and emit lower pollutants than oil products, we recommend that the Government oversee a process to procure LNG and use it for electricity generation, following the procedures in the new electricity sector framework. Ideally, the procurement for LNG in Bermuda would be competitive, quick, and simple, allowing for the least-cost option with a minimum of delay.
A few Bermuda-specific considerations must be taken into account when setting up the supply chain to bring LNG to the island. First, there can be only one LNG-import facility, given Bermuda’s demand for gas. This, as well as the size of the investment needed, gives the Government a strong interest in ensuring that the single procurement for LNG is done well. Second, the Ferry Reach Terminal and the Pembroke Power Plant (the two sites in Alternative 1) may be uniquely favourable assets for receiving and using LNG. That is, these sites may be substantially cheaper, or more environmentally and socially acceptable, than other sites, giving their respective owners an advantage in a competitive procurement for LNG. This advantage could allow the facilities’ owners to capture much of the value of switching to natural gas, rather than the discount being fairly distributed among suppliers, the utility, customers, and the Government.
Based on these considerations, we set out some guidelines for the Government to follow when determining the best way to procure LNG. First, the Government should obtain detailed information on costs, environmental risks, and social impacts for all possible sites for importing LNG, as discussed above. This will allow the Government to determine if:
There are no uniquely favourable assets. In this scenario, neither the Pembroke Power Plant nor the Ferry Reach Terminal have significant cost, social, or environmental advantages, compared to other sites. This would allow for gas-fired electricity generation to be competitively bid. Competition among suppliers would result in low costs for consumers
vii
Pembroke Power Plant is uniquely favourable, but the Ferry Reach Terminal is not. In this scenario, Pembroke Power Plant is the best location to generate electricity with natural gas, but there are multiple options for receiving, storing, and re-gasifying LNG. LNG supply (including natural gas transportation to the Pembroke Power Plant) could be competitively bid, while BELCO would oversee the process for converting and adding gas-fired generation capacity at the Pembroke Power Plant
The Ferry Reach Terminal and Pembroke Power Plant are both uniquely favourable assets. In this case, the procurement options represent a trade-off between the level of competition, and the speed and complexity of the process:
1. Require the owners of the Ferry Reach Terminal to allow third parties to access the Terminal for a bidding process, using either compulsory purchase of the Terminal, or the essential facilities legal doctrine. This option would allow for competition in the bidding process, but could be slow and expose the Government to legal risk when trying to require access to the Ferry Reach Terminal
2. Negotiate with the owners for access to the Ferry Reach Terminal, then run a competitive bid for natural gas supply to the Pembroke Power Plant. The Ferry Reach Terminal owners may be able to capture much of the value of switching to natural gas in this scenario, since it would have little incentive to offer access to the Ferry Reach Terminal at less than a monopolist rate. However, this option would move more quickly and carry less risk for the Government than option 1) above
3. Negotiate with the owners for use of the Ferry Reach Terminal, then run a Swiss challenge. In a Swiss challenge, there would be two rounds of bidding for LNG supply. In the first round, all competitors could bid, and could include the Ferry Reach Terminal in their bids at the negotiated rate (paid to the Terminal’s owners). In the second round, the Terminal’s owners would have the opportunity to match the winning bid. Because of its advantage in the bidding process, the Terminal’s owners may be more motivated to offer access to others at a reasonable rate, in order to move the process forward quickly
4. Allow the owners of the Ferry Reach Terminal to serve as a single supplier for LNG. In this scenario, the owners would be given the exclusive right to put together the supply chain for delivering natural gas to the Pembroke Power Plant. The process would be simple and could move quickly and would, like the other scenarios, likely result in a discount on electricity prices, compared to continuing to use oil products. However, giving the owners control over the supply chain would allow them to capture much of the value of switching to natural gas.
If the procurement process is organized quickly, LNG could be delivered to Bermuda by the end of 2019. This timeline includes about one and half years to determine the best procurement process, procure LNG, and sign contracts between suppliers and the utility. Then, about 30 months would be needed to build the infrastructure to receive LNG and a ship to deliver it to Bermuda.

viii
1
1 Introduction The Government of Bermuda wants to determine if LNG is part of the best energy mix for the island, based on the criteria set out in the National Electricity Sector Policy. To help answer this question, the Government contracted Castalia to advise on a national LNG strategy. The key elements of this strategy are recommendations on whether LNG is part of the best energy mix for Bermuda, and, if so, what the best strategy is for procuring LNG and developing the associated infrastructure.
To carry out this study, we first analysed the global and regional markets for LNG, including prices and potential suppliers to Bermuda (Section 2). Next, we reviewed the legal and institutional structure of the Bermudian electricity sector, as well as supply and demand for energy in the country (Section 3). We then estimated the potential demand for natural gas in Bermuda (Section 4).
Based on the estimated demand and the options for developing an LNG supply chain in Bermuda, we determined that LNG is economically viable for electricity generation in Bermuda. That is, LNG could be a lower-cost option than fuel oil (currently a mix of heavy fuel oil and diesel) for electricity generation (Section 5). Further information on costs and environmental and social impacts at potential LNG receiving sites is needed before the Government can make a decision on the best way to procure LNG. We provide guidelines and a timeline for making the decision on the LNG procurement process, once this site-specific information is available, in Section 6.
2
2 The LNG Market Natural gas prices have fallen globally in recent years, making natural gas substantially cheaper than alternative fuel options in many markets (Section 2.1). Falling prices are largely due to rising supply, particularly in the United States (Section 2.2). These trends, coupled with new advances in technologies that make natural gas cheaper to transport—especially to smaller markets—may allow small-island countries to contract natural gas at a competitive price in the near future (Section 2.3).
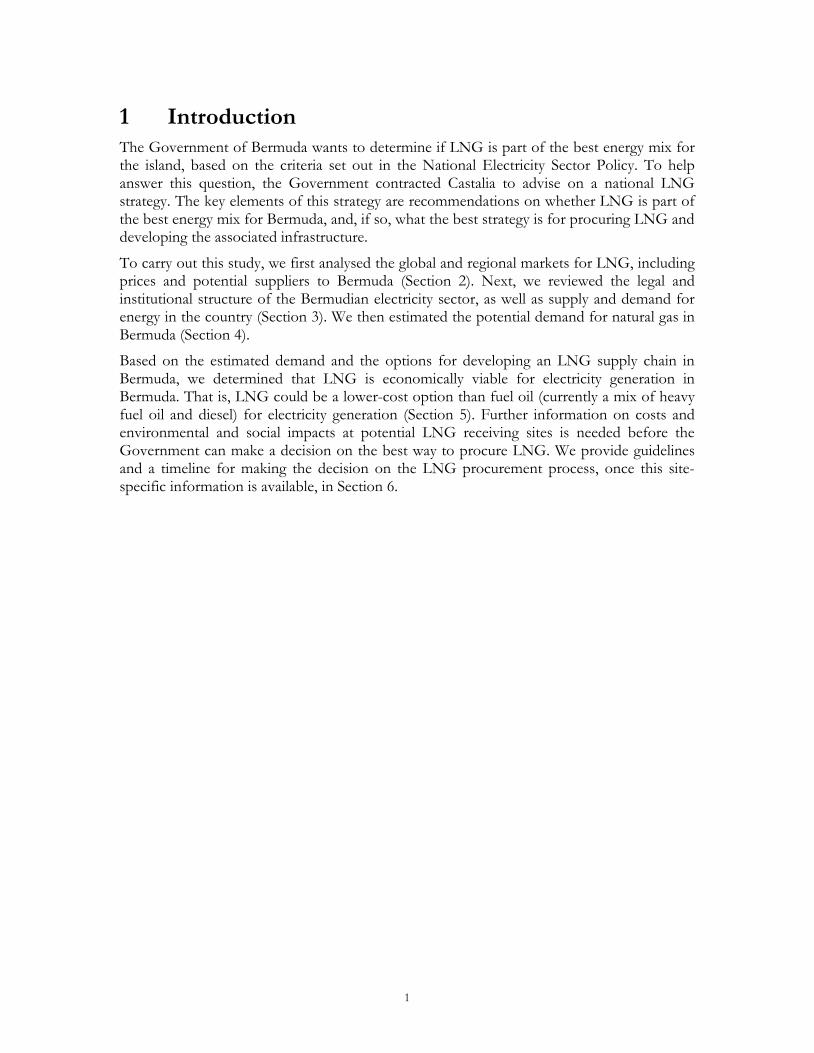
2.1 Natural Gas Prices Figure 2.1 shows historical and projected prices across a variety of markets for potential fuels for electricity generation in Bermuda. Current and projected prices for natural gas at Henry Hub, the largest natural gas trading hub in the United States, are easily the cheapest of fuels shown. However, high transportation costs and competition for globally traded gas lead to higher prices for imported natural gas. Europe and Japan, the two largest import markets for natural gas, pay two times (Europe) or three times (Japan) higher prices for natural gas than the United States, which produces most of the natural gas that it consumes.
Figure 2.1: Historical and Projected Prices for Bermuda Fuel Options
Note: All prices are 2013 US dollars.
Sources: Prices and projections for Japan LNG, Henry Hub, and Europe natural gas (cross border traded average) are from the World Bank. Prices for No. 2 Diesel, LPG, and HFO are from the United States Energy Information Administration. Projections for No. 2 Diesel and HFO are based on projections for the price of crude oil. Projections for LPG at Mt. Belvieu are based on the U.S. EIA’s projections for propane prices for end users in the United States. Most recent projections available in September 2015.
Imported natural gas to Bermuda will certainly be more expensive than natural gas in the United States. Whether Bermuda pays more (or how much more) than Europe and Japan for natural gas will depend on developments in global and regional supply and demand, and developments in the price of oil products—the fuels that natural gas would replace in Bermuda.
3
The cost of acquiring natural gas is the most uncertain factor in estimating the cost of importing LNG to Bermuda. Most LNG supply agreements are long-term contracts that last between 10 and 20 years, and are indexed to either natural gas costs at a hub (such as NYMEX or Henry Hub) or oil prices. However, there is also a vibrant and increasing spot market for LNG, which accounted for about one-quarter of global LNG volumes in 2013. The exact price and terms of an LNG supply contract for Bermuda would be decided by regional and global market dynamics.
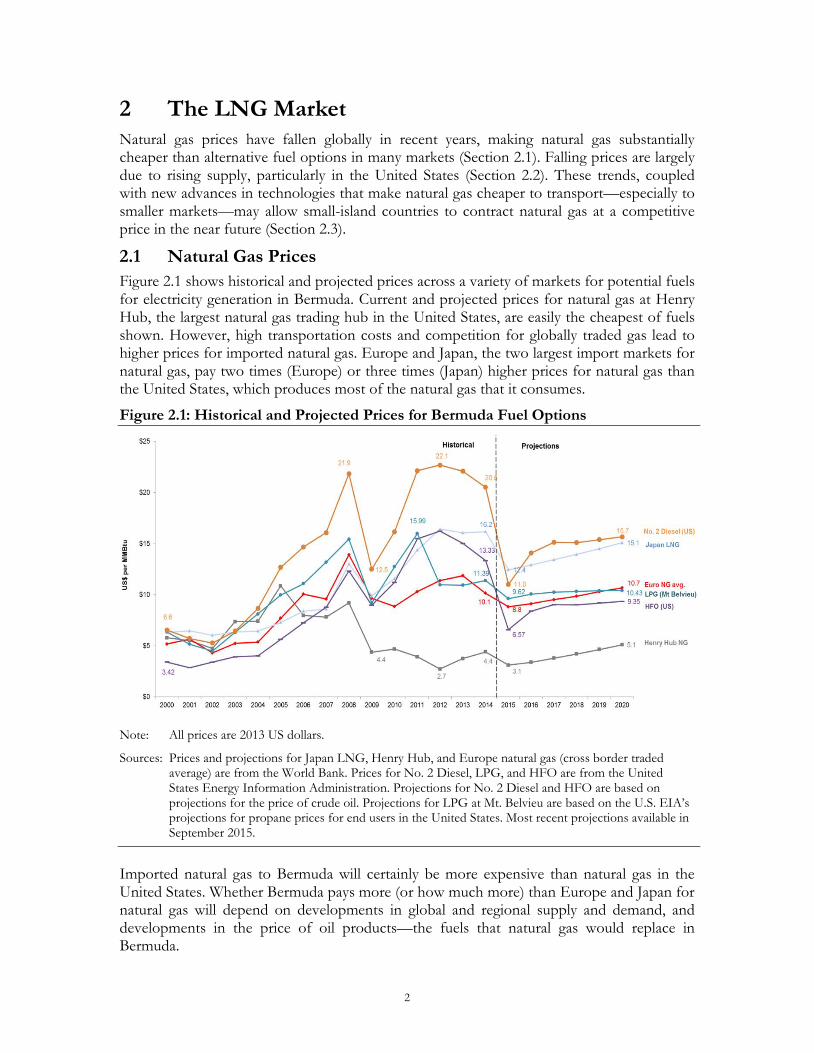
2.2 Global Market Trends for Natural Gas Many regions around the world are looking to natural gas to play a more important role in their future energy mix. Natural gas is among the most important sources of energy in the world today, and global demand is expected to grow due to its environmental advantages and low price. Globally, natural gas consumption reached 118 trillion cubic feet (Tcf) in 2013. This accounted for 24 percent of total primary energy consumption, on par with oil and coal, the other two largest energy sources in the world. The U.S. Energy Information Administration projects that global demand will grow to 132 Tcf in 2020.7 This growing demand will be supplied by conventional natural gas, but also increasingly by unconventional resources, including shale gas. The United States is leading the way in developing shale gas formations—Figure 2.2 shows LNG exports from the U.S. are expected to rise from near zero in 2014 to 8 trillion cubic feet in 2040. Many other countries also have substantial resources and are just now beginning to exploit them.
Figure 2.2: Projected Natural Gas Exports and Imports in the United States
Source: United States Energy Information Administration
Natural gas markets remain relatively isolated due to the high cost to transport natural gas, especially relative to coal and liquid fuels. In 2013, only 30 percent of total global demand
7 United States Energy Information Administration, “International Energy Outlook.” 2013.
4
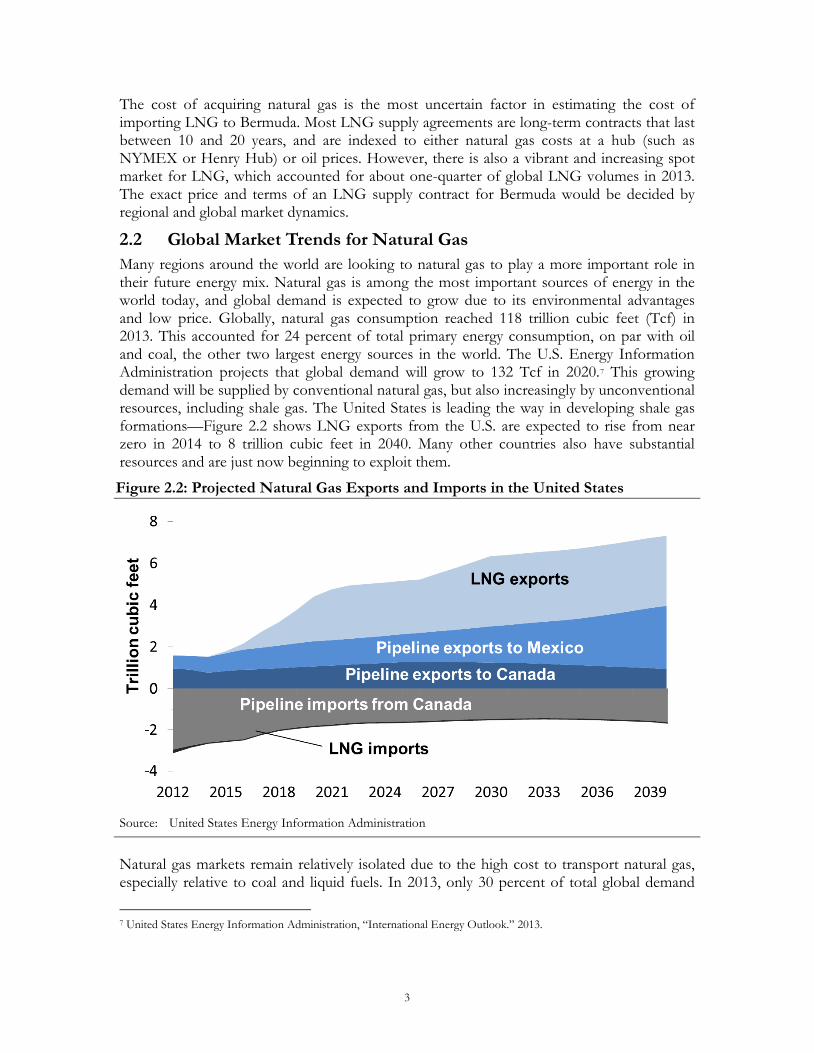
was traded across borders. Just over two-thirds of this total was transported via pipelines (see Figure 2.3). The remainder of global gas trade was in the form of liquefied natural gas. The only Caribbean LNG exporting country, Trinidad and Tobago, was among the top 5 LNG exporters in 2013, shipping the equivalent of 699 Bcf of LNG. As demand for natural gas grows, global LNG production is expected to increase from 11.5 Tcf per year in 2013 to 18 Tcf by 2025.8 A number of potential suppliers have also proposed transporting compressed natural gas in ships built specifically for that purpose, and although some projects are planned, no such ships have been built.
Figure 2.3: Global Natural Gas Trade in 2013
Source: BP
2.3 Implications of Market Trends for Bermuda Most small-island countries have been unable to import natural gas and take advantage of the price difference compared to fuel oil, because their demand is too small to justify investing in the expensive infrastructure needed to import natural gas, and because tight global supply has made it difficult to contract natural gas at a competitive rate. However, expectations of large new supplies of tradable natural gas, cheap natural gas in the United States and other producing countries, technology advances, and growing pressure to reduce greenhouse gas emissions are creating an opportunity to bring competitive natural gas to smaller markets, such as Bermuda.
New supply to the region will most likely come from the United States, but other neighboring countries, including Canada, Mexico, Colombia, and Venezuela, have the potential to substantially increase natural gas production if sufficient investment is made. Trinidad and Tobago already supplies the Caribbean’s existing LNG facilities in the
8 Alan Weitzner, “LNG Development Outlook,” Stakeholders Infrastructure Advisory LLC, October 2013.
5
Dominican Republic and Puerto Rico,9 and could supply other countries in the wider region as well.
In the past there was not an economical method to deliver natural gas in small-island states, given the small size of many of the island economies and lack of economical natural gas supply, transportation and storage technologies, but this is changing. Advances in delivery technology, particularly in small-scale LNG shipping and floating regasification units, are making natural gas a more economical option for small markets, such as Bermuda. For example, since 2006, the global fleet of ships with a capacity of 25,000 cubic meters or less has increased from 5 to 24.10 Further cost reductions are expected as research and development matures the many smaller-scale technologies currently under development.
The recent agreement in Jamaica to supply the 120MW Bogue Power Plant with LNG reflects these regional trends. New Fortress Energy will deliver LNG in ISO containers, rather than purpose-built ships, from Florida to Jamaica.11 The existing thermal generation capacity at Bogue will be converted to run on natural gas. The deal was signed in 2015—plant conversion is expected to be completed in early 2016, with delivery of LNG sometime afterwards.
Despite these positive trends, many challenges remain. The capital cost for any natural gas transportation infrastructure remains high. Guarantees are required to finance projects to import natural gas, often including long-term contracts, highly credit worthy buyers, and sovereign support. Natural gas import projects benefit from economies of scale, suggesting the potential for greater returns from larger markets than from smaller ones. As such, some suppliers may charge a premium for delivering natural gas in small quantities, as Bermuda would require. Finally, while there is an opportunity to deliver natural gas to the region at lower cost than oil-based fuels, small markets and relatively limited supply still make it unlikely that prices will be set based on a strong competitive market between natural gas suppliers.
9 Source: BP Statistical Review of World Energy, 2013
10 GIIGNL, “The LNG Industry.” 2006 to 2014 publications, accessed 22 April 2015, http://www.giignl.org/publications. 11 Information from JPS (http://www.myjpsco.com/news/jps-identifies-preferred-gas-supplier-for-bogue-power-station/)
and the United States Department of Energy (http://energy.gov/sites/prod/files/2015/07/f24/Summary%20of%20LNG%20Export%20Applications_0.pdf)
6
3 The Electricity Sector in Bermuda The Government has clearly set out its goals and desired structure for the electricity sector in the recently promulgated National Electricity Sector Policy and draft Electricity Act (Section 3.1). In addition to the Ministry of Economic Development, which has policy-making responsibility, some other key institutions in the reformed electricity sector are the Regulatory Authority, BELCO, SOL, and RUBiS (Section 3.2). Imported oil products make up nearly all energy supply in Bermuda, and electricity generation consumes most of the oil products in the country (Section 3.3).
3.1 Policy and Legal Framework for the Electricity Sector The National Electricity Sector Policy (‘the Policy’), adopted 5 June 2015, sets out the Government’s vision and strategy for the future of the electricity sector. The main goals of the Policy are addressing the issue of high-cost electricity, and the environmental impact of using fuel oil to generate electricity. The four main objectives in the Policy are that electricity will be:
Least-cost and high-quality
Environmentally sustainable
Secure
Affordable.
The Policy acknowledges the continued need to rely on fossil fuels for baseload electricity generation for at least the medium term, until economically viable alternatives are available.12
To help meet these objectives, the Policy lays the groundwork for the new Electricity Act and a renewed regulatory framework. The draft Electricity Act (‘the draft Act’) will put many of the changes in the Policy into statute, including the new institutional structure of the sector, described in the next section.
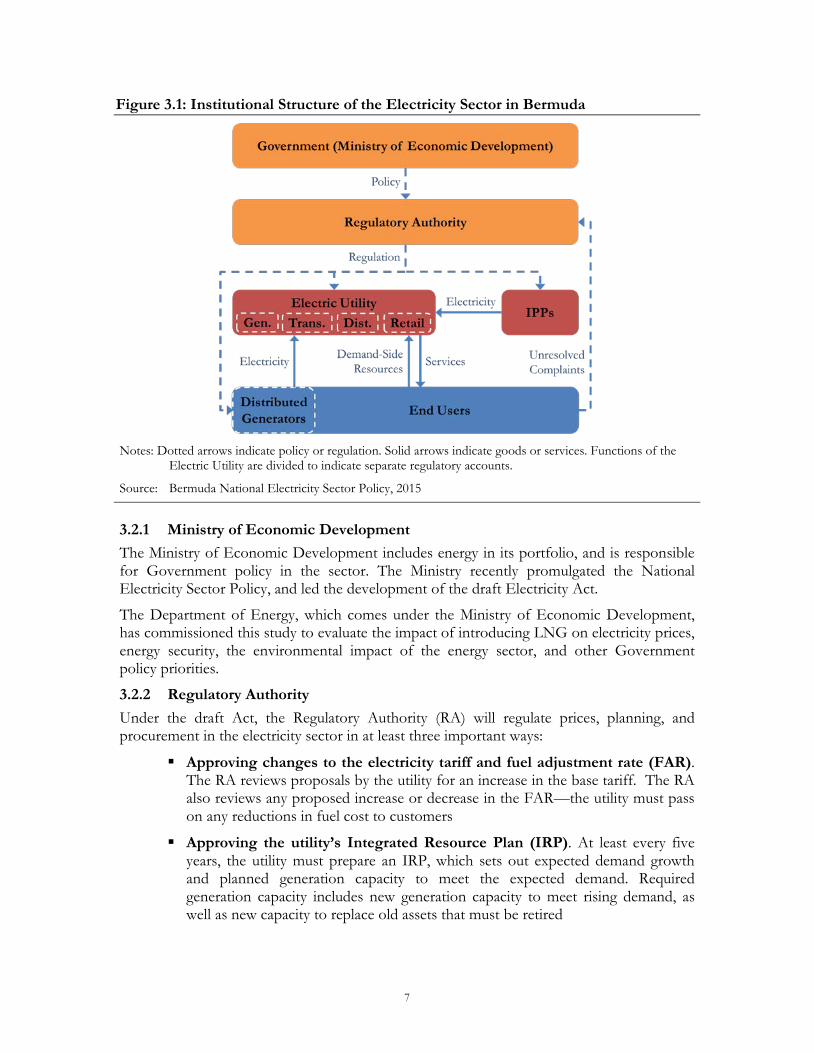
3.2 Institutional Structure of the Electricity Sector Figure 3.1 shows the expected institutional structure of the electricity sector, once the draft Act is passed. The electric utility is the monopoly entity licensed to transmit, distribute, and retail electricity in the country.13 Currently, BELCO is the only company that transmits, distributes, and retails electricity, and it is expected that BELCO will be granted the sole licence to transmit, distribute, and retail electricity under the renewed regulatory framework. The utility may also generate electricity, and purchase some electricity from independent power producers (IPPs) and distributed generators. The Regulatory Authority will oversee the electricity sector, under the policy guidance of the Government.
12 See page 7 of the National Electricity Sector Policy of Bermuda 13 It is expected that BELCO, currently the only entity that transmits, distributes, and retails electricity in Bermuda, will
apply for and be granted the license to transmit, distribute, and retail electricity under the draft Electricity Act, after it is passed.
7
Figure 3.1: Institutional Structure of the Electricity Sector in Bermuda
Notes: Dotted arrows indicate policy or regulation. Solid arrows indicate goods or services. Functions of the
Electric Utility are divided to indicate separate regulatory accounts.
Source: Bermuda National Electricity Sector Policy, 2015
3.2.1 Ministry of Economic Development The Ministry of Economic Development includes energy in its portfolio, and is responsible for Government policy in the sector. The Ministry recently promulgated the National Electricity Sector Policy, and led the development of the draft Electricity Act.
The Department of Energy, which comes under the Ministry of Economic Development, has commissioned this study to evaluate the impact of introducing LNG on electricity prices, energy security, the environmental impact of the energy sector, and other Government policy priorities.
3.2.2 Regulatory Authority Under the draft Act, the Regulatory Authority (RA) will regulate prices, planning, and procurement in the electricity sector in at least three important ways:
Approving changes to the electricity tariff and fuel adjustment rate (FAR). The RA reviews proposals by the utility for an increase in the base tariff. The RA also reviews any proposed increase or decrease in the FAR—the utility must pass on any reductions in fuel cost to customers
Approving the utility’s Integrated Resource Plan (IRP). At least every five years, the utility must prepare an IRP, which sets out expected demand growth and planned generation capacity to meet the expected demand. Required generation capacity includes new generation capacity to meet rising demand, as well as new capacity to replace old assets that must be retired
8
In addition, the RA must set up a challenge procedure for others to propose alternative generation options that they believe would be lower cost or more consistent with other policy objectives than the planned generation proposed by the utility. If credible developers can demonstrate that their generation options would result in a generation matrix that is more consistent with policy objectives, those options will be included in the IRP
Supervising procurement by the utility. The IRP must include a procurement plan for the utility to meet expected demand. The IRP must also provide for the regulatory supervision of the procurement process by the RA.
3.2.3 Bermuda Electric Light Company, Limited The Bermuda Electric Light Company, Limited (BELCO) has been providing electricity service since 1908, and is the only transmitter, distributer, and retailer in the country. BELCO owns and operates the national grid. It also generates more than 99 percent of the electricity consumed in the country, all at its central power plant in Pembroke.
BELCO’s current generation is based on a mix of oil products: a blend of heavy fuel oil (about 80 percent) and diesel (about 20 percent) for most baseload generation, with only diesel often used for peaking and intermediate generation. BELCO contracts for this fuel directly with a foreign supplier. The fuel is imported to the dock and fuel storage facility in Ferry Reach, which is owned by SOL. The fuel is transported from the storage facility to the BELCO plant in Pembroke through a pipeline, which is also owned by SOL, but built on Government-owned land. BELCO pays SOL to use its docking and storage facilities, and fuel pipeline. Fuel costs are passed on to customers through the Fuel Adjustment Rate (FAR) in the electricity tariff.
BELCO is currently preparing its Integrated Resource Plan (IRP). The IRP will lay out BELCO’s proposal for the least-cost and most sustainable way to generate electricity. One possibility that BELCO is evaluating is importing LNG to replace oil products for baseload generation.
3.2.4 SOL and RUBiS SOL is one of the largest fuel importers and retailers in the wider Caribbean region. The Barbados-based company bought ExxonMobil’s Caribbean assets (including those in Bermuda, where ExxonMobil retailed under the name Esso) in 2014.
As a result of this purchase, SOL owns and operates the only dock in Bermuda that imports fuel oil, at Ferry Reach. SOL imports gasoline and automotive diesel through its dock. The products are stored on-site. SOL retails these products at the petrol stations that it owns and operates (still branded as Esso).
SOL charges third parties to use the dock and store fuels at the site. BELCO imports fuel oil using the Ferry Reach dock and storage facilities, and the SOL-owned pipeline from the Ferry Reach Terminal to its Pembroke Power Plant. RUBiS, the other major importer and retailer of oil products to Bermuda, also imports gasoline and automotive diesel using the Ferry Reach dock. RUBiS pays SOL to use the dock, stores the products at its own nearby facility, and retails them at the RUBiS petrol stations.
9
3.3 Energy Supply and Demand In this section, we present Bermuda’s energy supply (Section 3.3.1) and demand (Section 3.3.2). This background provides important context about Bermuda’ energy market, including the magnitude of the opportunity for importing natural gas.
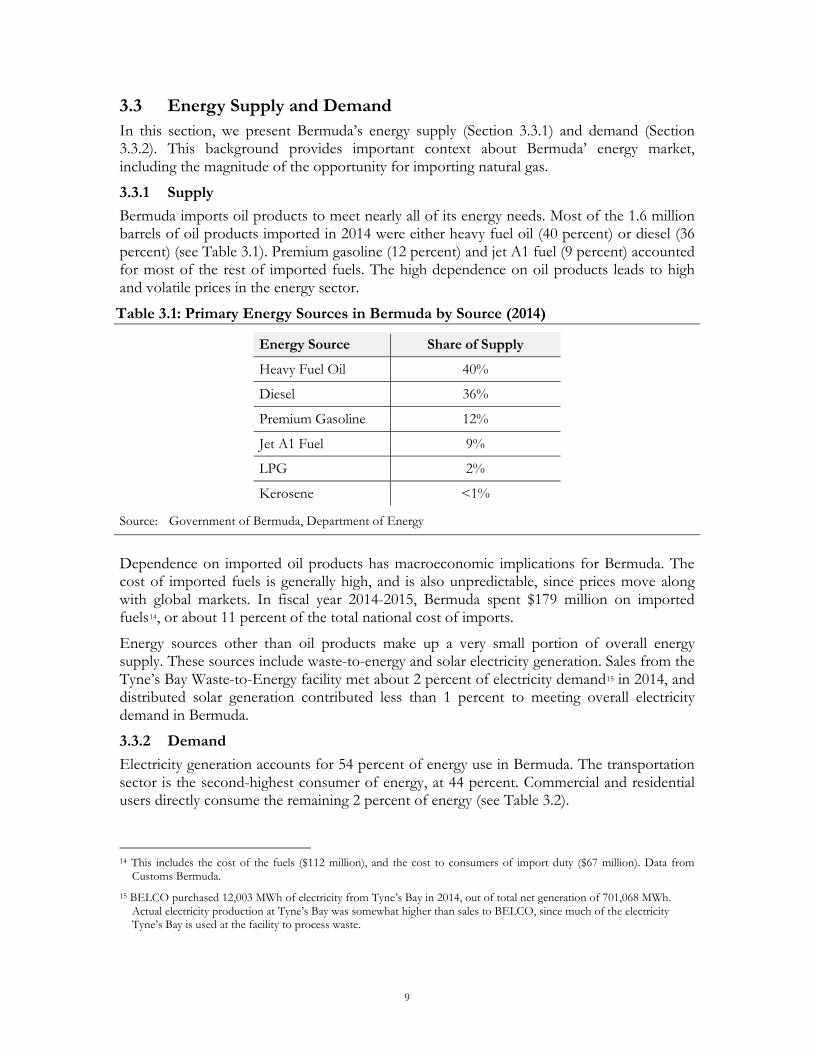
3.3.1 Supply Bermuda imports oil products to meet nearly all of its energy needs. Most of the 1.6 million barrels of oil products imported in 2014 were either heavy fuel oil (40 percent) or diesel (36 percent) (see Table 3.1). Premium gasoline (12 percent) and jet A1 fuel (9 percent) accounted for most of the rest of imported fuels. The high dependence on oil products leads to high and volatile prices in the energy sector.
Table 3.1: Primary Energy Sources in Bermuda by Source (2014)
Energy Source Share of Supply
Heavy Fuel Oil 40%
Diesel 36%
Premium Gasoline 12%
Jet A1 Fuel 9%
LPG 2%
Kerosene <1%
Source: Government of Bermuda, Department of Energy
Dependence on imported oil products has macroeconomic implications for Bermuda. The cost of imported fuels is generally high, and is also unpredictable, since prices move along with global markets. In fiscal year 2014-2015, Bermuda spent $179 million on imported fuels14, or about 11 percent of the total national cost of imports.
Energy sources other than oil products make up a very small portion of overall energy supply. These sources include waste-to-energy and solar electricity generation. Sales from the Tyne’s Bay Waste-to-Energy facility met about 2 percent of electricity demand15 in 2014, and distributed solar generation contributed less than 1 percent to meeting overall electricity demand in Bermuda.
3.3.2 Demand Electricity generation accounts for 54 percent of energy use in Bermuda. The transportation sector is the second-highest consumer of energy, at 44 percent. Commercial and residential users directly consume the remaining 2 percent of energy (see Table 3.2).
14 This includes the cost of the fuels ($112 million), and the cost to consumers of import duty ($67 million). Data from
Customs Bermuda. 15 BELCO purchased 12,003 MWh of electricity from Tyne’s Bay in 2014, out of total net generation of 701,068 MWh.
Actual electricity production at Tyne’s Bay was somewhat higher than sales to BELCO, since much of the electricity Tyne’s Bay is used at the facility to process waste.
10
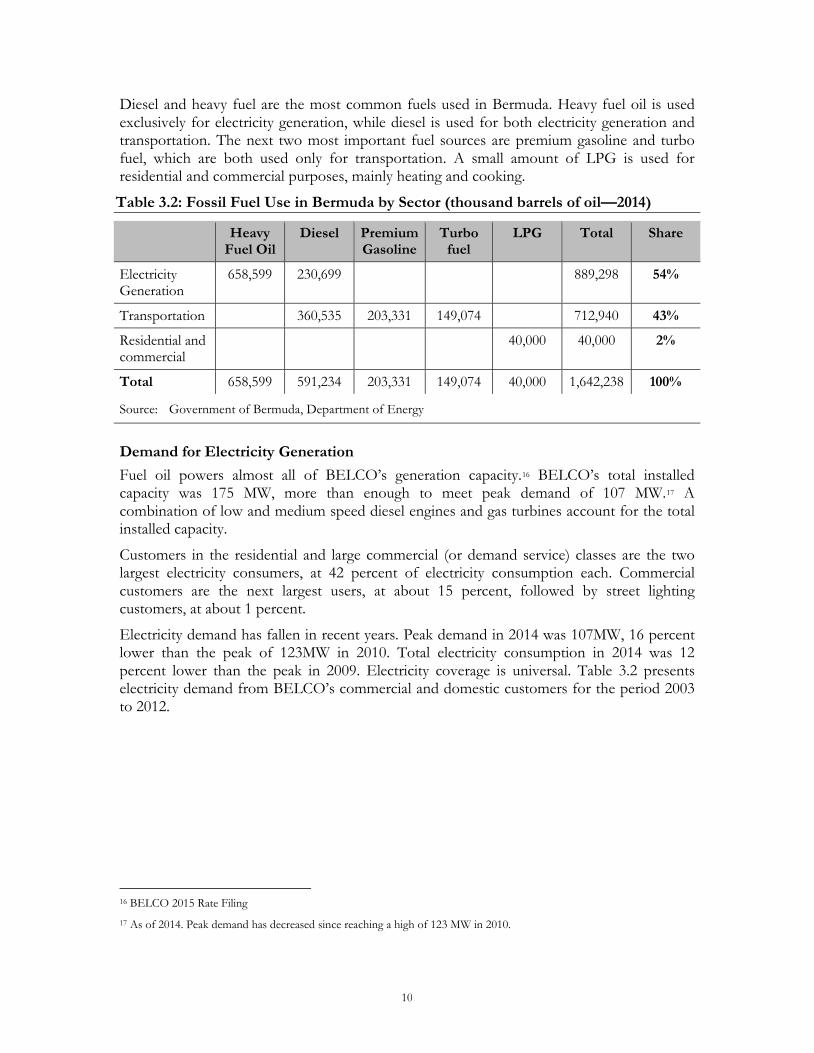
Diesel and heavy fuel are the most common fuels used in Bermuda. Heavy fuel oil is used exclusively for electricity generation, while diesel is used for both electricity generation and transportation. The next two most important fuel sources are premium gasoline and turbo fuel, which are both used only for transportation. A small amount of LPG is used for residential and commercial purposes, mainly heating and cooking.
Table 3.2: Fossil Fuel Use in Bermuda by Sector (thousand barrels of oil—2014)
Heavy Fuel Oil
Diesel Premium Gasoline
Turbo fuel
LPG Total Share
Electricity Generation
658,599 230,699 889,298 54%
Transportation 360,535 203,331 149,074 712,940 43%
Residential and commercial
40,000 40,000 2%
Total 658,599 591,234 203,331 149,074 40,000 1,642,238 100%
Source: Government of Bermuda, Department of Energy
Demand for Electricity Generation Fuel oil powers almost all of BELCO’s generation capacity.16 BELCO’s total installed capacity was 175 MW, more than enough to meet peak demand of 107 MW.17 A combination of low and medium speed diesel engines and gas turbines account for the total installed capacity.
Customers in the residential and large commercial (or demand service) classes are the two largest electricity consumers, at 42 percent of electricity consumption each. Commercial customers are the next largest users, at about 15 percent, followed by street lighting customers, at about 1 percent.
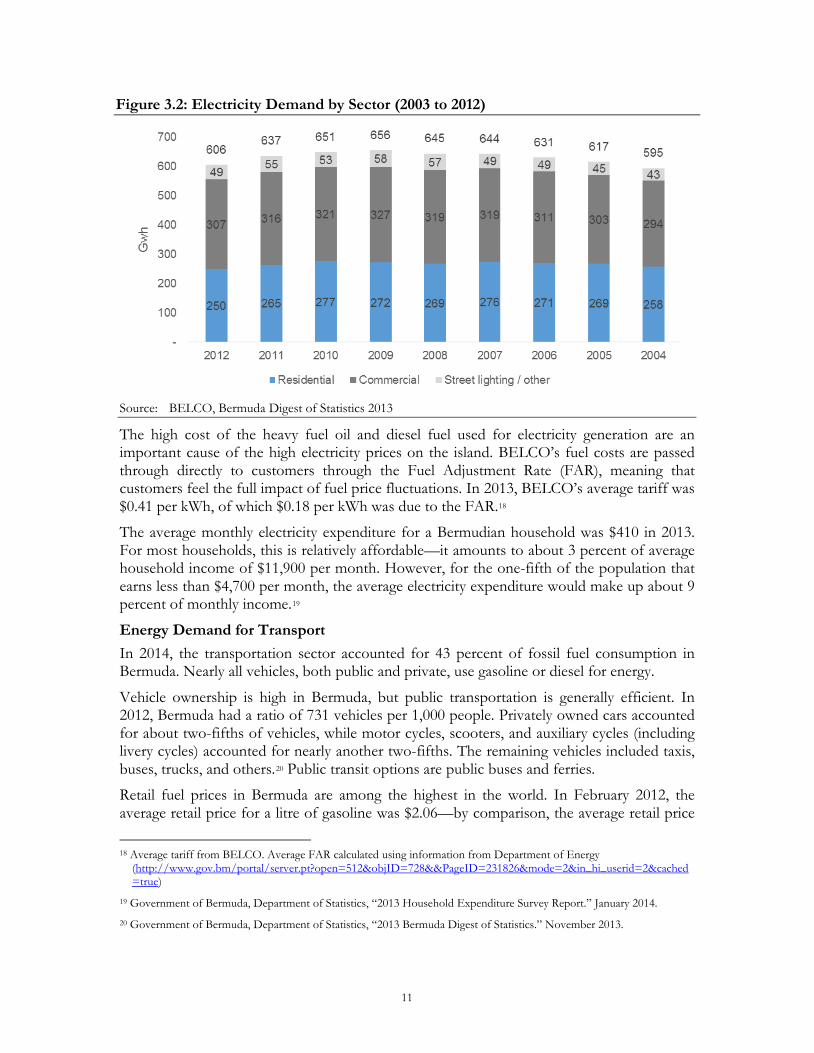
Electricity demand has fallen in recent years. Peak demand in 2014 was 107MW, 16 percent lower than the peak of 123MW in 2010. Total electricity consumption in 2014 was 12 percent lower than the peak in 2009. Electricity coverage is universal. Table 3.2 presents electricity demand from BELCO’s commercial and domestic customers for the period 2003 to 2012.
16 BELCO 2015 Rate Filing 17 As of 2014. Peak demand has decreased since reaching a high of 123 MW in 2010.
11
Figure 3.2: Electricity Demand by Sector (2003 to 2012)
Source: BELCO, Bermuda Digest of Statistics 2013
The high cost of the heavy fuel oil and diesel fuel used for electricity generation are an important cause of the high electricity prices on the island. BELCO’s fuel costs are passed through directly to customers through the Fuel Adjustment Rate (FAR), meaning that customers feel the full impact of fuel price fluctuations. In 2013, BELCO’s average tariff was $0.41 per kWh, of which $0.18 per kWh was due to the FAR.18
The average monthly electricity expenditure for a Bermudian household was $410 in 2013. For most households, this is relatively affordable—it amounts to about 3 percent of average household income of $11,900 per month. However, for the one-fifth of the population that earns less than $4,700 per month, the average electricity expenditure would make up about 9 percent of monthly income.19
Energy Demand for Transport In 2014, the transportation sector accounted for 43 percent of fossil fuel consumption in Bermuda. Nearly all vehicles, both public and private, use gasoline or diesel for energy.
Vehicle ownership is high in Bermuda, but public transportation is generally efficient. In 2012, Bermuda had a ratio of 731 vehicles per 1,000 people. Privately owned cars accounted for about two-fifths of vehicles, while motor cycles, scooters, and auxiliary cycles (including livery cycles) accounted for nearly another two-fifths. The remaining vehicles included taxis, buses, trucks, and others.20 Public transit options are public buses and ferries.
Retail fuel prices in Bermuda are among the highest in the world. In February 2012, the average retail price for a litre of gasoline was $2.06—by comparison, the average retail price
18 Average tariff from BELCO. Average FAR calculated using information from Department of Energy
(http://www.gov.bm/portal/server.pt?open=512&objID=728&&PageID=231826&mode=2&in_hi_userid=2&cached=true)
19 Government of Bermuda, Department of Statistics, “2013 Household Expenditure Survey Report.” January 2014. 20 Government of Bermuda, Department of Statistics, “2013 Bermuda Digest of Statistics.” November 2013.

12
for gasoline in the United States during the same period was $0.92, or less than half of the price in Bermuda. One possibility to reduce costs and the environmental impact of the transport sector is to convert public transit to use natural gas, once a supply chain for Bermuda to import natural gas has been established.
13
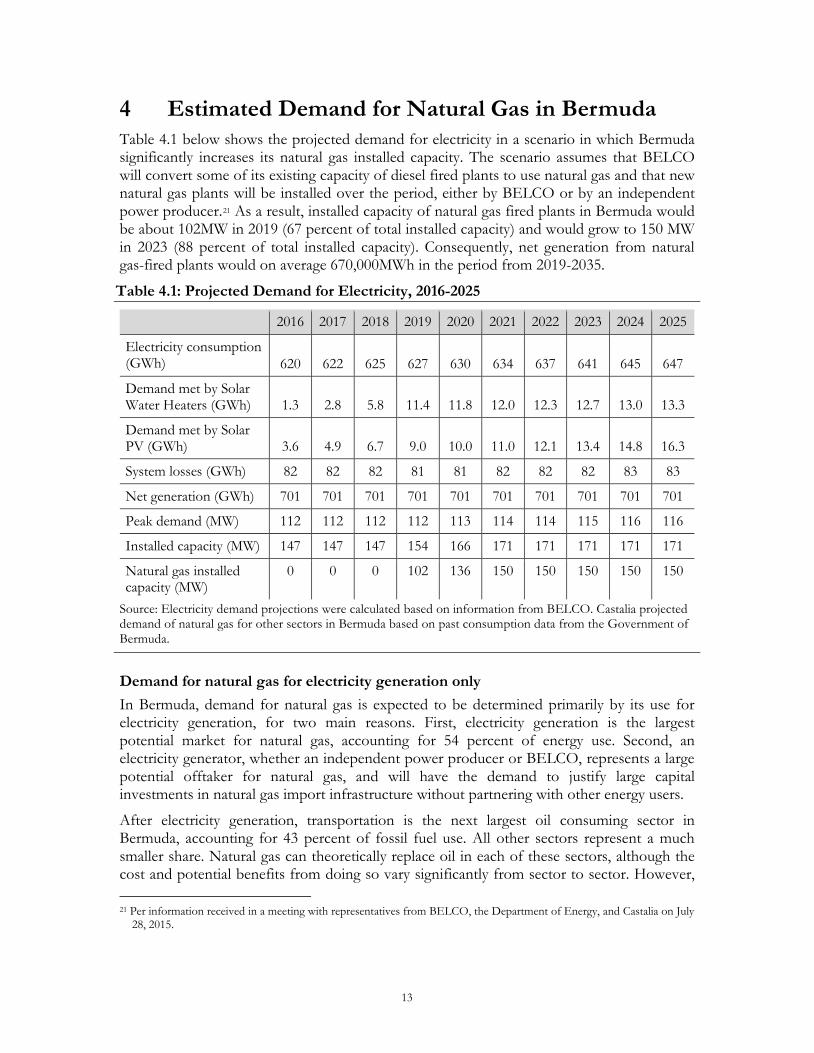
4 Estimated Demand for Natural Gas in Bermuda Table 4.1 below shows the projected demand for electricity in a scenario in which Bermuda significantly increases its natural gas installed capacity. The scenario assumes that BELCO will convert some of its existing capacity of diesel fired plants to use natural gas and that new natural gas plants will be installed over the period, either by BELCO or by an independent power producer.21 As a result, installed capacity of natural gas fired plants in Bermuda would be about 102MW in 2019 (67 percent of total installed capacity) and would grow to 150 MW in 2023 (88 percent of total installed capacity). Consequently, net generation from natural gas-fired plants would on average 670,000MWh in the period from 2019-2035.
Table 4.1: Projected Demand for Electricity, 2016-2025
2016 2017 2018 2019 2020 2021 2022 2023 2024 2025
Electricity consumption (GWh) 620 622 625 627 630 634 637 641 645 647
Demand met by Solar Water Heaters (GWh) 1.3 2.8 5.8 11.4 11.8 12.0 12.3 12.7 13.0 13.3
Demand met by Solar PV (GWh) 3.6 4.9 6.7 9.0 10.0 11.0 12.1 13.4 14.8 16.3
System losses (GWh) 82 82 82 81 81 82 82 82 83 83
Net generation (GWh) 701 701 701 701 701 701 701 701 701 701
Peak demand (MW) 112 112 112 112 113 114 114 115 116 116
Installed capacity (MW) 147 147 147 154 166 171 171 171 171 171
Natural gas installed capacity (MW)
0 0 0 102 136 150 150 150 150 150
Source: Electricity demand projections were calculated based on information from BELCO. Castalia projected demand of natural gas for other sectors in Bermuda based on past consumption data from the Government of Bermuda.
Demand for natural gas for electricity generation only In Bermuda, demand for natural gas is expected to be determined primarily by its use for electricity generation, for two main reasons. First, electricity generation is the largest potential market for natural gas, accounting for 54 percent of energy use. Second, an electricity generator, whether an independent power producer or BELCO, represents a large potential offtaker for natural gas, and will have the demand to justify large capital investments in natural gas import infrastructure without partnering with other energy users.
After electricity generation, transportation is the next largest oil consuming sector in Bermuda, accounting for 43 percent of fossil fuel use. All other sectors represent a much smaller share. Natural gas can theoretically replace oil in each of these sectors, although the cost and potential benefits from doing so vary significantly from sector to sector. However, 21 Per information received in a meeting with representatives from BELCO, the Department of Energy, and Castalia on July
28, 2015.
14
these sectors are more likely to purchase natural gas from offtakers that have already begun importing natural gas for electricity generation, rather than taking part in financing natural gas importation facilities themselves. This is the pattern that consumption followed in the Dominican Republic. Third parties signed the first purchase agreements with the natural gas importer, AES Dominicana—an electricity generation company—two years after the first shipment of LNG arrived in the country.
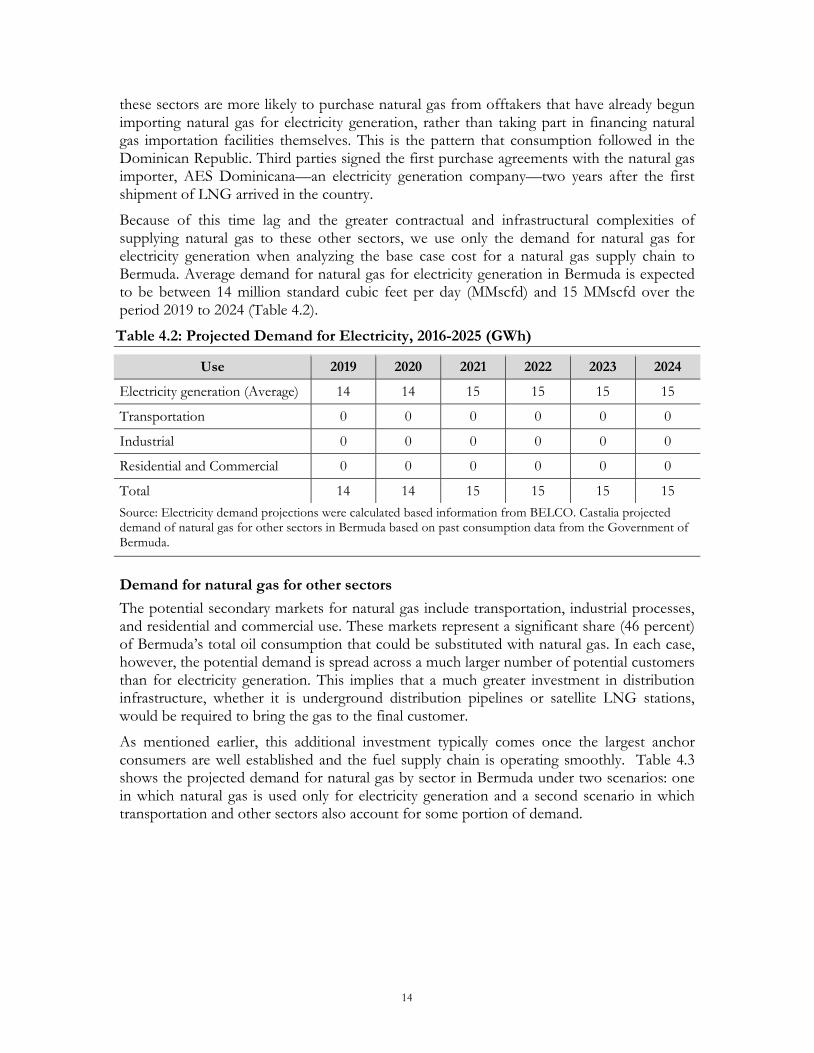
Because of this time lag and the greater contractual and infrastructural complexities of supplying natural gas to these other sectors, we use only the demand for natural gas for electricity generation when analyzing the base case cost for a natural gas supply chain to Bermuda. Average demand for natural gas for electricity generation in Bermuda is expected to be between 14 million standard cubic feet per day (MMscfd) and 15 MMscfd over the period 2019 to 2024 (Table 4.2).
Table 4.2: Projected Demand for Electricity, 2016-2025 (GWh)
Use 2019 2020 2021 2022 2023 2024
Electricity generation (Average) 14 14 15 15 15 15
Transportation 0 0 0 0 0 0
Industrial 0 0 0 0 0 0
Residential and Commercial 0 0 0 0 0 0
Total 14 14 15 15 15 15 Source: Electricity demand projections were calculated based information from BELCO. Castalia projected demand of natural gas for other sectors in Bermuda based on past consumption data from the Government of Bermuda.
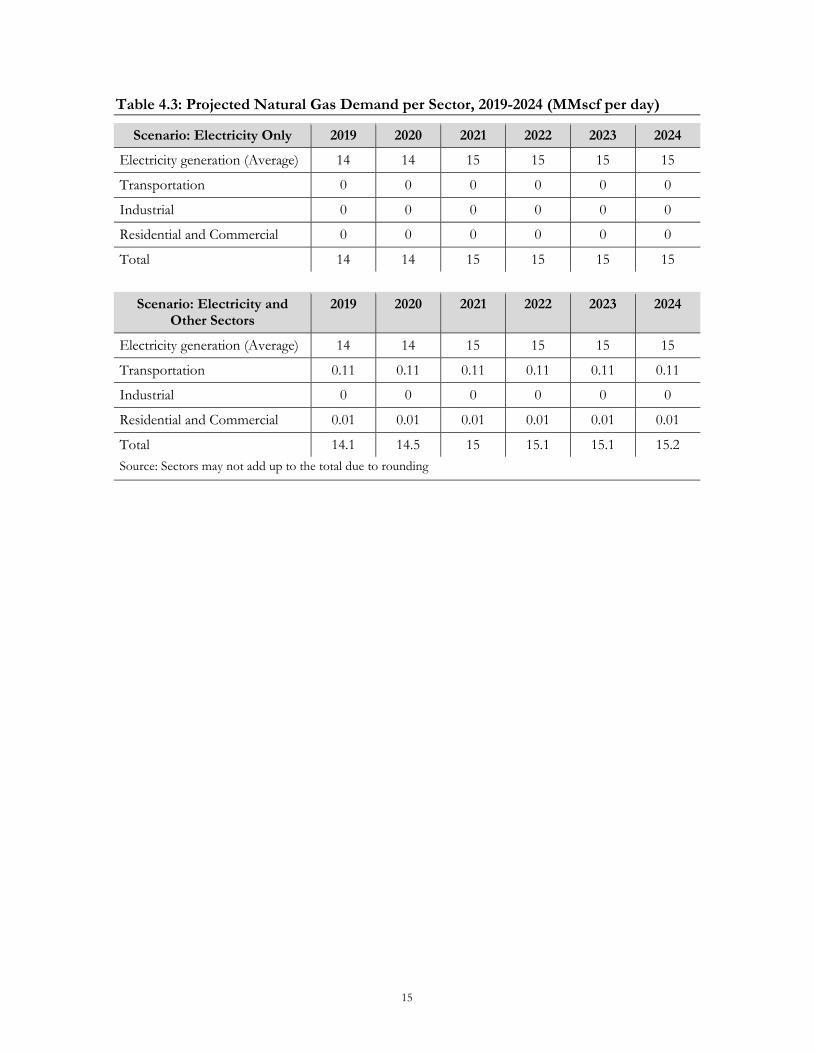
Demand for natural gas for other sectors The potential secondary markets for natural gas include transportation, industrial processes, and residential and commercial use. These markets represent a significant share (46 percent) of Bermuda’s total oil consumption that could be substituted with natural gas. In each case, however, the potential demand is spread across a much larger number of potential customers than for electricity generation. This implies that a much greater investment in distribution infrastructure, whether it is underground distribution pipelines or satellite LNG stations, would be required to bring the gas to the final customer.
As mentioned earlier, this additional investment typically comes once the largest anchor consumers are well established and the fuel supply chain is operating smoothly. Table 4.3 shows the projected demand for natural gas by sector in Bermuda under two scenarios: one in which natural gas is used only for electricity generation and a second scenario in which transportation and other sectors also account for some portion of demand.
15
Table 4.3: Projected Natural Gas Demand per Sector, 2019-2024 (MMscf per day)
Scenario: Electricity Only 2019 2020 2021 2022 2023 2024
Electricity generation (Average) 14 14 15 15 15 15
Transportation 0 0 0 0 0 0
Industrial 0 0 0 0 0 0
Residential and Commercial 0 0 0 0 0 0
Total 14 14 15 15 15 15
Scenario: Electricity and Other Sectors
2019 2020 2021 2022 2023 2024
Electricity generation (Average) 14 14 15 15 15 15
Transportation 0.11 0.11 0.11 0.11 0.11 0.11
Industrial 0 0 0 0 0 0
Residential and Commercial 0.01 0.01 0.01 0.01 0.01 0.01
Total 14.1 14.5 15 15.1 15.1 15.2 Source: Sectors may not add up to the total due to rounding
16
5 Cost of Importing LNG to Bermuda The spread, or difference, between natural gas prices and oil prices in North American markets suggests that there is room to economically transport natural gas to Bermuda (Section 5.1). Transporting liquefied natural gas (LNG) to Bermuda involves first liquefying the gas, then shipping it to Bermuda. Once it arrives it Bermuda, it must be stored and regasified, then transported to a power plant, where it is burned to generate electricity (Section 5.2). We consider two potential locations for receiving LNG in Bermuda, and burning natural gas to generate electricity (Section 5.3). Next, we estimate costs for fuel and electricity in the two LNG alternatives and for continued use of fuel oil (Section 5.4). Based on these estimates, we conclude that LNG will likely be cheaper than fuel oil, but that more information is needed on specific project sites to determine the best place to receive LNG in Bermuda (Section 5.5).
5.1 Spread between Oil and Gas Prices Future prices for oil and natural gas are highly uncertain.22 Although oil prices have dropped recently23, past price changes and current projections show that prices are uncertain and volatile. When assessing the feasibility of natural gas in the Caribbean, the two key data points are the spot price of oil at the time gas will be imported, and the spread between the prices of oil and natural gas.
Costs of delivering natural gas are higher than the costs of delivering fuel oil. Therefore, with a large spread, costs of delivering natural gas can be easily recovered, allowing for a delivered cost of LNG in Bermuda that is lower than the cost than oil products. With a smaller spread, it is more difficult to recover the costs of transporting natural gas. While the spread between oil and natural gas fell between mid-2014 and mid-2015 in the United States and other markets around the world, current prices and projections suggest that North American markets that depend on oil products, such as Bermuda, could save money by switching to natural gas.
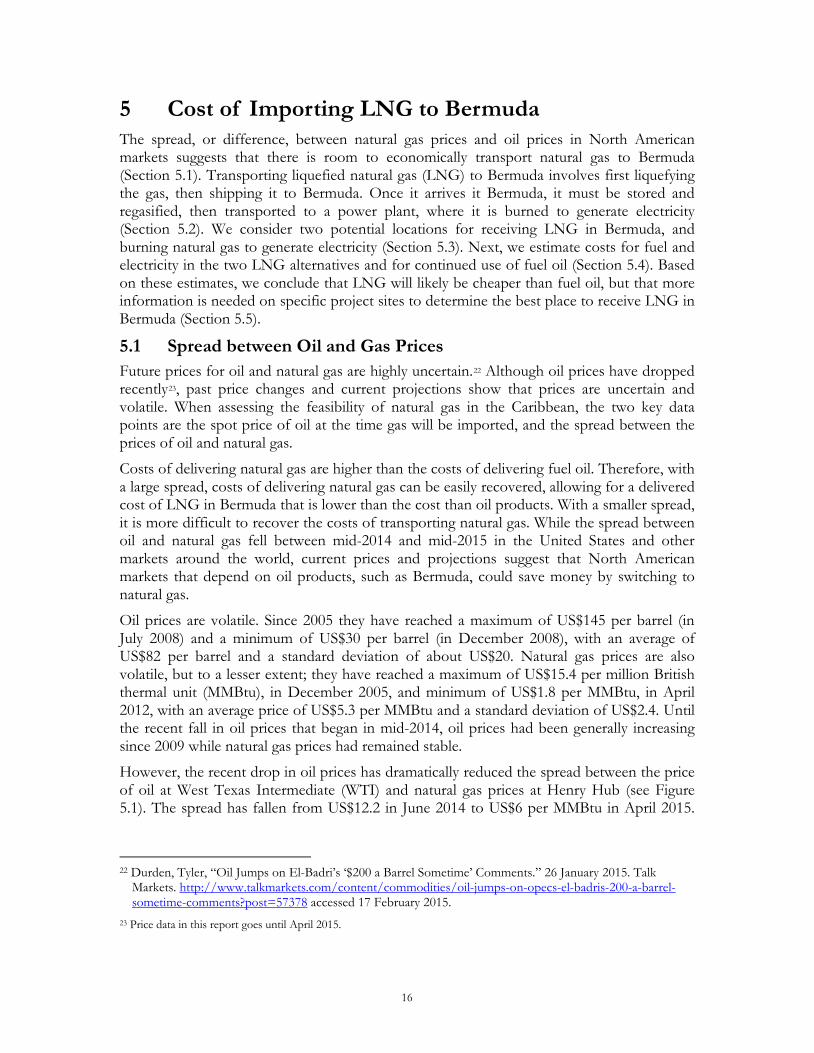
Oil prices are volatile. Since 2005 they have reached a maximum of US$145 per barrel (in July 2008) and a minimum of US$30 per barrel (in December 2008), with an average of US$82 per barrel and a standard deviation of about US$20. Natural gas prices are also volatile, but to a lesser extent; they have reached a maximum of US$15.4 per million British thermal unit (MMBtu), in December 2005, and minimum of US$1.8 per MMBtu, in April 2012, with an average price of US$5.3 per MMBtu and a standard deviation of US$2.4. Until the recent fall in oil prices that began in mid-2014, oil prices had been generally increasing since 2009 while natural gas prices had remained stable.
However, the recent drop in oil prices has dramatically reduced the spread between the price of oil at West Texas Intermediate (WTI) and natural gas prices at Henry Hub (see Figure 5.1). The spread has fallen from US$12.2 in June 2014 to US$6 per MMBtu in April 2015.
22 Durden, Tyler, “Oil Jumps on El-Badri’s ‘$200 a Barrel Sometime’ Comments.” 26 January 2015. Talk
Markets. http://www.talkmarkets.com/content/commodities/oil-jumps-on-opecs-el-badris-200-a-barrel-sometime-comments?post=57378 accessed 17 February 2015.
23 Price data in this report goes until April 2015.
17
This is despite a drop in natural gas prices during the same period—from US$4.6 per MMBtu in June 2014 to US$2.6 per MMBtu in April 2015.
Figure 5.1: Spot Prices of WTI and Henry Hub 2005-2015
Source: United States Energy Information Administration
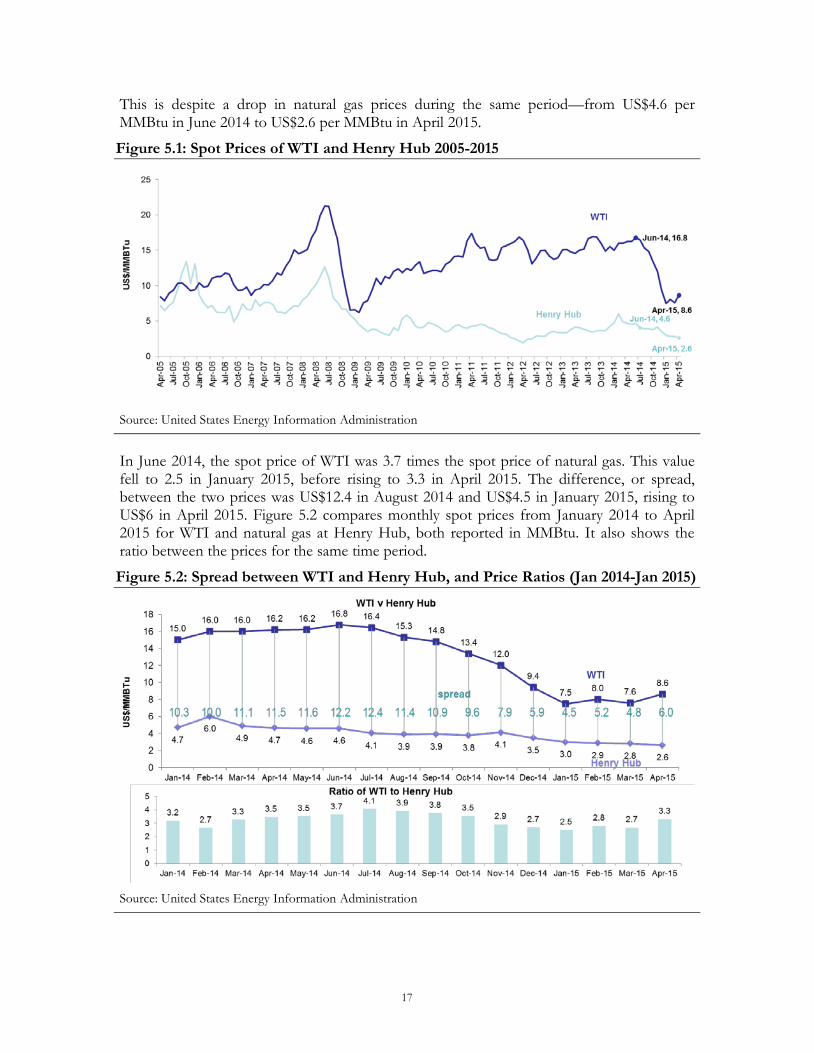
In June 2014, the spot price of WTI was 3.7 times the spot price of natural gas. This value fell to 2.5 in January 2015, before rising to 3.3 in April 2015. The difference, or spread, between the two prices was US$12.4 in August 2014 and US$4.5 in January 2015, rising to US$6 in April 2015. Figure 5.2 compares monthly spot prices from January 2014 to April 2015 for WTI and natural gas at Henry Hub, both reported in MMBtu. It also shows the ratio between the prices for the same time period.
Figure 5.2: Spread between WTI and Henry Hub, and Price Ratios (Jan 2014-Jan 2015)
Source: United States Energy Information Administration
18
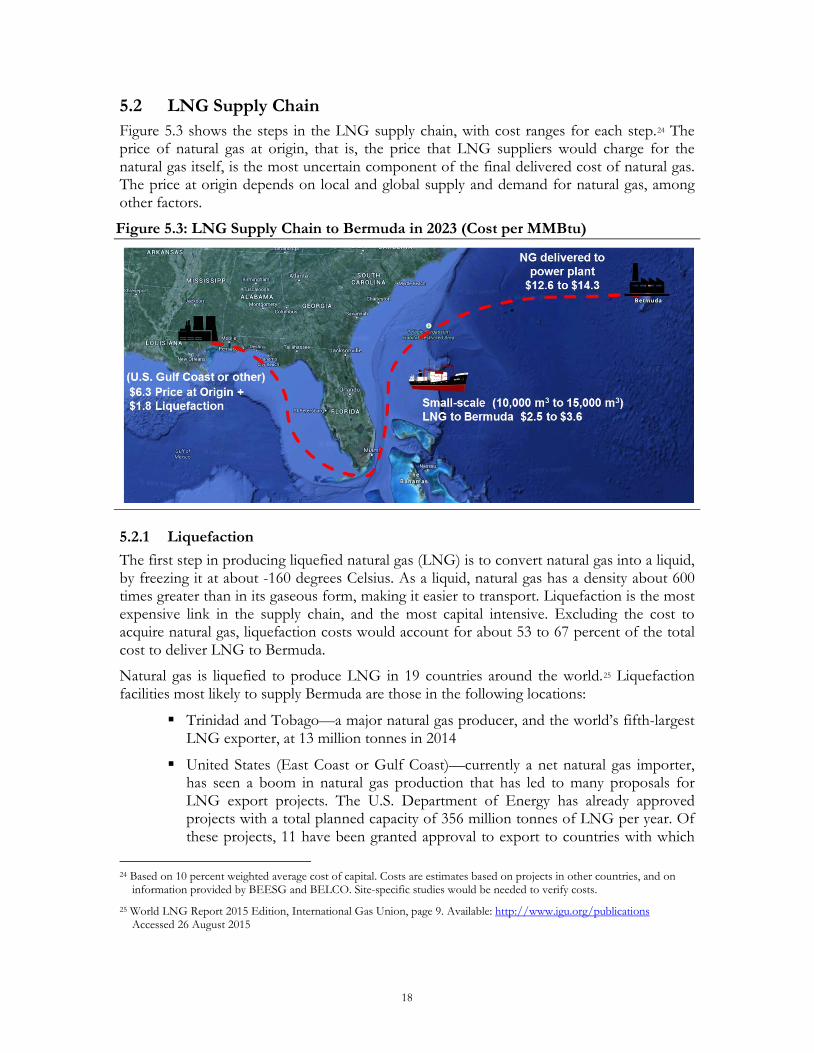
5.2 LNG Supply Chain Figure 5.3 shows the steps in the LNG supply chain, with cost ranges for each step.24 The price of natural gas at origin, that is, the price that LNG suppliers would charge for the natural gas itself, is the most uncertain component of the final delivered cost of natural gas. The price at origin depends on local and global supply and demand for natural gas, among other factors.
Figure 5.3: LNG Supply Chain to Bermuda in 2023 (Cost per MMBtu)
5.2.1 Liquefaction The first step in producing liquefied natural gas (LNG) is to convert natural gas into a liquid, by freezing it at about -160 degrees Celsius. As a liquid, natural gas has a density about 600 times greater than in its gaseous form, making it easier to transport. Liquefaction is the most expensive link in the supply chain, and the most capital intensive. Excluding the cost to acquire natural gas, liquefaction costs would account for about 53 to 67 percent of the total cost to deliver LNG to Bermuda.
Natural gas is liquefied to produce LNG in 19 countries around the world.25 Liquefaction facilities most likely to supply Bermuda are those in the following locations:
Trinidad and Tobago—a major natural gas producer, and the world’s fifth-largest LNG exporter, at 13 million tonnes in 2014
United States (East Coast or Gulf Coast)—currently a net natural gas importer, has seen a boom in natural gas production that has led to many proposals for LNG export projects. The U.S. Department of Energy has already approved projects with a total planned capacity of 356 million tonnes of LNG per year. Of these projects, 11 have been granted approval to export to countries with which
24 Based on 10 percent weighted average cost of capital. Costs are estimates based on projects in other countries, and on
information provided by BEESG and BELCO. Site-specific studies would be needed to verify costs.
25 World LNG Report 2015 Edition, International Gas Union, page 9. Available: http://www.igu.org/publications Accessed 26 August 2015
19
the United States does not have a free trade agreement, include one project (Sabine Pass in Louisiana) scheduled to begin shipping LNG in 2016
Canada (East Coast)—like in the United States, a boom in natural gas production has led to a large number of proposed LNG-export projects from Canada—35 nationwide, including a number on the East Coast targeting North American markets.
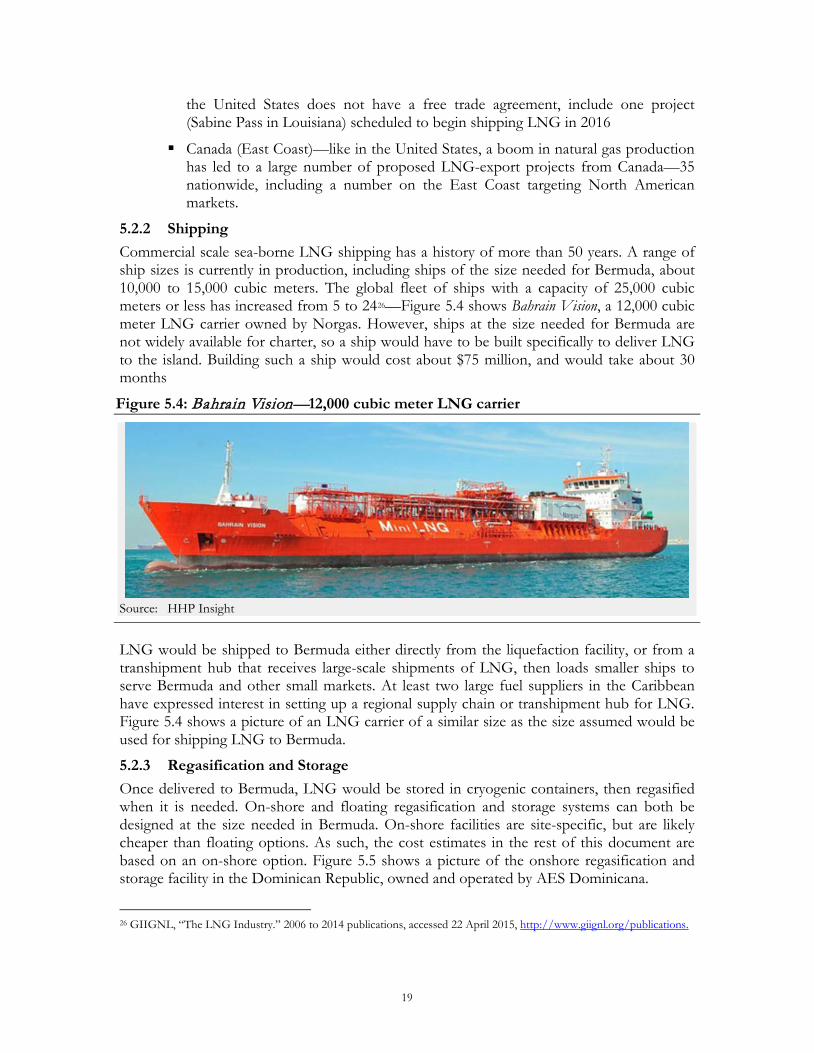
5.2.2 Shipping Commercial scale sea-borne LNG shipping has a history of more than 50 years. A range of ship sizes is currently in production, including ships of the size needed for Bermuda, about 10,000 to 15,000 cubic meters. The global fleet of ships with a capacity of 25,000 cubic meters or less has increased from 5 to 2426—Figure 5.4 shows Bahrain Vision, a 12,000 cubic meter LNG carrier owned by Norgas. However, ships at the size needed for Bermuda are not widely available for charter, so a ship would have to be built specifically to deliver LNG to the island. Building such a ship would cost about $75 million, and would take about 30 months
Figure 5.4: Bahrain Vision—12,000 cubic meter LNG carrier
Source: HHP Insight
LNG would be shipped to Bermuda either directly from the liquefaction facility, or from a transhipment hub that receives large-scale shipments of LNG, then loads smaller ships to serve Bermuda and other small markets. At least two large fuel suppliers in the Caribbean have expressed interest in setting up a regional supply chain or transhipment hub for LNG. Figure 5.4 shows a picture of an LNG carrier of a similar size as the size assumed would be used for shipping LNG to Bermuda.
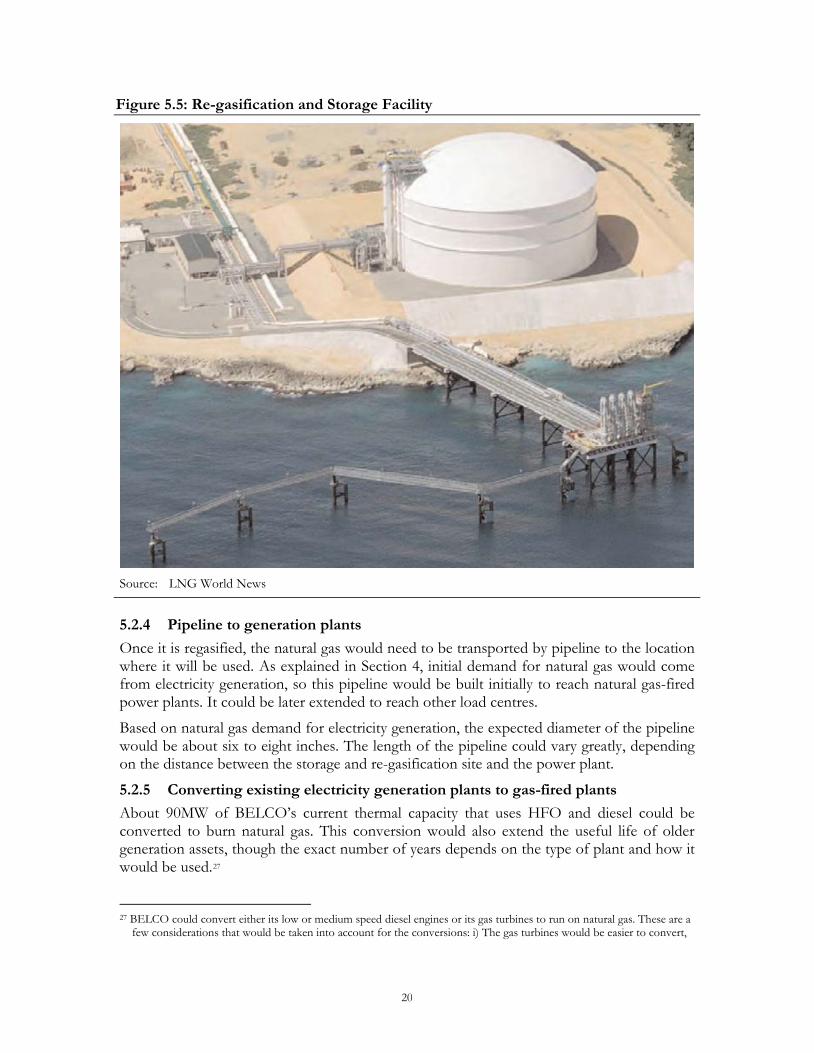
5.2.3 Regasification and Storage Once delivered to Bermuda, LNG would be stored in cryogenic containers, then regasified when it is needed. On-shore and floating regasification and storage systems can both be designed at the size needed in Bermuda. On-shore facilities are site-specific, but are likely cheaper than floating options. As such, the cost estimates in the rest of this document are based on an on-shore option. Figure 5.5 shows a picture of the onshore regasification and storage facility in the Dominican Republic, owned and operated by AES Dominicana.
26 GIIGNL, “The LNG Industry.” 2006 to 2014 publications, accessed 22 April 2015, http://www.giignl.org/publications.
20
Figure 5.5: Re-gasification and Storage Facility
Source: LNG World News
5.2.4 Pipeline to generation plants Once it is regasified, the natural gas would need to be transported by pipeline to the location where it will be used. As explained in Section 4, initial demand for natural gas would come from electricity generation, so this pipeline would be built initially to reach natural gas-fired power plants. It could be later extended to reach other load centres.
Based on natural gas demand for electricity generation, the expected diameter of the pipeline would be about six to eight inches. The length of the pipeline could vary greatly, depending on the distance between the storage and re-gasification site and the power plant.
5.2.5 Converting existing electricity generation plants to gas-fired plants About 90MW of BELCO’s current thermal capacity that uses HFO and diesel could be converted to burn natural gas. This conversion would also extend the useful life of older generation assets, though the exact number of years depends on the type of plant and how it would be used.27
27 BELCO could convert either its low or medium speed diesel engines or its gas turbines to run on natural gas. These are a
few considerations that would be taken into account for the conversions: i) The gas turbines would be easier to convert,
21
5.2.6 Building new plants for generating electricity New generation assets could also be built to use natural gas for electricity generation. The cost of new generation assets varies according to the technology used:
Combined cycle—Although they have the highest capital costs, combined cycle plants have lower fuel costs than other options, since they are more efficient
Simple cycle
Reciprocating engine.
For our calculations we assumed an average capital cost of new installed capacity of $1,701 and heat rates of 8,350 to 11,490 BTU per kilowatt hour, depending on the power plant technology. The assets could be built at the existing BELCO power plant in Pembroke—this would require a natural gas pipeline connecting the power plant to the terminal where the LNG is received and stored.
Alternatively, new generation assets could be built at the same site where the LNG is received and stored. This would not require a long natural gas pipeline, but could require upgrades to the transmission and distribution system to take on large amounts of electricity supply from a new location. In this option, trucks would also likely be required to transport natural gas to any generation capacity converted by BELCO.
5.3 Alternatives for an LNG Supply Chain in Bermuda Based on our consultations with stakeholders and review of the geography of Bermuda, there are two main alternatives for a location to build the facilities to receive, store, and regasify LNG. The first is the fuel-import jetty and terminal at Ferry Reach (‘the Ferry Reach Terminal’). The second is the currently unused space at Marginal Wharf, where a new jetty would be needed. The Dockyard on the western part of Bermuda was also mentioned as a potential location, but rejected due to conflicts with cruise ships that use the site.
Table 5.1 shows the two main alternatives—the Ferry Reach Terminal (Alternative 1) and Marginal Wharf (Alternative 2)—for bringing LNG to Bermuda, the infrastructure components to each option, and ways to generate electricity with natural gas. Each main alternative includes an additional way to generate electricity (Alternatives 1a and 2a). Below the table we give our preliminary observations on the components.28 However, we cannot draw firm conclusions on the viability and costs (or relative costs) of each site, given the limited project-specific information that we have.
but may also be relatively expensive to convert compared to more modern designs of gas turbines. ii) The cost of conversion would depend on how well maintenance had been carried out and the actual condition of each of the machines. iii) The degree of life extension would be dependent on the expected duty cycles. If they are expected to operate in a mode which required frequent stopping and starting, the life extension to be expected in terms of total hours would be less than if they would be expected to operate more or less continuously because of the higher degree of thermal cycling.
22
Table 5.1: Infrastructure Needed to Bring LNG to Bermuda for Electricity Generation
Infrastructure Alternative 1 Alternative 1a Alternative 2 Alternative 2a
Landing site Existing jetty at the Ferry Reach Terminal
Same as 1 New jetty at Marginal Wharf
Same as 2
Re-gasification and storage facility
Ferry Reach Terminal
Same as 1 Marginal Wharf Same as 2
Transporting NG to generation plants
Alongside existing oil pipeline
Minimal* Minimal* New pipeline needed
Generation plants Pembroke Power Plant
At fuel import terminal, new generation
Marginal Wharf Pembroke Power Plant
Electricity transmission and distribution
No additional needed
Needed to connect generation plants to existing grid
Needed to connect generation plants to existing grid
None additional needed
*For alternatives 1a and 2, more analysis would be required to determine if it would make sense to convert some BELCO’s plants.
Alternative 1 The receiving infrastructure for Alternative 1 holds a number of advantages. There is already a jetty in place at the Ferry Reach Terminal that could receive LNG carriers with minimal modifications, and the fuel storage site is relatively removed from surrounding residential or commercial areas.
Landing site—about $20 million would be needed to make some changes to the existing jetty at the Ferry Reach Terminal.29 These changes would be relatively minimal, reducing costs and lessening the environmental and social concerns of an additional dock. The jetty is easily accessible by sea for ships of the adequate size, though this may leave ships exposed to extreme weather when docking
Re-gasification and storage facility—The Ferry Reach Terminal appears relatively well-suited for a re-gasification and storage facility. The property is currently zoned as industrial land, is large enough to build the facility, and is relatively removed from residential or commercial areas. The Terminal is also surrounded by a mound, making it relatively well protected from the elements, and also protecting nearby buildings from the very small possibility of a fire or explosion. The approximate investment to build the re-gasification and storage facility is around $57 million
29 Based on Castalia’s estimates for Natural Gas in the Caribbean—Feasibility Study for the Inter-American Development
Bank
23
Transporting NG to generation plants—The approximate cost of building a natural gas pipeline alongside the existing oil pipeline to the Pembroke Power Plant is around $12 million.30 This path has a number of advantages, compared to the alternatives for transporting natural gas within Bermuda:
– No need to acquire new land for the pipeline, since land is Government-owned
– Minimized added risk to residents of a new pipeline, since additional residences and businesses would not be near a new fuel pipeline
– Possibility to reach other load centres along or near the pipeline, such as Tyne’s Bay Waste-to-Energy Plant, the Bermuda National Sports Centre, the King Edward VII Memorial Hospital, and others
– Reduced monitoring and maintenance costs, since the oil and gas pipelines could be checked and maintained together
Generation plants—a combination of new plants and existing plants converted to use natural gas would take natural gas from the pipeline. All plants would be at the Pembroke Power Plant, which is appropriately zoned and has adequate space. The costs of converting the power plant would be around $31 million and building the new plants would cost about $138 million31
Electricity transmission and distribution—no improvements or additions to the grid would be needed.
In Alternative 1a, electricity would be generated at the Ferry Reach Terminal, rather than at the Pembroke Power Plant. Alternative 1 is likely preferable to Alternative 1a because of potential space constraints at the Ferry Reach Terminal and because of the need for significant additions and improvements to transmission and distribution infrastructure.
Transporting NG to generation plants—this would be minimal (a small local pipeline), since new generation would be at the same location as storage and re-gasification. If some generation were to be reconverted at the Pembroke Power Plant, there would be costs associated with transporting that natural gas to Pembroke
Generation plants—new generation assets would be needed at the Ferry Reach Terminal. More detailed studies would be needed to determine if there is sufficient space at the Terminal for generation assets, as well as the storage and re-gasification infrastructure
Electricity transmission and distribution—significant additions and improvements would be needed to extend transmission lines to the Ferry Reach Terminal and ensure a balanced grid. A detailed feasibility study would be needed
30 Distance between Ferry Reach Terminal and Pembroke Power Plant provided by BELCO. The capital cost per mile was
calculated using information from comparable countries. 31 The cost per installed megawatt of new capacity was calculated based on the average unit capital cost for candidate
natural gas power plants, based on information provided by BELCO. The cost of converting existing power plants was based on Table 1 of the Annual Energy Outlook of 2013 by the EIA.
24
to identify what grid improvements would be required, and the cost of these improvements.
Alternative 2 Alternative 2 could also be feasible, but the project would require entirely new construction, including a new jetty. In addition, the area is currently zoned for mixed use, rather than industrial use, and environmental and social concerns may be too large to allow for the area to be permitted for LNG storage and re-gasification.
Landing site—a new dock would be required at Marginal Wharf, which may have environmental and social impact concerns. In addition, building the dock could be more expensive than in Alternative 1, with a total cost of around $38 million.32 Our understanding is that ships would be able to fit through Town Cut to reach Marginal Wharf, though this would depend on the exact size of the ship
Re-gasification and storage facility—there appears to be sufficient space for re-gasification and storage facilities at Marginal Wharf. The cost of building the facilities would be around $63 million.33 However, there are concerns about:
– Land ownership. The Bermuda Land Development Company controls the site, and it is not clear that it would be made available for an LNG import project
– Permitting. The land is currently zoned for mixed-use, which would have to be changed to industrial use
– Social impacts. The land is close to residences and businesses, creating concerns about the noise and potential safety risks
Transporting NG to generation plants—this would be minimal (a small local pipeline), since generation would be on-site. It could be a higher cost if some natural gas were to be transported to generate electricity in reconverted plants at the Pembroke Power Plant
Generation plants—investment in converting existing generation plants is assumed to be the same as Alternative 1—$31 million.34 Building new plants would cost $156 million.35 Building generation plants at Marginal Wharf creates similar obstacles to placing a re-gasification and storage facility there:
– Land ownership. The Bermuda Land Development Company controls the site, and it is not clear that it would be made available for an LNG import project
32 Based on information provided by BEESG 33 Based on information provided by BEESG 34 Alternative 2 assumes that the offtaker would buy natural gas for electricity generation at Marginal Wharf. However, it
also assumes that it would sell some of the natural gas to BELCO for electricity generation with converted power plants at Pembroke. Natural gas going from Marginal Wharf to the Pembroke Power Plant could be transported by pipeline or trucks. The cost of the infrastructure and operation of this segment of the supply chain has not been considered in the costing model and needs to be added when considering Alternative 2.
35 For Alternative 1, the cost per installed megawatt hour was calculated based on the average unit capital cost for candidate natural gas power plants, based on information provided by BELCO. For Alternative 2, the capital cost per installed megawatt hour was provided by BEESG.
25
– Permitting. The land is currently zoned for mixed-use, which would have to be changed to industrial use
– Social impacts. The land is close to residences and businesses, creating concerns about the noise and potential safety risks
– Space. A more detailed study would be needed to determine if there is sufficient space for new generation assets in addition to storage and re-gasification infrastructure. However, initial surveys suggest that there is more than enough space at Marginal Wharf for re-gasification and storage infrastructure, as well as a power plant
Electricity transmission and distribution—significant additions and improvements would be needed to extend transmission lines to the Marginal Wharf site, and ensure a balanced grid. The additions and improvements would cost around $30 million.36 However, a detailed feasibility study would be needed on needed additions and the cost.
In Alternative 2a, electricity would be generated at the Pembroke Power Plant, rather than at Marginal Wharf. This would require the following changes compared to Alternative 2.
Transporting NG to generation plants—a pipeline would be needed between Marginal Wharf and the Pembroke Power Plant. The pipeline would almost certainly need to cross private land. A detailed feasibility study would be needed on the best path for this pipeline, and the cost. Another option would be to transport the NG by trucks; however, the many daily trips required may not be acceptable to residents
Generation plants—a combination of new plants and existing plants converted to use natural gas would take natural gas from the pipeline. All plants would be at the Pembroke Power Plant, which is appropriately zoned and has adequate space
Electricity transmission and distribution—no improvements or additions to the grid would be needed.
5.4 Estimated Costs of Alternative Fuels for Baseload Generation in Bermuda
In this section we present the estimated investment and operating costs for delivering natural gas, via LNG, and then using that natural gas to produce electricity under Alternatives 1 and 2. We begin by presenting the investment costs related to each of the segments for delivering LNG. We then show how these investment costs plus other costs result in final costs of delivered LNG and costs of electricity. These costs of electricity are the same regardless of who owns the assets—the cost estimates are based on levelized tariffs for capital costs, plus operating and maintenance expenses, which should be the same for all market structures—assuming any market player would require similar returns. We estimated the return required for energy-sector investments in Bermuda at around 10 percent. 37
36 Based on information provided by BEESG
37 Castalia estimates a 10 percent real discount rate is equal to around 13.3 percent nominal discount rate, if we assume inflation will be around 3 percent in 2018. A 13 percent discount rate would be a reasonable return if companies are
26
5.4.1 Assumptions used in this cost analysis For the cost analysis we used the following assumptions:
Natural gas is the fuel chosen for thermal electricity generation. Gas-fired capacity would include conversions of existing fuel oil-fired thermal plants and construction of new thermal plants
Acquired price of natural gas. We assume that natural gas suppliers would price natural gas based on the substitution cost approach. A substitution cost approach links the price of LNG with the fuel that it is replacing in the destination market. In Bermuda, natural gas would substitute fuel oil (including heavy fuel oil and diesel). Therefore, LNG prices would be discounted from fuel oil parity, that is, the equivalent price of fuel oil on a per energy basis
Natural gas would first be introduced for generating electricity, and would only later be used for other activities (such as transportation). For our cost calculations, we assume that it is introduced for generating electricity only
Some feasible supply points are Canada, the United States, and Trinidad and Tobago. We use the facility in Sabine Pass (Louisiana, USA) for our cost calculations38
Rates of return for investors are 10 percent in real terms for all market segments and for any operator. A 10 percent real discount rate is the reasonable return that a power company in Bermuda could get—estimated using the weighted average cost of capital
By not including the cost of fuel tariffs in our calculation, we assume that all fuels will assessed duty at an equal rate. The Government is currently exploring options to update the tariffs for imported fuels. As a result of this process, it is expected that duty for all fuels will be equal on a per energy basis—though fuels with environmental benefits may have a lower tariff rate. Since LNG releases lower emissions that fuel oil, this assumption is a conservative one. LNG could be even more attractive relative to fuel oil, with relatively lower tariffs.
5.4.2 Investment Costs Figure 5.6 shows the investment costs that would be required to make sure that all the assets for generating electricity with natural gas are in place. For Alternative 1, the figure shows that investment costs of about $258 million would be required over a five-year period (from 2016 to 2020). Of these investments, new power plants would represent the highest capital cost (representing 53 percent of these costs), with a total capital investment of about $138 million dollars. The cost of the re-gasification facility, the pipeline to the power plants and the conversion of the existing power plants, is divided evenly over the three years needed to build these facilities (from 2016 to 2018).
financed with 50 percent equity at a cost of equity of 15.3 percent (estimated by Castalia for energy investments in the Caribbean region using the CAPM model) and 50 percent debt at a cost of debt of 9 percent.
38 It is feasible that LNG could be available from Angola or Nigeria on a spot basis. Our cost calculations do not take this possibility into account. However, we do note it as a possibility that suppliers could use in particular situations.
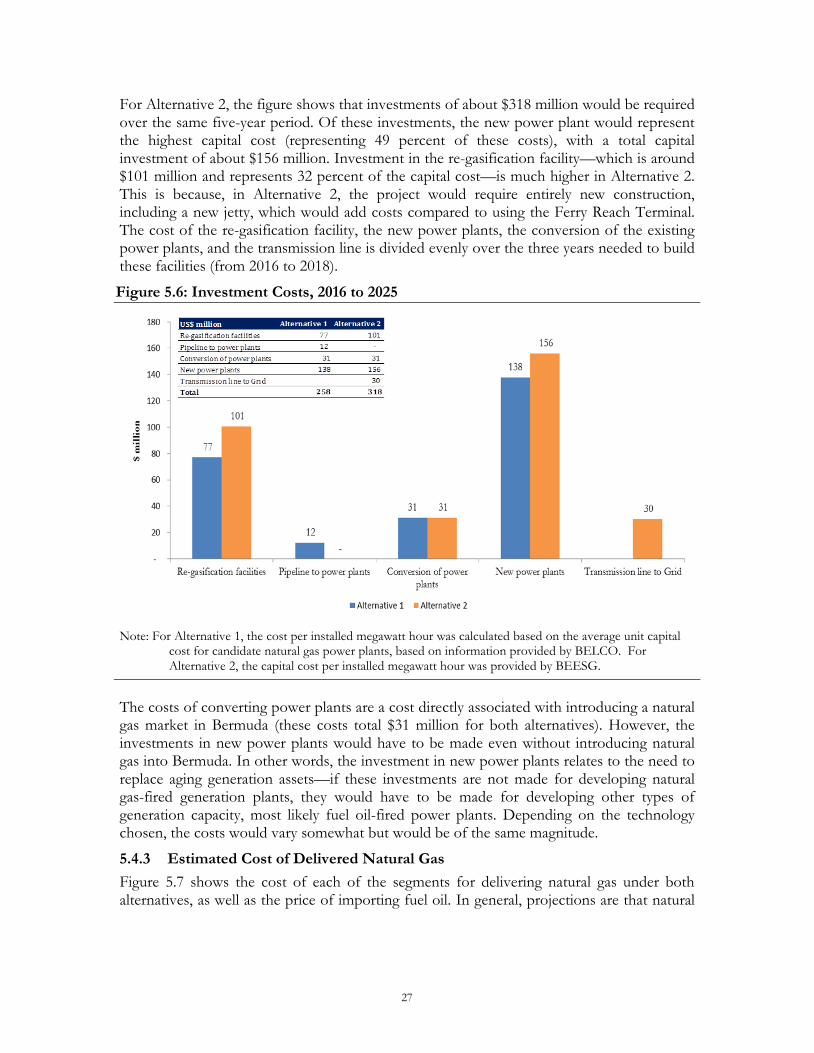
27
For Alternative 2, the figure shows that investments of about $318 million would be required over the same five-year period. Of these investments, the new power plant would represent the highest capital cost (representing 49 percent of these costs), with a total capital investment of about $156 million. Investment in the re-gasification facility—which is around $101 million and represents 32 percent of the capital cost—is much higher in Alternative 2. This is because, in Alternative 2, the project would require entirely new construction, including a new jetty, which would add costs compared to using the Ferry Reach Terminal. The cost of the re-gasification facility, the new power plants, the conversion of the existing power plants, and the transmission line is divided evenly over the three years needed to build these facilities (from 2016 to 2018).
Figure 5.6: Investment Costs, 2016 to 2025
Note: For Alternative 1, the cost per installed megawatt hour was calculated based on the average unit capital
cost for candidate natural gas power plants, based on information provided by BELCO. For Alternative 2, the capital cost per installed megawatt hour was provided by BEESG.
The costs of converting power plants are a cost directly associated with introducing a natural gas market in Bermuda (these costs total $31 million for both alternatives). However, the investments in new power plants would have to be made even without introducing natural gas into Bermuda. In other words, the investment in new power plants relates to the need to replace aging generation assets—if these investments are not made for developing natural gas-fired generation plants, they would have to be made for developing other types of generation capacity, most likely fuel oil-fired power plants. Depending on the technology chosen, the costs would vary somewhat but would be of the same magnitude.
5.4.3 Estimated Cost of Delivered Natural Gas Figure 5.7 shows the cost of each of the segments for delivering natural gas under both alternatives, as well as the price of importing fuel oil. In general, projections are that natural
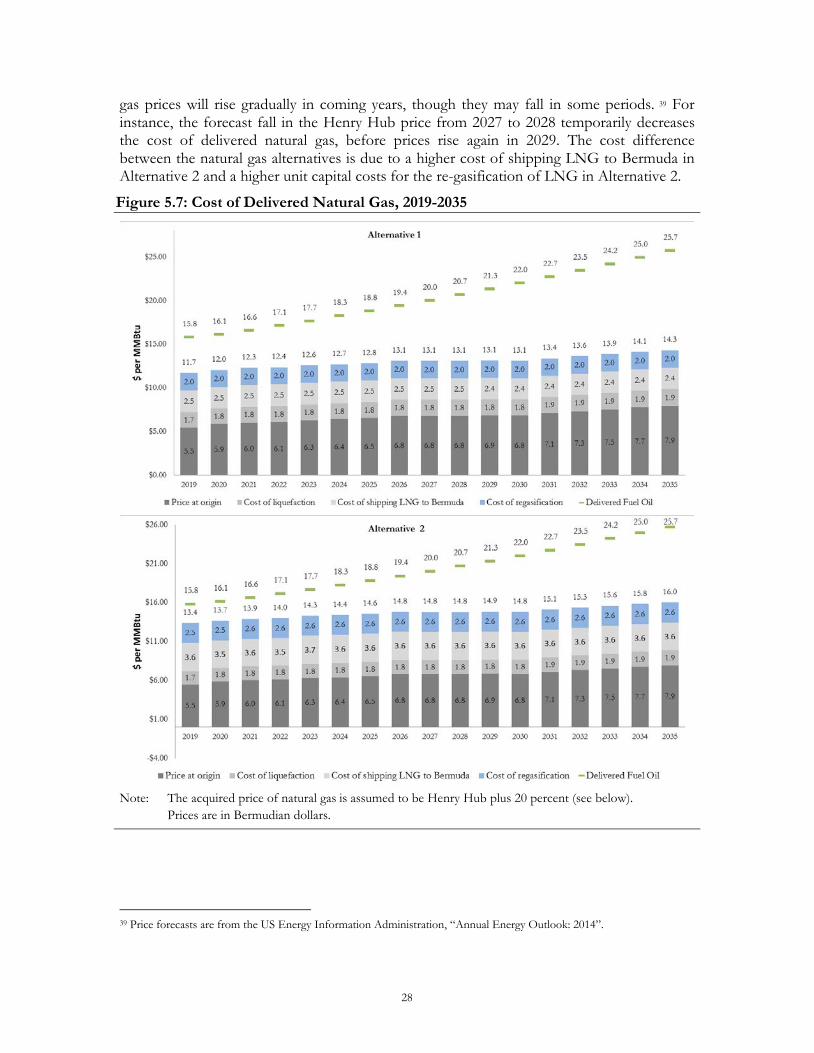
28
gas prices will rise gradually in coming years, though they may fall in some periods. 39 For instance, the forecast fall in the Henry Hub price from 2027 to 2028 temporarily decreases the cost of delivered natural gas, before prices rise again in 2029. The cost difference between the natural gas alternatives is due to a higher cost of shipping LNG to Bermuda in Alternative 2 and a higher unit capital costs for the re-gasification of LNG in Alternative 2.
Figure 5.7: Cost of Delivered Natural Gas, 2019-2035
Note: The acquired price of natural gas is assumed to be Henry Hub plus 20 percent (see below).
Prices are in Bermudian dollars.
39 Price forecasts are from the US Energy Information Administration, “Annual Energy Outlook: 2014”.
29
These costs of delivered natural gas provide an attractive discount on fuel oil prices.40 As Figure 5.8 shows, under both alternatives, Bermuda would get natural gas delivered at costs ranging from 26 to 44 percent lower than the cost of fuel oil.
Figure 5.8: Discount on Fuel Oil Prices
Assuming non-fuel operating costs and capital costs are similar for fuel oil and natural gas plants, these reductions in the prices of fuel oil will translate into discounts in the cost of generating electricity. Below, we provide further detail of the estimated cost of generating electricity with natural gas for Bermuda.
5.4.4 Estimated cost of generating electricity with natural gas We estimated the cost of generating electricity with natural gas by calculating a levelized tariff that would cover the capital costs related to investing in power plants, including a return on investments of 10 percent over 25 years for power plants, and adding the operating costs. Figure 5.9 shows the resulting costs for electricity generation in Bermuda under both alternatives. Under Alternative 2 the costs of generating electricity with natural gas are on average $0.02 more expensive per kilowatt hour, compared to Alternative 1.
40 Price forecasts for HFO are based on current prices in Bermuda, indexed to the U.S. EIA’s forecast for WTI prices (from
U.S. Energy Information Administration, “Annual Energy Outlook: 2015”.
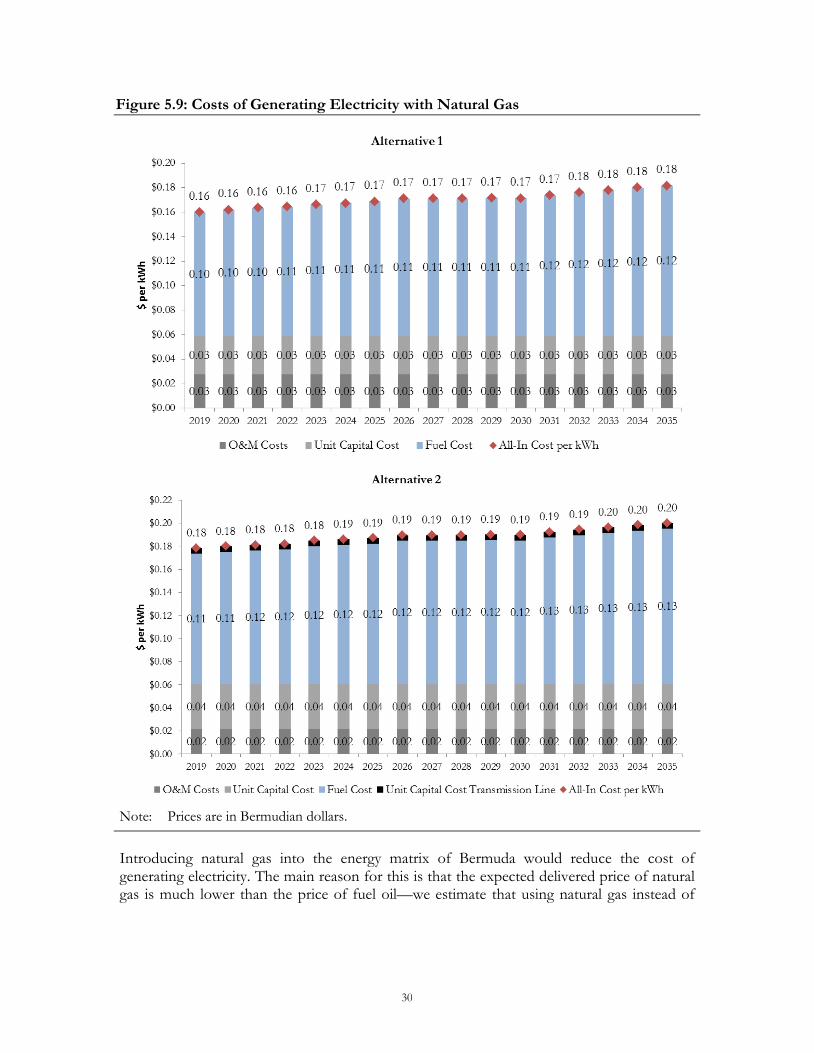
30
Figure 5.9: Costs of Generating Electricity with Natural Gas
Note: Prices are in Bermudian dollars.
Introducing natural gas into the energy matrix of Bermuda would reduce the cost of generating electricity. The main reason for this is that the expected delivered price of natural gas is much lower than the price of fuel oil—we estimate that using natural gas instead of
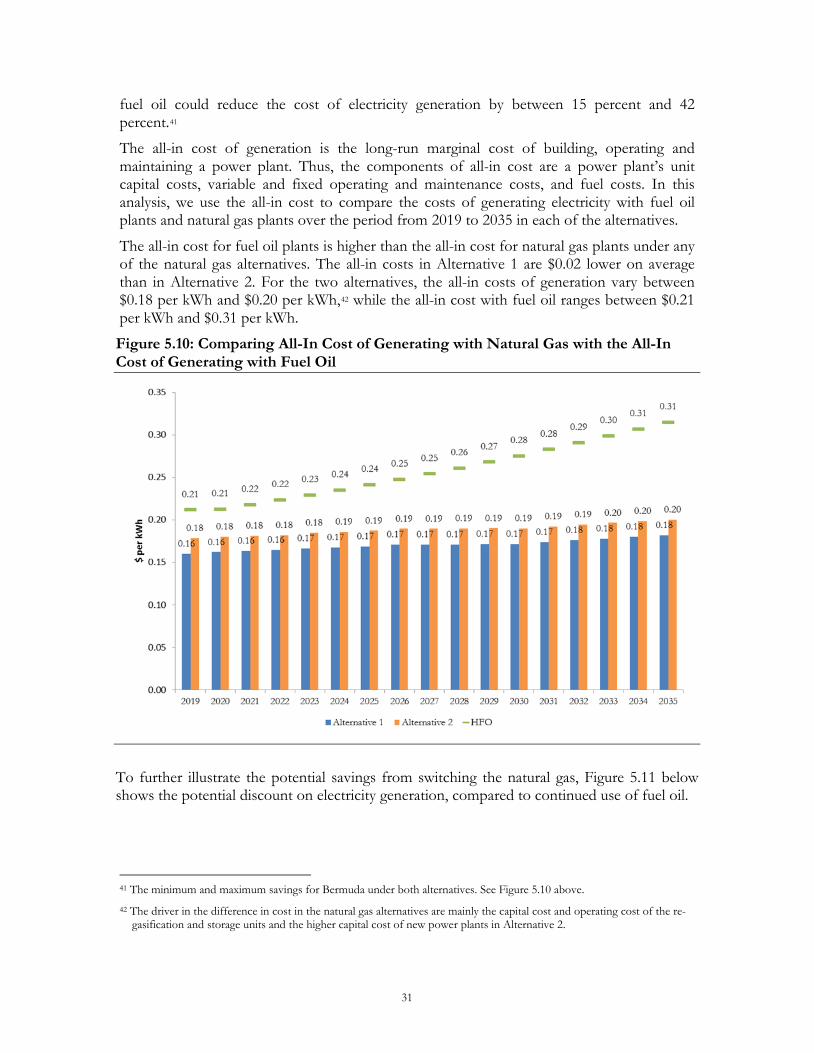
31
fuel oil could reduce the cost of electricity generation by between 15 percent and 42 percent.41
The all-in cost of generation is the long-run marginal cost of building, operating and maintaining a power plant. Thus, the components of all-in cost are a power plant’s unit capital costs, variable and fixed operating and maintenance costs, and fuel costs. In this analysis, we use the all-in cost to compare the costs of generating electricity with fuel oil plants and natural gas plants over the period from 2019 to 2035 in each of the alternatives.
The all-in cost for fuel oil plants is higher than the all-in cost for natural gas plants under any of the natural gas alternatives. The all-in costs in Alternative 1 are $0.02 lower on average than in Alternative 2. For the two alternatives, the all-in costs of generation vary between $0.18 per kWh and $0.20 per kWh,42 while the all-in cost with fuel oil ranges between $0.21 per kWh and $0.31 per kWh.
Figure 5.10: Comparing All-In Cost of Generating with Natural Gas with the All-In Cost of Generating with Fuel Oil
To further illustrate the potential savings from switching the natural gas, Figure 5.11 below shows the potential discount on electricity generation, compared to continued use of fuel oil.
41 The minimum and maximum savings for Bermuda under both alternatives. See Figure 5.10 above.
42 The driver in the difference in cost in the natural gas alternatives are mainly the capital cost and operating cost of the re-gasification and storage units and the higher capital cost of new power plants in Alternative 2.
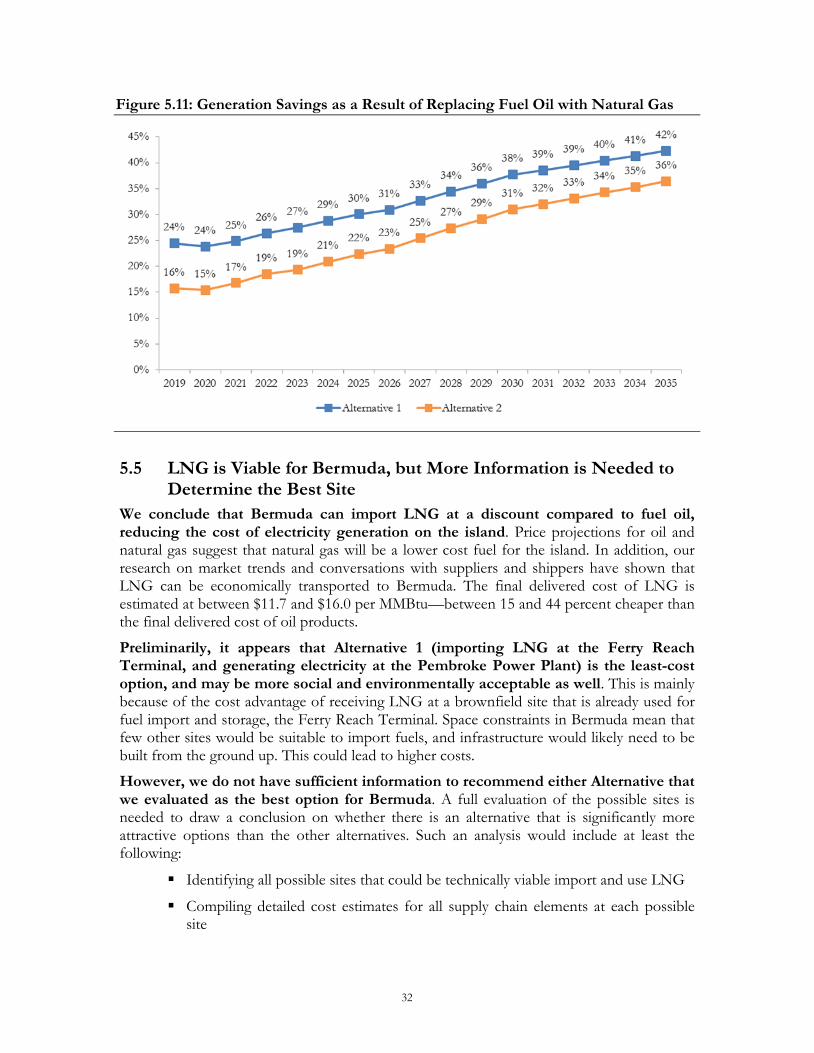
32
Figure 5.11: Generation Savings as a Result of Replacing Fuel Oil with Natural Gas
5.5 LNG is Viable for Bermuda, but More Information is Needed to Determine the Best Site
We conclude that Bermuda can import LNG at a discount compared to fuel oil, reducing the cost of electricity generation on the island. Price projections for oil and natural gas suggest that natural gas will be a lower cost fuel for the island. In addition, our research on market trends and conversations with suppliers and shippers have shown that LNG can be economically transported to Bermuda. The final delivered cost of LNG is estimated at between $11.7 and $16.0 per MMBtu—between 15 and 44 percent cheaper than the final delivered cost of oil products.
Preliminarily, it appears that Alternative 1 (importing LNG at the Ferry Reach Terminal, and generating electricity at the Pembroke Power Plant) is the least-cost option, and may be more social and environmentally acceptable as well. This is mainly because of the cost advantage of receiving LNG at a brownfield site that is already used for fuel import and storage, the Ferry Reach Terminal. Space constraints in Bermuda mean that few other sites would be suitable to import fuels, and infrastructure would likely need to be built from the ground up. This could lead to higher costs.
However, we do not have sufficient information to recommend either Alternative that we evaluated as the best option for Bermuda. A full evaluation of the possible sites is needed to draw a conclusion on whether there is an alternative that is significantly more attractive options than the other alternatives. Such an analysis would include at least the following:
Identifying all possible sites that could be technically viable import and use LNG
Compiling detailed cost estimates for all supply chain elements at each possible site
33
Assessing the environmental risk from construction and operations at each site
Evaluating social acceptability, including risk to residents from importing LNG at each possible site.
From this analysis, the Government would be able to conclude:
Which sites are both technically feasible and environmentally and socially acceptable?
Of the sites that meet the criteria in (1), what is the magnitude of the expected cost difference between them?
With the results of such a study, the Government would have the information necessary to determine the best approach to procure LNG. We discuss possible approaches, and the advantages and disadvantages to each, in Section 6.
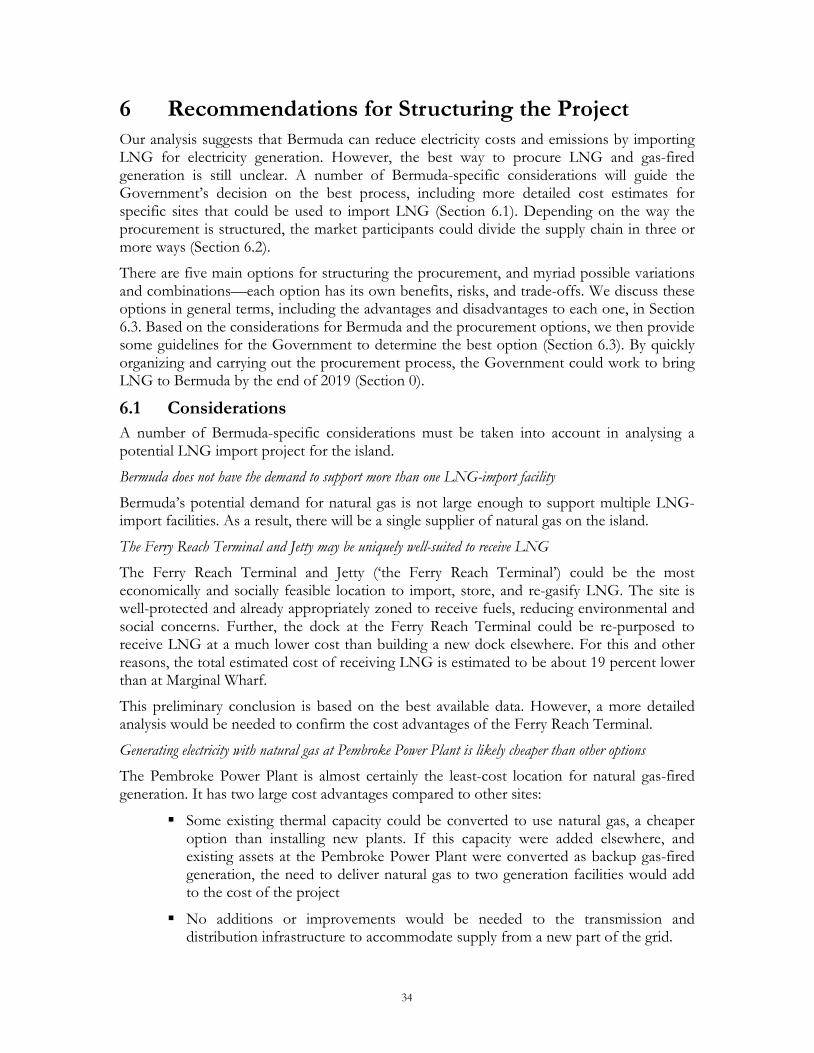
34
6 Recommendations for Structuring the Project Our analysis suggests that Bermuda can reduce electricity costs and emissions by importing LNG for electricity generation. However, the best way to procure LNG and gas-fired generation is still unclear. A number of Bermuda-specific considerations will guide the Government’s decision on the best process, including more detailed cost estimates for specific sites that could be used to import LNG (Section 6.1). Depending on the way the procurement is structured, the market participants could divide the supply chain in three or more ways (Section 6.2).
There are five main options for structuring the procurement, and myriad possible variations and combinations—each option has its own benefits, risks, and trade-offs. We discuss these options in general terms, including the advantages and disadvantages to each one, in Section 6.3. Based on the considerations for Bermuda and the procurement options, we then provide some guidelines for the Government to determine the best option (Section 6.3). By quickly organizing and carrying out the procurement process, the Government could work to bring LNG to Bermuda by the end of 2019 (Section 0).
6.1 Considerations A number of Bermuda-specific considerations must be taken into account in analysing a potential LNG import project for the island.
Bermuda does not have the demand to support more than one LNG-import facility
Bermuda’s potential demand for natural gas is not large enough to support multiple LNG-import facilities. As a result, there will be a single supplier of natural gas on the island.
The Ferry Reach Terminal and Jetty may be uniquely well-suited to receive LNG
The Ferry Reach Terminal and Jetty (‘the Ferry Reach Terminal’) could be the most economically and socially feasible location to import, store, and re-gasify LNG. The site is well-protected and already appropriately zoned to receive fuels, reducing environmental and social concerns. Further, the dock at the Ferry Reach Terminal could be re-purposed to receive LNG at a much lower cost than building a new dock elsewhere. For this and other reasons, the total estimated cost of receiving LNG is estimated to be about 19 percent lower than at Marginal Wharf.
This preliminary conclusion is based on the best available data. However, a more detailed analysis would be needed to confirm the cost advantages of the Ferry Reach Terminal.
Generating electricity with natural gas at Pembroke Power Plant is likely cheaper than other options
The Pembroke Power Plant is almost certainly the least-cost location for natural gas-fired generation. It has two large cost advantages compared to other sites:
Some existing thermal capacity could be converted to use natural gas, a cheaper option than installing new plants. If this capacity were added elsewhere, and existing assets at the Pembroke Power Plant were converted as backup gas-fired generation, the need to deliver natural gas to two generation facilities would add to the cost of the project
No additions or improvements would be needed to the transmission and distribution infrastructure to accommodate supply from a new part of the grid.
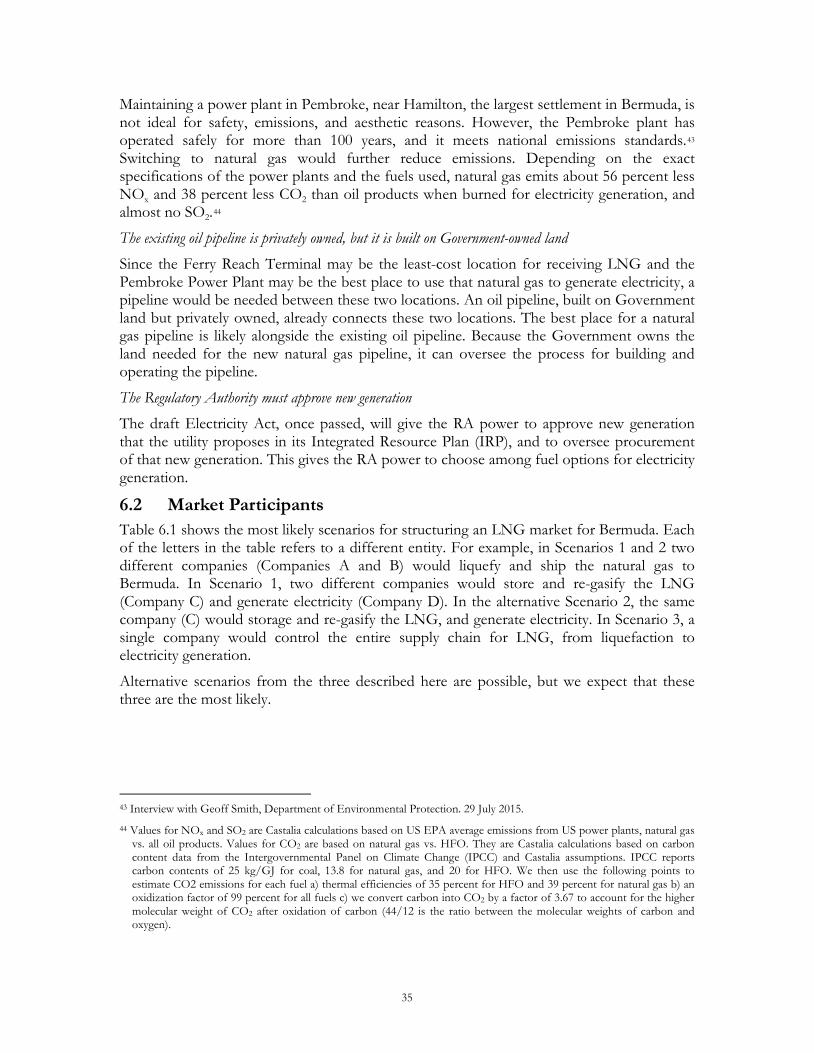
35
Maintaining a power plant in Pembroke, near Hamilton, the largest settlement in Bermuda, is not ideal for safety, emissions, and aesthetic reasons. However, the Pembroke plant has operated safely for more than 100 years, and it meets national emissions standards.43 Switching to natural gas would further reduce emissions. Depending on the exact specifications of the power plants and the fuels used, natural gas emits about 56 percent less NOx and 38 percent less CO2 than oil products when burned for electricity generation, and almost no SO2.44
The existing oil pipeline is privately owned, but it is built on Government-owned land
Since the Ferry Reach Terminal may be the least-cost location for receiving LNG and the Pembroke Power Plant may be the best place to use that natural gas to generate electricity, a pipeline would be needed between these two locations. An oil pipeline, built on Government land but privately owned, already connects these two locations. The best place for a natural gas pipeline is likely alongside the existing oil pipeline. Because the Government owns the land needed for the new natural gas pipeline, it can oversee the process for building and operating the pipeline.
The Regulatory Authority must approve new generation
The draft Electricity Act, once passed, will give the RA power to approve new generation that the utility proposes in its Integrated Resource Plan (IRP), and to oversee procurement of that new generation. This gives the RA power to choose among fuel options for electricity generation.
6.2 Market Participants Table 6.1 shows the most likely scenarios for structuring an LNG market for Bermuda. Each of the letters in the table refers to a different entity. For example, in Scenarios 1 and 2 two different companies (Companies A and B) would liquefy and ship the natural gas to Bermuda. In Scenario 1, two different companies would store and re-gasify the LNG (Company C) and generate electricity (Company D). In the alternative Scenario 2, the same company (C) would storage and re-gasify the LNG, and generate electricity. In Scenario 3, a single company would control the entire supply chain for LNG, from liquefaction to electricity generation.
Alternative scenarios from the three described here are possible, but we expect that these three are the most likely.
43 Interview with Geoff Smith, Department of Environmental Protection. 29 July 2015. 44 Values for NOx and SO2 are Castalia calculations based on US EPA average emissions from US power plants, natural gas
vs. all oil products. Values for CO2 are based on natural gas vs. HFO. They are Castalia calculations based on carbon content data from the Intergovernmental Panel on Climate Change (IPCC) and Castalia assumptions. IPCC reports carbon contents of 25 kg/GJ for coal, 13.8 for natural gas, and 20 for HFO. We then use the following points to estimate CO2 emissions for each fuel a) thermal efficiencies of 35 percent for HFO and 39 percent for natural gas b) an oxidization factor of 99 percent for all fuels c) we convert carbon into CO2 by a factor of 3.67 to account for the higher molecular weight of CO2 after oxidation of carbon (44/12 is the ratio between the molecular weights of carbon and oxygen).
36
Table 6.1: Market Structure Scenarios
Liquefaction Shipping Storage and Re-gasification Generation
Scenario 1 A B C D
Scenario 2 A B B B
Scenario 3 A A A A
Each of the letters in the table refers to a different entity. C(s) denotes that multiple entities would carry out that activity. For example, each offtaker would be responsible for generation.
6.3 Options for Procuring LNG and Gas-fired Generation There are five main options for procuring LNG and gas-fired generation, each with advantages and disadvantages. The five options are:
Single supplier organises and manages the LNG supply chain (Section 6.3.1)
Single tender for gas-fired generation (Section 6.3.2)
Multi-stage tender for steps in the LNG supply chain (Section 6.3.3)
Requiring access to the Ferry Reach Terminal, using the essential facilities doctrine or compulsory purchase (Section 6.3.4)
Swiss challenge (Section 6.3.5).
Table 6.2 compares the options, showing that in most cases there is a trade-off between the level of competition and the simplicity and speed of the procurement process.
Table 6.2: Comparison of Options for Procuring LNG and Gas-fired Generation
Level of competition
Simplicity Speed
Single supplier 0 4 3
Tender for gas-fired generation 3 4 3
Tender some steps in the LNG supply chain
3 3 2
Require access to Ferry Reach Terminal 4 1 1
Swiss challenge 2 2 1
To achieve the best result, elements of some options can be combined. In Section 6.3, we recommend ways to apply and combine these options, depending on the results of more detailed studies on site options for delivering LNG, and the Government’s policy priorities.
6.3.1 Single supplier builds and manages supply chain, tendering some steps A single company manages the entire supply chain to bring LNG to Bermuda and use it to generate electricity. The company could tender some steps in the supply chain, but would
37
run the tenders and select the winning bidders. Alternatives 1 and 2 present variations on this option:
In Alternative 1, the electricity generator would contract with another party for natural gas supply. That party would arrange shipping and the purchase of the LNG from a liquefaction facility or LNG trader. Alternatively, the electricity generator could contract for natural gas with the shipper, and pay a fee for the use of the Ferry Reach Terminal. In either case, electricity would be generated with natural gas at the Pembroke Power Plant, and the cost of the natural gas would be passed on to consumers through the electricity tariff
In Alternative 2, the developer would contract for natural gas supply to Marginal Wharf. At Marginal Wharf, the developer would build, own, and operate LNG storage and re-gasification facilities, as well as natural gas-fired electricity generation assets. The developer would sell the electricity to BELCO under a PPA. BELCO would recover the cost of purchasing the electricity through the electricity tariff.
In its final form, either proposal would consist of a single per kWh price for electricity generation.
Advantages
The three key advantages of this option are that the chosen supplier would likely deliver electricity at a discount, compared to the continued use of oil products; that it is a simple process; and that it could be completed quickly.
It is probable that a developer in Alternative 1 or 2 could put together an LNG supply chain that would be cheaper than continued use of oil products. As such, the chosen supplier would be able to offer electricity consumers a discount on oil-fired generation
The process would be simple and easier to administer. The Government would only need to decide if the supplier is offering a sufficiently attractive discount on oil-fired generation to switch to gas, then approve the agreement or not
The supplier would be highly motivated to put together the LNG supply chain quickly. The certainty of an arrangement with the Government would help the supplier attract necessary partners to complete the supply chain.
Disadvantages
Because a single party would manage the entire process for securing gas-fired electricity generation, that party would be able to extract most of the value of switching to natural gas, rather than sharing it equally among the supplier, customers, and the Government. That is, the single supplier would be able to offer only a slight discount on oil-fired generation to motivate the Government and customers to switch—the supplier would keep remaining (potentially large) difference between oil-fired and gas-fired generation.
6.3.2 Hold a tender for gas-fired generation A single tender is held in which firms (or groups of firms bidding together) offer a per kWh price of gas-fired electricity generation, delivered to the grid. The Government would evaluate the bids. If any bids are lower than the expected price of generation from oil
38
products, the Government would accept the proposal from the qualifying bidder that offers the lowest price.
Advantages
A single tender for gas-fired generation has many of the same advantages of a single supplier—it is a relatively simple and quick process that could result in a lower-cost option than oil-fired generation. Because bidders would need to compete against each other, the tender could also result in a lower final price than in the single supplier option (in which the chosen supplier would only need to offer a lower price than oil-fired generation).
Disadvantages
A single tender may not result in the lowest-possible cost for gas-fired electricity. First, it is possible that only one group would submit a bid, given the space constraints in Bermuda. Second, even if there were multiple bids, owners of the Ferry Reach Terminal and Pembroke Power Plant may have a significant advantage over other bidders. This is because these may be uniquely favourable assets for receiving and using LNG. Because of these advantages, the owners could submit a higher bid than their lowest possible price (that is, the price that would allow them to recover their costs and earn their target return). Instead, the owners could offer a price that is slightly lower than their competitors’ costs, thereby capturing much of the value of switching to natural gas.
6.3.3 Tender only steps in the LNG supply chain that are competitive Separate tender processes are held for the competitive elements of the supply. This is an option if the Government determines that the Ferry Reach Terminal and Pembroke Power Plant are the only viable options to receive and use LNG. In this case, the Government would negotiate a fee for use of the Ferry Reach Terminal, or require access to the Ferry Reach Terminal using the essential facilities doctrine or by buying the property using compulsory purchase (see Section 6.3.4 below). All bidders would be allowed to include Ferry Reach Terminal as part of their technical proposals, and could pass along fees paid to the owners for use of the Terminal as part of the delivered cost of natural gas. This tender could include two or three parts.
In a three-part tender, the following elements would be bid:
1. Delivering LNG by ship to Bermuda. The tender would detail the technical specifications needed to deliver the LNG to the Ferry Reach Terminal. Any bidder could compete to procure LNG, and deliver it by ship
2. Building and operating storage and regasification at the Ferry Reach Terminal, and a natural gas pipeline to the Pembroke Power Plant. The Government would need to negotiate a fee for use of the Ferry Reach Terminal, or use legal means to require access to the Ferry Reach Terminal. Any bidder (including the Terminal’s owners) could then compete to build and operate storage and re-gasification infrastructure at the Ferry Reach Terminal, and a natural gas pipeline to the Pembroke Power Plant
3. Converting and building thermal generation at the Pembroke Power Plant. BELCO would likely own and operate new and converted gas-fired capacity at the Pembroke Power Plant. This element of the supply chain would not be competitive, since it would not be feasible for another operator to take over
39
existing BELCO assets, or to build new assets at the Pembroke Plant. However, the Government could keep costs low for the new plants and the conversions of the existing plants by requiring BELCO to publicly tender the installation and conversion work. BELCO would be allowed to pass only the costs of the new investments allowed to customers, through the electricity tariff.
A variation on this option is a two-part tender:
4. LNG supply, storage, re-gasification, and transportation to the Pembroke Power Plant would all be bid out together. This part could be done in two ways:
– All bidders have access to the Ferry Reach Terminal, under a negotiated fee or after the Government requires access, as described above
– Bidders compete based on the facilities that they can access. As with the single-phase tender, this would likely give the owners of the Ferry Reach Terminal an advantage
In either case, bidders would offer a final delivered price of natural gas to the Pembroke Power Plant
5. BELCO would tender the contract for installing and converting gas-fired generation assets at the Pembroke Power Plant. This would work in the same way as described above.
Advantages
LNG could be brought to Bermuda, and used for electricity generation, at what may be the best possible sites. Choosing the best sites for regasification and for electricity generation, but tendering the elements of the supply chain that are competitive, would keep costs down. Environmental and social impacts would be minimized by using the best sites.
This is a good option if the Government determines that importing LNG to the Ferry Reach Terminal and generating electricity at the Pembroke Power Plant are in the country’s best interest—that is, each is a uniquely favourable asset. Such a determination would be based on two factors:
The Government believes that environmental or social impacts at other sites would be unacceptable
The Government believes that costs at other sites are too high for a competitive tender for LNG, making the Ferry Reach Terminal and the Pembroke Power Plant uniquely favourable assets.
Disadvantages
The process would be complex, and would need to be well managed to be successful. The three tenders would need to be well sequenced to allow bidders the necessary information to ensure that all parts of the supply chain are technically compatible (for example, the LNG carrier must be able to fit at the Ferry Reach Terminal, but these assets would be added through separate tenders).
Even a well-managed process would carry risks:
It could move slowly. If the Government cannot agree to terms for use of the Ferry Reach Terminal, the process would be delayed
40
Taking legal measures (or threatening to take legal measures) to require access to the Ferry Reach Terminal could damage investors’ confidence, particularly in the energy sector
If the Ferry Reach Terminal and Pembroke Power Plant are not clearly the least-cost sites, this option could result in higher costs than a single tender for the entire supply chain. By designating these two facilities as necessary parts of the tender, the Government would block potentially lower-cost alternatives. For this reason, more detailed studies are needed before choosing this option.
6.3.4 Require access to the Ferry Reach Terminal: Compulsory purchase or the essential facilities doctrine
To increase competition, the Government may wish to require access to the Ferry Reach Terminal at a reasonable rate. In this case, a reasonable rate is one that offers a return that is commensurate with the cost of capital for investments in the Bermudian energy sector. To achieve this, the Government may need influential power.
The two ways that the Government could exercise influential power are through compulsory purchase and the essential facilities doctrine. Compulsory purchase is the Government’s power to require private owners to sell land at a fair price that is needed for public use. This principle is generally well-known, so we will not explore it more here.
The essential facilities doctrine is an alternative legal principle that the Government could use to require access to the Ferry Reach Terminal, without purchasing the site. Under this doctrine, essential facilities are unique economic assets controlled by a private entity. The essential facility cannot be easily duplicated by competitors, and the controlling entity refuses access to competitors on reasonable terms—instead insisting on monopolist rates.
To exercise the essential facilities doctrine, two separate determinations are needed. First, it must be established that the asset is an essential facility, and that denying competitive access to the facility is not in the public interest. Second, if the facility is considered essential, reasonable terms must be set for competitors to access that facility.
In most countries, the essential facilities doctrine is a legal precedent under antitrust laws. In some jurisdictions, such as the United States and the European Union, courts have the power to designate facilities as essential, and to set the rates of reasonable access. In other jurisdictions, such as Australia, a permanent competition regulator determines whether facilities are essential and sets rates of reasonable access.
While attempting to require access is an option, we do not recommend that the Government use it in this case, even if the Government believes that the Ferry Reach Terminal would qualify as an essential facility. Using either the essential facilities doctrine or compulsory purchase could take years and disrupt the supply of fuel oil currently imported to the Ferry Reach Terminal. Further, the uncertainty created by this either process could discourage investment in the Bermudian energy sector, at a time when it is needed to ensure reliability. Compulsory purchase would also be expensive for the Government.
In addition, our initial research suggests that Bermuda does not have a competition law that explicitly creates the essential facilities doctrine. Therefore, to use the essential facilities doctrine, the Government would need to either pass a law explicitly creating this doctrine in Bermuda, or make a legal case based on common law precedent. Even if either path was
41
successful, it could take years, delaying the process of bringing LNG to Bermuda. As such, using the essential facilities doctrine appears impractical.
6.3.5 The Swiss challenge The Swiss challenge is a process for governments to ensure a level of competition for projects proposed by the private sector. In a Swiss challenge, the government first approves the proposed project. Then, an open bidding process is conducted, in which the project proponent may participate. If unsuccessful, the project proponent has the option to match the winning bid and win the contract. This process is typically used for unsolicited proposals, but can also be used to encourage competition when one bidder controls a uniquely favourable asset.
Where one potential bidder has the advantage of a unique asset, such as may be case with the Ferry Reach Terminal, an additional step is needed. Before bidding, the Government would negotiate a fair value for the unique asset with the asset’s owners. In the subsequent bidding process, competitors bid on the competitive elements of the project (such as construction of new facilities, or improvements to existing facilities). All bidders would include the Ferry Reach Terminal in their bids, and the negotiated price of accessing that asset. The winning bidder then pays the agreed fee to the Terminal’s owners. If the Terminal’s owners win, they are allowed to keep the fee.
After the first round of bidding, the party that controls the uniquely favourable assets is allowed to match the winning bid.
Advantages
A Swiss challenge structure may encourage the Ferry Reach Terminal’s owners to offer a fair price for the use of the Terminal, for two reasons. First, opening up the Terminal almost guarantees that a deal will be approved to import LNG, earning the owners a fair return on their asset. Second, the owners would have a distinct advantage in the bidding process, so would likely win the bid to build, own, and operate re-gasification and storage infrastructure.
If this Swiss challenge process eases negotiations on the fair price to access the Ferry Reach Terminal, it could speed up the process, and allow the Government to avoid the risky alternatives to require access to the site.
Disadvantages
Because potential competitors would be at a disadvantage to the Ferry Reach Terminal’s owners, they may not wish to bid at all, eliminating any element of competition. Further, despite the owners’ incentives to offer access to the Ferry Reach Terminal at a fair price, negotiations may not reach a conclusion.
6.4 Recommendations to Ensure the Best Outcome for the People and Government of Bermuda
The Government should oversee a process to procure LNG and use it for electricity generation. More information on potential sites to import LNG is needed, but once that information is available the Government can use the guidelines below to help determine the best way to procure LNG. If done quickly, LNG could begin to be shipped to Bermuda by the end of 2019.
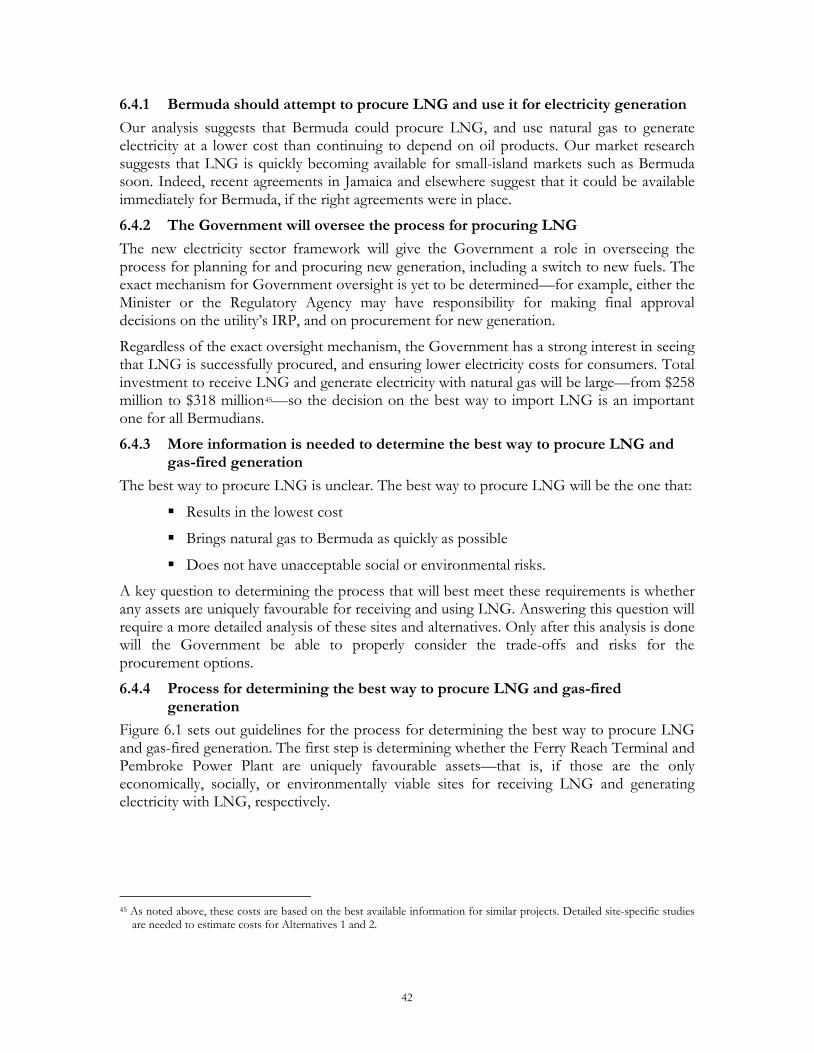
42
6.4.1 Bermuda should attempt to procure LNG and use it for electricity generation Our analysis suggests that Bermuda could procure LNG, and use natural gas to generate electricity at a lower cost than continuing to depend on oil products. Our market research suggests that LNG is quickly becoming available for small-island markets such as Bermuda soon. Indeed, recent agreements in Jamaica and elsewhere suggest that it could be available immediately for Bermuda, if the right agreements were in place.
6.4.2 The Government will oversee the process for procuring LNG The new electricity sector framework will give the Government a role in overseeing the process for planning for and procuring new generation, including a switch to new fuels. The exact mechanism for Government oversight is yet to be determined—for example, either the Minister or the Regulatory Agency may have responsibility for making final approval decisions on the utility’s IRP, and on procurement for new generation.
Regardless of the exact oversight mechanism, the Government has a strong interest in seeing that LNG is successfully procured, and ensuring lower electricity costs for consumers. Total investment to receive LNG and generate electricity with natural gas will be large—from $258 million to $318 million45—so the decision on the best way to import LNG is an important one for all Bermudians.
6.4.3 More information is needed to determine the best way to procure LNG and gas-fired generation
The best way to procure LNG is unclear. The best way to procure LNG will be the one that:
Results in the lowest cost
Brings natural gas to Bermuda as quickly as possible
Does not have unacceptable social or environmental risks.
A key question to determining the process that will best meet these requirements is whether any assets are uniquely favourable for receiving and using LNG. Answering this question will require a more detailed analysis of these sites and alternatives. Only after this analysis is done will the Government be able to properly consider the trade-offs and risks for the procurement options.
6.4.4 Process for determining the best way to procure LNG and gas-fired generation
Figure 6.1 sets out guidelines for the process for determining the best way to procure LNG and gas-fired generation. The first step is determining whether the Ferry Reach Terminal and Pembroke Power Plant are uniquely favourable assets—that is, if those are the only economically, socially, or environmentally viable sites for receiving LNG and generating electricity with LNG, respectively.
45 As noted above, these costs are based on the best available information for similar projects. Detailed site-specific studies
are needed to estimate costs for Alternatives 1 and 2.
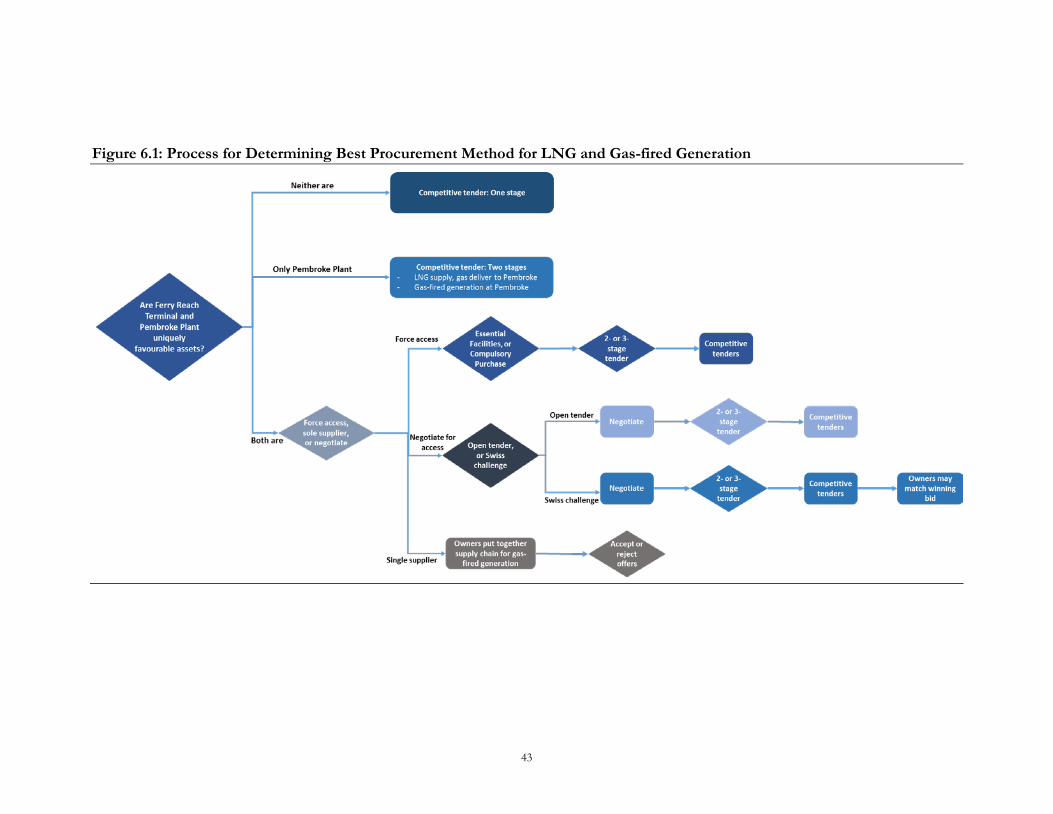
43
Figure 6.1: Process for Determining Best Procurement Method for LNG and Gas-fired Generation
44
Below, we provide guidance on the best procurement method, given three scenarios for the Government’s determination on uniquely favourable assets:
No uniquely favourable assets
Pembroke Power Plant is uniquely favourable, but the Ferry Reach Terminal is not
The Ferry Reach Terminal and Pembroke Power Plant are both uniquely favourable assets.
We did not consider a case in which the Ferry Reach Terminal is a uniquely favourable asset, but the Pembroke Power Plant is not, because we believe that this is extremely unlikely. This is because the Ferry Reach Terminal, while potentially well-suited for receiving LNG, is almost certainly not a viable location for generating electricity. As such, electricity would need to be generated off-site, and the Pembroke Power Plant would be the best place to do so. There is a clear path for a natural gas pipeline to the Plant (alongside the existing oil pipeline). In addition, using the Pembroke site would eliminate the need for any grid upgrades, and would allow for existing thermal assets to be converted to use natural gas, lowering the cost of gas-fired generation.
No uniquely favourable assets If neither the Ferry Reach Terminal nor the Pembroke Power Plant is uniquely favourable, then a competitive tender process can be run. We believe that the best way to run this tender would be in one stage. That is, each bidder would put together the entire supply chain and offer a final price for electricity. The winning bidder would be the one that offered the lowest price per kWh, and that met minimum financial and credibility requirements.
Alternatively, the tender could be in two or more stages—for example, one stage for LNG supply and natural gas delivery, and another stage for gas-fired electricity generation. However, this would add complexity, and may not lead to a lower final price. This is because all elements of the LNG supply chain must fit together seamlessly: the vessel must be able to dock at the jetty, and gas must be transported from the storage and re-gasification site to the generation plant. As a result, a multi-stage tender with different bidders would require restrictive technical and location requirements on each stage, to ensure that the stages could be put together in a single supply chain. These requirements would eliminate much of the supplier flexibility that can reduce cost in a competitive process.
A single-stage competitive bid would not need to be limited to gas-fired generation. Instead, the bid could be opened to any firm power delivered to the grid, with appropriate guarantees on prices and reliability. While we believe that LNG is the least-cost baseload fuel for Bermuda, allowing other fuels (or firm renewables) to compete would have two advantages. First, fuel markets can change rapidly, and it is possible, though unlikely, that alternative generation options (including LPG or ethane) could be offered at a lower price. Second, allowing all generation options to compete would clearly demonstrate the Government’s dual commitment to transparency and to the best energy solution for the country. LNG procured through an open competitive tender in competition with all other options may be politically more acceptable, compared to a Government decision to procure LNG specifically.
45
Pembroke Power Plant is uniquely favourable, but the Ferry Reach Terminal is not The Government may determine that the Pembroke Power Plant is the only acceptable location for gas-fired electricity generation, but that there are multiple viable sites for receiving LNG. In this case, the best option would be to run a procurement process in two stages:
1. Open tender for LNG supply, storage, re-gasification, and delivery to the Pembroke Plant. The location (Pembroke Power Plant) and technical requirements for delivering natural gas would be clear, making it easy for suppliers to compete
2. BELCO runs a tender for gas-fired generation at the Pembroke Plant. This would include converting existing capacity and installing some new capacity. The Government would oversee the tender.
Since all elements of the supply chain could be competed, this two-stage process would offer the best combination of speed, simplicity, and supplier competition.
Running a procurement process in more than two stages would be impractical. As in a multi-stage tender above, such a process would involve competing more elements of the LNG supply chain separately, then attempting to merge winning bids. For this to be possible, very specific technical and location requirements would be needed at each stage to allow multiple stages to fit together.
Ferry Reach Terminal and Pembroke Power Plant are both uniquely favourable assets If these two sites are uniquely favourable, then the Government must decide if it would like to:
Attempt to require access to the Ferry Reach Terminal, then run a competitive tender for LNG
Negotiate for use of the Ferry Reach Terminal, then run a competitive tender
Negotiate for use of the Ferry Reach Terminal, then run a Swiss challenge
Allow the owners of the Ferry Reach Terminal to serve as the single supplier, and give them the exclusive right to put together the supply chain for delivering natural gas to the Pembroke Power Plant.
We discuss each option below.
Attempt to require access to the Ferry Reach Terminal, then run a competitive tender for LNG
There are two options to require access to the Ferry Reach Terminal: designating it as an essential facility, or buying it under the doctrine of compulsory purchase. While either option would allow for a competitive tender to LNG, both options carry large risks. As described in Section 6.3.4, there is no clear legal precedent for the essential facilities doctrine in Bermuda. As such, attempting to use this doctrine by legislating it, or by making a legal case based on shared common law could take years, and carries large political risk. Attempting to exercise compulsory purchase could also take years, could upset the supply of fuel oil through the Ferry Reach Terminal, and would be politically risky. For these reasons, do not recommend either option for requiring access to the Ferry Reach Terminal.
Negotiate for use of the Ferry Reach Terminal, then run a competitive tender
46
The Government would first need to negotiate for use of the Ferry Reach Terminal. As a basis for negotiations, the Government should obtain an independent valuation of the fair value for using the Ferry Reach Terminal, as part of the due diligence process for deciding the best procurement method. However, the Government would have relatively little leverage to require the Terminal’s owners to accept this fair price. To encourage the owners to agree on a price, the Government could:
Threaten to require access to the site through use of the essential facilities doctrine or compulsory purchase. However, threatening either carries political risk, and could also discourage investment in the energy sector
Delay approval of the project until the owners agree to a fair price. Under the fair price, the owners would receive a return on its asset, regardless of who wins the bid. As such, delaying the project may motivate the owners to reduce demands, in an effort to move the project forward and begin earning a return as soon as possible
Agree to pay some premium over the fair price, accepting this premium as the cost of avoiding delays and other risks.
After agreeing on a fee for use of the Ferry Reach Terminal, the Government could move forward either a two-stage or a three-stage tender. In a two-stage tender, there would be separate competitions for:
LNG supply to Ferry Reach Terminal, storage and re-gasification at the Ferry Reach Terminal, and natural gas supply to the Pembroke Power Plant
Installing and converting gas-fired generation at the Pembroke Power Plant. As the owner of the plant and licensed utility under the new electricity sector regulations, BELCO would run this tender, with Government oversight.
In a three-stage tender, there would be separate competitions for:
LNG supply to Ferry Reach Terminal
Storage and re-gasification at the Ferry Reach Terminal, and natural gas supply to the Pembroke Power Plant
Installing and converting gas-fired generation at the Pembroke Power Plant. As the owner of the plant and licensed utility under the new electricity sector regulations, BELCO would run this tender, with Government oversight.
For each stage, the lowest cost option that meets the minimum requirements would be selected. Section 6.3.3 describes the advantages and disadvantages of a competitive bid in more detail.
Negotiate for use of the Ferry Reach Terminal, then run a Swiss challenge
This process would be similar to the competitive tender described above, except that the Ferry Reach Terminal’s owners would be able to match the winning bid for the tender stage that includes the Ferry Reach Terminal. As such, the owners may be more motivated to negotiate a fair price for access to the Terminal, since it would be quite likely to win that stage of the bidding. Section 6.3.5 describes the advantages and disadvantages of a Swiss challenge in more detail.
47
Allow the Ferry Reach Terminal’s owners to serve as the single LNG supplier, and give them the exclusive right to put together the supply chain for delivering natural gas to the Pembroke Power Plant
The Ferry Reach Terminal’s owners would be given permission to put together a supply chain to deliver natural gas to the Pembroke Power Plant, and BELCO would invest in gas-fired generation at the Pembroke Power Plant. BELCO would offer a price for gas-fired electricity generation, which the Government could accept or reject. By rejecting the offer, the Government would likely commit to continued use of fuel oil for electricity generation.
The main advantages of this option are speed and simplicity. However, we do not recommend this option because of the likelihood that the suppliers would capture much of the value of switching to natural gas, rather than passing along discounts to customers (as discussed in Section 6.3.1). Further, this option could expose the Government to political risk, since it could appear that the Government is favouring the suppliers at the expense of potential competitors.
6.5 Timeline for Introducing Natural Gas By quickly deciding on the best approach for procuring LNG, the Government can set Bermuda on the path to begin importing LNG by the end of 2019 (Table 6.3). Deciding on an approach and awarding contracts to providers will take until early 2017 (Steps 1-6). From that point, it will take about 30 months to build an LNG carrier and other infrastructure necessary to receive LNG, and to complete the rest of the needed infrastructure (Step 7).
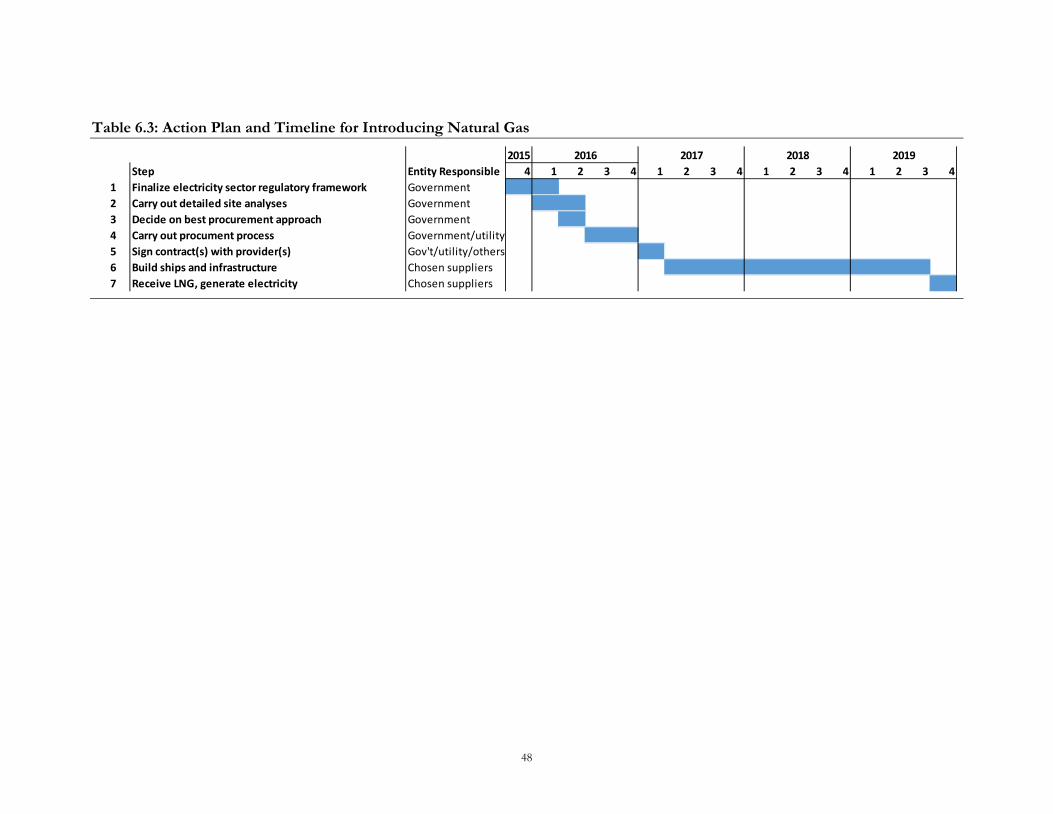
48
Table 6.3: Action Plan and Timeline for Introducing Natural Gas
2015Step Entity Responsible 4 1 2 3 4 1 2 3 4 1 2 3 4 1 2 3 4
1 Finalize electricity sector regulatory framework Government2 Carry out detailed site analyses Government3 Decide on best procurement approach Government4 Carry out procument process Government/utility5 Sign contract(s) with provider(s) Gov't/utility/others6 Build ships and infrastructure Chosen suppliers7 Receive LNG, generate electricity Chosen suppliers
2016 2017 2018 2019

49
T: +1 (202) 466-6790 F: +1 (202) 466-6797 1747 Pennsylvania Avenue NW Suite 1200 WASHINGTON DC 20006 United States of America T: +1 (646) 632-3770 F: +1 (212) 682-0278 200 Park Ave Suite 1744 NEW YORK, NY 10166 United States of America T: +61 (2) 9231 6862 Level 1, 27-31 Macquarie Place SYDNEY NSW 2000 Australia T: +64 (4) 913 2800 F: +64 (4) 913 2808 Level 2, 88 The Terrace PO Box 10-225 WELLINGTON 6143 New Zealand T: +57 (1) 646 6626 F: +57 (1) 646 6850 Calle 100 No. 7-33 Torre 1, Piso 14 BOGOTÁ Colombia T: +33 (1) 73 44 26 97 F: +33 (1) 73 44 26 01 6, Rue Duret PARIS 75116 France ------------- www.castalia-advisors.com