Embed Size (px)
Citation preview

NC Division of Air Quality
Estimate of Air Emissions from
Shale Gas Activities
in North Carolina
An estimate of potential emissions fromthe development, production, processing and
transmission of natural gas from shale gas recoveryin North Carolina
September 2015
Table of Contents
1 Executive Summary.............................................................................................................................6
2 Introduction.......................................................................................................................................11
2.1 Shale Gas Extraction..................................................................................................................11
2.1.1 Development.....................................................................................................................13
2.1.2 Production, Processing and Transmission..........................................................................14
2.2 Pollutants of Concern................................................................................................................15
2.2.1 Regulated Air Pollutants....................................................................................................15
2.2.2 Other Unregulated Air Pollutants......................................................................................17
3 Key Assumptions...............................................................................................................................19
3.1 North Carolina Shale Gas Formation Data and Assumptions.....................................................19
3.1.1 Location of Shale Gas.........................................................................................................19
3.1.2 Number of Wells................................................................................................................19
3.1.3 Potential Gas Recovery for a Single Well and Total Sub-Basin...........................................20
3.1.4 Annual Volume of Gas Produced and Development Timeframe........................................20
3.1.5 Chemical Composition of NC Shale Gas.............................................................................21
3.2 Regulations........................................................................................................................23
4 Overall Emissions Estimation Methodology......................................................................................25
4.1 Emissions Calculations...............................................................................................................26
4.2 Uncertainties.............................................................................................................................27
5 Summary of Estimated Air Emissions................................................................................................28
6 References.........................................................................................................................................32
List of Appendices
Appendix A Development Phase
Appendix B Production Phase
Appendix C Processing Phase
Appendix D Gathering, Transmission and Distribution Phases
21 Market centers provide interconnections to other pipelines and provide short-term receipt/delivery balancing needs as well as other services that assist with gas transportation. They also provide some buyer/seller matching services and limited gas trading. (Natural Gas Market Centers: A 2008 Update, EIA, 2009)

List of Tables
Table E-1.Summary of Criteria Air Pollutant Emissions for Development, Production, Processing, and Gathering/Transmission Activities
Table E-2. Summary of Key Hazardous Air Pollutant Emissions for Development, Production,Processing, and Gathering/Transmission Activities
Table 1. Classifications of Regulated Pollutants
Table 2. Sanford Sub-Basin Shale Annual Gas Production Estimate
Table 3. Chemical Composition of Sanford Sub-Basin Shale Gas Samples
Table 3a. Nation-Wide Average Gas Composition, in Volume Percent
Table 4. Summary of Criteria Air Pollutant Emissions for Development, Production, Processing, and Gathering/Transmission Activities
31 Market centers provide interconnections to other pipelines and provide short-term receipt/delivery balancing needs as well as other services that assist with gas transportation. They also provide some buyer/seller matching services and limited gas trading. (Natural Gas Market Centers: A 2008 Update, EIA, 2009)
List of AcronymsAcronym DefinitionAAL Acceptable Ambient LevelBACT Best Available Control Technologybbl BarrelBTEX Benzene, toluene, ethylbenzene, xyleneBtu British thermal unitsCAA Clean Air ActCAP Criteria Air PollutantCenSARA Central States Air Resource Agenciescf Cubic feetCFR Code of Federal RegulationsCH4 MethaneCO Carbon monoxideCO2 Carbon dioxideCT Combustion turbineDAQ North Carolina Division of Air QualityDENR North Carolina Department of Natural Resourcesft FeetFR Federal RegisterGHG Greenhouse Gasgal/MMcf Gallons per million cubic feetgal/yr Gallons per yearg/hr Gram per hourg/hp-hr Gram per horsepower-hourg/mol Gram per molecular weightGVW Gross vehicle weightGVWR Gross vehicle weight ratingH2S Hydrogen sulfideHAP Hazardous Air Pollutanthp Horsepowerhp-hr Horsepower hourI/M Inspection and maintenanceLDAR Leak detection and repairlb Poundlb/bbl Pounds per barrellb/day Pounds per daylb/MMBtu Pounds per million British thermal unitsMACT Maximum Achievable Control TechnologyMcf 1000 cubic feet
41 Market centers provide interconnections to other pipelines and provide short-term receipt/delivery balancing needs as well as other services that assist with gas transportation. They also provide some buyer/seller matching services and limited gas trading. (Natural Gas Market Centers: A 2008 Update, EIA, 2009)

MMbtu Million British thermal unitsMMcfg Million cubic feet of gasMMscf Million standard cubic feetMOBILE6 Vehicle Emission Modeling Software Version 6MOVES Motor Vehicles Emission SimulatorMRI Midwest Research InstituteNAAQS National Ambient Air Quality StandardNCGS North Carolina Geological SocietyNESHAP National Emission Standards for Hazardous Air PollutantsNGL Natural gas liquidNOx Nitrogen oxidesNSPS New Source Performance StandardsOSHA Occupational Safety and Health AdministrationNSR New Source ReviewPM Particulate matterPM2.5 Particulate matter with a diameter less than 2.5 micronsPM10 Particulate matter with a diameter less than 10 micronsppm Parts per millionREC Reduced emissions completion (Green completion)RICE Reciprocating internal combustion enginesscf Standard cubic feetscf/hr Standard cubic feet per hourSCR Selective catalytic reductionSIP State Implementation PlanSL Session LawSO2 Sulfur dioxideTOC Total organic carbontpy Ton per yearUS DOE U.S. Department of EnergyUS DOI U.S. Department of the InteriorUS EPA U.S. Environmental Protection AgencyUSGS U. S. Geological SurveyVMT Vehicle miles traveledVOC Volatile organic compounds
51 Market centers provide interconnections to other pipelines and provide short-term receipt/delivery balancing needs as well as other services that assist with gas transportation. They also provide some buyer/seller matching services and limited gas trading. (Natural Gas Market Centers: A 2008 Update, EIA, 2009)

1 Executive Summary
North Carolina has a shale formation in the Sanford Sub-basin (Lee, Chatham and Moore counties) which is reported to contain natural gas that is recoverable for commercial purposes. In 2011, The North Carolina General Assembly directed the Department of Environment and Natural Resources (DENR) to study oil and gas exploration in the State and the use of newer horizontal drilling and hydraulic fracturing techniques (Session Law (S.L.) 2011-276). The results of the DENR study were published in a 2012 report.1 In 2012, the General Assembly enacted legislation (S.L. 2012-143) which established a regulatory program for the management of oil and gas exploration and development activities, parts of which were amended in S.L. 2015-1. The legislation also required DENR to assess the (1) emissions from oil and gas exploration and development activities, including impact of truck traffic, (2) adequacy of the State’s air toxics program, and (3) potential impact of the emissions on ozone levels. In 2014 the General Assembly passed additional legislation authorizing the issuance of permits for oil and gas exploration, development, and production activities (S. L. 2014-4). This report documents DENR’s evaluation of air pollutant emission levels from shale gas activities as mandated in S.L. 2012-143 and 2015-1.
The first step to assessing the impact to air quality is to develop an emissions inventory from various activities associated with shale gas extraction. This involves identifying the potential sources of air emissions from each operational phase. Air emissions from each source can be estimated using various published emissions factors along with the expected amount of use or activity of each source. The emissions factors and activity data used to estimate emissions in this report are based on data obtained from shale gas development and production facilities located outside of North Carolina
Since drilling for natural gas has not begun, there is still much uncertainty as to where and how the development may occur, how much gas may be extracted, and the requirements to bring the gas to an end user. As the shale gas industry moves closer to actual drilling of wells and more information is obtained on the expected activities, the air emissions estimates presented here will be revisited to reflect actual conditions
The results presented here are the product of an exhaustive review of available reference materials to develop the best emissions estimate for North Carolina. In addition, this report has been peer reviewed by the following air quality personnel that have direct experience in this subject matter:
Mark GibbsAir Quality Division,Oklahoma Dept. of Environmental Quality
Ona Papageorgiou, P.E.Bureau of Air Quality Planning, Division of Air Resources,New York State Dept. of Environmental Conservation
Allen Robinson, Ph.D. Dept. Head,Mechanical Engineering Carnegie Mellon University
61 Market centers provide interconnections to other pipelines and provide short-term receipt/delivery balancing needs as well as other services that assist with gas transportation. They also provide some buyer/seller matching services and limited gas trading. (Natural Gas Market Centers: A 2008 Update, EIA, 2009)

The data and assumptions associated with the shale gas formation that were used to estimate air emissions are listed below. This information primarily comes from the “North Carolina Oil and Gas Study”1 conducted under Session Law 2011-276. Additional information was provided by Dr. Ken Taylor, Geological Survey Section Manager of the DENR Energy Mineral and Land Resources Division.
Key Assumptions:1. Well Drilling and Gas Recovery
a. Gas recovery occurs in the Sanford Sub basin (59,000 acres)‐b. Cumulative gas produced by the field is 773 billion cubic feet (Bcf)c. Well spacing of 160 acres, total of 368 wells drilledd. Four wells drilled per pad, total of 92 padse. Year of maximum activity is Year 6 per DENR’s Dr. Ken Taylor
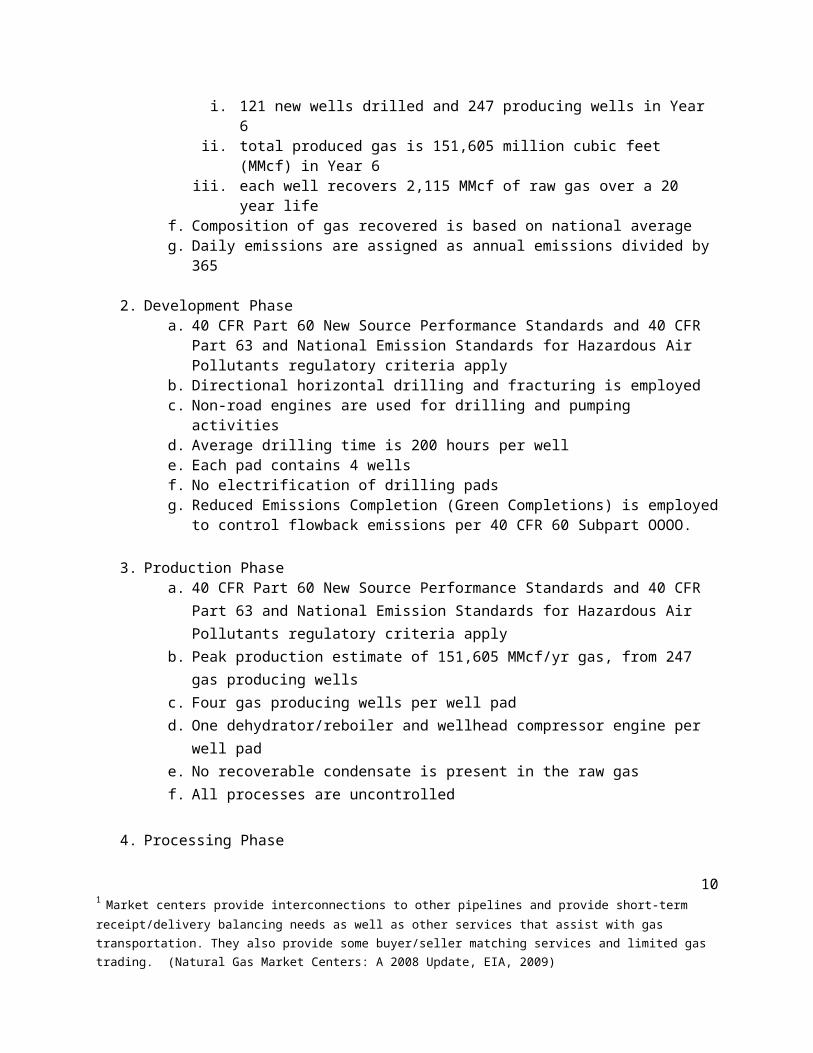
i. 121 new wells drilled and 247 producing wells in Year 6ii. total produced gas is 151,605 million cubic feet (MMcf) in Year 6
iii. each well recovers 2,115 MMcf of raw gas over a 20 year lifef. Composition of gas recovered is based on national average g. Daily emissions are assigned as annual emissions divided by 365
2. Development Phasea. 40 CFR Part 60 New Source Performance Standards and 40 CFR Part 63 and National
Emission Standards for Hazardous Air Pollutants regulatory criteria applyb. Directional horizontal drilling and fracturing is employed c. Non-road engines are used for drilling and pumping activities d. Average drilling time is 200 hours per welle. Each pad contains 4 wellsf. No electrification of drilling pads g. Reduced Emissions Completion (Green Completions) is employed to control flowback
emissions per 40 CFR 60 Subpart OOOO.
3. Production Phasea. 40 CFR Part 60 New Source Performance Standards and 40 CFR Part 63 and National
Emission Standards for Hazardous Air Pollutants regulatory criteria applyb. Peak production estimate of 151,605 MMcf/yr gas, from 247 gas producing wells c. Four gas producing wells per well padd. One dehydrator/reboiler and wellhead compressor engine per well pade. No recoverable condensate is present in the raw gasf. All processes are uncontrolled
4. Processing Phasea. A single gas processing plant is assumed to be required in the Sanford Sub-basinb. Regulated as a stationary source requiring an air permit and subject to all applicable
state and Federal rulesc. Peak production of 151,605 MMcf/yr
71 Market centers provide interconnections to other pipelines and provide short-term receipt/delivery balancing needs as well as other services that assist with gas transportation. They also provide some buyer/seller matching services and limited gas trading. (Natural Gas Market Centers: A 2008 Update, EIA, 2009)

d. Condensate recovery is not requirede. Acid gas removal unit required for hydrogen sulfide (H2S) removal
5. Gathering / Transmission Phasea. 40 CFR Part 60 New Source Performance Standards and 40 CFR Part 63 and National
Emission Standards for Hazardous Air Pollutants regulatory criteria will be metb. Total volume of gas leaving the processing plant is piped to one locationc. One transmission compressor station, requiring an air permit, is located in the Sanford
Sub-basin
Table E-1 provides a summary of annual and daily emissions estimates for criteria air pollutants. Based on the assumptions applied, it is estimated that NOx emissions in the Lee County area would increase 3.7 tons per day (tpd). The emissions contribution from mobile sources are estimated to represent about 15 percent of the total NOx emissions. The emissions of VOC are estimated to increase by 2.9 tpd with the majority of those emissions expected to occur during the production phase.
Table E-1. Summary of Criteria Air Pollutant Emissions from Shale Gas Activities
Estimated Annual Emissions (tpy)Criteria Air Pollutants
PhaseNOX
(tpy)VOC(tpy)
CO(tpy)
SO2
(tpy)PM10z
(tpy)PM2.5
(tpy)Development - mobile source contribution 213 28 195 0.2 6 5Development - nonmobile source contribution 287 882 215 0 4 4Production 287 882 215 0 4 4Processing 146 59 34 6.7 5.2E-02 5.2E-02Gathering / Transmission 176 65 93 0.4 2 2
YR 6 Annual Emissions Increase with Shale Gas 1
,344 1
,075
658
8 20
5 2
05
Sanford Sub-basin Annual Emissions w/o Shale Gas 1
,944 1
,274 12,
720
43 6
2 3
70
Total Annual Emissions with Shale Gas 3
,288 2
,349 13,
377
51 26
8 5
75% Emissions Increase 69% 84% 5% 20% 330% 55%
Estimated Daily Emissions (tpd)Criteria Air Pollutants
PhaseNOX
(tpd)VOC(tpd)
CO(tpd)
SO2
(tpd)PM10z
(tpd)PM2.5
(tpd)
81 Market centers provide interconnections to other pipelines and provide short-term receipt/delivery balancing needs as well as other services that assist with gas transportation. They also provide some buyer/seller matching services and limited gas trading. (Natural Gas Market Centers: A 2008 Update, EIA, 2009)

Development - mobile source contribution 0.6 0.1 0.5 5.4E-04 1.5E-02 1.5E-02Development - nonmobile source contribution 1.4 0.1 0.3 2.5E-03 5.3E-01 5.3E-01Production 0.8 2.4 0.6 7.0E-04 1.1E-02 1.1E-02Processing 0.4 0.2 0.1 1.8E-02 1.4E-04 1.4E-04Gathering / Transmission 0.5 0.2 0.3 9.9E-04 5.5E-03 5.5E-03YR 6 Daily Emissions Increase with Shale Gas 3.7 2.9 1.8 2.3E-02 0.6 0.6
Table E-2 provides a summary of annual and daily emissions estimates for hazardous air pollutants (HAP). The emissions of formaldehyde and benzene are estimated to increase the most at 0.00 and 0.079 tpd respectively. The emissions of acetaldehyde and xylene are estimated to increase by 0.024 tpd each. The increase in the HAP emissions occur predominantly during the processing and gathering/transmissions phases.
Table E-2. Summary of Key Hazardous Air Pollutant Emissions from Shale Gas Activities
The remaining sections in this document detail the basic concepts of shale gas extraction, the air pollutants of concern, North Carolina’s geological information and estimated gas production, and the
91 Market centers provide interconnections to other pipelines and provide short-term receipt/delivery balancing needs as well as other services that assist with gas transportation. They also provide some buyer/seller matching services and limited gas trading. (Natural Gas Market Centers: A 2008 Update, EIA, 2009)
overall methodology used and uncertainties within the estimates. The four appendices further explain the emission estimates for the development, production, processing, and transmission phases of shale gas extraction.
101 Market centers provide interconnections to other pipelines and provide short-term receipt/delivery balancing needs as well as other services that assist with gas transportation. They also provide some buyer/seller matching services and limited gas trading. (Natural Gas Market Centers: A 2008 Update, EIA, 2009)

2 Introduction
2.1 Shale Gas Extraction
The natural gas found in the Sanford Sub-basin comes from the sedimentation of clay mixed with organic matter.1 Over time, the sediments became low permeability shale rock formations that do not allow the gas to move freely. Therefore, conventional techniques for developing natural gas wells cannot be used in these formations. Newer drilling techniques offer the ability to substantially increase the yield of natural gas from a well, making it more economically viable for shale gas formations.2 These new techniques include horizontal drilling and hydraulic fracturing. A more detailed discussion of horizontal drilling and hydraulic fracturing can be found in the 2012 DENR study report.
The three basic stages in the life of a gas well are development, production and reclamation.
Development refers to all activities associated with preparing for the extraction of natural gas including building infrastructure, transporting equipment to the well sites, drilling, fracturing and completing the wells. Production begins immediately after development and includes all activities to extract, process, and transport the gas to an end user. After the well has reached its useful life, reclamation begins and the well is plugged and the land is reclaimed for other uses. Each of these stages has unique activities, equipment and timeframes associated with them.
This report focuses on the development, production, processing, and transmission phases and their associated emissions of air pollutants. These phases are discussed at a higher level in the following sections. Figure 1 outlines the different activities that are part of the shale gas phases. For a detailed discussion of all activities, sources, and air emission estimates from these phases, refer to the appendices at the end of the report.
111 Market centers provide interconnections to other pipelines and provide short-term receipt/delivery balancing needs as well as other services that assist with gas transportation. They also provide some buyer/seller matching services and limited gas trading. (Natural Gas Market Centers: A 2008 Update, EIA, 2009)

Figure 1. Generalized Schematic of Shale Gas Phases
Phase Activity or Equipment Reference Section
1 Development
Site preparation (land clearing, unpaved roads, truck trips, truck idling), well drilling and completion (drilling, drilling mud degassing, hydraulic fracturing, green well completion)
Appendix A
2 ProductionBlowdown, glycol dehydrator, reboiler, pneumatic controllers, heaters, equipment leaks, produced water tanks
Appendix B
3 ProcessingAcid gas removal (sweetening), compressor engines, glycol dehydrator, reboiler, liquid removal
Appendix C
4Gathering, transmission and distribution
Compressor engines (gathering, booster and high pressure), pipeline leaks Appendix D
121 Market centers provide interconnections to other pipelines and provide short-term receipt/delivery balancing needs as well as other services that assist with gas transportation. They also provide some buyer/seller matching services and limited gas trading. (Natural Gas Market Centers: A 2008 Update, EIA, 2009)

131 Market centers provide interconnections to other pipelines and provide short-term receipt/delivery balancing needs as well as other services that assist with gas transportation. They also provide some buyer/seller matching services and limited gas trading. (Natural Gas Market Centers: A 2008 Update, EIA, 2009)

2.1.1 Development
The development of shale gas wells includes a variety of activities and potential air emission sources. For a given well, these activities do not occur simultaneously. Each activity has multiple sources of air emissions. Air emissions from well development activities are directly proportional to the number of wells being constructed and the depth to which the wells are drilled.
The development phase includes the following basic activities:
1) site preparation2) transportation of equipment, supplies, and waste3) drilling of the well, and4) hydraulic fracturing of the well.
Site preparation includes all activities associated with constructing roads, well pads, pipelines, and other infrastructure that may be required to develop the wells and produce natural gas. Drilling and fracturing equipment must be transported to the well pad as well as all supplies including water. Transportation may be provided through a variety of means including rail, short haul and long haul trucks, and cargo vans. Drilling and fracturing requires approximately two to four million gallons of water.2 It may be pumped from local water wells to the well pad or it may be transported longer distances via tanker trucks. Wastewater and other waste materials must also be transported and disposed of offsite. Wastewater may be transported long distances and even across state lines to approved disposal sites. New directional drilling technology makes it possible to capture larger amounts of gas. This technique involves drilling a well vertically several thousand feet into the shale formation, then turning the drill horizontally to extend the well thousands of feet through the formation.2 Drilling of a well may occur from several days to several weeks and employs large diesel engines on portable drill rigs to power the drill. Hydraulic fracturing increases the flow of natural gas from shale or other impermeable rock formations.2
The process involves perforating the well then injecting fracturing fluid under high pressure to fracture the shale or rock. The fractures allow natural gas to flow up through the well. Large diesel powered pumps are required to pressurize the fluid in the well bore for fracturing. This activity occurs over several days to over a week. After the fracturing has taken place, a certain amount of the fracturing fluid flows back out of the well. This process is called “flowback”. 2 As discussed above, the flowback water must be collected and stored on site until it is transported and disposed of off site. “Well completion” refers to the beginning of the flowback period until the well is shut in or until the gas from the well flows continuously to a gathering line or storage container. Large amounts of gas are also released during the flowback process. Historically, this gas was vented or flared. Newer federal rules require capturing the gas emitted during flowback for use or sale; unless the well is identified as a low pressure well, which are exempt from green completion requirements.11
141 Market centers provide interconnections to other pipelines and provide short-term receipt/delivery balancing needs as well as other services that assist with gas transportation. They also provide some buyer/seller matching services and limited gas trading. (Natural Gas Market Centers: A 2008 Update, EIA, 2009)

2.1.2 Production, Processing and Transmission
After the well development process is complete, the well moves into the production, processing and transmission phases. The air pollution emissions from production are primarily a function of the amount of gas processed annually and the distance it must travel. Production can be broken up into the following phases that occur simultaneously;
1) production,2) processing, and3) gathering, transmission and distribution.
The first phase occurs at the wellhead where the gas is extracted from the well. Depending on the pressure of the gas exiting the well, a gas compressor may be required to increase the gas pressure to allow for adequate flow.2 Some of the gas processing occurs here because the raw gas contains natural gas liquids, water vapor, and other contaminates such as the particulates that must be removed from the gas stream prior to piping.
Where significant amounts of contaminants are required to be removed, the wellhead gas is transported to a processing facility where it is processed into “pipeline quality” natural gas (> 95% methane). Raw natural gas commonly exists in mixtures with other hydrocarbons, such as ethane, propane, butane, and pentanes. In addition, it contains water vapor, hydrogen sulfide, carbon dioxide, helium, nitrogen, and other compounds. The actual practice of processing natural gas to pipeline dry gas quality levels can be quite complex, but usually involves four main activities:
1. condensate removal,2. separation of natural gas liquids, 3. sulfur and carbon dioxide removal, and 4. dehydration.
The major emission sources in the natural gas processing facility are compressor engines, acid gas wastes, and fugitive emissions from leaking process equipment and, if present, glycol dehydrator vent streams. Note that some shale gas formations may have fewer contaminates and may require less processing. In this case, all the gas processing may take place at the well pad. The gas can then be sent directly to transmission lines, without being sent to a processing plant. The natural gas gathering and distribution phase consists of pressurizing the gas to provide a specified flow rate through the pipelines. Compressors are generally located at three specific points. The first point is at the wellhead where the gas exiting the well may require additional pressurization. Second, the gas from individual wells flows to a gathering station where it is collected along with gas from other nearby wells. At the gathering station, the gas may receive additional treatment and pressurization prior to flowing to the processing plant. The third point is located at the end of the processing plant to facilitate flow into the transmission system. The transmission system is a series of one or more compressor stations and associated pipeline which moves the gas to the end user or to a local distribution system. Compressor stations are located at specific points along the pipeline to boost the gas pressure to adequate levels to maintain the flow rate through the piping network.
151 Market centers provide interconnections to other pipelines and provide short-term receipt/delivery balancing needs as well as other services that assist with gas transportation. They also provide some buyer/seller matching services and limited gas trading. (Natural Gas Market Centers: A 2008 Update, EIA, 2009)

The majority of the compressors are powered with natural gas fired reciprocating internal combustion engines (RICE) or natural gas fired turbines. The size and number of engines varies significantly for each point in the production process. Design and number of compressor systems are highly dependent on the design of the piping system, flow rate, and the distance traveled.
Throughout production, processing and transportation of natural gas, releases of gas occur through both fugitive leaks and planned venting of lines and equipment to allow for maintenance. Fugitive leaks and vented emissions are estimated for each of the three main production activities.
2.2 Pollutants of Concern
2.2.1 Regulated Air Pollutants
Air pollutants are classified based on the physical state of the pollutant and the effect the pollutant has on human health and the environment. Four general classifications of pollutants have been established by the federal Clean Air Act (CAA) and generally adopted by the states: 1) criteria air pollutants (CAP); 2) hazardous air pollutants (HAP); 3) other CAA regulated pollutants; and 4) greenhouse gases (GHG). Each of the pollutant classes is handled differently from a regulatory standpoint. In general, each state is responsible for implementing and enforcing federal air pollution regulations.
The pollutants contained in each classification are listed in Table 1 given on the following page. Additional discussion on each class is provided in the following paragraphs.
Table 1. Classifications of Regulated Pollutants
Criteria Air Pollutants Hazardous Air Pollutants Other CAA Regulated Pollutants Greenhouse Gases
Particulate matter (PM10
and PM2.5)Organic pollutants Volatile organic compounds (VOC) Carbon dioxide (CO2)
Carbon monoxide (CO) Inorganic pollutants, including metals Fluorides Nitrous oxide (N2O)
Sulfur dioxide (SO2) Acid gases Sulfuric acid mist (H2SO4) Methane
Nitrogen oxides (NOX) Dioxins and furans Reduced sulfur compounds (including hydrogen sulfide )
Hydrofluorocarbons, perfluorocarbons and sulfur hexafluoride
Ozone (O3) Asbestos
Lead (Pb)
Criteria Air PollutantsThe US EPA calls these pollutants CAP because they are prevalent throughout the United States and pose a risk to human health and public welfare. They are regulated through the National Ambient Air
161 Market centers provide interconnections to other pipelines and provide short-term receipt/delivery balancing needs as well as other services that assist with gas transportation. They also provide some buyer/seller matching services and limited gas trading. (Natural Gas Market Centers: A 2008 Update, EIA, 2009)

Quality Standards (NAAQS) where air concentrations are set that are protective of human health and welfare. Several different regulatory tools are used to attain and maintain the NAAQS. At the state level, the CAA requires development of a state implementation plan (SIP) for achieving and maintaining the standard for each pollutant. The SIP typically includes emission standards for sources that emit a particular CAP, but may also include other enforceable emission control measures. The US EPA also sets federal New Source Performance Standards (NSPS) for new, modified or expanded sources of a CAP which limit emissions from these sources. The state implements New Source Review (NSR) permitting requirements for sources subject to the NSPS requirements.Hazardous Air PollutantsHazardous air pollutants (HAP have cancer and non-cancer adverse effects on human health. HAP are regulated under rules listed in Section 112(b) of the CAA. The CAA currently lists 187 chemicals as HAP. Examples of HAP include organic compounds such as benzene and toluene, acid gases such as hydrogen chloride, metals such as chromium and mercury, and other pollutants such as dioxins and asbestos.
HAP are federally regulated via the National Emission Standards for Hazardous Air Pollutants (NESHAP). The NESHAP are established by source category for the sources listed under Section 112 of the CAA.
Many of the federally listed HAP (and 20 additional toxic air pollutants (TAP)) are regulated under state rules for the control of TAP (15A NCAC 02D.1104 Toxic Air Pollutant Guidelines). The HAP emitted during natural gas operations for which emission factors were available that are evaluated for this report include:
formaldehydeacetaldehydeacroleinmethanolbenzene
ethylbenzene
toluene
xylene
hexane
styrene
Other CAA Regulated Pollutants
Natural gas operations generally result in emissions of volatile organic compounds (VOC) and hydrogen sulfide (H2S). These two pollutants are regulated under the CAA primarily through the Best Achievable Control Technology (BACT) component of the New Source Review (NSR) permitting program and source-specific limits specified by New Source Performance Standards (NSPS). Section 3.2.1 of this report discusses the NSPS regulations for emissions of VOC and H2S from the natural gas industry.
The oil and natural gas industry is the largest industrial source of VOC emissions in the United States. VOC are generally carbon and hydrogen-based chemicals that exist in the gas phase or can evaporate from liquids. VOC can react in the atmosphere to form ozone and fine particulate matter. In North Carolina ozone formation is not significantly influenced by man-made emissions of VOC. This is due to
171 Market centers provide interconnections to other pipelines and provide short-term receipt/delivery balancing needs as well as other services that assist with gas transportation. They also provide some buyer/seller matching services and limited gas trading. (Natural Gas Market Centers: A 2008 Update, EIA, 2009)

the abundance of biogenic sources of VOC present in the Southeast. It should be noted that methane and ethane are specifically excluded from the definition of VOC because they react slower in the atmosphere than the other VOC compounds.
Acid gases and H2S occur naturally in some natural gas formations. This type of natural gas is often referred to as “sour gas”. It is primarily emitted during well development activities and treatment of raw gas to remove the H2S is referred to as “sweetening”. Listed under Section 112(r) of the CAA as known to cause serious adverse effects to human health and the environment in the case of an accidental release, H2S has a characteristic smell of rotten eggs and is an irritatant at low concentrations and toxic at high concentrations.4
Greenhouse Gases (GHG)
Greenhouse gases (GHG) are compounds in the atmosphere that absorb and emit radiation in the thermal infrared range. The US EPA has determined that this process is the fundamental cause of the “greenhouse effect” and is linked to global climate change. The primary source of GHG emissions from natural gas development and production is leaks and releases of methane. Methane is 21 times more efficient than carbon dioxide (CO2) at capturing heat reflected from the earth’s surface. Large amounts of CO2 are also emitted during combustion of diesel and natural gas fuels. The US EPA estimates that in 2011 approximately 367 billion cubic feet of methane were emitted into the atmosphere from natural gas development, production, processing and transmission.5
2.2.2 Other Unregulated Air Pollutants
Pollutants in Hydraulic Fracturing Fluid
Hydraulic fracturing fluid is pumped into the well at high pressure to open and enlarge fractures within the rock formation. Hydraulic fracturing fluid is a blend of three components a base fluid, a proppant, and chemical additives. The base fluid is usually water, but can include other chemicals such as methanol, liquid carbon dioxide, and liquefied petroleum gas.12 Proppants consist of particles that hold open the fractures created by hydraulic fracturing allowing the gas to flow out of the formation and into the well. Silica sand is frequently used as a proppant. Other proppants include sintered bauxite or ceramics, and resin-coated sand.12 Chemical additives include friction reducers, scale inhibitors, solvents, acids, gelling agents, and biocides that are added to protect equipment, reduce pumping requirements, and maintain the integrity of the formation.12
The blend of base fluid, proppant, and chemical additives used by a hydraulic fracturing company is highly proprietary. Therefore, for a given well bore, the exact chemicals contained in the fluid being injected and the proportions of those chemical is generally not known. According to the 2012 DENR report, hydraulic fracturing fluids typically consist of 98 to 99.5 percent water and sand.1 Chemical additives account for the remaining 0.5 percent of the mixture.
The hydraulic fracturing industry uses hundreds of different chemical additives for a variety of purposes in developing the well. The chemicals used for a given well will vary based on the requirements of the
181 Market centers provide interconnections to other pipelines and provide short-term receipt/delivery balancing needs as well as other services that assist with gas transportation. They also provide some buyer/seller matching services and limited gas trading. (Natural Gas Market Centers: A 2008 Update, EIA, 2009)

well development. It is very difficult to obtain information on the chemicals contained in fracturing liquid. For more detailed information on fracturing liquid, see Section 4 of the 2012 DENR Report1 and the draft environmental impact statement issued for the New York Marcellus shale formation.12
The hydraulic fracturing liquid is mixed and stored on site in large amounts prior to well development. In addition, wastewater from hydraulic fracturing contains hydraulic fracturing fluid as well as contaminants from the shale gas formation itself, including shale gas that may be dissolved in the fluid and liquid hydrocarbons. The wastewater is generally stored on site prior to disposal at an approved facility.
Due to the variety of chemicals that may be present in fracturing fluid, it is not possible for the DAQ to estimate air emissions from the hydraulic fracturing fluid or wastewater containing the fracturing fluid that is stored and used on site.
Large quantities of sand, generally crystalline silica, are used during hydraulic fracturing as proppants. Sand is delivered via truck and then loaded into sand movers. From there, it is transferred via conveyer belt to a blending hopper, where the hydraulic fracturing fluid is mixed. During the filling, transfer, and mixing operations respirable silica dusts are released into the air. This is primarily an exposure problem for on-site workers and is regulated by the Occupational Safety and Health Administration (OSHA).13 The contribution of silica dust to the overall fugitive dust emitted from the site is limited since the fluid mixing occurs only during the period of time the well is hydraulically fractured.
Pollutants in Geologic Formations
Some geologic formations contain low level, naturally occurring radionuclides, such as radium and radon. When radioactive material is brought to the surface during shale gas drilling and production operations, it remains in the rock pieces of the drill cuttings, remains in solution with produced water, or, under certain conditions, precipitates out in scales or sludges.2 The radiation is weak and cannot penetrate dense materials such as the steel used in pipes and tanks. The principal concern is that, over time, it can become concentrated in field production equipment or tanks. Radionuclides are regulated by the US EPA under several programs based on the medium of exposure (soil, water air). The US EPA regulates airborne radionuclides as a HAP, But the well and its associated equipment are not subject to the NESAHP. Airborne radionuclides were not assessed in this report.
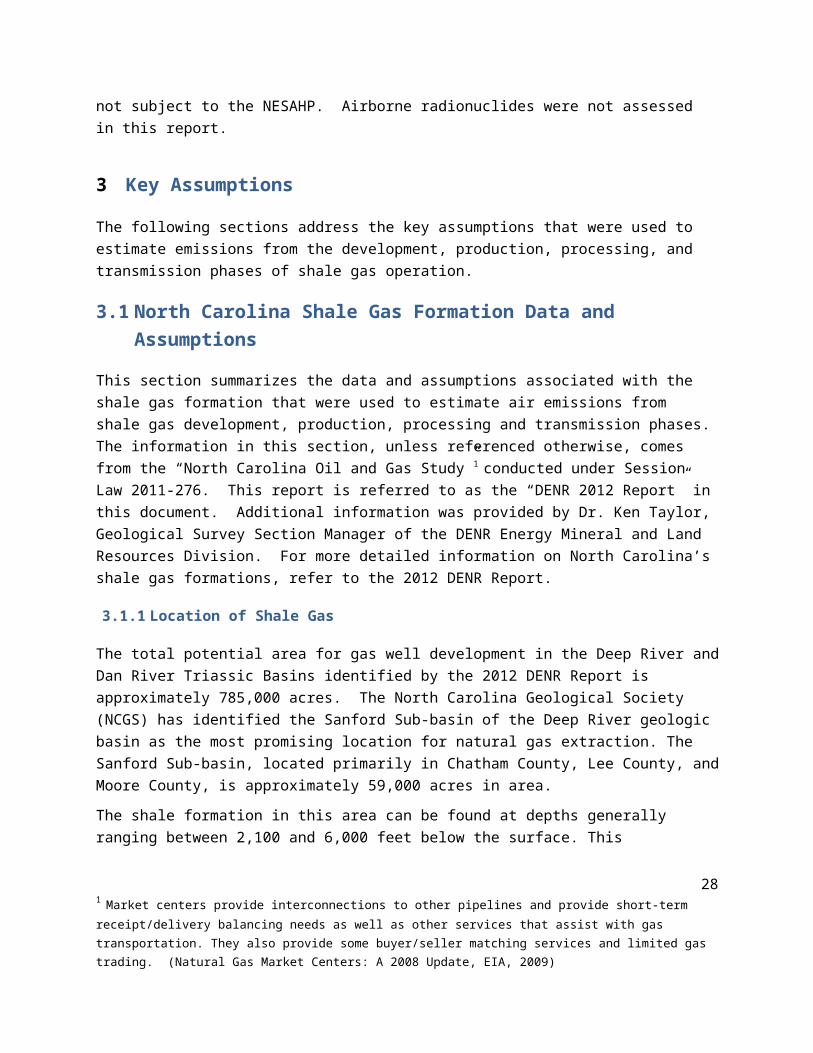
3 Key Assumptions
The following sections address the key assumptions that were used to estimate emissions from the development, production, processing, and transmission phases of shale gas operation.
191 Market centers provide interconnections to other pipelines and provide short-term receipt/delivery balancing needs as well as other services that assist with gas transportation. They also provide some buyer/seller matching services and limited gas trading. (Natural Gas Market Centers: A 2008 Update, EIA, 2009)

3.1 North Carolina Shale Gas Formation Data and Assumptions
This section summarizes the data and assumptions associated with the shale gas formation that were used to estimate air emissions from shale gas development, production, processing and transmission phases. The information in this section, unless referenced otherwise, comes from the “North Carolina Oil and Gas Study”1 conducted under Session Law 2011-276. This report is referred to as the “DENR 2012 Report” in this document. Additional information was provided by Dr. Ken Taylor, Geological Survey Section Manager of the DENR Energy Mineral and Land Resources Division. For more detailed information on North Carolina’s shale gas formations, refer to the 2012 DENR Report.
3.1.1 Location of Shale Gas
The total potential area for gas well development in the Deep River and Dan River Triassic Basins identified by the 2012 DENR Report is approximately 785,000 acres. The North Carolina Geological Society (NCGS) has identified the Sanford Sub basin ‐ of the Deep River geologic basin as the most promising location for natural gas extraction. The Sanford Sub basin, located primarily in Chatham County, Lee County, and ‐Moore County, is approximately 59,000 acres in area.
The shale formation in this area can be found at depths generally ranging between 2,100 and 6,000 feet below the surface. This particular shale formation has a maximum thickness of 800 feet and an average thickness that ranges from 180 to 540 feet.
3.1.2 Number of Wells
North Carolina law does not currently address well spacing. Some states use a well spacing of 160 acres per well; however, spacing can be as low as 60 acres per well. The 2012 DENR Report assumed a spacing of one well per 160 acres. With 59,000 acres identified as the prospective drilling area, and a well spacing of 160 acres, there would be a total of 368 wells installed and operating in the Sanford Sub-basin.
Newer drilling techniques combine several wells on the same drilling pad. A 640-acre section of land could be developed using 4 horizontal wells, all drilled from a single multi-well drilling pad (DOE 2009). This reduces the overall number of well pads, access roads, pipeline routes, and production facilities required. This air impact study assumes four wells are drilled per pad.
For this analysis, the DAQ assumes 368 wells are drilled. The DAQ also assumes that there are four wells per well pad which covers a 640-acre area. A total of 92 pads are installed in the Sanford Sub-basin.
3.1.3 Potential Gas Recovery for a Single Well and Total Sub-Basin
The 2012 DENR Report projected the number of wells and total gas production for the Sanford Sub-basin. The report relied on data gathered from only two test wells in the Sanford Sub basin. The data from these‐ wells may not be representative of the resource throughout the Sanford Sub basin. Geologic c‐ onditions in
201 Market centers provide interconnections to other pipelines and provide short-term receipt/delivery balancing needs as well as other services that assist with gas transportation. They also provide some buyer/seller matching services and limited gas trading. (Natural Gas Market Centers: A 2008 Update, EIA, 2009)

the Triassic Basins of North Carolina are not identical to those found in Pennsylvania or other gas‐producing states. Therefore, comparisons to other formations are of limited value.
Based on the data from the two sample wells, the NCGS has estimated 4.2 billion cubic feet gas (Bcf) of total gas in place per well in the Sanford Sub-basin. The DENR has recommended using 20 percent of any estimate of original gas in place as an estimate of the amount of gas that could be produced. Therefore, the total gas that could be produced from a single well is estimated to be 840 million cubic feet (MMcf) of gas. The 2012 DENR Report estimated the total volume of technically recoverable gas for the 59,000-acre area of the Sanford Sub-basin, containing 368 wells at 309 Bcf.
In 2011, the U.S. Geological Survey (USGS) completed an assessment of natural gas resources for all Mesozoic basins along the East Coast, which includes the Triassic Basins of North Carolina. This report indicated that the gas volume of the total undiscovered resources for the Deep River Basin was 1,660 Bcf. Using the DENR estimate of 20% of the gas that is considered technically recoverable, would result in a gas volume of 332 Bcf, which is similar to the estimate given in the 2012 DENR Report for the Deep River Basin.
3.1.4 Annual Volume of Gas Produced and Development Timeframe
Dr. Ken Taylor, NC’s state geologist estimated the economic impact of shale gas development in the Sanford Sub-basin in the 2012 DENR Report. For this air emissions study, Dr. Taylor developed the table shown below for DAQ. Note this table was not published in the 2012 DENR Report. It assumes the total field recoverable gas estimate is higher than given in the 2012 DENR Report; 772 Bcf. How the actual gas play occurs is dependent on a number of factors including the most economical development of the field and the terms of land leasing agreements. Dr. Taylor’s assessment used the development of other shale gas areas in the US as a model. His estimate assumes all the wells are horizontally drilled and fractured.
Table 2. Sanford Sub-Basin Annual Gas Production Estimate
Drilling Year Year 1 Year 2 Year 3 Year 4 Year 5 Year 6New Wells Drilled 5 23 39 66 113 121
Cumulative Wells 28 67 134 247 368Production
YearGas Volume per Well (MMcfg)
Cumulative Gas (MMcfg)
1 584 2,920 2,9202 423 2,115 13,432 15,5473 306 1,530 9,729 22,776 34,0354 222 1,110 7,038 16,497 38,544 63,1895 161 805 5,106 11,934 27,918 65,992 111,7556 117 585 3,703 8,658 20,196 47,799 70,664 151,6057 84 420 2,691 6,279 14,652 34,578 51,183 109,8038 61 305 1,932 4,563 10,626 25,086 37,026 79,5389 43 215 1,403 3,276 7,722 18,193 26,862 57,671
211 Market centers provide interconnections to other pipelines and provide short-term receipt/delivery balancing needs as well as other services that assist with gas transportation. They also provide some buyer/seller matching services and limited gas trading. (Natural Gas Market Centers: A 2008 Update, EIA, 2009)

10 32 160 989 2,379 5,544 13,221 19,481 41,77411 24 118 736 1,677 4,026 9,492 14,157 30,20612 17 84 541 1,248 2,838 6,893 10,164 21,76713 12 62 384 917 2,112 4,859 7,381 15,71414 9 45 283 651 1,551 3,616 5,203 11,34915 6 32 205 480 1,102 2,656 3,872 8,34616 5 23 146 347 812 1,887 2,844 6,05917 3 17 107 248 587 1,390 2,021 4,37018 3 13 78 182 420 1,006 1,488 3,18619 2 9 58 132 308 719 1,077 2,30120 1 6 39 98 224 527 770 1,662
Total Gas Produced by the Field 772,797No new wells are drilled after Year 6Horizontally Drilled and Fractured Wells
From the table above, the maximum air pollution emissions from natural gas development and production would occur during Year 6. In this year, 121 new wells are drilled, 247 existing wells are in production, resulting in 151,605 million cubic feet of gas (MMcfg) processed. This anticipated number of wells was used to estimate air pollution emissions in the development phase, and this projected volume of recovered gas was used to estimate air pollution emissions due to production activities in this study.
3.1.5 Chemical Composition of NC Shale Gas
The gas extracted from a shale formation is primarily made up of methane. However, it also contains water vapor, other hydrocarbons, as well as other compounds such as H2S, CO2 helium, and nitrogen6. The amount and type of non-methane components will affect how much processing of the gas is required to refine it into “pipeline quality gas”. Pipeline quality natural gas is approximately 95% to 98% methane.3
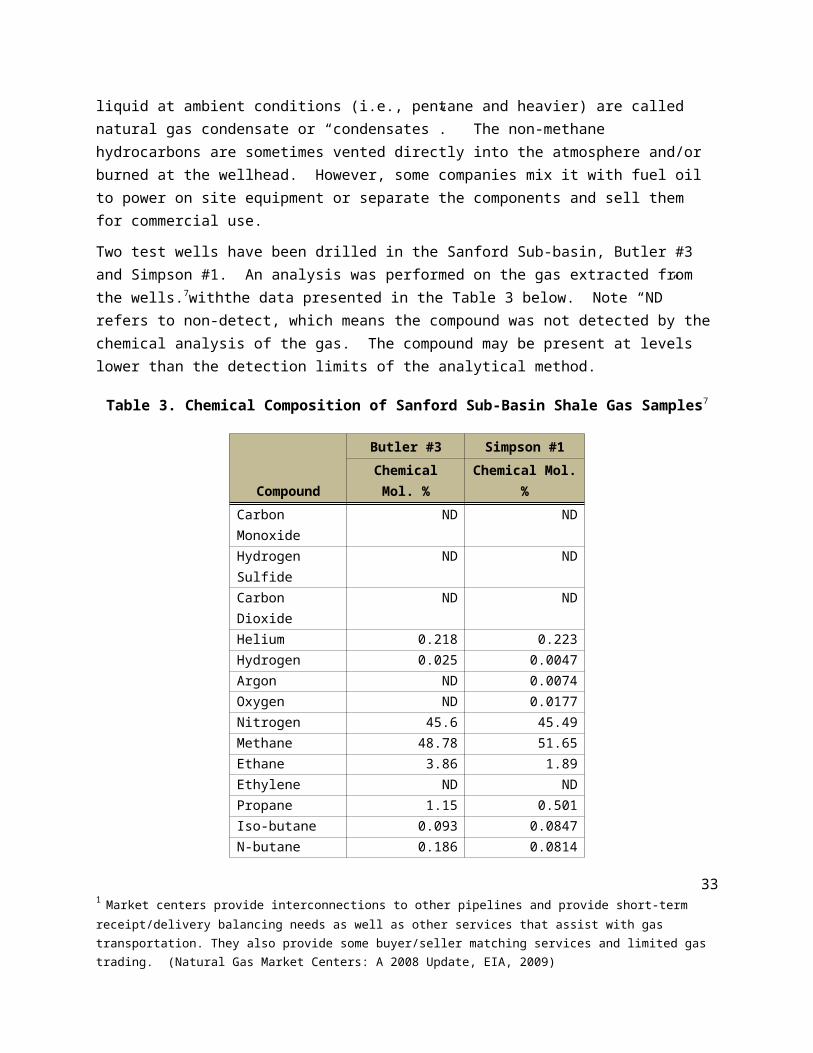
As stated above, natural gas extracted from wells commonly exists in mixtures with other hydrocarbons. These hydrocarbons are semi-liquids and are generally made up of ethane, propane, butane, and pentanes and higher molecular weight components.6 They are referred to by the industry as “natural gas liquids” (NGL). The hydrocarbons that are liquid at ambient conditions (i.e., pentane and heavier) are called natural gas condensate or “condensates”. The non-methane hydrocarbons are sometimes vented directly into the atmosphere and/or burned at the wellhead. However, some companies mix it with fuel oil to power on site equipment or separate the components and sell them for commercial use.
221 Market centers provide interconnections to other pipelines and provide short-term receipt/delivery balancing needs as well as other services that assist with gas transportation. They also provide some buyer/seller matching services and limited gas trading. (Natural Gas Market Centers: A 2008 Update, EIA, 2009)

Two test wells have been drilled in the Sanford Sub-basin, Butler #3 and Simpson #1. An analysis was performed on the gas extracted from the wells.7withthe data presented in the Table 3 below. Note “ND” refers to non-detect, which means the compound was not detected by the chemical analysis of the gas. The compound may be present at levels lower than the detection limits of the analytical method.
Table 3. Chemical Composition of Sanford Sub-Basin Shale Gas Samples7
Compound
Butler #3 Simpson #1
Chemical Mol. % Chemical Mol. %
Carbon Monoxide ND NDHydrogen Sulfide ND NDCarbon Dioxide ND NDHelium 0.218 0.223Hydrogen 0.025 0.0047Argon ND 0.0074Oxygen ND 0.0177Nitrogen 45.6 45.49Methane 48.78 51.65Ethane 3.86 1.89Ethylene ND NDPropane 1.15 0.501Iso-butane 0.093 0.0847N-butane 0.186 0.0814Iso-pentane 0.0264 0.0216N-pentane 0.0436 0.0142Hexanes + 0.0366 0.013
The DAQ did not use the composition data given above to estimate emissions of non-methane gas constituents. The DAQ believes these two samples may not be representative of the gas composition of the entire basin. Therefore, the DAQ used average gas composition values included in the memorandum from Heather Brown with the subject, ‘Composition of Natural Gas for use in the Oil and Natural Gas Sector Rulemaking’.14 The specific gas composition values used in this report are presented in Table 3a.
Table 3a. Nation-Wide Average Gas Composition, in Volume Percent
Methane VOC Benzene Ethylbenzene Toluene Xylene n-Hexane H2S83.1 3.66 0.005 0.00 0.003 0.001 0.155 2.027
231 Market centers provide interconnections to other pipelines and provide short-term receipt/delivery balancing needs as well as other services that assist with gas transportation. They also provide some buyer/seller matching services and limited gas trading. (Natural Gas Market Centers: A 2008 Update, EIA, 2009)

In addition, the DAQ assumed the raw gas from the well would require processing to remove containments including H2S. This was to produce conservative emission estimates from processing. Emissions of H2S may be removed from the emissions profile once better information on gas composition is known as future exploratory wells are drilled.
3.2 Regulations
The CAA limits air emissions from specific sources associated with natural gas drilling and production. State agencies are responsible for implementing and enforcing federal law, including administering air permits. In addition, many states with natural gas production operations also have their own sets of state laws and regulations regarding shale gas development and production.
The NC Legislature has tasked the DENR (through the Mining and Energy Commission and the Environmental Management Commission) with establishing state permitting requirements and other rules associated with developing shale gas wells. This report provides a brief overview of federal regulations affecting natural gas operations.
3.2.1 Federal Regulations
Regulation of oil and gas operations is a complicated subject and cannot adequately be addressed in this report. This report only discusses the federal regulations at a high level and lists the applicable rules. Emission limits due to permitting requirements are not addressed. The Appendices address any specific regulatory impact to emission estimates for a given source category.
Note that since publication of the 2012 DENR Report, the US EPA has finalized several regulations for the oil and gas industry. In the discussion below, regulations for CAP under NSPS are found in Title 40 Part 60 of the Federal Code of Regulations and regulations for HAP under the NESHAP program are found in Title 40 Part 63.
Combustion Sources
A variety of engines are used in drilling and hydraulic fracturing at a well site to power the drill rig or move drilling or fracturing fluids. The drilling and fracturing engines are predominately diesel-fired internal combustion engines that are not considered to be stationary equipment since these engines do not remain at a location for more than 12 consecutive months. Combustion from these diesel-fired engines are sources of CAP, HAP, GHG, and potentially sulfuric acid mist. Depending on their age, these diesel-fired engines may be subject to 40 CFR 89 Control of Emissions from New and In-use Nonroad Compression Ignition Engines.
Compressor engines are used at the well pads, gathering stations, processing plants or along the transmission lines to move the natural gas. These sources are predominately natural gas-fired reciprocating internal combustion engines (RICE). These engines are regulated by various emissions
241 Market centers provide interconnections to other pipelines and provide short-term receipt/delivery balancing needs as well as other services that assist with gas transportation. They also provide some buyer/seller matching services and limited gas trading. (Natural Gas Market Centers: A 2008 Update, EIA, 2009)

standards under the North Carolina SIP to meet the NAAQS, federal NSPS and NESHAP regulations, and other federal engine standards. The applicable NSPS and NESHAP regulations are given below. These regulations limit emissions of criteria, VOC and HAP based on fuel type, size, age, and other criteria.
40 CFR 60 Subpart IIII Standards of Performance for Stationary Compression Ignition and Spark Ignition Internal Combustion Engines
40 CFR 60 Subpart JJJJ Standards of Performance for Stationary Spark Ignition Internal Combustion Engines
40 CFR 63 Subpart ZZZZ National Emission Standards for Hazardous Air Pollutants from Reciprocating Internal Combustion Engines
Natural Gas Development and Production Sources
Natural gas development and production operations are primarily regulated by federal NSPS and NESHAP. These rules affect emissions of VOC, SO2, benzene and other organic HAPs. There are currently no federal regulations for the control of methane or other GHGs from natural gas operations. In addition, well sites, processing plants, and compression stations may require an air quality permit and be subject to additional emission limits due to permitting requirements.
In 2012, the US EPA promulgated additional NSPS and NESHAP requirements to reduce emissions from a broad range of oil and natural gas exploration and production activities. The standards were not discussed in the DENR 2012 Report since they had not been finalized at the time the report was issued. Affected sources include the following;
wellheads, centrifugal/reciprocating compressors, pneumatic controllers,
glycol dehydrators, storage vessels, and acid gas waste “sweetening” units.
These standards are listed below along with a brief description of how they limit emissions.
40 CFR 60 Subpart OOOO Standards of Performance for Crude Oil and Natural Gas Production, Transmission and Distribution
40 CFR 60 Subpart LLL Standards of Performance for Onshore Natural Gas Processing: SO2 Emissions
40 CFR Part 63 Subpart HH National Emission Standards for Hazardous Air Pollutants from Oil and Natural Gas Production Facilities
40 CFR 63 Subpart HHH National Emission Standards for Hazardous Air Pollutants from Natural Gas Transmission and Storage Facilities
Beginning Jan. 1, 2015, operators must employ reduced emissions completion methods and/or technologies (also called green completion) to capture the raw gas that flows out of the well after hydraulic fracturing. The captured gas can then be made available for use or sale. This reduces VOC emissions by approximately 95%. As a co-benefit, a large percentage of methane
251 Market centers provide interconnections to other pipelines and provide short-term receipt/delivery balancing needs as well as other services that assist with gas transportation. They also provide some buyer/seller matching services and limited gas trading. (Natural Gas Market Centers: A 2008 Update, EIA, 2009)

emissions are also reduced. NOTE: Low-pressure wells are exempted from these requirements; therefore emissions from these sources could be different from those estimated.
Pneumatic controllers are automated instruments used at wells, processing plants, and compressor stations. These controllers are often powered by high-pressure natural gas and release gas with valve movements as part of their normal operations. The rule limits VOC emissions of gas-driven controllers based on their size and location (wellhead, compressor stations, or processing plant).
Compressors are used to move gas through pipelines. The rule requires a 95 percent reduction in VOC emissions from centrifugal compressors with wet seal systems. The rule requires periodic replacement of rod packing systems in reciprocating compressors to limit VOC emissions.
Storage tanks at natural gas well sites are commonly used to store condensate and produced water. These tanks may be subject to two standards: 1) the NSPS for VOCs, and 2) the NESHAP for organic compounds such as benzene. Under the NSPS, new storage tanks with VOC emissions of 6 tons a year or more must reduce VOC emissions by at least 95 percent. The US EPA did not modify rules for HAP emissions from storage tanks. The previous NESHAP standard for storage tanks with the potential for flash emissions remains in place.
Glycol dehydrators are used to remove water vapor from the raw gas. Emissions of benzene and other HAP are limited based on the size of the dehydrator. Large dehydrators must either reduce emissions of benzene to less than 1 ton per year or limit HAP emissions by 95%.
“Sweetening” is a process that removes sulfur from natural gas. The new rule requires sweetening units at natural gas processing plants to reduce SO2 emissions by 99.9%. This requirement applies to units with a sulfur production rate of at least five long tons per day. SO2 reductions are also required for sweetening units greater than 2 tons per day similar to NSPS subpart LLL.
Fugitive emissions of VOC and HAP at well sites, processing facilities and transmission systems must be reduced by implementing a leak detection and repair (LDAR) program similar to 40 CFR 60 Subpart KKK.
4 Overall Emissions Estimation Methodology
Air pollution emissions can be estimated using a variety of techniques. These include 1) direct measurement of emissions from stacks, vents, and other point sources, 2) estimating emissions from published emission factors for a given source category, 3) estimating emissions using a materials balance of a process, and/or 4) estimating emissions using engineering calculations. Each of the methods has its own data quality issues and uncertainties associated with it.
261 Market centers provide interconnections to other pipelines and provide short-term receipt/delivery balancing needs as well as other services that assist with gas transportation. They also provide some buyer/seller matching services and limited gas trading. (Natural Gas Market Centers: A 2008 Update, EIA, 2009)

This report primarily estimates emissions based on peer reviewed, published emission factors. This approach is frequently used to calculate the total emissions from a variety of sources in support of an emission inventory. The basic method for calculating emissions is discussed in the following section.
Note that not all sources of air emissions associated with the natural gas operations have published emission factors or activity data readily available.
4.1 Emissions Calculations
An air pollution emission factor is a representative value that relates the quantity of a pollutant released into the atmosphere with an activity associated with the release of that pollutant. Emission factors are generally source specific. For example, there are specific emission factor for various types of combustion equipment, such as boilers, vehicles, and kilns, and for each fuel type associated with the combustion, such as coal and natural gas. The activity data is generally a weight, volume, distance, or duration of the activity emitting the pollutant. Common types of activity used to estimate emissions include quantity of raw material processed, quantity of final product, hours of operation, miles traveled, and volume of fuel burned. In addition to the activity, there may be some other important parameters associated with the emissions that are included in the calculations. Examples of these other parameters include the load factor of an engine and soil moisture content.
The general the equation for emission estimation is:
E=EF× A×P
where: E = emissions EF = emission factor for a specific pollutant A = activity rate for a specific sourceP = additional parameter affecting source emissions
In addition, a source may have installed an air pollution control device, such as a scrubber or filter. In this case, the control efficiency of the device must also be included in the calculation.
Emission factors are developed by the US EPA and other entities by collecting directly measured emissions data and activity data for a given source category. Then, averages of all the available data with acceptable quality are calculated to create the population average. Note that variations in the operating conditions for a specific source, such as the operating load factor, amount of raw materials used, temperature of combustion, and emission controls, can significantly affect the emissions from that source.
For this report, emission factors were taken from two primary sources:
1. AP 42, Fifth Edition, Compilation of Air Pollutant Emission Factors, Volume 1: Stationary Point and Area Sources, http://www.epa.gov/ttn/chief/ap42/index.html. 8
2. 2011 Nonpoint Oil and Gas Emission Estimation Tool, U.S. EPA, updated November 21, 20149
271 Market centers provide interconnections to other pipelines and provide short-term receipt/delivery balancing needs as well as other services that assist with gas transportation. They also provide some buyer/seller matching services and limited gas trading. (Natural Gas Market Centers: A 2008 Update, EIA, 2009)
Other emission factors used to develop the emissions inventory are discussed in the Appendices for this report.
AP-42 is a standard source of emission factors for many sources and industries. It contains emission factors and process information for more than 200 air pollution source categories. It is commonly used to estimate emissions in lieu of site-specific or source-specific emissions data.
EPA’s 2011 Nonpoint Oil and Gas Emission Estimation Tool, which was revised in 2014 (referred to as the Tool) contains a set of emission factors and activity data developed specifically for the oil and natural gas production sector, particularly for activities that occur at the wellhead. It contains source-specific and site-specific emissions and activity data that can be used to estimate emissions. It also relies on AP-42 emission factors for engines. Data is further refined by using site and source specific activity.
In addition, the US EPA often collects emissions data for a given source category prior to a rulemaking. The technical reports associated with the rulemaking often give valuable information concerning emissions data and control device efficiencies.
4.2 Uncertainties
Air emissions estimating techniques from shale gas production is an evolving science. Due to the complexities involved in characterizing a unique set of equipment and operational scenarios, many states and the US EPA have formed a National Oil & Gas Emissions Committee to increase our understanding of the emissions processes and to develop consistent and reliable emissions estimation methodology. The DAQ participates in the Committee and has integrated the current state of knowledge in this report. Despite our best intention, uncertainty in emissions estimations remains due to the shale gas formation data and assumptions used in this report. The amount of technically recoverable gas, the number of wells drilled, the depth of the wells, etc., are all high level, initial estimates and are subject to change as more refined geological formation data becomes available.
Much of the activity data used to estimate emissions in this report are based on data obtained from shale gas development and production facilities located in other states. This activity may not be representative of the equipment or the actual operation of the equipment used in North Carolina.
The accuracy of a given emission factor is highly dependent on the population of sources and the accuracy of the emissions measurement data used in developing the factor. Each emission factor published by the US EPA is assigned a data quality value. This data quality measure reflects the accuracy of the population of emissions data reported to the US EPA for a specific source category.
The data included in AP-42 emissions estimates is often very old (more than 10 years) and is less applicable to newer sources. Sources are always modifying their operations, either in response to regulations or in response to changes in the market, fuel, or other factors. Therefore, the emission factors published in AP-42 may no longer be as accurate for certain source categories. For example,
281 Market centers provide interconnections to other pipelines and provide short-term receipt/delivery balancing needs as well as other services that assist with gas transportation. They also provide some buyer/seller matching services and limited gas trading. (Natural Gas Market Centers: A 2008 Update, EIA, 2009)

published AP-42 emission factors for diesel fired-engines assume the use of fuel containing higher amounts of sulfur than fuel that is currently sold.
The US EPA has limited directly-measured air emissions data for HAP and CAP for several important oil and gas production processes and sources, including well completions and wastewater storage. The Tool is an example of the US EPA’s efforts to improve the emissions data for this sector. The US EPA Office of the Inspector General issued a report in February of 2013 discussing the quality of data available for the oil and gas industry10. This report can be found at: http://www.epa.gov/oig/reports/2013/20130220-13-P-0161.pdf. This report stated approximately 50% of the natural gas production emission factors published by the US EPA were rated below average or were unrated. The report also makes recommendations on obtaining better emissions data and emission factors than currently published values.
This report has been peer reviewed by the following individuals and their teams that are currently active in emissions characterization from oil and gas operations in their respective regions. The DAQ appreciates the expert advice given to us, and has incorporated all technical comments provided through the review process.
Mark GibbsAir Quality DivisionOklahoma Dept. of Environmental Quality
Ona Papageorgiou, P.E.Bureau of Ari Quality Planning, Division of Air ResourcesNew York State Dept. of Environmental Conservation
Allen Robinson, Ph.D. Dept. Head Mechanical EngineeringCarnegie Mellon University
5 Summary of Estimated Air Emissions
Table 4 provides a summary of annual and daily air pollution emissions estimates for CAP. Based on the assumptions applied, it is estimated that NOx emissions in the Lee County area would increase 3.7 tons per day (tpd). The emissions contribution from mobile sources are estimated to represent about 15 percent of the total NOx emissions. The emissions of VOC are estimated to increase by 2.9 tpd with the majority of those emissions expected to occur during the production phase. Figures 2 and 3 show the relative contribution of NOx and VOC emissions, respectively, from various shale gas activities. In a separate report, the DAQ has evaluated the impact of total NOx emissions on ozone formation.
291 Market centers provide interconnections to other pipelines and provide short-term receipt/delivery balancing needs as well as other services that assist with gas transportation. They also provide some buyer/seller matching services and limited gas trading. (Natural Gas Market Centers: A 2008 Update, EIA, 2009)

Table 4. Summary of Criteria Air Pollutant Emissions for Shale Gas Activities
Estimated Annual Emissions (tpy)Criteria Air Pollutants
PhaseNOX
(tpy)VOC(tpy)
CO(tpy)
SO2
(tpy)PM10z
(tpy)PM2.5
(tpy)Development - mobile source contribution 213 28 195 0.2 6 5Development - nonmobile source contribution 287 882 215 0 4 4Production 287 882 215 0 4 4Processing 146 59 34 6.7 5.2E-02 5.2E-02Gathering / Transmission 176 65 93 0.4 2 2
YR 6 Annual Emissions Increase with Shale Gas 1
,344 1
,075
658
8 20
5 2
05
Sanford Sub-basin Annual Emissions w/o Shale Gas 1
,944 1
,274 12,
720
43 6
2 3
70
Total Annual Emissions with Shale Gas 3
,288 2
,349 13,
377
51 26
8 5
75% Emissions Increase 69% 84% 5% 20% 330% 55%
Estimated Daily Emissions (tpd)Criteria Air Pollutants
PhaseNOX
(tpy)VOC(tpy)
CO(tpy)
SO2
(tpy)PM10z
(tpy)PM2.5
(tpy)Development - mobile source contribution 0.6 0.1 0.5 5.4E-04 1.5E-02 1.5E-02Development - nonmobile source contribution 1.4 0.1 0.3 2.5E-03 5.3E-01 5.3E-01Production 0.8 2.4 0.6 7.0E-04 1.1E-02 1.1E-02Processing 0.4 0.2 0.1 1.8E-02 1.4E-04 1.4E-04Gathering / Transmission 0.5 0.2 0.3 9.9E-04 5.5E-03 5.5E-03YR 6 Daily Emissions Increase with Shale Gas 3.7 2.9 1.8 2.3E-02 0.6 0.6
301 Market centers provide interconnections to other pipelines and provide short-term receipt/delivery balancing needs as well as other services that assist with gas transportation. They also provide some buyer/seller matching services and limited gas trading. (Natural Gas Market Centers: A 2008 Update, EIA, 2009)

Figure 1. Relative Contribution of NOX Emissions by Activity
NOTE: Less than 1 tpy or Zero NOX Emissions from the following phases/activities:Development - Land Clearing, Unpaved Roads, Drilling Mud Degassing, and Green Well CompletionProduction - Produced Water tanks, Glycol dehydrator and associated reboiler, Pneumatic Controllers, Fugitive leaksProcessing - Glycol dehydrator and associated reboiler, Vents, Fugitive Leaks & Venting, Acid Gas Waste Sweetening UnitsGathering Stations (all) - Glycol dehydrator and associated reboiler, VentsTransmission - Glycol dehydrator and associated reboiler, Vents, Fugitive Leaks & Venting
0
50
100
150
200
250
300
350
Truc
k Tr
ips (
100
mile
s)
Truc
k Id
ling
Horiz
onta
l Dril
ling
Hydr
aulic
Fra
ctur
ing
Blow
dow
n ve
nting
Wel
lhea
d Co
mpr
esso
r Eng
ines
Heat
ers
Com
pres
sor E
ngin
es
Com
pres
sor E
ngin
es
Com
pres
sor E
ngin
es
Development Production Processing Gathering (all) Transmission
NO
X Em
issio
ns (t
py)
Figure 2. Relative Contribution of VOC Emissions by Activity
311 Market centers provide interconnections to other pipelines and provide short-term receipt/delivery balancing needs as well as other services that assist with gas transportation. They also provide some buyer/seller matching services and limited gas trading. (Natural Gas Market Centers: A 2008 Update, EIA, 2009)

NOTE: Less than 1 tpy or Zero VOC Emissions from the following phases/activities:Development - Land Clearing, Unpaved Roads, Drilling Mud Degassing, and Green Well CompletionProcessing - Glycol dehydrator and associated reboiler, Fugitive Leaks & Venting, Acid Gas Waste Sweetening UnitsGathering Stations (all) - Glycol dehydrator and associated reboiler, Still VentsTransmission - Glycol dehydrator and associated reboiler, Fugitive Leaks & Venting
0
20
40
60
80
100
120
140
Truc
k Tr
ips (
100
mile
s)
Truc
k Id
ling
Horiz
onta
l Dril
ling
Drill
ing
Mud
Deg
assin
g
Hydr
aulic
Fra
ctur
ing
Blow
dow
n ve
nting
Prod
uced
Wat
er ta
nks
Wel
lhea
d Co
mpr
esso
r Eng
ines
Glyc
ol d
ehyd
rato
r & re
boile
r
Pneu
mati
c Co
ntro
llers
Heat
ers
Fugi
tive
leak
em
issio
ns
Com
pres
sor E
ngin
es
Vent
s
Com
pres
sor E
ngin
es
Com
pres
sor E
ngin
es
Still
Vent
w/F
lare
Development Production Processing Gathering(all)
Transmission
VOC
Emiss
ions
(tpy
)
Table 5 provides a summary of annual and daily emissions estimates for HAP. The emissions of formaldehyde and benzene are estimated to increase the most at 0.00 and 0.079 tpd respectively. The emissions of acetaldehyde and xylene are estimated to increase by 0.024 tpd each. The increase in the HAP emissions occur predominantly during the processing and gathering/transmissions phases.
Table 5. Summary of Key Hazardous Air Pollutant Emissions for Shale Gas Activities
321 Market centers provide interconnections to other pipelines and provide short-term receipt/delivery balancing needs as well as other services that assist with gas transportation. They also provide some buyer/seller matching services and limited gas trading. (Natural Gas Market Centers: A 2008 Update, EIA, 2009)
Following this report are four appendices which further explain the emission calculations, references and uncertainties for the development, production, processing and transmission phases of shale gas extraction.
331 Market centers provide interconnections to other pipelines and provide short-term receipt/delivery balancing needs as well as other services that assist with gas transportation. They also provide some buyer/seller matching services and limited gas trading. (Natural Gas Market Centers: A 2008 Update, EIA, 2009)

6 References
1. North Carolina Oil and Gas Study under Session Law 2011-276, Prepared by the North Carolina Department of Environment and Natural Resources and the North Carolina Department of Commerce, April 30, 2012.
2. Modern Shale Gas Development in the United States: A Primer, Prepared for U.S. Department of Energy Office of Fossil Energy and National Energy Technology Laboratory, Prepared by Ground Water Protection Council, Oklahoma City, OK and ALL Consulting, Tulsa, OK, April 2009
3. Basic Information: Emissions from the Oil & Natural Gas Industry, US EPA, http://www.epa.gov/airquality/oilandgas/basic.html
4. “Report to Congress on Hydrogen Sulfide Air Emissions Associated with the Extraction of Oil and Natural Gas”, EPA-453/R-93-045, US EPA, Office of Air Quality Standards and Planning, October 1993.
5. Greenhouse Gas Reporting Program: 2011 Data Sets, US EPA, February 17, 2013, http://www.epa.gov/ghgreporting/ghgdata/2011data.html.
6. “Overview of Natural Gas; Background Section". http://www.naturalgas.org/overview/overview.asp, Retrieved March 20, 2013.
7. “Natural Gas Potential of the Sanford Sub-basin, Deep River Basin, North Carolina”, Jeffrey C. Reid, Kenneth B. Taylor, Paul E. Olsen, and O. F. Patterson, III, Search and Discovery Article #10366 (2011) Posted October 24, 2011. http://www.searchanddiscovery.com/documents/2011/10366reid/ndx_reid.pdf
8. AP-42, Fifth Edition, Compilation of Air Pollutant Emissions Factors, Volume 1: Stationary Point and Area Sources, http://www.epa.gov/ttn/chief/ap42/index.html.
9. 2011 Nonpoint Oil and Gas Emission Estimation Tool, U.S. EPA, updated November 21, 2014.
10. “EPA Needs to Improve Air Emissions Data for the Oil and Natural Gas Production Sector”, Report No. 13-P-0161, US EPA, Office of the Inspector General, February 20, 2013.
11. U.S. Environmental Protection Agency. Oil and Natural Gas Sector: Reconsideration of Certain Provisions of New Source Performance Standards; Final Rule. September 23, 2013. Docket ID No. EPA–HQ–OAR–2010–0505.
12. “Supplemental Generic Environmental Impact Statement on the Oil, Gas and Solution Mining Regulatory Program: Well Permit Issuance for Horizontal Drilling and High-Volume Hydraulic Fracturing to Develop the Marcellus Shale and Other Low-Permeability Gas Reservoirs”, Revised Draft, Prepared By: New York State Department of Environmental Conservation with Assistance from Alpha Environmental, Inc., Ecology and Environment Engineering, P.C., ICF International, URS Corp, NTC Consultants and Sammons/Dutton LLC, September 7, 2011. http://www.dec.ny.gov/energy/75370.html
13. “OSHA/NIOS Hazard Alert: Worker Exposure to Silica during Hydraulic Fracturing”, DTSEM 6/2012, https://www.osha.gov/dts/hazardalerts/hydraulic_frac_hazard_alert.pdf
341 Market centers provide interconnections to other pipelines and provide short-term receipt/delivery balancing needs as well as other services that assist with gas transportation. They also provide some buyer/seller matching services and limited gas trading. (Natural Gas Market Centers: A 2008 Update, EIA, 2009)

14. EC/R Incorporated. 2011. Memorandum to Bruce Moore, EPA/OAQPS/SPPD from Heather Brown, EC/R Incorporated. Composition of Natural Gas for use in Oil and Natural Gas Sector Rulemaking. July 28, 2011.
351 Market centers provide interconnections to other pipelines and provide short-term receipt/delivery balancing needs as well as other services that assist with gas transportation. They also provide some buyer/seller matching services and limited gas trading. (Natural Gas Market Centers: A 2008 Update, EIA, 2009)