Embed Size (px)
Citation preview

1
Vibrant Colors of Growth
ANNUAL REPORT AND CONSOLIDATED FINANCIAL STATEMENTS | 2016

I&M Holdings Limited Annual Report and Financial Statements | 2016
2
Table of ContentsBoard of Directors 2 - 3
Directors’ Officials and Administration 4 - 5
I&M News 6 -17
Chairman’s Statement 20 - 24
Report of the Directors 26 - 27
Statement on Corporate Governance 28 - 35
Statement of Directors’ Responsibilities 36
Director’s Remuneration Report 37
Report of Independent Auditors to the Members of I&M Holdings Limited 38 - 42
Statement of Profit or Loss and Other Comprehensive Income 44 - 45
Statement of Financial Position 46
Consolidated Statement of Changes in Equity 47 - 48
Company Statement of Changes in Equity 49
Consolidated Statement of Cash Flows 50
Notes to the Consolidated Financial Statements 51 - 114
CSR News 116 - 122
Notice of the Annual General Meeting 123
Proxy Form 124
East African people have a long history of producing intricate textiles from bark in the earlier ages to the introduction of looms and printing in modern times. Today, East Africa continues to emphasize the use of natural fibres - such as cotton, wool, palm, jute, flax, and silk for weaving. The use of woven colorful yarns, textured fabrics, applique designs, embroidery, tie-dye, batik and resist dyeing result in vibrant designs and textures.
They make each fabric a canvas for communities and cultures to express themselves - from Khanga, Kitenge, Kikoi to Kente designs that are popular in Kenya, Tanzania, Uganda and Rwanda. As we grow in Sub-Saharan Africa, we are discovering the richness in the culture of our people.
The vibrancy and energy of these colours reflect, in many ways, the spirit that has driven the growth of I&M Bank in the last many years. Join us in a celebration of our growth as is reflected in the colours of these varied and vibrant fabrics.

V i b r a n t C o l o r s o f G r o w t h V i b r a n t C o l o r s o f G r o w t h
I&M Holdings Limited Annual Report and Financial Statements | 2016 I&M Holdings Limited Annual Report and Financial Statements | 2016
2 3BOARD OF DIRECTORS BOARD OF DIRECTORS
FROM RIGHT : STANDING: Virginia Ndunge - Company Secretary | Daniel Ndonye - Chairman
SEATED: Sarit S Raja Shah | Sachit S Raja Shah
FROM LEFT:STANDING: Michael Turner | Oliver Fowler SEATED: SBR Shah | Nyambura Koigi

V i b r a n t C o l o r s o f G r o w t h V i b r a n t C o l o r s o f G r o w t h
I&M Holdings Limited Annual Report and Financial Statements | 2016 I&M Holdings Limited Annual Report and Financial Statements | 2016
4 5DIRECTORS OFFICIALS AND ADMINISTRATION
BOARD OF DIRECTORS
Daniel Ndonye Chairman S B R Shah, MBS Sarit S Raja Shah Michael Turner** Sachit S. Raja Shah Oliver Fowler Nyambura KoigiDamien Braud* Resigned on 30 September 2016
* French ** British
COMPANY SECRETARY
Virginia Ndunge (CPS Kenya)Kaplan & StrattonWilliamson House, 4th Ngong AvenuePO Box 40111, 00100 GPO Nairobi
AUDITORS
KPMG Kenya Certified Public Accountants8th Floor, ABC TowersWaiyaki WayPO Box 4062100100 Nairobi GPO REGISTERED OFFICE I&M Bank House2nd Ngong AvenuePO Box 30238, 00100 GPONairobi
BANKERS I&M Bank LimitedPO Box 30238, 00100 GPONairobi
LEGAL ADVISORS Kaplan & StrattonWilliamson House4th Ngong AvenuePO Box 40111, 00100 GPONairobi
DIRECTORS OFFICIALS AND ADMINISTRATION (CONTINUED)
BANKING ENTITIES REGISTERED OFFICES
I&M BANK LIMITED
I&M Bank House2nd Ngong AvenuePO Box 30238- 00100 GPONairobiKenya
I&M BANK (T) LIMITED
Maktaba SquareMaktaba StreetPO Box 1509Dar es SalaamTanzania
I&M BANK (RWANDA) LIMITED
11, Boulevard de la RevolutionPO BOX 354KigaliRwanda
BANK ONE LIMITED
16 Sir William Newton StreetPort LouisMauritius

V i b r a n t C o l o r s o f G r o w t h V i b r a n t C o l o r s o f G r o w t h
I&M Holdings Limited Annual Report and Financial Statements | 2016 I&M Holdings Limited Annual Report and Financial Statements | 2016
6 7
I&M NEWS I&M KENYA NEWS
I&M BANK INTRODUCES IMARA STRATEGY2016 certainly goes down as one of the most challenging years in the history of the Kenyan banking community. The change in legislation that saw the introduction of interest rate caps and impact of deposits flight from smaller banks to bigger players has greatly undermined the overall industry stability. Our interpretation of the legislative challenge is that the people of Kenya are desirous of a much meaningful relationship with their bankers.
The significant legislative changes did coincide with the completion of our previous five year strategic cycle. The new strategy aptly dubbed iMara strategy aims at reorganizing the bank to accelerate its growth trajectory by focusing on 3 key strategic themes.
The themes include: • Growing our corporate banking offering through
transaction banking, Relationship Management sales effectiveness and a new coverage model;
• Delivering a distinctive value proposition to Affluent, Personal (middle income & Young Professionals) and Business Banking clients to set ourselves apart; • Digitizing the business through automation process
which will cover re-engineering supported by automation, improved use of online and mobile channels to drive sales, using data analytics to make better informed decisions, as well as fostering an innovation culture amongst staff members.
Overall, we did reaffirm our unwavering commitment to continue delivering consistent growth and be partners of growth for all stakeholders. We envision that the iMara strategy will help build a stronger brand presence in the region within the bank’s target segments.
T R A N S F O R M I N G T O M O R R O W
STRATEGIC ALLIANCE WITH CDC GROUP PLC Following receipt of all relevant regulatory approvals, DEG and Proparco on one hand and CDC on the other successfully met the requirements of the Sale and Purchase Agreement wherein CDC acquired their combined shareholding of approximately 10.68% in I&M Holdings Limited (IMHL).
Proparco and DEG had, since 2007 held a significant minority in IMHL. The UK based CDC’s investment in IMHL is strategic for the I&M Group, as it allows us to continue to draw upon the Development Finance Institution (DFI)’s support previously provided by DEG and Proparco for strategic, financial and governance matters.
Further, CDC’s commitment to building long-term partnerships and its expertise in financial services will help I&M Group in continuing its regional growth and consolidation strategy, so as to expand its banking services across East Africa and beyond.
BURBIDGE CAPITAL ACQUISITION BY I&M HOLDINGSIn 2016, I&M Holdings completed the acquisition of 65% of shareholding in Burbidge Capital Limited (BCL). Following this completion, Burbidge Capital rebranded to I&M Burbidge Capital helping the firm to leverage on I&M Bank’s track record in its bid to offer advisory and capital raising services to mid and large sized companies across Eastern Africa.
The successful acquisition together with the set-up of the I&M Insurance Agency in 2014 marks the attainment of the long-term ambition of being a financial supermarket, positioning the group as a one-stop-shop for all customers’ financial needs.
I&M HOLDINGS LIMITED COMPLETES ACQUISITION OF GIRO COMMERCIAL BANK LIMITEDI&M Holdings Ltd (IMHL) successfully completed its merger of Giro Commercial Bank Limited (GCBL) into I&M Bank Limited, which is IMHL’s flagship subsidiary. The merger came to fruition in February 2017 after receiving necessary regulatory approvals from the Capital Markets Authority (CMA), Central Bank of Kenya, the Competition Authority of Kenya as well as IMHL shareholders.
IMHL and GCBL entered into a share purchase agreement in September 2015 for IMHL to acquire 100% of the issued share capital in GCBL, and for the subsequent merger of GCBL’s banking assets and liabilities with that of I&M Bank LIMITED.
The move underscored the I&M Group’s expansion strategy, which seeks for opportunities to expand both locally and regionally by way of acquisitions. For GCBL customers, this acquisition provides additional advantage of accessing their bank accounts from 36 new I&M Bank branches located countrywide, in addition to Alternate Channels like all Visa, Kenswitch and I&M Bank ATMs, Mobile Banking, Internet Banking and PesaLink.
It will also enable them to enjoy the range of I&M Bank’s credit, debit and pre-paid Visa and MasterCard payment cards. Corporate customers of GCBL are also now able to enjoy I&M Cash Management Services, Trade Services as well as corporate I-Click internet banking suite.
I&M NEWS (Continued) I&M KENYA NEWS (Continued)
I&M BANK FETED AT BANKER AFRICA AWARDS In 2016, I&M Bank was awarded the Corporate Governance award at the 3rd Banker Africa East African Banking Awards. The bank, which has been undertaking a strategic and corporate transformation programme, was named the best East African bank in the Corporate Governance category for its role in maintaining sound practices.
The annual Banker Africa Awards are continent-wide programmes open to all banks and financial institutions in Africa. The aim of the Banker Africa Awards, broken down by four individual regions, is to recognize outstanding performance and excellence in the financial services industry. I&M Bank’s Corporate Governance framework mirrors IMHL’s policy on corporate governance. The Group’s corporate governance framework, takes into consideration the Capital Markets Authority (CMA) Guidelines on Corporate Governance, as well as global best practices.
Meanwhile, the bank was also awarded the 1st Runner Up in the Best Bank in Kenya Tier II category for the Think Business Banking Awards 2016. The Awards recognize different banks for their exemplary performance and their objective is to encourage prudence and stability in the banking sector.
I&M BANK NOW IN NANYUKI, MERU AND DOWNTOWN NAIROBI, AS CUSTOMER DELIVERY DRIVE GETS INTO HIGH GEARAs part of its strategic effort to enhance its customer delivery capacity and experience, I&M Bank Kenya opened a branch at Cross Road Nairobi and in Nanyuki town in 2016, and one branch in Meru town in early 2017.
The move aimed at tapping into the fast growing agricultural towns of Nanyuki and Meru, as well as targeting the SME entrepreneurs operating in downtown Nairobi including River Road, Kirinyaga Road and its environs. The bank now has a branch network of 41 branches including 5 other additional Giro Bank branches.
V i b r a n t C o l o r s o f G r o w t h V i b r a n t C o l o r s o f G r o w t h
I&M Holdings Limited Annual Report and Financial Statements | 2016 I&M Holdings Limited Annual Report and Financial Statements | 2016
8 9
I&M NEWS (Continued) I&M KENYA NEWS (Continued)
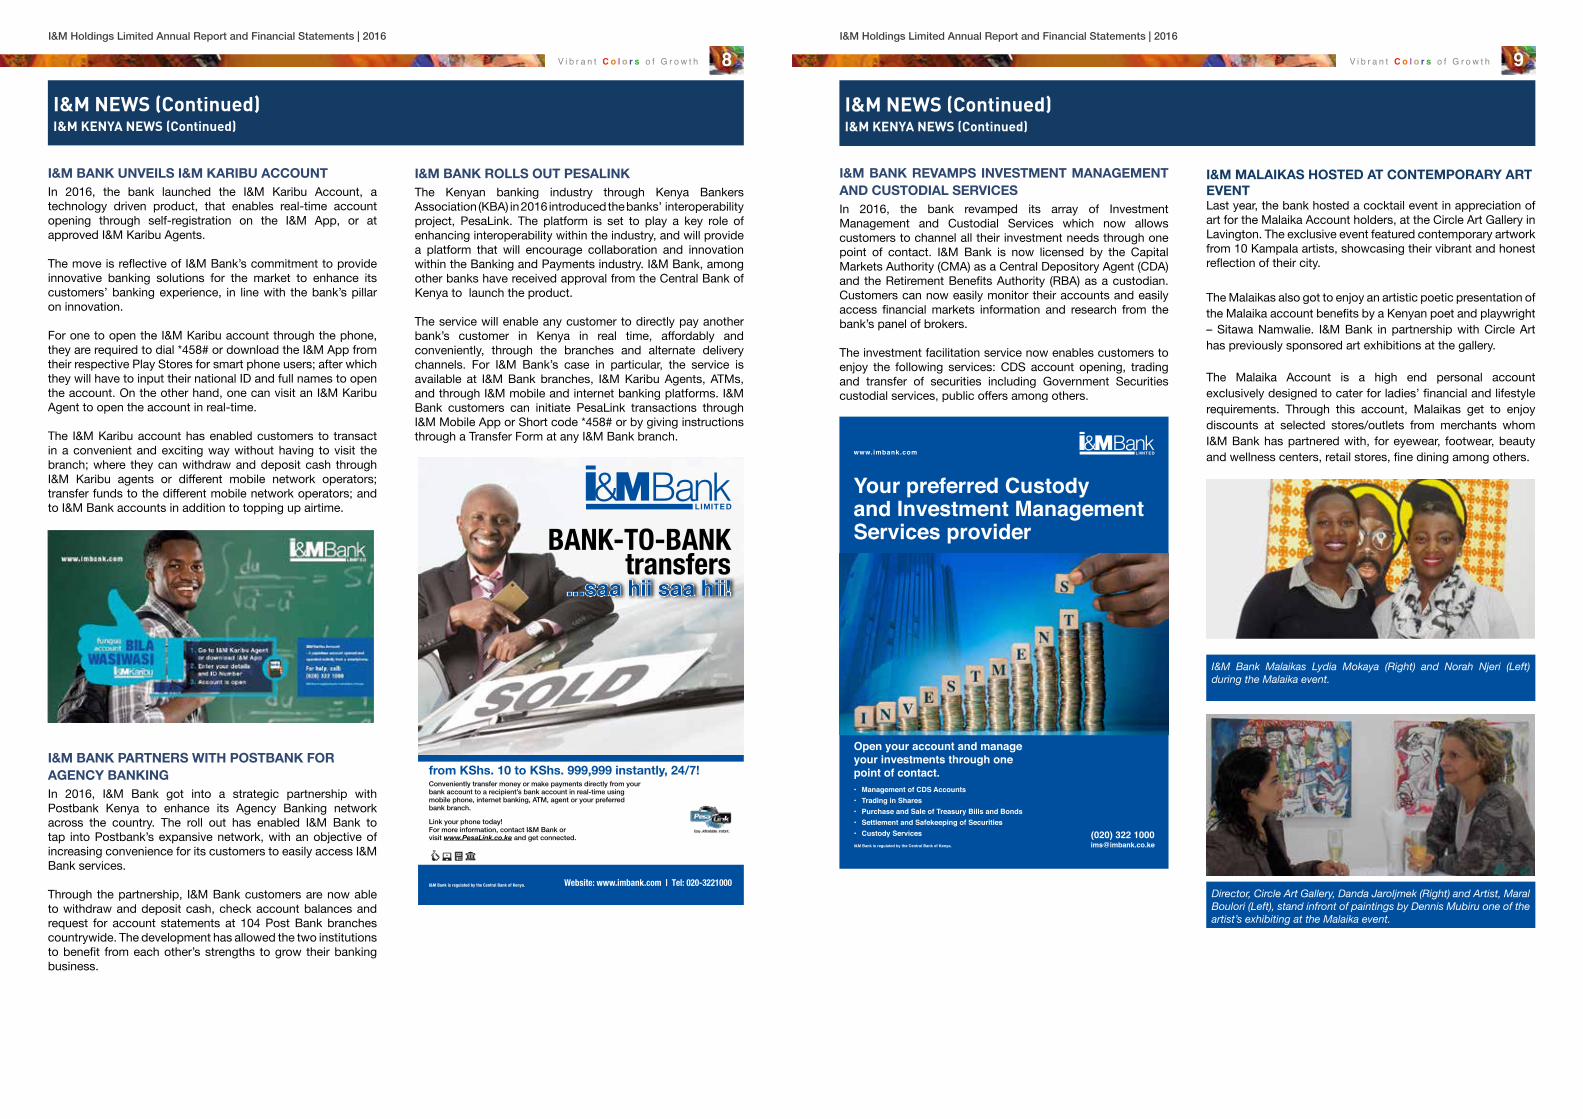
I&M BANK UNVEILS I&M KARIBU ACCOUNTIn 2016, the bank launched the I&M Karibu Account, a technology driven product, that enables real-time account opening through self-registration on the I&M App, or at approved I&M Karibu Agents.
The move is reflective of I&M Bank’s commitment to provide innovative banking solutions for the market to enhance its customers’ banking experience, in line with the bank’s pillar on innovation.
For one to open the I&M Karibu account through the phone, they are required to dial *458# or download the I&M App from their respective Play Stores for smart phone users; after which they will have to input their national ID and full names to open the account. On the other hand, one can visit an I&M Karibu Agent to open the account in real-time.
The I&M Karibu account has enabled customers to transact in a convenient and exciting way without having to visit the branch; where they can withdraw and deposit cash through I&M Karibu agents or different mobile network operators; transfer funds to the different mobile network operators; and to I&M Bank accounts in addition to topping up airtime.
I&M BANK PARTNERS WITH POSTBANK FOR AGENCY BANKINGIn 2016, I&M Bank got into a strategic partnership with Postbank Kenya to enhance its Agency Banking network across the country. The roll out has enabled I&M Bank to tap into Postbank’s expansive network, with an objective of increasing convenience for its customers to easily access I&M Bank services.
Through the partnership, I&M Bank customers are now able to withdraw and deposit cash, check account balances and request for account statements at 104 Post Bank branches countrywide. The development has allowed the two institutions to benefit from each other’s strengths to grow their banking business.
I&M BANK ROLLS OUT PESALINKThe Kenyan banking industry through Kenya Bankers Association (KBA) in 2016 introduced the banks’ interoperability project, PesaLink. The platform is set to play a key role of enhancing interoperability within the industry, and will provide a platform that will encourage collaboration and innovation within the Banking and Payments industry. I&M Bank, among other banks have received approval from the Central Bank of Kenya to launch the product.
The service will enable any customer to directly pay another bank’s customer in Kenya in real time, affordably and conveniently, through the branches and alternate delivery channels. For I&M Bank’s case in particular, the service is available at I&M Bank branches, I&M Karibu Agents, ATMs, and through I&M mobile and internet banking platforms. I&M Bank customers can initiate PesaLink transactions through I&M Mobile App or Short code *458# or by giving instructions through a Transfer Form at any I&M Bank branch.
...saa hii saa hii!
I&M NEWS (Continued) I&M KENYA NEWS (Continued)
I&M BANK REVAMPS INVESTMENT MANAGEMENT AND CUSTODIAL SERVICESIn 2016, the bank revamped its array of Investment Management and Custodial Services which now allows customers to channel all their investment needs through one point of contact. I&M Bank is now licensed by the Capital Markets Authority (CMA) as a Central Depository Agent (CDA) and the Retirement Benefits Authority (RBA) as a custodian. Customers can now easily monitor their accounts and easily access financial markets information and research from the bank’s panel of brokers.
The investment facilitation service now enables customers to enjoy the following services: CDS account opening, trading and transfer of securities including Government Securities custodial services, public offers among others.
www.imbank.com
Your preferred Custodyand Investment Management Services provider
Open your account and manage your investments through one point of contact.• Management of CDS Accounts• Trading in Shares• Purchase and Sale of Treasury Bills and Bonds• Settlement and Safekeeping of Securities• Custody ServicesI&M Bank is regulated by the Central Bank of Kenya.
(020) 322 [email protected]
I&M MALAIKAS HOSTED AT CONTEMPORARY ART EVENTLast year, the bank hosted a cocktail event in appreciation of art for the Malaika Account holders, at the Circle Art Gallery in Lavington. The exclusive event featured contemporary artwork from 10 Kampala artists, showcasing their vibrant and honest reflection of their city.
The Malaikas also got to enjoy an artistic poetic presentation of the Malaika account benefits by a Kenyan poet and playwright – Sitawa Namwalie. I&M Bank in partnership with Circle Art has previously sponsored art exhibitions at the gallery.
The Malaika Account is a high end personal account exclusively designed to cater for ladies’ financial and lifestyle requirements. Through this account, Malaikas get to enjoy discounts at selected stores/outlets from merchants whom I&M Bank has partnered with, for eyewear, footwear, beauty and wellness centers, retail stores, fine dining among others.
I&M Bank Malaikas Lydia Mokaya (Right) and Norah Njeri (Left) during the Malaika event.
Director, Circle Art Gallery, Danda Jaroljmek (Right) and Artist, Maral Boulori (Left), stand infront of paintings by Dennis Mubiru one of the artist’s exhibiting at the Malaika event.

V i b r a n t C o l o r s o f G r o w t h V i b r a n t C o l o r s o f G r o w t h
I&M Holdings Limited Annual Report and Financial Statements | 2016 I&M Holdings Limited Annual Report and Financial Statements | 2016
10 11
I&M NEWS (Continued) I&M KENYA NEWS (Continued)
I&M BANK CUSTOMERS HOSTED FOR ANNUAL GOLF DAYI&M Bank held its second annual golf day for its customers at the Muthaiga golf club in November 2016. The event was very successful with close to 200 customers in attendance.
The golfers got the opportunity to experience the Trackman swing analysis, offered to players to help them learn how to improve their golf swing. Going forward, the bank will host regional golf tournaments for its customers at major towns in the country.
A customer tees off during the golf day.
Dilip Shah, the overall winner at the golf day is presented with his prize by I&M Bank Kenya CEO, Kihara Maina.
BUSINESS IN THE DIGITAL WORLD SEMINARIn 2016, the bank held a conference in partnership with Deloitte Digital Africa, for Corporate and Select customers themed - Your Business in the Digital World, at the Safari Park hotel. The event aimed at enlightening customers on the importance of adopting digital strategies for their businesses to ensure sustained growth.
Moderated by Valter Adao, the head of Deloitte Digital Africa, customers got the opportunity to learn from different eye-opening digital innovations being undertaken by businesses across the globe, and also learnt how to adopt digital strategies for their businesses for enhanced business growth.
A section of customers at the seminar.
Valter Adao, Head of Deloitte Digital Africa, the key note speaker moderates the session during the seminar.
I&M NEWS (Continued) BANK ONE NEWS
BANK ONE MAURITIUS REBRANDS BRANCH NETWORKIn February 2016, Bank One Mauritius embarked on a rebranding exercise for its branch network. The initiative aimed at creating a fresh and modern outlook of the different branches.
KESTREL VISA PRE-PAID CARD LAUNCHBank One launched the new Kestrel VISA prepaid card in July 2016. The card which comes with a zero loading fee, was launched with an objective of jointly supporting the Kestrel Conservation Project, in conjunction with the Mauritius Wildlife Foundation. For each new Kestrel VISA prepaid card sold over a period of 3 years, 10 MUR goes towards supporting this conservation project.
The Mauritius Kestrel Falco punctatus is unique to Mauritius and is one of the only nine endemic bird species still left on the island. The species was saved in-extremis with an increase from just four birds in 1974, including a single breeding female, to a peak of about 800 individuals. It has become a world conversation icon as it is recognized as the most successful recovery program in the world for any animal species.
During the year, I&M Bank hosted over 200 Young Savers Account holders accompanied by their parents to a Jungle Book musical, where they got to enjoy a theatric performance depicting the highly acclaimed Jungle Book movie.
The bank believes in the enormous potential of the Arts industry which is critical to national development. In this regard, the bank in its endeavor to support the Arts industry, nurtures creative talent amongst the Young Savers by giving them opportunities to display their talent through art. The Jungle Book musical held last year was aimed at inculcating a creative culture amongst the Young Savers.
The Jungle Book Musical performance.
I&M BANK HOSTS YOUNG SAVERS FOR JUNGLE BOOK MUSICAL

V i b r a n t C o l o r s o f G r o w t h V i b r a n t C o l o r s o f G r o w t h
I&M Holdings Limited Annual Report and Financial Statements | 2016 I&M Holdings Limited Annual Report and Financial Statements | 2016
12 13
I&M NEWS (Continued) BANK ONE NEWS (Continued)
BANK ONE SPONSORS MAURITIUS GOLF MASTERS TOURNAMENTBank One in association with Ciel Group and BNI Madagascar continued to support the Mauritius Golf Masters for the second year running. The tournament attracted over 30 international golf players and is one of the most prestigious golf events in the country.
A golfer tees off during the tournament.
Top golfers of the tournament pose with their awards.
MAIN BRANCH RE-OPENINGNearly three decades after it was first built at Sir William Newton Street; Bank One’s flagship branch went through a major refurbishment in 2016. The concept behind the refurbishment aims at reflecting Bank One’s evolution, vision and goals for the future.
Some of the directors pose for a photo during the re-opening ceremony.
The re-opened branch.
BANK ONE LAUNCHES HONEY HOME LOAN CAMPAIGNBank One launched a promotional campaign for Home Loans that ran from July 29th 2016 to December 31st 2016. The campaign was designed to reinforce Bank One’s market position in the mortgage space with a bid to grow its market share.
I&M NEWS (Continued) BANK ONE NEWS (Continued)
V i b r a n t C o l o r s o f G r o w t h V i b r a n t C o l o r s o f G r o w t h
I&M Holdings Limited Annual Report and Financial Statements | 2016 I&M Holdings Limited Annual Report and Financial Statements | 2016
14 15
I&M NEWS (Continued) I&M RWANDA NEWS
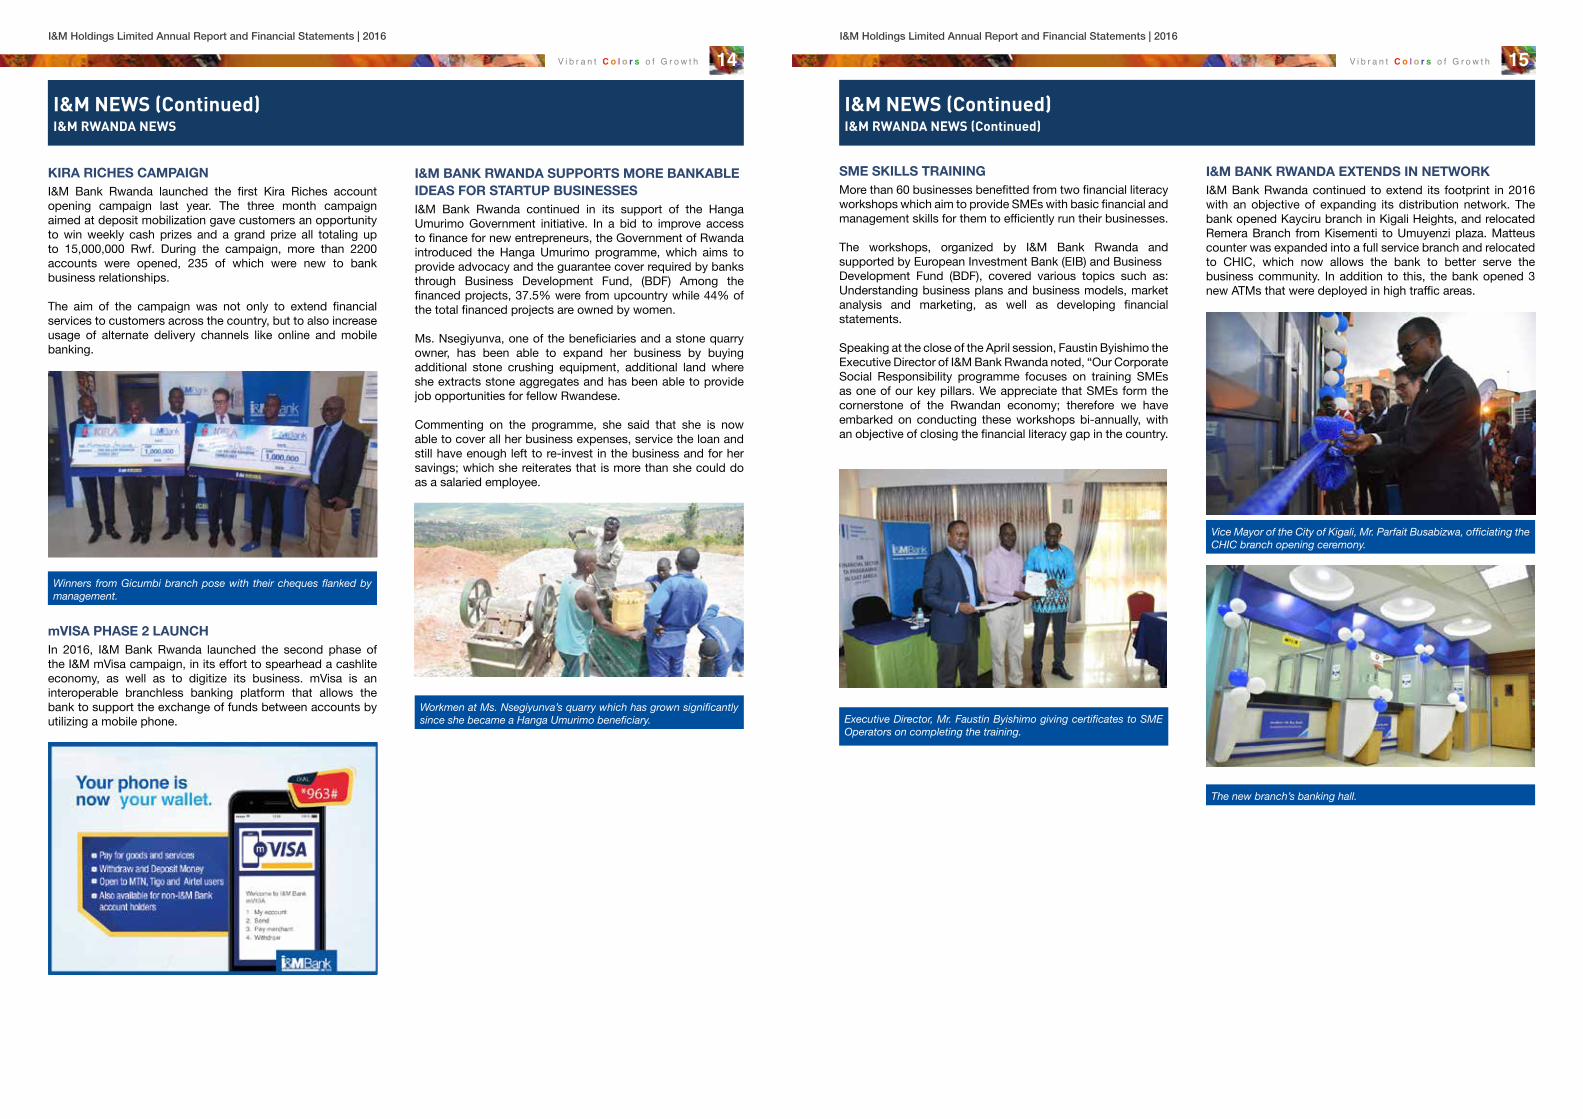
KIRA RICHES CAMPAIGNI&M Bank Rwanda launched the first Kira Riches account opening campaign last year. The three month campaign aimed at deposit mobilization gave customers an opportunity to win weekly cash prizes and a grand prize all totaling up to 15,000,000 Rwf. During the campaign, more than 2200 accounts were opened, 235 of which were new to bank business relationships.
The aim of the campaign was not only to extend financial services to customers across the country, but to also increase usage of alternate delivery channels like online and mobile banking.
Winners from Gicumbi branch pose with their cheques flanked by management.
I&M BANK RWANDA SUPPORTS MORE BANKABLE IDEAS FOR STARTUP BUSINESSESI&M Bank Rwanda continued in its support of the Hanga Umurimo Government initiative. In a bid to improve access to finance for new entrepreneurs, the Government of Rwanda introduced the Hanga Umurimo programme, which aims to provide advocacy and the guarantee cover required by banks through Business Development Fund, (BDF) Among the financed projects, 37.5% were from upcountry while 44% of the total financed projects are owned by women.
Ms. Nsegiyunva, one of the beneficiaries and a stone quarry owner, has been able to expand her business by buying additional stone crushing equipment, additional land where she extracts stone aggregates and has been able to provide job opportunities for fellow Rwandese.
Commenting on the programme, she said that she is now able to cover all her business expenses, service the loan and still have enough left to re-invest in the business and for her savings; which she reiterates that is more than she could do as a salaried employee.
Workmen at Ms. Nsegiyunva’s quarry which has grown significantly since she became a Hanga Umurimo beneficiary.
mVISA PHASE 2 LAUNCHIn 2016, I&M Bank Rwanda launched the second phase of the I&M mVisa campaign, in its effort to spearhead a cashlite economy, as well as to digitize its business. mVisa is an interoperable branchless banking platform that allows the bank to support the exchange of funds between accounts by utilizing a mobile phone.
I&M NEWS (Continued) I&M RWANDA NEWS (Continued)
SME SKILLS TRAININGMore than 60 businesses benefitted from two financial literacy workshops which aim to provide SMEs with basic financial and management skills for them to efficiently run their businesses.
The workshops, organized by I&M Bank Rwanda and supported by European Investment Bank (EIB) and Business Development Fund (BDF), covered various topics such as: Understanding business plans and business models, market analysis and marketing, as well as developing financial statements.
Speaking at the close of the April session, Faustin Byishimo the Executive Director of I&M Bank Rwanda noted, “Our Corporate Social Responsibility programme focuses on training SMEs as one of our key pillars. We appreciate that SMEs form the cornerstone of the Rwandan economy; therefore we have embarked on conducting these workshops bi-annually, with an objective of closing the financial literacy gap in the country.
Executive Director, Mr. Faustin Byishimo giving certificates to SME Operators on completing the training.
I&M BANK RWANDA EXTENDS IN NETWORKI&M Bank Rwanda continued to extend its footprint in 2016 with an objective of expanding its distribution network. The bank opened Kayciru branch in Kigali Heights, and relocated Remera Branch from Kisementi to Umuyenzi plaza. Matteus counter was expanded into a full service branch and relocated to CHIC, which now allows the bank to better serve the business community. In addition to this, the bank opened 3 new ATMs that were deployed in high traffic areas.
Vice Mayor of the City of Kigali, Mr. Parfait Busabizwa, officiating the CHIC branch opening ceremony.
The new branch’s banking hall.

V i b r a n t C o l o r s o f G r o w t h V i b r a n t C o l o r s o f G r o w t h
I&M Holdings Limited Annual Report and Financial Statements | 2016 I&M Holdings Limited Annual Report and Financial Statements | 2016
16 17
I&M NEWS (Continued) I&M TANZANIA NEWS
CORPORATE GOVERNANCEBenchmarking on our high standards of Corporate Governance I&M Bank (T) Ltd strengthened the Board with the inclusion of two Independent Directors from Tanzania.
Mr. Alan Rodrick Mchaki and Ambassador Bertha Semu-Somi joined the Board during the year and bring a wealth of experience from diverse fields. Mr. Mchaki is a fellow member of Association of Chartered Certified Accountants of UK and Certified Public Accountant in Tanzania.
He carries over 30 years of working experience covering public practice in two major accountancy firms and exposure in various industries like oil, marketing television, health service and mutual fund management, where he held the directorship roles in Finance. Ambassador Bertha Ernestine Semu-Somi serves as an Executive Director of a Charity organization, Hassan Major Trust. She brings in vast experience, knowledge and network both in the Tanzanian Government and International organizations such as the United Nations.
INCREASE IN CAPITALIn the 2nd half of 2016, I&M Bank Ltd Kenya increased its shareholding of I&M Bank (T) Ltd with the purchase of 350 shares from PROPARCO, following the completion of Proparco’s investment tenor.
Thereafter, to be ahead of the revised regulations on the Capital adequacy ratios coming into place with effect from August 2017, I&M Bank (T) Ltd raised additional capital of TZS 10.91 billion through a rights issue, which was fully subscribed by the Shareholders. This has helped in improving the Tier I Capital ratio during the year to 13.90% from 11.22% in the year 2015.
The above developments led to I&M Bank Ltd Kenya increasing its shareholding in I&M Bank (T) Ltd from 55.03% to 70.38%.
I&M BANK (T) LTD LAUNCHES I&M MOBILEI&M Bank (T) Ltd launched in 2016 its Mobile Banking product with an objective of enhancing customer experience while transacting on their bank accounts. The service was launched on a USSD code platform (*150*32#).
I&M Bank customers can access various services like enquiries, funds transfer, mobile money, airtime top-up, utility payments, stop cheque and offline requests. The bank also plans to roll out an I&M App in future.
I&M BANK (T) LIMITED PARTNERS WITH TATA AFRICA HOLDING (T) LIMITED ON ASSET FINANCEIn 2016, the bank signed an agreement with TATA Africa Holding (T) Limited to provide Asset Financing for commercial vehicles and equipment in Tanzania. This agreement was signed in the presence of Mr. Noel Tata, Managing Director, TATA International and Mr. Baseer Mohammed, CEO of I&M Bank (T) Limited. Commenting on the partnership, the bank’s CEO noted that the alliance was valuable for the bank, and that we would work towards strengthening this relationship.
I&M BANK (T) LIMITED LAUNCHES BULK SALARY PAYMENTS ON MOBILE BANKINGIn 2016, the bank launched bulk salary payments on its mobile banking platform to better serve business customers. The Mobile banking platform enables the Customers to make bulk payments such as salaries and wages seamlessly from their bank accounts to the Mobile Wallets (MPESA) of the beneficiaries.
I&M BANK (T) LIMITED LAUNCHES CASH IN TRANSIT SERVICES FOR CORPORATE CUSTOMERSDuring the year, the bank launched the I&M Cash In Transit services to facilitate cash handling services for its large corporate customers. Under these services the bank will collect cash direct from the customers’ outlets and deposit into their accounts, thereby eliminating the risk of cash movement for customers.
CUSTOMER SERVICE WEEK – BRANCH WISEIn 2016, I&M Bank (T) Limited set aside various customer appreciation weeks to celebrate love for their customers. The events took place across the branches and involved various themed activities such as: customer visits, personalized thank you notes signed by the CEO, refreshments for customers at the branches, exciting décor at the branches among other activities. The bank’s customers in turn displayed their gratitude and shared feedback on great customer service that they experienced at the bank.
I&M branded cupcakes sent out to all customers as a token of appreciation.
I&M NEWS (Continued) I&M TANZANIA NEWS (Continued)
I&M Bank (T) Limited hosted a customer cocktail in May last year at the Hyatt Regency Hotel. The event was a huge success attracting customers, entrepreneurs and businessmen from diverse segments. Dignitaries included Mr.Yusuf Makamba, Minister of State in the Vice President’s Office for Union Affairs and Environment also graced the occasion amongst others.
The Chairman of the bank, Mr. Sarit S Raja Shah alongside other directors, joined this event and appreciated the customers for their valuable support and continued patronage for the bank. The bank’s CEO, Mr. Baseer Mohammed, thanked the customers for their great support and reassured them of providing banking solutions that meet the dynamic banking needs.
Hon. Mr. January Makamba (Left) with I&M Bank (T) Ltd, Director Mr. Michael Shirima (right) and Former Director Mr. Gen Rtd. Sarakikya (Left) during the customer event.
I&M Bank (T) Ltd, Chairman, Sarit S. Raja Shah interacting with Corporate Clients along with I&M Bank (T) Ltd, CEO, Baseer Mohammed.
I&M BANK (T) LTD HOSTS CUSTOMER MEET AND GREET

V i b r a n t C o l o r s o f G r o w t h V i b r a n t C o l o r s o f G r o w t h
I&M Holdings Limited Annual Report and Financial Statements | 2016 I&M Holdings Limited Annual Report and Financial Statements | 2016
18 19
KANGAMade of slightly lesser density than the kitenge, the kanga is popularly known as ‘leso’. It is made of pure cotton, and can be worn in pairs known as ‘doti.’ Kangas are extremely popular for their multipurpose uses – by both men and women and normally have some strips of messages written on it. Most women buy kangas not just for the color but for the text to send subtle ‘messages’ to their husbands.

V i b r a n t C o l o r s o f G r o w t h V i b r a n t C o l o r s o f G r o w t h
I&M Holdings Limited Annual Report and Financial Statements | 2016 I&M Holdings Limited Annual Report and Financial Statements | 2016
20 21CHAIRMAN’S STATEMENT
The year 2016 was characterized by uneven global economic growth. The year commenced with an anticipated sluggish growth coupled with the unexpected outcomes of UK referendum (BREXIT) in June followed by the results of the November US presidential elections. These unexpected outcomes resulted in uncertainty and high volatility in the markets. The US Dollar has been on a bullish run against all major currencies following the much anticipated interest rates hike by 25bps and adjusted at the December, 2016 Fed meeting to between 0.50% - 0.75%, from 0.25% - 0.50% supported by a stable economic growth, the strengthening of the labor market, and rising inflation. To the contrary, the Eurozone suffered major shocks following the geo-political event in UK that voted to leave the Eurozone. The UK exit though to be procedurally effected in 2017, is expected to cause a decline in intra-regional trade, lead to uncertainty over jobs in the UK, and result in a decline in consumer spending.
Sub-Saharan Africa continued to register slow GDP growth with IMF forecasting economic growth to drop to its lowest level in over 2 decades to 1.4% in 2016 from 3.5% in 2015. This decline is mainly attributed to critical drought in some regions, the declining oil prices and terrorism and humanitarian crimes as well as global flight to safety following unfavorable macroeconomic environment in the region. This also resulted in the Sub-Saharan African currencies losing ground against all the major global currencies. The Kenyan economy has however been resilient and the economy has done well having grown by an estimated 5.9% in 2016. This strong growth which is nearly double the growth rate in Sub –Saharan Africa is attributed to continued macro-economic stability, lower import bill, stable agricultural performance, supportive monetary policy as well as the Government initiated investments in infrastructure projects and tourism.
The global banking industry continues to grapple with new risks resulting from a slow and uneven recovery of the world economy. For most part, banking industry in East Africa remained fairly stable but is nevertheless struggling with rising bad debts. This, coupled with interest rate caps in Kenya is seen to have an adverse impact on the Kenyan economy and the full extent of the impact will be felt in a few more months even though the Government has hinted to a review of the rate capping regulations.
The Board has taken cognizance of the recent amendment to the Banking Act in respect of interest capping and its resultant impact on the Banking industry in Kenya and more specifically on I&M Bank Limited. I&M Bank in Kenya is the Group’s flagship entity contributing approx. 75% in terms of assets and 88% in terms of revenue. The Board is of the view that notwithstanding these recent changes, fundamentals of the banking sector in East Africa in the long run remain strong. Some of the recent changes witnessed in Kenya in terms of enhanced corporate governance mechanisms, independent review of IT systems of Banks, introduction of an Internal Capital Adequacy Assessment Process (popularly known as ICAAP), an increased focus on ensuring adequate provisioning are all steps in the right direction, and will help move the Banking industry to a position of strength, compelling the Banks to reassess their strategies, innovate and digitize and thereby steering the sector to become more robust, and efficient.
GROUP STRATEGY
In the year 2016, our Group embarked on an exciting strategy review process having completed its current strategic cycle. The various developments in the operating environment also significantly defined the need to refresh the Group strategy. Our new strategy gives us the opportunity to collaborate further and not only unleash our creativity & innovation but also stand out as a customer centric organization ready for the growth articulated as the promise to the Group stakeholders.
2016 saw the Group complete the acquisition of a strategic stake of 65% in Burbidge Capital Limited and which was subsequently rebranded to I&M Burbidge Capital Limited. This entity, which is licensed as an Investment Advisor by the Capital Markets Authority and a Nominated Advisor by the Nairobi Securities Exchange now serves as the Financial Services Subsidiary of the Group. In addition, on 13th February 2017, I&M Group successfully completed the acquisition of Giro Commercial Bank Limited (Giro Bank) following receipt of the necessary regulatory approvals from the Capital Markets Authority, Central Bank of Kenya, the Competition Authority of Kenya as well as IMHL shareholders.
The move underscores I&M Group’s expansion strategy, which seeks for opportunities to expand both locally and regionally by way of acquisitions.

V i b r a n t C o l o r s o f G r o w t h V i b r a n t C o l o r s o f G r o w t h
I&M Holdings Limited Annual Report and Financial Statements | 2016 I&M Holdings Limited Annual Report and Financial Statements | 2016
22 23CHAIRMAN’S STATEMENT (Continued)
For Giro Bank customers, this merger will provide additional advantage of accessing their bank accounts from 36 new I&M Bank branches located countrywide as well as through all Alternate Channels like Visa, Kenswitch and I&M Bank ATMs, Mobile Banking, Internet Banking and PesaLink. It will also enable them to enjoy the range of I&M Bank’s credit, debit and pre-paid Visa and MasterCard payment cards.
Through this acquisition, I&M Group has also acquired net advances of approximately KShs 9.1 billion, deposits of KShs 12.6 billion and other assets of approximately KShs 6.7 billion in addition to Giro Bank’s branch network which will supplement I&M Bank Limited’s existing network of 36 branches. I&M Bank Limited will also benefit from the additional human resource capacity of Giro Bank’s employees which is expected to increase effectiveness and efficiency.
I am also pleased to welcome on board our new DFI shareholder - CDC Group Plc (a UK based Development Financial Institution). CDC acquired a significant stake in your Company from DEG and Proparco. Like most other financial institutions, DEG and Proparco reached the end of their investment horizon in I&M and as part of their exit strategy reached an agreement to sell their shareholding to CDC.
Financially, our balance sheet showed an overall growth of 10% from KShs 191.7 billion at the end of 2015 to KShs 210.5 billion as at December 2016. Profit before tax increased by 4 % from KShs 10.17 billion in 2015 to KShs 10.6 billion in 2016. Similarly, our group loan portfolio grew by 5 % while customer deposits increased by 10 %.
GROUP ENTITY PERFORMANCE
I&M Bank Limited – Kenya
The legislative environment in 2016 presented a major challenge for the banking industry. The Banking Amendment Act Bill 2015 was signed into law, geared towards regulating interest rates applicable to bank loans and deposits was effected, heralding a new dawn in the financial services industry in Kenya. Despite the impact of the interest rate capping in the 4th Quarter of 2016 and the rise in Non-performing loans, the banking industry is estimated to have recorded notable growth, in terms of balance sheet size, increased liquidity and improved capitalization, the latter two well above the minimum statutory limits.
The Bank registered a growth of 3 % in the profit before tax for the year ended 31st December 2016 which increased from KShs 8.4 billion in 2015 to stand at KShs 8.7 billion. At the same time the Bank’s loan portfolio increased by 4 % from KShs 102.2 billion in December 2015 to KShs 106.6 billion as at December 2016. Likewise, customer deposits grew by 13 % from KShs 103.7 billion to reach KShs 117.3 billion. Supported by the growth in loans and advances and customer deposits, total assets expanded by 11 % during the year to close at KShs 164.1 billion. With new branches that opened in Nanyuki and Meru towns and at Crossroad in Nairobi’s central business district, the Bank increased its branch network to 41. The Bank’s ATM network also expanded to 50 ATMS.
In June 2016, the Bank’s Board appointed Mr. Kihara Maina to serve as the Chief Executive Officer of I&M Bank Kenya. Mr. Kihara, a seasoned career banker, previously Managing Director of Barclays Bank, Tanzania, took over from Mr. Arun Mathur, who is now serving as the Associate Director, Financial Services at IMHL. I take this opportunity to thank Mr. Arun Mathur for his great stewardship and undisputed legacy over his 16 year tenure at the bank, and welcome Mr. Kihara Maina to lead us into the future through his vast wealth of experience.
I&M Bank Limited embarked on a strategy review process having completed its last strategy cycle in 2015. The process, spearheaded by a leading consultant, with the Board’s guidance, set to develop a strategy that will help it reorganize its business in order to accelerate the bank’s growth trajectory, as we continue to deliver value for all our stakeholders.
The new strategy and its various elements went through approval by the Board and has been aptly dubbed the “iMara strategy”. “iMara” is a Swahili word meaning stability/strength therefore displaying the Bank’s strong and stable foundation and portrays the key facets that the strategy is expected to continue to enhance.
CHAIRMAN’S STATEMENT (Continued)
Bank One Limited, Mauritius
The Bank has managed to grow faster than the industry and position itself strongly for the future to acquire additional market share even though it continues to face multiple challenges in the prevailing global economic settings having witnessed political disruptions across the world, which creates both uncertainty and opportunity. Apart from that, the African market, being the Bank’s main area of focus, is expected to stay challenging with lower growth momentum and general weak sentiment. Even then in all these developments, opportunities are available to be explored and the Bank as always will capitalize on these opportunities to continue the growth story.
In 2016, The Bank undertook an exercise with the leadership team to redefine a new Vision, Mission and Values that encapsulate the beliefs as an organization. As a result, the Bank’s total assets grew by 25 % to close at MUR 25.3 billion (KShs 72.1 billion), while total profit before tax for the year increased by 65 % to close at MUR 348.8 million (KShs 994.0 million).
The bank significantly strengthened its equity base from Rs1.8bn in 2015 to Rs2.1bn by end 2016. The leveraging of EURO 10m as Tier II capital was completed in December 2016 which strengthened further the capital base for future growth.
I&M Bank (T) Limited, Tanzania
The Tanzanian economy was faced with its own share of challenges during the year. The government introduced austerity measures in 2016, greatly affecting the money circulation and reducing credit to the private sector. The Banking industry was affected by the introduction of the value-added tax on the financial service charges and a significant increase in the stressed assets in view of the tight liquidity position.
As at the end of December 2016, the Tanzanian bank’s profits before tax increased marginally from TZS 8.04 billion to stand at TZS 8.1 billion. The Bank’s loan portfolio increased by 11 % from TZS 268 billion in December 2015 to TZS 298 billion as at December 2016. Customer deposits grew by 4 % from TZS 275 billion to reach TZS 285 billion. This resulted in a balance sheet growth of 9 % since December 2015 to stand at TZS 421 billion as at December 2016.
To bolster the subsidiary’s capital adequacy ratios, the Bank successfully undertook a Rights Issue for an amount of USD 5 million which was fully subscribed. During the year, the Group increased its shareholding in the subsidiary to 70.38% up from 55.03% held earlier following the exit of Proparco which had reached the end of its investment horizon.
In terms of product expansion, I&M Bank (T) Ltd successfully launched the Mobile Banking Product with extended features enabling seamless payments by customers for various services. The Bank also introduced the i-Tax product to ensure collection of revenues through an integrated mechanism to the Tanzania Revenue Authority.
The successful conclusion of the “I&M Reach for Riches Campaign” saw a notable increase in the number of accounts and deposit balances. The Bank also secured a senior debt facility from FMO of USD 12 million for on-lending of which an amount of USD 8 million was drawn during the year.
I&M Bank (Rwanda) Limited, Rwanda
I&M Bank (Rwanda) continued to grow its branch and ATM network with a new business centered branch at CHIC complex in Muhima, Kigali and 3 new ATMs deployed in high traffic areas around the city to improve accessibility and cater to customer convenience. The Government has been proactive in increasing the penetration of banking services and in support of this initiative, the Bank launched I&M “Kira” Account campaign which was an overwhelming success.
The much-anticipated Government of Rwanda (“GoR”) Offer for Sale of Shares held in I&M Bank (Rwanda) was launched on the 14th February 2017 and closed on 10th March 2017. I am pleased to announce that the issue was oversubscribed by 2.08 times and an allotment criteria with a priority on the retail pool was approved by the Bank’s Board. The IPO comes in the wake of the GoR’s privatization strategy which is guided by its objective of encouraging private equity

V i b r a n t C o l o r s o f G r o w t h V i b r a n t C o l o r s o f G r o w t h
I&M Holdings Limited Annual Report and Financial Statements | 2016 I&M Holdings Limited Annual Report and Financial Statements | 2016
24 25CHAIRMAN’S STATEMENT (Continued)
investment amongst the citizens of Rwanda, and promoting the development of the local capital markets. The GoR is pursuing a privatization programme of state-owned enterprises which kicked off in earnest in 1997 with a total of 72 institutions earmarked for privatization. I&M Bank will be the third Government owned entity to be privatized through an IPO under this Privatization programme.
The Bank, in 2016 was rated as one of the most efficient banks in the industry with a Return on Equity (ROE) of 19% as of December 2016. The Bank registered a growth of 18% in profit before tax which increased to Rwf 8.4 Billion in 2016 from Rwf 7.1Billion in 2015. The asset base expanded to Rwf 206 Billion backed by 18% growth in the loan portfolio and a 9% growth in customer deposits. Management’s significant recovery efforts yielded positive results with a marked decrease in gross non-performing loans with the NPL ratio to 2.7% by December 2016.
The Bank continued its tradition of being a leading player in the SME sector.
OUTLOOK
While Kenya remains the dominant player within the EAC region, we are witnessing increasing strong growth in the other EAC economies – Tanzania, Rwanda and Uganda, which further affirms our goal to be a regional bank. With the expected Kenyan elections in 2017, it is anticipated that there will likely be a slowdown in uptake of credit as campaigns intensify and businesses hold off making long-term commitments pending the elections. However, we are confident in the stability of our economy and believe that our leaders will continue to legislate and ensure an environment that supports our economy and its people.
I take this opportunity to thank the Board of Directors for their continued support, enthusiasm and determination as we look to take this Company to new great heights. In 2016, Mr. Damien Braud (representing Proparco) resigned from the Board following the acquisition of DEG and Proparco’s shareholding in the Company by CDC Group Plc. We hold Mr. Braud in great esteem and thank him for faithfully serving with us on the Board and DEG and Proparco for their valued support and cooperation during their tenure as our shareholders.
On behalf of all my fellow Directors on the Board, I take this opportunity to extend our heartfelt gratitude to all our investors and shareholders for their continued and unwavering faith in I&M Group, as we look forward to achieving our vision to be the Company where our shareholders are proud to own IMHL shares.
More importantly, I would like to acknowledge and express our sincere appreciation to each of the Boards, Management and staff of I&M Bank Kenya, Tanzania, Rwanda and Bank One; it is through their tireless efforts, dedication, and commitment that I&M Holdings continues to grow in a focused, and sustainable manner.
DANIEL NDONYECHAIRMAN
27th March 2017
KIKOIStanding out for its bold colors, the Kikoi is a work of art of rectangular shape. Evenly colored in the middle and striped along the edge, the kikoi was traditionally worn by men but has now become a fashion statement for all.

V i b r a n t C o l o r s o f G r o w t h V i b r a n t C o l o r s o f G r o w t h
I&M Holdings Limited Annual Report and Financial Statements | 2016 I&M Holdings Limited Annual Report and Financial Statements | 2016
26 27REPORT OF THE DIRECTORS FOR THE YEAR ENDED 31 DECEMBER 2016
The directors have pleasure in submitting their annual report together with the audited financial statements of I&M Holdings Limited (“the Company”) and its subsidiaries (together “the Group”) for the year ended 31 December 2016, which shows the state of affairs of the group and of the company.
1. Principal ActivitiesThe Group provides an extensive range of banking, financial and related services through its banking subsidiaries in Kenya, Tanzania, Rwanda and a joint venture in Mauritius. The Group comprises I&M Holdings Limited, I&M Bank Limited, I&M Capital Limited, I&M Realty Limited and I&M Insurance Agency Limited, Bank One Limited, Mauritius, I&M Bank (T) Limited, Tanzania, I&M Bank (Rwanda) Limited, Rwanda, I&M Burbidge Capital Limited, Kenya and Burbidge Capital (U) Limited, Uganda. The Company is listed on the Nairobi Securities Exchange and is regulated by the Capital Markets Authority and the Central Bank of Kenya as a non-operational holding company.
2. Acquisitions and Restructuring
(a) Giro Commercial Bank Limited (GCBL) On 5 September 2015 I&M Holdings Limited entered into a Share Purchase Agreement with the shareholders of Giro Commercial Bank Limited (GCBL), to acquire 100% shareholding in Giro Commercial Bank Limited (GCBL). The purchase consideration was the aggregate of 50% cash consideration of KShs 2,547,295,000 and the remaining 50% by issue of 21,043,330 new shares of KShs 1 each of I&M Holdings Limited.
On 13 February 2017, I&M Holdings Limited acquired the entire issued share capital of GCBL following the receipt of all regulatory approvals and being satisfied that all conditions precedent as stipulated in the Share Purchase Agreement were met. Subsequently, the entire GCBL’s banking business was merged into that of I&M Bank LIMITED. The results of GCBL have not been consolidated in these financials.
(b) I&M Realty Limited As part of Group restructuring, I&M Realty Limited was transferred from I&M Bank LIMITED to I&M Holdings Limited. The transfer was carried out at the net asset value of I&M Realty Limited as at 31 December 2015. The purchase consideration paid to I&M Bank LIMITED by I&M Holdings Limited in respect of the transfer amounted to KShs 5,119,100.
(c) I&M Burbidge Capital Limited (Formerly Burbidge Capital Limited) On 5 October 2015, I&M Holdings Limited entered into a Share Purchase Agreement with the shareholders of Burbidge Capital Limited, to acquire 65% of the share capital of Burbidge Capital Limited. The aggregate consideration for the acquisition was paid by a cash consideration of KShs 55,737,500, representing 87.5% of the purchase consideration and share consideration of 65,722 shares in I&M Holdings Limited. The acquisition was completed on 16 August 2016 upon receipt of all regulatory approvals and satisfied that all other conditions stipulated in the Share Purchase Agreement were met.
REPORT OF THE DIRECTORS FOR THE YEAR ENDED 31 DECEMBER 2016 (Continued)
3. ResultsThe consolidated results for the year are as follows:
2016 KShs’000
2015KShs’000
Profit before income tax 10,603,188 10,167,661Income tax expense ( 2,843,026 ) ( 3,023,250 )
Profit for the year 7,760,162 7,144,411
The directors recommend a first and final dividend of KShs 3.50 per share amounting to KShs 1,446,918,791 for the year ended 31 December 2016. A dividend of KShs 3.50 per share amounting to KShs 1,373,267,137 in respect of the year ended 31 December 2015 was paid on 23 May 2016.
4. DirectorsThe directors who served during the year and up to the date of this report are set out on page 4.
5. AuditorsThe auditors, KPMG Kenya, continue in office in accordance with the Kenyan Companies Act, 2015.
6. Relevant audit information The Directors in office at the date of this report confirm that:
(i) There is no relevant audit information of which the Company’s auditor is unaware; and
(ii) Each director has taken all the steps that they ought to have taken as a director so as to be aware of any relevant audit information and to establish that the Company’s auditor is aware of that information.
7. Approval of financial statementsThe financial statements were approved at a meeting of the Board of Directors held on 27 March 2017.
BY ORDER OF THE BOARDSecretary
Date: 27 March 2017

V i b r a n t C o l o r s o f G r o w t h V i b r a n t C o l o r s o f G r o w t h
I&M Holdings Limited Annual Report and Financial Statements | 2016 I&M Holdings Limited Annual Report and Financial Statements | 2016
28 29STATEMENT ON CORPORATE GOVERNANCE
IntroductionThis statement outlines the key aspects of the group’s corporate governance framework. The Board has consistently placed great importance on good corporate governance practices of the Company, its subsidiaries and joint venture (together the ‘Group’) as it believes that this is vital for the Group’s strong business performance on a sustainable basis. The Group’s corporate governance framework takes into consideration the Capital Markets Authority Guidelines on Corporate Governance as well as global best practices. This enables the Group to effectively consider and critically evaluate the business activities of its subsidiaries and joint venture on an on-going basis, in order to maintain these at acceptable risk levels. A similar approach is adopted when considering any new investments, both in country and across the region. The Group’s corporate governance framework also ensures that the Group maintains and promotes high standards of integrity, transparency and accountability across all levels.
Shareholders
Significant shareholdersThe Company’s top 10 shareholders as at 31 December 2016 are given below:
Holder Names Shares % Holding
Minard Holdings Limited 88,325,016 22.51%
Tecoma Limited 76,044,808 19.38%
Ziyungi Limited 73,548,000 18.74%
CDC Group Plc 41,881,500 10.67%
Bhagwanji Raja Charitable Foundation The Registered Trustees 9,458,830 2.41%
Investments & Mortgages Nominees Ltd A/C 0001229 8,479,286 2.16%
Investments & Mortgages Nominees Ltd A/C 0004047 8,371,860 2.13%
Rajabali Aunali Fidahussein Rajabali And Sajjad Fidahussein 3,989,800 1.02%
Shah Kantilal Hirji Shah and Vinumati Kantilal 2,603,322 0.66%
Shah Kantaben Amritlal Hirji 2,603,322 0.66%
Distribution of shareholdersThe distribution of shareholders as at 31 December 2016 was as follows:
Share Range No. of Shareholders Shares Held Shareholding%
Less than 1 million shares 2,439 67,810,738 17.28%
> 1 million < 2 million shares 6 9,245,557 2.36%
> 2 million < 3 million shares 2 5,206,644 1.33%
> 3 million shares 8 310,099,100 79.03%
Grand Total 2,455 392,362,039 100.00%
STATEMENT ON CORPORATE GOVERNANCE (Continued)
Shareholder Relations and Communication The Group communicates to its shareholders through its website (www.imbank.com), annual reports, annual general meetings of shareholders and public announcements published in the local dailies. The website is regularly updated with half-yearly and audited annual financial statements, as well as other news relating to the Group. Significant shareholders are also able to follow closely the affairs of the Group on a quarterly basis through their representatives, being present at Board and Board Committee levels.
Any other corporate issues relevant to the Shareholders are immediately brought to their attention by the Company Secretary upon instruction from the Board of Directors.
Board of Directors
Board Constitution and AppointmentThe Board of I&M Holdings Limited currently constitutes seven directors, whose membership details are set out below:
Director Board Membership Position/Title
Committee Membership
BARMC BNRC
Daniel Ndonye Non-Executive, Independent Chairman √ √Suresh Bhagwanji Raja Shah, MBS Non-Executive - - -Sarit S Raja Shah Non-Executive - √ √Michael Turner Non-Executive, Independent - √ √Sachit S Raja Shah Non-Executive - - -Oliver Fowler Non-Executive, Independent - - -Nyambura Koigi Non-Executive, Independent - - -
Resignation
Director Board Membership Date of Resignation
Damien Braud Non-Executive 30 September 2016
V i b r a n t C o l o r s o f G r o w t h V i b r a n t C o l o r s o f G r o w t h
I&M Holdings Limited Annual Report and Financial Statements | 2016 I&M Holdings Limited Annual Report and Financial Statements | 2016
30 31STATEMENT ON CORPORATE GOVERNANCE (Continued)
Board of Directors (Continued)The Board is constituted such that at least one third of the Board constitutes Non-Executive, Independent Directors.
In the appointment of new directors, consideration is given to each individual director’s personal qualities and abilities, the collective Board members’ skills and aptitudes for conducting oversight of the Group, as well as discharging duties and obligations as imposed by law and expected by the shareholders of the Company.
The Company’s directors, collectively bring a myriad of years of experience from expansive backgrounds including banking, general business administration, investment analysis and management, all which are skills relevant to the business of I&M Holdings Limited. The unique collective experiences of the directors provide a superior mix of skills which the Board requires in order to effectively discharge its responsibilities.
Board CharterThe overall obligation of the Board is to provide effective and responsible leadership, characterised by ethical values of responsibility, accountability, fairness and transparency in order to promote the long-term success of the Group by creating and delivering sustainable shareholder value. The Board Charter defines the governance parameters within which the Board exists and operates. It also sets out specific responsibilities to be discharged by the Board, its committees and directors collectively, as well as certain roles and responsibilities binding upon the directors as individuals.
The role of the Board includes but is not limited to the following:
• Providing entrepreneurial leadership to the Group and overseeing the overall conduct of its business to ensure that it is being properly managed;
• Overseeing the formulation and implementation of the Group’s strategies, including ensuring that there are adequate structures, systems and processes to successfully implement these strategies;• Determining the level of Delegated Authority and Terms of Reference for all Board Committees as well as regular
review of the performance of these Committees.• Monitoring the Group’s performance against its strategic plans and objectives on a regular basis. The Board meets
formally on a quarterly basis or more regularly, when required.• Review and approval of guiding principles and policies to be implemented by the respective entities in the Group. • Approval of the Quarterly and Half Year financial statements for publication; • Review of effectiveness of the systems for monitoring and ensuring compliance with applicable laws, regulations
and guidelines as well as industry rules and standards;• Review of the Group’s capital levels to ensure adequacy for each entity within the group and that there is adequate
capacity for intended growth and expansion within the strategic cycle; • Review and approval of all major capital expenditure items, acquisitions and divestitures.
Board MeetingsThe Board meets at least quarterly each year for scheduled meetings and on other occasions when required to deal with specific matters between scheduled meetings. Board members receive board papers well in advance of their meetings, thereby facilitating meaningful deliberations therein.
STATEMENT ON CORPORATE GOVERNANCE (Continued)
Board Meetings (Continued)
Board of Directors – Summary of attendanceThe following table shows the number of meetings held during the year and the attendance of the individual director:
18 January2016
24 March2016
12 July2016
14 September2016
27 October2016
Total Board meetings attended in 2016
Directors
Daniel Ndonye √ √ √ √ √ 5Suresh B R Shah √ √ X √ X 3Sarit S Raja Shah √ √ √ √ √ 5Michael Turner √ √ √ √ √ 5Oliver Fowler √ √ √ X X 3Sachit S Raja Shah √ √ X √ X 3Damien Braud √ √ √ X - 3Nyambura Koigi √ √ √ √ √ 5
√ Attended X Not Attended - Resigned Where a director did not attend a Board or Board Committee meeting, an acceptable apology had been received by the Chairman well in advance of the scheduled meeting.
Board CommitteesThe I&M Holdings Board has set up three Board Committees to assist in discharging its responsibilities. These include:
Board Audit and Risk Management Committee (BARMC)The BARMC consists of two independent directors and one non-executive Director. It is led by a Non-Executive, Independent Director.
The key responsibilities of the BARMC are to assist the Board in fulfilling its statutory and fiduciary responsibilities by providing an objective and independent review of the effectiveness of the external reporting of financial information and the internal control environment of the Group. The BARMC is also responsible for the oversight of the Group’s risk management framework and reviewing the Group’s risk appetite from time to time.
Board Nomination and Remuneration Committee (BNRC)The BNRC consists of two independent Directors and one non-executive Director. It is chaired by a Non- Executive, Independent Director. The BNRC assists the Board in fulfilling its responsibilities by undertaking structured assessment of candidates for membership of the Board and Board Committees and the establishment of an appropriate framework for remuneration of the Board and Board Committees, in line with clearly defined remuneration principles.
Board Strategy Steering Committee (BSSC)The BSSC consists of 7 members. The BSSC assists and provides guidance to the Board in fulfilling its responsibilities by considering matters pertaining to the Group’s overall long term strategic direction as well as corporate objectives. The BSSC assists the Board in review of the optimum level of the Group’s capital structure to support the Group’s strategic and financial goals and review the Group’s major strategic and investment decisions (including Mergers & Acquisitions transactions).
V i b r a n t C o l o r s o f G r o w t h V i b r a n t C o l o r s o f G r o w t h
I&M Holdings Limited Annual Report and Financial Statements | 2016 I&M Holdings Limited Annual Report and Financial Statements | 2016
32 33STATEMENT ON CORPORATE GOVERNANCE (Continued)
Delegation of AuthorityI&M Holdings Limited is a non-operating holding company. The Group’s subsidiaries are governed by different statutory and regulatory requirements across the region. The Holding company board provides strategic direction to the Group’s business and meets quarterly to review overall performance and progress on significant initiatives. It has delegated authority to the boards of its respective subsidiaries, Joint Venture investment and its three Committees, BARMC, BNRC and BSSC. For purposes of co-ordinating and discharging its mandate, it receives regular structured and timely reports from the respective entity level boards as well as those from BARMC, BNRC and BSSC. Each entity in the Group has various Board and Management Committees to oversee the effective conduct of its business. The key committees for the subsidiaries in the group comprises of following:
Board Audit Committee (BAC)The BAC assists the Board in fulfilling its responsibilities by reviewing the financial condition of the Bank, its internal controls, performance and findings of the Internal Audit functions. Two BAC meetings are held in each year independent of management giving the internal and external auditors an opportunity to raise matters directly with members of the BAC.
Board Risk Management Committee (BRMC)The BRMC, through the risk management function is responsible for translating the Risk Management Framework established by the Board of Directors into specific policies, processes and procedures that can be implemented and verified within the different business units, so that risks faced by the Bank are adequately considered and mitigated.
Board Credit Committee (BCC)The BCC is responsible for review of the overall lending policy, conducting independent loan reviews, delegation and review of lending limits. It also ensures compliance with all statutory and regulatory requirements and is responsible for the overall management of credit risk. The Credit Risk Management Committee (CRMC) assists the BCC in its role.
Board Procurement Committee (BPC)The BPC is responsible for reviewing and approving significant procurement proposals as well as proposed consultancy assignments and unbudgeted capital expenditure. In addition, the BPC also vets any agreements with and procurement from related parties.
Management Committees
Business Strategy & Coordination CommitteeThis Committee provides the link between the Board and Management in terms of formulating, implementing and monitoring of each entity’s strategic direction, intent and objectives.
Executive Committee (EXCO)EXCO provides the link between the Board, Top Management and Department Heads. It is responsible for reviewing and benchmarking each entity’s financial and business performance, review of progress of special projects and identification of risks or opportunities in addition to providing a platform for review of new products, initiatives and ideas. EXCO is also tasked with tracking developments in the industry and impact of changes in regulations / legislation on each entity.
Assets & Liabilities Committee (ALCO)ALCO’s primary functions include setting, monitoring and reviewing financial risk management policy and controls, including devising the most appropriate strategy for the Bank in terms of the mix of assets and liabilities and this is based on the committee expectations of the future and the potential impact of interest-rate movements, liquidity constraints, foreign-exchange exposure and capital adequacy.
STATEMENT ON CORPORATE GOVERNANCE (Continued)
Credit Risk Management Committee (CRMC)CRMC is the link between the Board and Management in terms of establishing and implementing the credit and lending policies of each entity. It is responsible for the sanction of credit proposals in line with the each entity’s Credit Policy, effective management and follow-up of all credit-related matters and review of non-performing accounts.
Human Resources Committee (HRC)HRC assists the Board in fulfilling its Human Resource Management responsibilities with due recognition to this key resource. HRC oversees implementation of all major HR initiatives, rendering support and guidance as appropriate.It also facilitates periodic review of each entity’s HR policies and practices to ensure each entity remains competitive and able to attract and retain competent talent for its business.
Code of EthicsThe Group has in place a Code of Conduct and Code of Ethics that binds all its Directors and staff to ensure that business is carried out in an ethical, fair and transparent manner, in keeping with the local regulations and international best practices.
The Code of Ethics that all staff are expected to adhere to, encompasses, inter alia, matters touching upon safety and health, environment, compliance with laws and regulations, confidentiality of customer information, financial integrity and relationships with external parties. This Code of Ethics is reviewed periodically and amendments incorporated if necessary.
Insider TradingThe Group Board has adopted an Insider Trading Policy that prohibits Directors, staff and contractors of the Group from:
• Dealing in the Company’s shares except during the open period following the publication of the results of the banking entities within the trading jurisdiction. This is done to avoid trading when in possession of unpublished price-sensitive information.
• Communicating unpublished price-sensitive information to other people.
Group Enterprise Risk Management Framework
The Enterprise Risk Management function within IMHL is integrated and holistic in it’s approach and covers all risk spectrums the group could encounter, in achieving its strategic objectives across geographic locations where it has presence. The Group addresses the challenge of risks comprehensively through the Enterprise Risk Management (ERM) Framework by adopting the COSO Framework which addresses the themes of Strategic, Organizational, Operational, Analytical, Reporting and Control. It is driven by a governance structure consisting of Board of Directors and Executive Management Committees at subsidiaries and joint venture level.
This framework stipulates that all subsidiaries and the joint venture segregate duties between market facing business units and risk management department.
Subsidiary Risk Governance
The Group acknowledges that subsidiaries and the joint venture are separate entities with independent local Boards of Directors and regulatory authorities to which they have to render stewardship reports. Consequently, the Group approach to the implementation of uniform Enterprise Risk Management across the subsidiaries and joint venture, is to develop a set of risk standards and policies. This is in line with global best practices such as Basel Committee for Banking Supervision, for which the subsidiaries are expected to bench-mark and adopt as long as those guidelines do not contradict local regulations and guidelines.

V i b r a n t C o l o r s o f G r o w t h V i b r a n t C o l o r s o f G r o w t h
I&M Holdings Limited Annual Report and Financial Statements | 2016 I&M Holdings Limited Annual Report and Financial Statements | 2016
34 35STATEMENT ON CORPORATE GOVERNANCE (Continued)
Group Risk Management Oversight Function
Risk related issues are taken into consideration in all business decisions and the Group continually strives to maintain a balance between risk and revenue consideration. Continuous education and awareness of risk management has strengthened the risk management culture across the Group.
The Group Board Audit and Risk Committee (BARM) is responsible for the overall risk oversight for the subsidiaries and joint venture.
In order to discharge the functions above on a daily basis, the committee is supported by the Group Chief Risk Officer (GCRO) who reports on Group Risk Profile, rating and instituted controls quarterly.
In addition to the above, the GCRO also performs these functions:
• Review the subsidiary quarterly risk report and make recommendations to BARMC on the adequacy and effectiveness of the subsidiary ERM Framework.
• Critically review the Group’s Risk Strategy, and, ensure that all significant risks are clearly identified with adequate measures put in place to effectively manage these risks.
• Provide effective oversight and technical support to the respective Chief Risk Officers across the Group, to ensure each Entity’s Risk Management Framework is comprehensive and aligned to the Group’s strategy.
Risk Management Philosophy/Strategy
The group considers sound risk management practice to be the foundation of a long lasting financial institution.
• The group continues to adopt a holistic and integrated approach to risk management and therefore, brings all risks together under one or a limited number of oversight functions.
• Risk management is a shared responsibility; therefore the Group aims to build a shared perspective on risks that is grounded in consensus.
• There is clear segregation of duties between market facing business units and risk management functions.
• Risk Management is governed by well-defined policies which are clearly communicated across the Group.
• Risk related issues are taken into consideration in all business decisions.
Risk Appetite
The Group’s risk appetite is reviewed by the Board of Directors annually, at a level that minimizes erosion of earnings or capital due to avoidable losses or from frauds and operational inefficiencies.
In order to achieve the above, all subsidiaries on a semi-annual basis, submit their risk appetite and tolerances around those limits. The risk appetite information submitted forms the basis for the formulation of the Group Risk Appetite.
Risk Appetite Statement
I&M Holdings Limited Risk Appetite Statements defines the types and degrees of risk that the Group is willing to be exposed to in order to meet its strategic objectives while fulfilling regulatory requirements and wider commitments to its stakeholders (both under regular and stressed conditions).
In arriving at the desired risk appetite, the Group will only tolerate those risks which permit it to: • Achieve its stated strategic business objectives, • Provide a return that meets or exceeds expectations, • Comply with all applicable laws and regulations, • Conduct its business in a safe and sound manner
STATEMENT ON CORPORATE GOVERNANCE (Continued)
Risk Management Approach
The Group addresses the challenge of risks comprehensively through an enterprise-wide risk management framework and a risk governance policy by applying leading practices such as Basel principles and standards that are supported by a robust governance structure consisting of board level and executive management committees. The Board drives the risk governance and compliance process through its committees. The Group’s Internal Audit function provides oversight on the systems of internal control, financial reporting and compliance. The respective subsidiary’s Board Credit Committee reviews the credit policies and approves all loans above the defined limits for Executive Management. The local Board Risk Committee sets the risk philosophy, policies and strategies, as well as provides guidance on the various risk elements and their management. The various local Board committees are supported by various management committees and sub committees (Credit Risk Management Committee, Assets and Liabilities Committee (ALCO) and Risk Management & Compliance Committee) that help it develop and implement various risk strategies.
In addition, IMHL Group manages its risks in a structured, systematic and transparent manner through risk standards policies which embed comprehensive risk management processes into the organizational structure and risk measurement and monitoring activities. This structure ensures that the Group’s overall risk exposures are within the thresholds set by the Board.
The Group continually modifies and enhances its risk management policies and systems to reflect changes in markets, products and international best practices. Training, individual responsibility and accountability, together with a disciplined and cautious culture of control, is an integral part of the Group’s management of risk.
The Board of Directors ensures strict compliance with relevant laws, rules and standards issued by the industry regulators and other law enforcement agencies, market conventions, codes of practices promoted by industry associations and internal policies.
The compliance function, under the leadership of the Country’s Chief Risk Officer (where the local regulations permits) or as independent Compliance unit has put in place a robust Compliance framework to manage all inherent risks associated with regulatory issues.
Methodology for Risk Rating
The risk management strategy is to develop an integrated approach to risk assessments, measurement, monitoring and control that captures all risks in all aspects of the Group’s activities. The risks will be rated High, Medium and Low. All activities in the Group are profiled and the key risk drivers in them identified. Mitigation and control techniques are then determined in tackling each of these risks. These techniques are implemented as risk policies and procedures that drive the strategic direction and risk appetite as specified by the board.
Corporate Social Responsibility (CSR)
At I&M Holdings Limited, Corporate Social Responsibility remained a key part of the group operating model in all our subsidiaries and joint venture during the year, as we continued to support high impact initiatives with tangible benefits to the societies and geographical locations where we are present.
The Holding Group corporate responsibility initiatives have the same objective: to leverage on the expertise, resources and networks of our organization to support the economic growth and progress in the communities where we operate.
Our footprints in Corporate Social Responsibility are guided strategically by our decision to operate on four major pillars: Education, Community Service Development, Arts and the Environment, which we believe are essential building blocks for the society and prerequisites for economic growth.

V i b r a n t C o l o r s o f G r o w t h V i b r a n t C o l o r s o f G r o w t h
I&M Holdings Limited Annual Report and Financial Statements | 2016 I&M Holdings Limited Annual Report and Financial Statements | 2016
36 37STATEMENT OF DIRECTORS’ RESPONSIBILITIES
The directors are responsible for the preparation and fair presentation of the consolidated and company financial statements of I&M Holdings Limited set out on pages 44 to 114 which comprise the Consolidated and Company statements of financial position as at 31 December 2016, Consolidated and Company statements of profit or loss and other comprehensive income, statements of changes in equity and Consolidated statement of cash flows for the year then ended, and a summary of significant accounting policies and other explanatory information, in conformity with International Financial Reporting Standards and in the manner required by the Kenyan Companies Act, 2015. The Directors are of the opinion that the financial statements give a true and fair view of the state of the financial affairs and the operating results of the Group and the Company.
The directors’ responsibilities include: determining that the basis of accounting described in Note 2 is an acceptable basis for preparing and presenting the financial statements in the circumstances, preparation and presentation of financial statements in accordance with International Financial Reporting Standards and in the manner required by the Kenyan Companies Act, 2015 and for such internal control as the directors determine is necessary to enable the preparation of financial statements that are free from material misstatements, whether due to fraud or error.
Under the Kenyan Companies Act, 2015 the Directors are required to prepare financial statements for each financial year which give a true and fair view of the state of affairs of the Group and the Company as at the end of the financial year and of the operating results of the Group and the Company for that year. It also requires the Directors to ensure the Group and the Company keeps proper accounting records which disclose with reasonable accuracy the financial position of the Group and the Company.
The directors accept responsibility for the maintenance of accounting records which may be relied upon in the preparation of financial statements, as well as adequate systems of internal financial control.
The directors have made an assessment of the company, its subsidiaries and joint venture’s ability to continue as a going concern and have no reason to believe the company, its subsidiaries and joint venture will not be a going concern for at least the next twelve months from the date of this statement.
Approval of the financial statementsThe Group and Company financial statements, as indicated above, were approved by the Board of Directors on 27 March 2017 and were signed on its behalf by:
Daniel Ndonye Michael Turner Sarit S Raja ShahChairman Director Director
DIRECTORS’ REMUNERATION REPORT
The Board of Directors of I&M Holdings Limited [IMHL] is pleased to present the Director’s remuneration report for the year ended 31 December 2016. This report is in compliance with the IMHL’s Board Charter on Director reward and remuneration, the Code of Corporate Governance Guidelines issued by the Capital Markets Authority on Director’s remuneration and the Companies Act 2015. In course of executing these policies, the Board’s desire is to align rewards with clear and measurable linkage to business performance.
IMHL is regulated by the Capital Markets Authority and the Central Bank of Kenya as a non-operational holding company. IMHL board therefore constitutes of non-executive directors as detailed out on page 4.
At IMHL, Directors’ remuneration will be paid in the form of (i) Directors’ Sitting Fees and (ii) Fixed Annual Retainer fees. The fees available to be paid to Directors will be subject to shareholder ratification /approval as appropriate and in accordance with the provisions of the Companies Act, Cap 486 of the Laws of Kenya and the CMA Regulations and Guidelines on Corporate Governance.
The Board has put in place a Board Nomination and Remuneration Committee that is tasked with ensuring that Directors remuneration levels are reviewed with sufficient regularity and are subject to external benchmarking to ensure that IMHL continuously offers competitive total reward packages for its Directors.
For the financial year ended 31 December 2016, fees and other remuneration paid to the Directors is disclosed under note 13 of the Annual Financial Statements.
The list of the reward components are as follows:
1. Fixed Annual Retainer Fees This is competitive taking into account market rates of pay. Fees are reviewed with sufficient regulatory to align to prevailing market movements. Any increases are determined in accordance with the business’ ability to fund the increase. Retainer Fees is paid quarterly in arrears.
2. Sitting or Attendance Fees All Directors, other than Executive Directors of subsidiaries are paid sitting or attendance fee in recognition of the time spent attending Board or Committee meetings. The level of fees paid are also benchmarked on market rates and trends.
3. Insurance Cover IMHL provides professional indemnity insurance for all the Directors in line with best practice in the market.
BY ORDER OF THE BOARD
Virginia Ndunge (CPS Kenya)
Kaplan & StrattonWilliamson House, 4th Ngong AvenuePO Box 40111, 00100 GPO Nairobi

V i b r a n t C o l o r s o f G r o w t h V i b r a n t C o l o r s o f G r o w t h
I&M Holdings Limited Annual Report and Financial Statements | 2016 I&M Holdings Limited Annual Report and Financial Statements | 2016
38 39
REPORT OF THE INDEPENDENT AUDITORS TO THE MEMBERS OF I&M HOLDINGS LIMITED
Report on the Audit of the Financial Statements
Opinion
We have audited the financial statements of I&M Holdings Limited set out on pages 44 to 114 which comprise the Consolidated and Company statements of financial position as at 31 December 2016, the Consolidated and Company statements of profit or loss and other comprehensive income, statements of changes in equity and Consolidated statement of cash flows for the year then ended, and notes to the consolidated financial statements, including a summary of significant accounting policies and other explanatory information.
In our opinion, the accompanying financial statements give a true and fair view of the Consolidated and Company financial position of I&M Holdings Limited as at 31 December 2016, and the Consolidated and Company’s financial performance and the Consolidated cash flows for the year then ended in accordance with International Financial Reporting Standards and the Kenyan Companies Act, 2015.
Basis for opinion
We conducted our audit in accordance with International Standards on Auditing (ISAs). Our responsibilities under those standards are further described in the ‘Auditors Responsibilities for the Audit of the Financial Statements’ section of our report. We are independent of the Group and Company in accordance with the International Ethics Standards Board for Accountants’ Code of Ethics for Professional Accountants (IESBA Code) together with the ethical requirements that are relevant to our audit of the financial statements in Kenya, and we have fulfilled our other ethical responsibilities in accordance with these requirements and the IESBA Code. We believe that the audit evidence we have obtained is sufficient and appropriate to provide a basis for our opinion.
Key audit matters
Key audit matters are those matters that, in our professional judgment, were of most significance in our audit of the consolidated financial statements of the current period. These matters were addressed in the context of our audit of the consolidated financial statements as a whole, and in forming our opinion thereon, and we do not provide a separate opinion on these matters.
Impairment of loans and advances to customers
See accounting policy note 3 (f) (iii) - Significant accounting policies and disclosure note 19 – Loans and advances to customers
The key audit matter How the matter was addressed in our audit
Impairment of loans and advances to customers is a key audit matter due to the significance of the balances, and complexity and subjectivity over estimating timing and amount of impairment. The risk is that the amount of impairment may be misstated.
Our audit procedures in this area included, among others:- Assessing the trends in the local credit environment, considering their likely impact on the Group’s exposures and using this information to focus our testing on the key risk areas;
REPORT OF THE INDEPENDENT AUDITORS TO THE MEMBERS OFI&M HOLDINGS LIMITED (Continued)
Report on the Audit of the Financial Statements (Continued)
Key audit matters (Continued)
Impairment of loans and advances to customers (Continued)
See accounting policy note 3 (f) (iii) - Significant accounting policies and disclosure note 19 – Loans and advances to customers
The key audit matter How the matter was addressed in our audit
The estimation of the impairment loss allowance on an individual basis requires management to make judgements to determine whether there is objective evidence of impairment and to make assumptions about the financial condition of borrowers and expected future cash flows. The collective impairment loss allowance relates to losses incurred but not yet identified (IBNR loss allowance) on other loans. The audit matters include controls over the models used, accuracy of input and appropriateness of model overlays. The model overlays are required to address certain known data and system issues and to reflect economic conditions at the year end.
- Assessing and testing the design and operating effectiveness of the controls over the Group’s loans impairment process;
- Testing a sample of model overlays, including evaluating the rationale for adjustments, the source of data used, key assumptions and sensitivity of the overlays to these assumptions. We compared the assumptions used to selected externally available industry, financial and economic data.
- Re-performing certain credit procedures as follows:
• For individually significant non-performing loans, performing a credit assessment to determine whether the grading was appropriate and assess the reasonableness of the amount and timing of estimated recoverable cash flows, including realisable value of collateral. Where available, we compared the assumptions and estimates made by management to externally available information;
• Performing a credit assessment of the performing loans to determine whether their grading was appropriate and testing the accuracy of key inputs into the models, assessing the appropriateness of the impairment calculation methodology and
re-performing certain calculations.• Assessing whether disclosures in the financial
statements appropriately reflect the Group’s exposure to credit risk.
V i b r a n t C o l o r s o f G r o w t h V i b r a n t C o l o r s o f G r o w t h
I&M Holdings Limited Annual Report and Financial Statements | 2016 I&M Holdings Limited Annual Report and Financial Statements | 2016
40 41
REPORT OF THE INDEPENDENT AUDITORS TO THE MEMBERS OFI&M HOLDINGS LIMITED (Continued)
Report on the Audit of the Financial Statements (Continued)
Key audit matters (Continued)
Impairment of goodwill
The key audit matter How the matter was addressed
See accounting policy note 3 (j) (ii) – Significant accounting policies; disclosure note 23 – Intangible assets
Impairment of goodwill is considered a key audit matter because:
- The sectors in which the Group operates are highly regulated and have experienced competitive market conditions during the year which increased the uncertainty of forecast cash flows used in the valuation models.
- We applied a significant level of judgment when considering management’s assessment of impairment.
We focused our audit on the Group’s valuation methodologies and key inputs such as forecast cash flows, discount rates applied, forecast growth rates and terminal growth rates.
Our audit procedures in this area included, among others:- Assessing management’s determination of the Group’s Cash
Generating Unit (CGU) based on our understanding of the nature of the Group’s business. We also analysed the internal reporting of the Group to assess how results are monitored and reported.
- Comparing the cash flow forecasts to the Board approved forecasts. We also evaluated the forecasting process undertaken by the Group by assessing the precision of prior year forecast cash flows by comparing with actual outcomes.
- Involving our own valuation specialists to assist us in challenging the Group’s valuation methodologies, discount rates and growth rates. This included comparing the Group’s input to external data such as economic growth projections and interest rates. We also cross checked the valuation results against multiples inherent in the value of other similar entities.
- Comparing the carrying amount of the assets to management’s valuation for the intangible assets to confirm the accuracy of the impairment charge, where impairment had been recognized.
Other information
The Directors are responsible for the other information. The other information comprises the information included in the Annual Report and Financial Statements, but does not include the financial statements and our auditor’s report there on. Our opinion on the financial statements does not cover the other informiiation and we do not express any form of assurance conclusion thereon.In connection with our audit of the financial statements, our responsibility is to read the other information and, in doing so, consider whether the other information is materially inconsistent with the financial statements or our knowledge obtained in the audit or otherwise appears to be materially misstated. If, based on the work we have performed, we conclude that there is a material misstatement of this other information, we are required to report that fact. We have nothing to report in this regard.
Directors’ responsibilities for the financial statements
As stated on page 36, the directors are responsible for the preparation of financial statements that give a true and fair view in accordance with International Financial Reporting Standards, and in the manner required by the Kenyan Companies Act, 2015 and for such internal control as the Directors determine is necessary to enable the preparation of financial statements that are free from material misstatement, whether due to fraud or error.In preparing the financial statements, directors are responsible for assessing the Group’s and Company’s ability to continue as a going concern, disclosing, as applicable, matters related to going concern and using the going concern basis of accounting unless the directors either intend to liquidate the Group or to cease operations, or has no realistic alternative but to do so.
REPORT OF THE INDEPENDENT AUDITORS TO THE MEMBERS OFI&M HOLDINGS LIMITED (Continued)
Report on the Audit of the Financial Statements (Continued)
Auditors’ responsibilities for the audit of the financial statements
Our objectives are to obtain reasonable assurance about whether the financial statements as a whole are free from material misstatement, whether due to fraud or error, and to issue an auditors’ report that includes our opinion. Reasonable assurance is a high level of assurance, but is not a guarantee that an audit conducted in accordance with ISAs will always detect a material misstatement when it exists. Misstatements can arise from fraud or error and are considered material if, individually or in the aggregate, they could reasonably be expected to influence the economic decisions of users taken on the basis of these financial statements.
As part of an audit in accordance with ISAs, we exercise professional judgment and maintain professional skepticism throughout the audit. We also:• Identify and assess the risks of material misstatement of the financial statements, whether due to fraud or error,
design and perform audit procedures responsive to those risks, and obtain audit evidence that is sufficient and appropriate to provide a basis for our opinion. The risk of not detecting a material misstatement resulting from fraud is higher than for one resulting from error, as fraud may involve collusion, forgery, intentional omissions, misrepresentations, or the override of internal control.• Obtain an understanding of internal control relevant to the audit in order to design audit procedures that are
appropriate in the circumstances, but not for the purpose of expressing an opinion on the effectiveness of the Group’s internal control.
• Evaluate the appropriateness of accounting policies used and the reasonableness of accounting estimates and related disclosures made by the Directors.
• Conclude on the appropriateness of the Directors’ use of the going concern basis of accounting and, based on the audit evidence obtained, whether a material uncertainty exists related to events or conditions that may cast significant doubt on the Group’s ability to continue as a going concern. If we conclude that a material uncertainty exists, we are required to draw attention in our auditor’s report to the related disclosures in the financial statements or, if such disclosures are inadequate, to modify our opinion. Our conclusions are based on the audit evidence obtained up to the date of our auditor’s report. However, future events or conditions may cause the Group to cease to continue as a going concern.
• Evaluate the overall presentation, structure and content of the financial statements, including the disclosures, and whether the financial statements represent the underlying transactions and events in a manner that achieves fair presentation.
• Obtain sufficient appropriate audit evidence regarding the financial information of the entities or business activities within the Group to express an opinion on the financial statements. We are responsible for the direction, supervision and performance of the Group and Company audit. We remain solely responsible for our audit opinion.
We communicate with Directors regarding, among other matters, the planned scope and timing of the audit and significant audit findings, including any significant deficiencies in internal control that we identify during our audit.
We also provide the Directors with a statement that we have complied with relevant ethical requirements regarding independence, and to communicate with them all relationships and other matters that may reasonably be thought to bear on our independence, and where applicable, related safeguards.
From the matters communicated with those charged with governance, we determine those matters that were of most significance in the audit of the consolidated financial statements of the current period and are therefore the key audit matters. We describe these matters in our auditor’s report unless law or regulation precludes public disclosure about the matter or when, in extremely rare circumstances, we determine that a matter should not be communicated in our report because the adverse consequences of doing so would reasonably be expected to outweigh the public interest benefits of such communication.
V i b r a n t C o l o r s o f G r o w t h V i b r a n t C o l o r s o f G r o w t h
I&M Holdings Limited Annual Report and Financial Statements | 2016 I&M Holdings Limited Annual Report and Financial Statements | 2016
42 43
REPORT OF THE INDEPENDENT AUDITORS TO THE MEMBERS OFI&M HOLDINGS LIMITED (Continued)
Report on other legal and regulatory requirementsAs required by the Kenyan Companies Act, 2015 we report to you, based on our audit, that:
(i) We have obtained all the information and explanations, which to the best of our knowledge and belief were necessary for the purpose of our audit;(ii) In our opinion, proper books of account have been kept by the Company, so far as appears from our exami nation of those books; and(iii) The statement of financial position and statement of profit or loss of the Company are in agreement with the books of account.
The Engagement Partner responsible for the audit resulting in this independent auditors’ report is FCPA Eric Aholi – P/1471.
Date: 27 March 2017
KITENGEAlso called the Chitenge, it is worn by women and wrapped around the chest or waist. Its variety of colors serves as a fashion statement and it is not uncommon to �nd men wearing them around the waist in hot weather. Kitenges can be worn like kangas or taken to a tailor to make a beautiful dress!
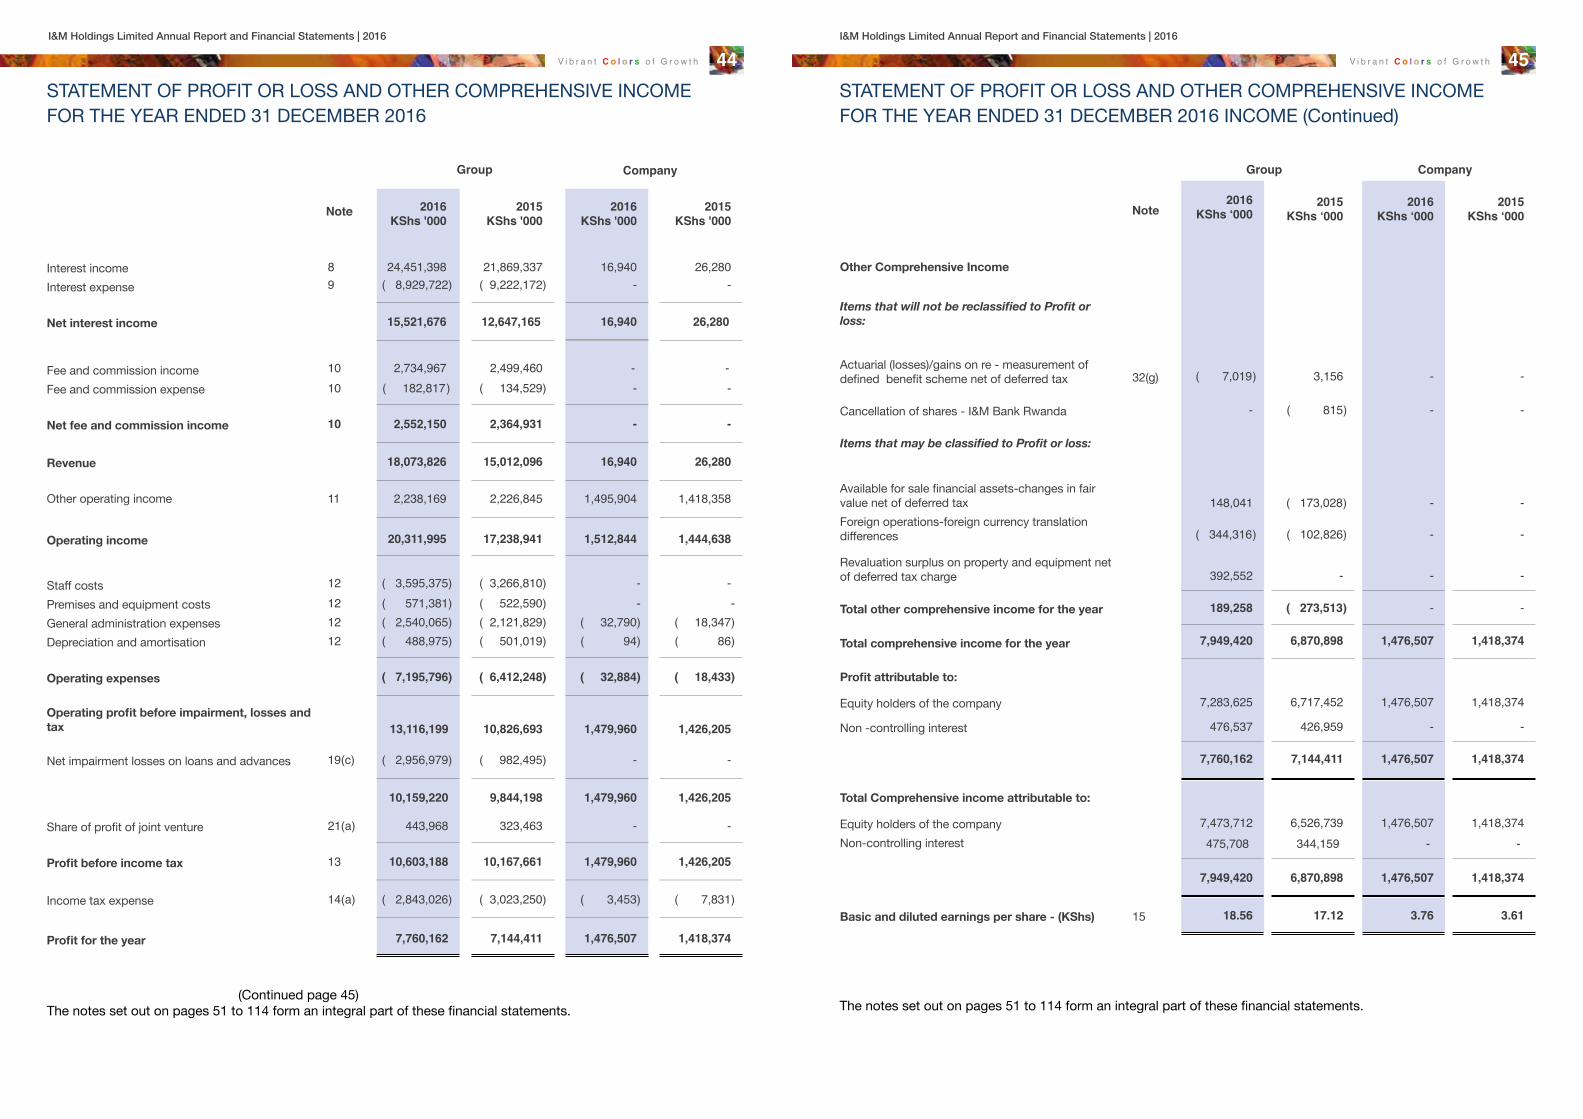
V i b r a n t C o l o r s o f G r o w t h V i b r a n t C o l o r s o f G r o w t h
I&M Holdings Limited Annual Report and Financial Statements | 2016 I&M Holdings Limited Annual Report and Financial Statements | 2016
44 45STATEMENT OF PROFIT OR LOSS AND OTHER COMPREHENSIVE INCOME FOR THE YEAR ENDED 31 DECEMBER 2016
Group Company
Note 2016
KShs '0002015
KShs '0002016
KShs '0002015
KShs '000
Interest income 8 24,451,398 21,869,337 16,940 26,280Interest expense 9 ( 8,929,722) ( 9,222,172) - -
Net interest income 15,521,676 12,647,165 16,940 26,280
Fee and commission income 10 2,734,967 2,499,460 - -Fee and commission expense 10 ( 182,817 ) ( 134,529) - -
Net fee and commission income 10 2,552,150 2,364,931 - -
Revenue 18,073,826 15,012,096 16,940 26,280
Other operating income 11 2,238,169 2,226,845 1,495,904 1,418,358
Operating income 20,311,995 17,238,941 1,512,844 1,444,638
Staff costs 12 ( 3,595,375) ( 3,266,810) - -Premises and equipment costs 12 ( 571,381) ( 522,590) - -General administration expenses 12 ( 2,540,065) ( 2,121,829) ( 32,790) ( 18,347)Depreciation and amortisation 12 ( 488,975) ( 501,019) ( 94) ( 86)
Operating expenses ( 7,195,796) ( 6,412,248) ( 32,884) ( 18,433)
Operating profit before impairment, losses and tax 13,116,199 10,826,693 1,479,960 1,426,205
Net impairment losses on loans and advances 19(c) ( 2,956,979) ( 982,495) - -
10,159,220 9,844,198 1,479,960 1,426,205
Share of profit of joint venture 21(a) 443,968 323,463 - -
Profit before income tax 13 10,603,188 10,167,661 1,479,960 1,426,205
Income tax expense 14(a) ( 2,843,026) ( 3,023,250) ( 3,453) ( 7,831)
Profit for the year 7,760,162 7,144,411 1,476,507 1,418,374
(Continued page 45)The notes set out on pages 51 to 114 form an integral part of these financial statements.
STATEMENT OF PROFIT OR LOSS AND OTHER COMPREHENSIVE INCOME FOR THE YEAR ENDED 31 DECEMBER 2016 INCOME (Continued)
Group Company
Note2016
KShs ‘0002015
KShs ‘0002016
KShs ‘0002015
KShs ‘000
Other Comprehensive Income
Items that will not be reclassified to Profit or loss:
Actuarial (losses)/gains on re - measurement of defined benefit scheme net of deferred tax 32(g) ( 7,019 ) 3,156 - -
Cancellation of shares - I&M Bank Rwanda - ( 815 ) - -
Items that may be classified to Profit or loss:
Available for sale financial assets-changes in fair value net of deferred tax 148,041 ( 173,028 ) - -Foreign operations-foreign currency translation differences ( 344,316 ) ( 102,826) - -
Revaluation surplus on property and equipment net of deferred tax charge 392,552 - - -
Total other comprehensive income for the year 189,258 ( 273,513 ) - -
Total comprehensive income for the year 7,949,420 6,870,898 1,476,507 1,418,374
Profit attributable to:
Equity holders of the company 7,283,625 6,717,452 1,476,507 1,418,374
Non -controlling interest 476,537 426,959 - -
7,760,162 7,144,411 1,476,507 1,418,374
Total Comprehensive income attributable to:
Equity holders of the company 7,473,712 6,526,739 1,476,507 1,418,374Non-controlling interest 475,708 344,159 - -
7,949,420 6,870,898 1,476,507 1,418,374
Basic and diluted earnings per share - (KShs) 15 18.56 17.12 3.76 3.61
The notes set out on pages 51 to 114 form an integral part of these financial statements.

V i b r a n t C o l o r s o f G r o w t h V i b r a n t C o l o r s o f G r o w t h
I&M Holdings Limited Annual Report and Financial Statements | 2016 I&M Holdings Limited Annual Report and Financial Statements | 2016
46 47STATEMENT OF FINANCIAL POSITION AS AT 31 DECEMBER 2016
Group Company
Note 2016KShs’000
2015KShs’000
2016KShs’000
2015KShs’000
ASSETSCash and balances with central banks 16 11,083,876 9,948,128 - -Items in the course of collection 17 487,791 527,596 - -Loans and advances to banks 18 6,948,707 4,981,777 - -Loans and advances to customers 19(a) 134,675,332 127,823,778 - -Investment securities 20 45,834,460 39,135,807 111,896 -Investment in Joint Venture 21(a) 3,508,182 3,062,350 1,679,971 1,679,971Investment in subsidiaries 21(b) - - 19,675,872 19,604,666Property and equipment 22 3,906,899 2,935,233 105 199Intangible assets - Goodwill 23(a) 1,207,048 1,174,601 - -Intangible assets - Software 23(b) 233,405 245,434 - -Prepaid operating lease rentals 24 253,864 284,606 - -Tax recoverable 14(b) 12,541 4,456 3,954 -Deferred tax asset 25(a) 421,121 449,292 - -Due from group companies 36(c)(i) - - 71,375 142,660Other assets 26 1,969,167 1,083,779 29,456 23,825
TOTAL ASSETS 210,542,393 191,656,837 21,572,629 21,451,321
LIABILITIES AND SHAREHOLDERS' EQUITY
Liabilities Deposit from banks 27 7,795,856 7,971,475 - -Items in course of collection 17 7,517 - - -Deposits from customers 28 146,514,406 132,980,678 - -Deferred tax liability 25(b) - 1,039 - -Tax payable 14(b) 139,813 145,434 - 772Due to group companies 36(c)(ii) - - 11,337 11,715Other liabilities 29 3,272,187 2,766,373 66,677 47,457Long term borrowings 30 8,759,516 9,575,455 - -Subordinated debt 30 4,546,681 4,495,084 - -
171,035,976 157,935,538 78,014 59,944
Shareholders' equity (pages 47-49)Share capital 32(a) 392,362 392,362 392,362 392,362Share premium 32(b) 17,331,510 17,331,510 17,331,510 17,331,510Retained earnings 18,217,056 12,971,933 3,770,743 3,667,505Revaluation reserve 32(c) 718,074 446,744 - -Available- for- sale reserve 32(d) ( 353,536) ( 502,206) - -Translation reserve 32(e) ( 287,996) ( 65,102) - -Statutory loan loss reserve 32(f) 1,059,022 912,617 - -Defined benefit reserve 32(g) ( 46,744) ( 39,725) - -
Equity attributable to owners of the company 37,029,748 31,448,133 21,494,615 21,391,377Non-controlling interest 2,476,669 2,273,166 - -
TOTAL SHAREHOLDERS' EQUITY 39,506,417 33,721,299 21,494,615 21,391,377
TOTAL LIABILITIES AND SHAREHOLDERS' EQUITY 210,542,393 191,656,837 21,572,629 21,451,321
The financial statements set out on pages 44 to 114 were approved by the Board of Directors on 27 March 2017 and were signed on its behalf by:Daniel Ndonye Michael Turner Sarit S Raja Shah Virginia NdungeDirector Director Director Secretary
The notes set out on pages 51 to 114 form an integral part of these financial statements.
CO
NSO
LIDA
TED
STAT
EMEN
T O
F C
HAN
GES
IN E
QU
ITY
FOR
THE
YEAR
EN
DED
31 D
ECEM
BER
2016
Shar
e ca
pita
lK
Shs’
000
Shar
e pr
emiu
mK
Shs’
000
Ret
aine
d ea
rnin
gsK
Shs’
000
Stat
utor
y cr
edit
risk
KSh
s’00
0
Defi
ned
bene
fit
rese
rve
KSh
s’00
0
Rev
alua
tion
rese
rve
KSh
s’00
0
Avai
labl
e fo
r sal
e re
serv
eK
Shs’
000
Tran
slat
ion
rese
rve
KSh
s’00
0To
tal
KSh
s’00
0
Non
-co
ntro
lling
in
tere
stK
Shs’
000
Tota
lK
Shs’
000
At
1 Ja
nuar
y 20
16
392,
362
17,3
31,5
1012
,971
,933
(39,
725 )
912,
617
446,
744
(502
,206
)(
65,1
02 )
31,4
48,1
332,
273,
166
33,7
21,2
99Pr
ofit f
or th
e ye
ar
7,28
3,62
5-
--
--
7,28
3,62
547
6,53
77,
760,
162
Oth
er c
ompr
ehen
sive
inco
me
--
( 1
46,4
05 )
( 7,
019 )
146,
405
271,
330
148,
670
(222
,894
)19
0,08
7(
829
)18
9,25
8
Tota
l co
mp
rehe
nsiv
e in
com
e-
-7,
137,
220
( 7,
019 )
146,
405
271,
330
148,
670
222,
894
7,47
3,71
247
5,70
87,
949,
420
Tran
sact
ions
wit
h o
wne
rs
reco
rded
dir
ectl
y in
eq
uity
Divi
dend
s pa
id-
-(
1,37
3,26
9)-
--
--
( 1,
373,
269)
( 1
24,5
37)
( 1,
497,
806)
Oth
er tr
ansa
ctio
ns-
-(
51
8,82
8 )-
--
--
(
518,
828 )
( 1
47,6
68 )
(
666,
496)
Tota
l tra
nsac
tio
ns w
ith
ow
ners
fo
r th
e ye
ar-
-(
1,89
2,09
7)-
--
--
( 1,
892,
097)
( 2
72,2
05)
( 2,
164,
302)
At
31 D
ecem
ber
201
639
2,36
217
,331
,510
18,2
17,0
56(4
6,74
4)1,
059,
022
718,
074
(353
,536
)(2
87,9
96)
37,0
29,7
482,
476,
669
39,5
06,4
17
The
note
s se
t out
on
page
s 51
to 1
14 fo
rm a
n in
tegr
al p
art o
f the
se fi
nanc
ial s
tate
men
ts.

V i b r a n t C o l o r s o f G r o w t h V i b r a n t C o l o r s o f G r o w t h
I&M Holdings Limited Annual Report and Financial Statements | 2016 I&M Holdings Limited Annual Report and Financial Statements | 2016
48 49C
ON
SOLI
DATE
D ST
ATEM
ENT
OF
CH
ANG
ES IN
EQ
UIT
Y FO
R TH
E YE
AR E
NDE
D 31
DEC
EMBE
R 20
16 (C
ontin
ued)
Shar
eca
pita
lK
Shs’
000
Shar
epr
emiu
mK
Shs’
000
Ret
aine
dea
rnin
gsK
Shs’
000
Stat
utor
ycr
edit
risk
KSh
s’00
0
Defi
ned
bene
fitre
serv
eK
Shs’
000
Rev
alua
tion
rese
rve
KSh
s’00
0
Avai
labl
efo
r sal
ere
serv
eK
Shs’
000
Tran
slat
ion
rese
rve
KSh
s’00
0To
tal
KSh
s’00
0
Non
-co
ntro
lling
inte
rest
KSh
s’00
0To
tal
KSh
s’00
0
At
1 Ja
nuar
y 20
1539
2,36
217
,331
,510
7,36
0,52
990
5,48
6(
42,8
81)
448,
726
( 34
2,83
4 )6,
346
26,0
59,2
442,
046,
898
28,1
06,1
42Pr
ofit f
or th
e ye
ar-
-6,
717,
452
--
--
-6,
717,
452
426,
959
7,14
4,41
1O
ther
com
preh
ensi
vein
com
e-
-31
,802
7,13
13,
156
( 1
,982
)(
159,
372 )
(71,
448)
(
190,
713 )
(
82,
800 )
(
273,
513)
Tota
l co
mp
rehe
nsiv
ein
com
e/(lo
ss)
--
6,74
9,25
47,
131
3,15
6(
1,9
82)
( 15
9,37
2 )(7
1,44
8 )6,
526,
739
344,
159
6,87
0,89
8
Tran
sact
ions
wit
h o
wne
rs
reco
rded
dir
ectl
y in
eq
uity
Divi
dend
pai
d-
( 1,
137,
850 )
--
--
-(
1,13
7,85
0 )(
117
,891
)(
1,25
5,74
1)
At
31 D
ecem
ber
201
539
2,36
217
,331
,510
12,9
71,9
3391
2,61
7(
39,7
25)
446,
744
( 50
2,20
6 )(6
5,10
2 )31
,448
,133
2,27
3,16
633
,721
,299
The
note
s se
t out
on
page
s 51
to 1
14 fo
rm a
n in
tegr
al p
art o
f the
se fi
nanc
ial s
tate
men
ts.
COMPANY STATEMENT OF CHANGES IN EQUITYFOR THE YEAR ENDED 31 DECEMBER 2016
Share capital
KShs ‘000
Share premium
KShs ‘000
Retained earnings
KShs ‘000Total
KShs ‘000
At 1 January 2016 392,362 17,331,510 3,667,505 21,391,377
Comprehensive income for the year
Profit for the year - - 1,476,507 1,476,507
Total comprehensive income for the year - - 1,476,507 1,476,507
Transactions with owners recorded directly in equity
Dividends paid - - (1,373,269 ) ( 1,373,269 )
Total transactions with owners for the year - - (1,373,269 ) ( 1,373,269 )
At 31 December 2016 392,362 17,331,510 3,770,743 21,494,615
At 1 January 2015 392,362 17,331,510 3,386,981 21,110,853
Comprehensive income for the year
Profit for the year - - 1,418,374 1,418,374
Total comprehensive income for the year - - 1,418,374 1,418,374
Transactions with owners recorded directly in equityDividends paid - - (1,137,850 ) ( 1,137,850 )
Total transactions with owners for the year - - (1,137,850 ) ( 1,137,850 )
At 31 December 2015 392,362 17,331,510 3,667,505 21,391,377
The notes set out on pages 51 to 114 form an integral part of these financial statements.

V i b r a n t C o l o r s o f G r o w t h V i b r a n t C o l o r s o f G r o w t h
I&M Holdings Limited Annual Report and Financial Statements | 2016 I&M Holdings Limited Annual Report and Financial Statements | 2016
50 51CONSOLIDATED STATEMENT OF CASH FLOWSFOR THE YEAR ENDED 31 DECEMBER 2016
Note2016
KShs’0002015
KShs’000
Net cash flows generated from operating activities 33(a) 10,610,555 10,845,303
Cash flows from investing activitiesPurchase of property and equipment 22(a) ( 851,008 ) ( 519,985 )Purchase of intangible assets 23(b) ( 87,984 ) ( 134,538 )Purchase of property and equipment directly expensed 22(a) ( 2,737 ) -Acquisition of Burbidge Capital net of cash and cash equivalent 33(c) ( 54,856 ) -Additional Investment in I&M Bank (T) Limited ( 819,907 ) -Proceeds from disposal of property and equipment 8,163 11,361Additional investment in Joint venture 21(a) - ( 181,156 )
Net cash used in investing activities ( 1,808,329) ( 824,318 )
Cash flows from financing activities
Net inflows from term subordinated debt 51,597 519,689Dividend paid to shareholders of the company ( 1,373,269 ) ( 1,137,850 )Dividend paid to non-controlling interests ( 124,537 ) ( 117,891)Rights issue - I&M Bank (T) Limited 132,578 -Rights issue - I&M Burbidge Capital 2,100 -Cancellation of shares - ( 815 )
Net cash used in financing activities ( 1,311,531) ( 736,867 )
Net increase in cash and cash equivalents 33(b) 7,490,695 9,284,118
Cash and cash equivalents at start of the year 4,378,074 ( 4,906,044)
Cash and cash equivalents at end of the year 11,868,769 4,378,074
The notes set out on pages 51 to 114 form an integral part of these financial statements.
NOTES TO THE CONSOLIDATED FINANCIAL STATEMENTSFOR THE YEAR ENDED 31 DECEMBER 2016
1. REPORTING ENTITYI&M Holdings Limited (the “Company”), is a non-operating holding company licensed by the Central Bank of Kenya under the Kenyan Banking Act (Chapter 488). The Company is incorporated in Kenya under the Kenyan Companies Act and comprises banking subsidiaries in Kenya, Tanzania, Rwanda and a joint venture in Mauritius. The consolidated financial statements as at and for the year ended 31 December 2016 comprise of entities in Kenya – I&M Bank Limited, I&M Capital Limited, I&M Realty Limited and I&M Insurance Agency Limited, I&M Bank (T) Limited in Tanzania, and I&M Bank (Rwanda) Limited in Rwanda ,I&M Burbidge Capital Limited and a joint venture - Bank One Limited in Mauritius (together referred to as the “Group”). The address of its registered office is as follows:
I&M Bank House2nd Ngong AvenuePO Box 3023800100 Nairobi GPO
Through I&M Bank Limited, the Company has:
(i) 70.38% (2015 - 55.03%) shareholding in I&M Bank (T) Limited; (ii) 100% shareholding in I&M Insurance Agency Limited (incorporated on 23 July 2014).
The Company owns the following entities directly:
(i) Bank One Limited - 50% interest in Bank One Limited, a joint venture in a bank licensed in Mauritius; (ii) I&M Bank Limited – 100% shareholding; and(iii) I&M Bank (Rwanda) Limited – effective interest of 54.99% in I&M Bank (Rwanda) Limited through a 68.742% holding in BCR Investment Company Limited (Mauritius) which owns 80% shareholding in I&M Bank (Rwanda) Limited. (iv) I&M Capital Limited – 100% Shareholding(v) I&M Realty Limited – 100% Shareholding(vi) I&M Burbidge Capital Limited – 65% Shareholding
2. BASIS OF PREPARATION
(a) Statement of complianceThe Group’s consolidated financial statements for the year 2016 have been prepared in accordance with International Financial Reporting Standards (IFRS). Additional information required by the regulatory bodies is included where appropriate.
For the Kenyan Companies Act, 2015 reporting purposes, in these financial statements the “balance sheet” is represented by/is equivalent to the statement of financial position and the “profit and loss account” is presented in the statement of comprehensive income.
(b) Basis of measurement
(i) Non-controlling interests
Non-controlling interests are measured at their proportionate share of the acquiree’s identifiable net assets at the acquisition date. Changes in the Group’s interest in a subsidiary that do not result in a loss of control are accounted for as equity transactions.
(ii) Subsidiaries
‘Subsidiaries’ are investees controlled by the Group. The Group ‘controls’ an investee if it is exposed to, or has rights to, variable returns from its involvement with the investee and has the ability to affect those returns through its power over the investee. The financial statements of subsidiaries are included in the consolidated financial statements from the date on which control commences until the date when control ceases.

V i b r a n t C o l o r s o f G r o w t h V i b r a n t C o l o r s o f G r o w t h
I&M Holdings Limited Annual Report and Financial Statements | 2016 I&M Holdings Limited Annual Report and Financial Statements | 2016
52 53NOTES TO THE CONSOLIDATED FINANCIAL STATEMENTSFOR THE YEAR ENDED 31 DECEMBER 2016
2. BASIS OF PREPARATION (Continued)
(b) Basis of measurement (Continued)
(iii) Loss of control
When the Group loses control over a subsidiary, it derecognises the assets and liabilities of the subsidiary, and any related NCI and other components of equity. Any resulting gain or loss is recognised in profit or loss. Any interest retained in the former subsidiary is measured at fair value when control is lost.
(iv) Interest in equity-accounted investees
Investments in joint ventures are accounted for using the equity method of accounting in the financial statements. These are undertakings in which the Group has between 20% and 50% of the voting rights and over which the Group exercises significant influence but which it does not control. Under the equity method, the Group’s share of its joint ventures’ post-acquisition profits or losses is recognised in profit or loss and its share of other comprehensive income is recognised in other comprehensive income. The cumulative post-acquisition total comprehensive income or loss (including dividends received from the associate) is adjusted against the carrying amount of the investment.
Losses of a joint venture in excess of the Group’s interest in that joint venture are recognised only to the extent that the Group has incurred legal or constructive obligations to make payments on behalf of the associate. Unrealized gains arising from transaction with equity accounted investees are eliminated against the investment to the extent of the Group’s interest in the investee. Unrealized losses are eliminated in the same way as unrealized gains, but only to the extent that there is no evidence of impairment.
Investments in joint ventures are accounted at cost less impairment loss in the separate financial statements of the Group. They are initially recognised at cost which includes transaction costs.
Intra-group balances, and income and expenses (except for foreign currency transaction gains or losses) arising from intra-group transactions, are eliminated in preparing the consolidated financial statements. Unrealised losses are eliminated in the same way as unrealised gains, but only to the extent that there is no evidence of impairment. (c) Functional and presentation currencyThese consolidated financial statements are presented in Kenya Shillings (KShs), which also is the Group’s functional currency. All financial information presented in KShs has been rounded to the nearest thousand except where otherwise stated.
(d) Use of estimates and judgmentsIn preparing these consolidated financial statements, management has made judgements, estimates and assumptions that affect the application of the Group’s accounting policies and the reported amounts of assets, liabilities, income and expenses. Actual results may differ from these estimates.
Estimates and underlying assumptions are reviewed on an on-going basis. Revisions to estimates are recognised prospectively.
In particular information about significant areas of estimation uncertainty and critical judgements in applying accounting policies that have the most significant effect on the amount recognised in the financial statements are described in Note 5.
NOTES TO THE CONSOLIDATED FINANCIAL STATEMENTSFOR THE YEAR ENDED 31 DECEMBER 2016 (Continued)
3. SIGNIFICANT ACCOUNTING POLICIES
The principal accounting policies adopted in the preparation of these consolidated financial statements are set out below:
(a) Basis of consolidation
(i) Subsidiaries
Subsidiaries are investees controlled by the Group. The Group controls an investee when it is exposed to, or has rights to, variable returns from its involvement in the investee and has the ability to affect those returns through its power over the investee. The financial statements of subsidiaries are included in the consolidated financial statements from the date that control commences until the date that control ceases. The financial statements have been prepared using uniform accounting policies for like transactions and other events in similar circumstances. All intercompany transactions are eliminated during consolidation.
(b) Foreign currenciesForeign currency transactions are translated into the functional currency of Group entities using the exchange rates prevailing at the dates of the transactions. Foreign exchange gains and losses resulting from the settlement of such transactions and from the translation at year-end exchange rates of monetary assets and liabilities denominated in foreign currencies are recognised in the profit or loss in the year in which they arise.
Translation differences on non-monetary items, such as equities held at fair value through profit or loss, are reported as part of the fair value gain or loss. Translation differences on non-monetary items, such as equities classified as available-for-sale financial assets, are included in the available-for-sale reserve in equity. (c) Foreign operationsThe results and financial position of the subsidiaries have been translated into the presentation currency as follows:
(i) Assets and liabilities at each reporting period are translated at the closing rate at the reporting date;(ii) Income and expenses for each statement of comprehensive income are translated at average exchange rates (unless this average is not a reasonable approximation of the cumulative effect of the rates prevailing on the transaction dates, in which case income and expenses are translated at the dates of the transactions); and (iii) All resulting exchange differences are recognised in other comprehensive income.
On consolidation, exchange differences arising from the translation of the net investment in foreign entities, and of borrowings and other currency instruments designated as hedges of such investments, are recognised in other comprehensive income. When a foreign operation is sold, such exchange differences are recognised in profit or loss as part of the gain or loss on sale.
Goodwill and fair value adjustments arising on the acquisition of a foreign entity are treated as assets and liabilities of the foreign entity and translated at the closing rate.
(d) Income recognitionIncome is derived substantially from banking business and related activities and comprises net interest income and fee and commission income.
Gains and losses arising from changes in the fair value of financial assets and liabilities at fair value through profit or loss, as well as any interest receivable or payable, are included in profit or loss in the period in which they arise.
Gains and losses arising from changes in the fair value of available-for-sale financial assets, other than foreign exchange gains or losses from monetary items, are recognised directly in other comprehensive income, until the financial asset is derecognised or impaired at which time the cumulative gain or loss previously recognised in other comprehensive income is recognised in profit or loss.

V i b r a n t C o l o r s o f G r o w t h V i b r a n t C o l o r s o f G r o w t h
I&M Holdings Limited Annual Report and Financial Statements | 2016 I&M Holdings Limited Annual Report and Financial Statements | 2016
54 55NOTES TO THE CONSOLIDATED FINANCIAL STATEMENTSFOR THE YEAR ENDED 31 DECEMBER 2016 (Continued)
3. SIGNIFICANT ACCOUNTING POLICIES (Continued)
(d) Income recognition (Continued)
(i) Net interest income
Interest income and expense on available-for-sale assets and financial assets or liabilities held at amortised cost is recognised in profit or loss using the effective interest method.
When calculating the effective interest rate, the Group estimates the cash flows considering all contractual terms of the financial instrument but does not consider future credit losses. The calculation includes all fees and points paid or received, between the parties to the contract that are an integral part of the effective interest rate, transaction costs and all other discounts and premiums. Transaction costs are incremental costs that are directly attributable to the acquisition, issue or disposal of a financial asset or liability.
Once a financial asset or a group of similar financial assets has been written down as a result of an impairment loss, interest income is recognised using the rate of interest used to discount the future cash flows for the purpose of measuring the impairment loss.
Interest income and expense on all trading assets and liabilities are considered to be incidental to the Group’s trading operations are presented in net interest income.
(ii) Fee and commission income
Fee and commission income and expenses that are integral to the effective interest rate of a financial asset or liability are included in the measurement of the effective interest rate. Other fee and commission expenses relate mainly to transaction and service fees, which are expensed as the services are received.
(iii) Other operating income
Other operating income comprises gains less losses related to trading assets and liabilities and includes all realised and unrealised fair value changes, interest and foreign exchange differences. It also includes rental income and gain on disposal of property and equipment.
(iv) Rental income – other operating income
Rental income is recognised in the profit or loss on a straight-line basis over the term of the lease.
(v) Dividend income
Dividend income is recognised when the right to receive income is established. Dividends are reflected as a component of operating income.
(e) Income tax expense Income tax expense comprises current tax and change in deferred tax. Income tax expense is recognised in profit or loss except to the extent that it relates to items recognised directly in equity or other comprehensive income, in which case it is recognised in equity or in other comprehensive income.
Current tax is the expected tax payable or receivable on the taxable income for the year using tax rates enacted or substantively enacted at the reporting date, and any adjustment to tax payable in respect of previous years.
Deferred tax is recognised on all temporary differences between the carrying amounts of assets and liabilities for financial reporting purposes and the amounts used for taxation purposes, except for: • Temporary differences relating to the initial recognition of assets or liabilities in a transaction that is not a business
combination and which affects neither accounting nor taxable profit• Temporary differences related to investments in subsidiaries to the extent that it is probable that they will not
reverse in the foreseeable future; and • Taxable temporary differences arising on the initial recognition of goodwill
NOTES TO THE CONSOLIDATED FINANCIAL STATEMENTSFOR THE YEAR ENDED 31 DECEMBER 2016 (Continued)
3. SIGNIFICANT ACCOUNTING POLICIES (Continued)
(e) Income tax expense (Continued)Deferred tax is measured at the tax rates that are expected to be applied to the temporary differences when they reverse, based on the laws that have been enacted or substantively enacted by the reporting date. A deferred tax asset is recognised only to the extent that it is probable that future taxable profits will be available against which the asset can be utilised.
A deferred tax asset is recognised for unused tax losses, tax credits and deductible temporary differences to the extent that it is probable that future taxable profits will be available against which they can be utilised. Deferred tax assets are reviewed at each reporting date and are reduced to the extent that it is no longer probable that the related tax benefit will be realized.
Deferred tax assets and liabilities are offset if there is a legally enforceable right to offset current tax liabilities against current tax assets and they relate to income taxes levied by the same tax authority on the same taxable entity or on different tax entities, but they intend to settle current tax assets and liabilities on a net basis or their tax assets and liabilities will be realized simultaneously.
(f) Financial assets and financial liabilities
(i) Recognition
The Group initially recognises loans and advances, deposits and debt securities on the date at which they are originated. All other financial assets and liabilities (including assets designated at fair value through profit or loss) are initially recognised on the trade date at which the Group becomes a party to the contractual provision of the instrument.
A financial asset or liability is initially measured at fair value plus (for an item not subsequently measured at fair value through profit or loss) transaction costs that are directly attributable to its acquisition or issue. Subsequent to initial recognition, financial liabilities (deposits and debt securities) are measured at their amortized cost using the effective interest method.
(ii) Classification
The Group classifies its financial assets in the following categories: financial assets at fair value through profit or loss; loans and receivables; held-to-maturity investments; and available-for-sale financial assets. Management determines the classification of its investments at initial recognition.
Financial assets at fair value through profit or loss
This category has two sub-categories: financial assets held for trading, and those designated at fair value through profit or loss at inception. A financial asset is classified in this category if acquired principally for the purpose of selling in the short term or if so designated by management.
Investments held for trading are those which were either acquired for generating a profit from short-term fluctuations in price or dealer’s margin, or are securities included in a portfolio in which a pattern of short-term profit-taking exists. Investments held for trading are subsequently re-measured at fair value based on quoted bid prices or dealer price quotations, without any deduction for transaction costs. All related realized and unrealized gains and losses are included in profit or loss. Interest earned whilst holding held for trading investments is reported as interest income.
Foreign exchange forward and spot contracts are classified as held for trading. They are marked to market and are carried at their fair value. Fair values are obtained from discounted cash flow models which are used in the determination of the foreign exchange forward and spot contract rates. Gains and losses on foreign exchange forward and spot contracts are included in foreign exchange income as they arise.

V i b r a n t C o l o r s o f G r o w t h V i b r a n t C o l o r s o f G r o w t h
I&M Holdings Limited Annual Report and Financial Statements | 2016 I&M Holdings Limited Annual Report and Financial Statements | 2016
56 57NOTES TO THE CONSOLIDATED FINANCIAL STATEMENTSFOR THE YEAR ENDED 31 DECEMBER 2016 (Continued)
3. SIGNIFICANT ACCOUNTING POLICIES (Continued)
(f) Financial assets and liabilities (Continued)
Loans and receivables
Loans and receivables are non-derivative financial assets with fixed or determinable payments that are not quoted in an active market. They arise when the Group provides money directly to a debtor with no intention of trading the receivable. Loans and advances are initially measured at fair value plus incremental direct transaction costs, and subsequently measured at amortized cost using the effective interest method. Loans and receivables compose of loans and advances and cash and cash equivalents.
Held to maturity
Held-to-maturity investments are non-derivative financial assets with fixed or determinable payments and fixed maturities that the Group’s management has the positive intention and ability to hold to maturity. A sale or reclassification of more than an insignificant amount of held to maturity investments would result in the reclassification of the entire category as available for sale and would prevent the Group from classifying investment securities as held to maturity for the current and the following two financial years. Held to maturity investments includes treasury bills and bonds. They are subsequently measured at amortized cost using the effective interest rate method. Available-for-sale
Available-for-sale financial investments are those non-derivative financial assets that are designated as available-for-sale or are not classified as any other category of financial assets. Available-for-sale financial assets are recognized initially at fair value plus any directly attributable transaction costs. Subsequent to initial recognition, they are measured at fair value and changes therein are recognized in other comprehensive income and presented in the available-for-sale fair value reserve in equity. When an investment is derecognized, the gain or loss accumulated in equity is re-classified to profit or loss.
(iii) Identification and measurement of impairment of financial assets
At each reporting date the Group assesses whether there is objective evidence that financial assets not carried at fair value through profit or loss are impaired. Financial assets are impaired when objective evidence demonstrates that a loss event has occurred after the initial recognition of the asset, and that the loss event has an impact on the future cash flows on the asset than can be estimated reliably. The Group considers evidence of impairment at both a specific asset and collective level. All individually significant financial assets are assessed for specific impairment. Significant assets found not to be specifically impaired are then collectively assessed for any impairment that may have been incurred but not yet identified. Assets that are not individually significant are collectively assessed for impairment by grouping together financial assets with similar risk characteristics.
Objective evidence that financial assets (including equity securities) are impaired can include default or delinquency by a borrower, restructuring of a loan or advance by the Group on terms that the Group would otherwise not consider, indications that a borrower or issuer will enter bankruptcy, the disappearance of an active market for a security, or other observable data relating to a group of assets such as adverse changes in the payment status of borrowers or issuers in the group, or economic conditions that correlate with defaults in the group.
In assessing collective impairment the Group uses historical trends of the probability of default, timing of recoveries and the amount of loss incurred, adjusted for management’s judgment as to whether current economic and credit conditions are such that the actual losses are likely to be greater or less than suggested by historical trends. Default rate, loss rates and the expected timing of future recoveries are regularly benchmarked against actual outcomes to ensure that they remain appropriate.
NOTES TO THE CONSOLIDATED FINANCIAL STATEMENTSFOR THE YEAR ENDED 31 DECEMBER 2016 (Continued)
3. SIGNIFICANT ACCOUNTING POLICIES (Continued)
(f) Financial assets and liabilities (Continued)
(iii) Identification and measurement of impairment of financial assets (Continued)
Impairment losses on assets carried at amortized cost are measured as the difference between the carrying amount of the financial assets and the present value of estimated cash flows discounted at the assets’ original effective interest rate. Losses are recognised in profit or loss and reflected in an allowance account against loans and receivables or held-to-maturity investment securities. Interest on the impaired asset continues to be recognised through the unwinding of the discount.
Impairment losses on available-for-sale securities are recognised by reclassifying the losses accumulated in the fair value reserve in equity to profit or loss. The cumulative loss that is reclassified from equity to profit or loss is the difference between the acquisition cost, net of any principal repayment and amortisation, and the current fair value, less any impairment loss recognised previously in profit or loss.
When a subsequent event causes the amount of impairment loss to decrease, the impairment loss is reversed through profit or loss.
(iv) De-recognition
The Group derecognizes a financial asset when the contractual rights to the cash flows from the financial asset expire, or when it transfers the rights to receive the contractual cash flows on the financial asset in a transaction in which substantially all the risks and rewards of ownership of the financial asset are transferred. Any interest in transferred financial assets that is created or retained by the Group is recognized as a separate asset or liability.
The Group derecognizes a financial liability when its contractual obligations are discharged or cancelled or expire.
On derecognition of a financial asset, the difference between the carrying amount of the asset and the sum of (i) the consideration received and (ii) any cumulative gain or loss that had been recognised in other comprehensive income is recognised in profit or loss.
The Group enters into transactions whereby it transfers assets recognized on its statement of financial position, but retains either all or substantially all of the risks and rewards of the transferred assets or a portion of them. If all or substantially all risks and rewards are retained, then the transferred assets are not derecognized from the statement of financial position. Transfers of assets with retention of all or substantially all risks and rewards include repurchase transactions.
(v) Offsetting of financial assets and financial liabilities
Financial assets and financial liabilities are offset and the net amount reported in the statement of financial position when there is a legally enforceable right to offset the recognized amounts and there is an intention to settle on a net basis, or to realize the asset and settle the liability simultaneously.
Income and expenses are presented on a net basis only when permitted under IFRSs, or for gains and losses arising from a group of similar transactions such as in the Group’s trading activity. (vi) Fair value of financial assets and financial liabilities
Fair value is the price that would be received to sell an asset or paid to transfer a liability in an orderly transaction between market participants at the measurement date, in the principal, or in its absence, the most advantageous market to which the group has access at that date.
(vii) Amortized cost measurement
The amortized cost of a financial asset or liability is the amount at which the financial asset or liability is measured at initial recognition, minus principal repayments, plus or minus the cumulative amortization using the effective interest method of any difference between the initial amount recognized and the maturity amount, minus any reduction for impairment.
V i b r a n t C o l o r s o f G r o w t h V i b r a n t C o l o r s o f G r o w t h
I&M Holdings Limited Annual Report and Financial Statements | 2016 I&M Holdings Limited Annual Report and Financial Statements | 2016
58 59NOTES TO THE CONSOLIDATED FINANCIAL STATEMENTSFOR THE YEAR ENDED 31 DECEMBER 2016 (Continued)
3. SIGNIFICANT ACCOUNTING POLICIES (Continued)
(g) Fair value measurementFair value is the price that would be received to sell an asset or paid to transfer a liability in an orderly transaction between market participants at the measurement date in the principal or, in its absence, the most advantageous market to which the Group has access at that date. The fair value of a liability reflects its non-performance risk.
If there is no quoted price in an active market, then the Group uses valuation techniques that maximise the use of relevant observable inputs and minimise the use of unobservable inputs. The chosen valuation technique incorporates all of the factors that market participants would take into account in pricing a transaction.
The best evidence of the fair value of a financial instrument at initial recognition is normally the transaction price – i.e. the fair value of the consideration given or received. If the Group determines that the fair value at initial recognition differs from the transaction price and the fair value is evidenced neither by a quoted price in an active market for an identical asset or liability nor based on a valuation technique that uses only data from observable markets, then the financial instrument is initially measured at fair value, adjusted to defer the difference between the fair value at initial recognition and the transaction price. Subsequently, that difference is recognised in profit or loss on an appropriate basis over the life of the instrument but no later than when the valuation is wholly supported by observable market data or the transaction is closed out.
If an asset or liability measure at fair value has a bid price and an ask price, then the Group measures assets and long positions at a bid price and liabilities and short positions at an ask price.
Portfolio of financial assets and financial liabilities that are exposed to market risk and credit risk that are managed by the Group on the basis of net exposure to either market or credit risk are measured on the basis of a price that would be received to sell a net long position (or paid to transfer a net short position) for a particular risk exposure.
Those portfolio-level adjustments are allocated to the individual assets and liabilities on the basis of the relative risk adjustment of each of the individual instruments in the portfolio.
The fair value of a demand deposit is not less than the amount payable on demand, discounted from the first date on which the amount could be required to be paid. The Group measure fair values using the following fair value hierarchy, which reflects the significance of the inputs used in making the measurements:
• Level 1: inputs that are quoted market prices (unadjusted) in active markets for identical instruments.• Level 2: inputs other than quoted prices included in level 1 that are observable either directly (i.e. as prices) or
indirectly (i.e. derived from prices). This category includes instruments valued using: quoted market prices in active markets for similar instruments; quoted prices for identical or similar instruments in markets that are considered less than active; or other valuation techniques in which all significant inputs are directly or indirectly observable from market data.
• Level 3: inputs that are unobservable. This category includes all instruments for which the valuation technique includes inputs not based on observable data and the unobservable inputs have a significant effect on the instrument’s valuation. This category includes instruments that are valued based on quoted prices for similar instruments for which significant unobservable adjustments or assumptions are required to reflect differences between the instruments.
(h) Cash and cash equivalentsFor the purpose of presentation in the statement of cash flows in the financial statements, the cash and cash equivalents include cash and balances with the respective central banks which are available to finance day to day operations, items in the course of collection from and transmission to other banks and net balances from banking institutions.
NOTES TO THE CONSOLIDATED FINANCIAL STATEMENTSFOR THE YEAR ENDED 31 DECEMBER 2016 (Continued)
3. SIGNIFICANT ACCOUNTING POLICIES (Continued)
(i) Property and equipmentItems of property and equipment are measured at cost or valuation less accumulated depreciation and accumulated impairment losses. Cost includes expenditure that is directly attributable to the asset.
Subsequent expenditure is capitalised only when it is probable that future economic benefits of the expenditure will flow to the Group. On-going repairs and maintenance are expensed as incurred.
Depreciation is charged on a straight line basis to allocate the cost of each asset, to its residual value over its estimated useful life as follows:
Leasehold buildings 2%Leasehold improvements of lease if shorter than 8 years 10 - 12½% or over the periodComputer equipment and computer software 20 - 33⅓%Furniture, fittings and fixtures 10 - 12½% Motor vehicles 20 - 25% Depreciation is recognised in profit or loss. The assets’ residual values and useful lives are reviewed and adjusted as appropriate, at each reporting date.
Any gains or losses on disposal of property and equipment (calculated as the difference between the net proceeds from disposal and the carrying amount of the item) is recognised in other income in profit or loss.
(j) Intangible assets
(i) Computer software
The costs incurred to acquire and bring to use specific computer software licences are capitalised. Software is measured at cost less accumulated amortisation and accumulated impairment. The costs are amortised on a straight line basis over the expected useful lives, from the date it is available for use, not exceeding three years. Costs associated with maintaining software are recognised as an expense as incurred.Amortisation methods, residual values and useful lives are reviewed and adjusted as appropriate, at each reporting date.
(ii) Goodwill
Goodwill represents the excess of the cost of an acquisition over the Group’s interest in the net fair value of the acquired company’s identifiable assets, liabilities and contingent liabilities as at the date of acquisition. Goodwill is stated at cost less accumulated impairment losses. At the reporting date, the Group assesses the goodwill carried in the books for impairment.
(k) Operating leases
(i) Operating leases
Leases where a significant portion of the risks and rewards of ownership are retained by the lessor are classified as operating leases. Payments made under operating leases arrangements (whether prepaid or post-paid) are charged to the profit or loss on a straight-line basis over the period of the lease.
(ii) Finance lease receivables
Minimum lease receipts are apportioned between the interest income and the reduction of outstanding asset. The interest income is allocated to each period during the lease term so as to produce a constant period of rate of interest on the remaining balance of the liability.

V i b r a n t C o l o r s o f G r o w t h V i b r a n t C o l o r s o f G r o w t h
I&M Holdings Limited Annual Report and Financial Statements | 2016 I&M Holdings Limited Annual Report and Financial Statements | 2016
60 61NOTES TO THE CONSOLIDATED FINANCIAL STATEMENTSFOR THE YEAR ENDED 31 DECEMBER 2016 (Continued)
3. SIGNIFICANT ACCOUNTING POLICIES (Continued)
(l) Impairment of non-financial assetsThe carrying amounts of the Group’s non-financial assets, other than deferred tax assets, are reviewed at each reporting date to determine whether there is any indication of impairment. If any such indication exists then the asset’s recoverable amount is estimated.
An impairment loss is recognised if the carrying amount of an asset or its cash-generating unit exceeds its recoverable amount. A cash-generating unit is the smallest identifiable asset group that generates cash flows that largely are independent from other assets and group. Impairment losses are recognised in the profit or loss. Impairment losses recognised in respect of cash-generating units are allocated first to reduce the carrying amount of any goodwill allocated to the units and then to reduce the carrying amount of the other assets in the unit (group of units) on a pro-rata basis. The recoverable amount of an asset or cash-generating unit is the greater of its value in use and its fair value less costs to sell. In assessing value in use, the estimated future cash flows are discounted to their present value using a pre-tax discount rate that reflects current market assessments of the time value of money and the risks specific to the asset.
(m) Derivative financial instrumentsThe Group uses financial instruments to hedge its exposure to foreign exchange and interest rate risks arising from operational, financing and investment activities.
Derivative financial instruments are recognised initially at fair value on the date the derivative contract is entered into. Subsequent to initial recognition, derivative financial instruments are stated at fair value.
The fair value of forward exchange contracts is the amount of the mark to market adjustment at the reporting date.
(n) Employee benefits
(i) Defined contribution plan
The majority of the Group’s employees are eligible for retirement benefits under a defined contribution plan.
The assets of the defined contribution scheme are held in a separate trustee administered guaranteed scheme managed by an insurance company. Retirement plans are funded by contributions from the employees and the respective entities. The Group’s contributions are recognised in profit or loss in the year to which they relate.
The Group also contributes to various national social security funds in the countries it operates. Contributions are determined by local statute and the Group’s contributions are charged to the income statement in the year to which they relate.
(ii) Leave accrual
The monetary value of the unutilised leave by staff as at year end is recognised within accruals and the movement in the year is debited/credited to the profit or loss.
(o) Share capital and share issue costsOrdinary shares are classified as equity. Incremental costs directly attributable to the issue of an equity instrument are deducted from initial measurement of the equity instruments.
(p) Earnings per shareEarnings per share are calculated based on the profit attributable to owners of the company divided by the number of ordinary shares. Diluted earnings per share are computed using the weighted average number of equity shares and dilutive potential ordinary shares outstanding during the year.
NOTES TO THE CONSOLIDATED FINANCIAL STATEMENTSFOR THE YEAR ENDED 31 DECEMBER 2016 (Continued)
3. SIGNIFICANT ACCOUNTING POLICIES (Continued)
(q) DividendsDividends are charged to equity in the period in which they are declared. Proposed dividends are not accrued until they have been ratified at the Annual General Meeting.
(r) Contingent liabilitiesLetters of credit, acceptances and guarantees are not recognised and are disclosed as contingent liabilities. Estimates of the outcome and the financial effect of contingent liabilities is made by management based on the information available up to the date the financial statements are approved for issue by the directors. Any expected loss is charged to profit or loss.
(s) ProvisionsProvisions are recognised when the Company has a present legal or constructive obligation as a result of past events, it is probable that an outflow of resources will be required to settle the obligation and the amount has been reliably estimated. Restructuring provisions comprise lease termination penalties and employee termination payments. Provisions are not recognised for future operating losses.
(t) Fiduciary activitiesThe Group commonly acts as Trustees and in other fiduciary capacities that result in the holding or placing of assets on behalf of individuals, trusts, retirement benefits plans and institutions. These assets and income arising thereon are excluded from these financial statements, as they are not assets of the Group.
(u) Comparative informationWhere necessary, comparative figures have been restated to conform with changes in presentation in the current year.
(v) New standards amendments and interpretations
i) New standards, amendments and interpretations effective and adopted during the year The Group has adopted the following new standards and amendments during the year ended 31 December 2016, including consequential amendments to other standards with the date of initial application by the Group being 1 January 2016. The nature and effects of the changes are explained below:
New standard or amendments
Accounting for Acquisitions of Interests in Joint Operations (Amendments to IFRS 11)
Amendments to IAS 16 and IAS 38 – Clarification of Acceptable Methods of Depreciations and Amortisation
Amendments to IAS 41 - Bearer Plants (Amendments to IAS 16 and IAS 41)
Equity Method in Separate Financial Statements (Amendments to IAS 27)
IFRS 14 Regulatory Deferral Accounts
Investment Entities: Applying the Consolidation Exception (Amendments to IFRS 10, IFRS 12 and IAS 28)
Disclosure Initiative (Amendments to IAS 1)
Annual improvements cycle (2012-2014) – various standards
Accounting for Acquisitions of Interests in Joint Operations (Amendments to IFRS 11)
The amendments require business combination accounting to be applied to acquisitions of interests in a joint operation that constitutes a business. Business combination accounting also applies to the acquisition of additional interests in a joint operation while the joint operator retains joint control. The additional interest acquired will be measured at fair value. The previously held interest in the joint operation will not be re-measured. The amendments apply prospectively for annual periods beginning on or after 1 January 2016.

V i b r a n t C o l o r s o f G r o w t h V i b r a n t C o l o r s o f G r o w t h
I&M Holdings Limited Annual Report and Financial Statements | 2016 I&M Holdings Limited Annual Report and Financial Statements | 2016
62 63NOTES TO THE CONSOLIDATED FINANCIAL STATEMENTSFOR THE YEAR ENDED 31 DECEMBER 2016 (Continued)
3. SIGNIFICANT ACCOUNTING POLICIES (Continued)
(v) New standards, amendments and interpretations (Continued)
(i) New standards, amendments and interpretations effective and adopted during the year - (Continued)The adoption of these changes did not have a significant impact on the financial statements of the Group.
Amendments to IAS 41- Bearer Plants (Amendments to IAS 16 and IAS 41)
The amendments to IAS 16 Property, Plant and Equipment and IAS 41 Agriculture require a bearer plant (which is a living plant used solely to grow produce over several periods) to be accounted for as property, plant and equipment in accordance with IAS 16 Property, Plant and Equipment instead of IAS 41 Agriculture. The produce growing on bearer plants will remain within the scope of IAS 41.The new requirements are effective from 1 January 2016.
The adoption of these changes did not have a significant impact on the financial statements of the Group.
Clarification of Acceptable Methods of Depreciation and Amortisation (Amendments to IAS 16 and IAS 38)
The amendments to IAS 16 Property, Plant and Equipment explicitly state that revenue-based methods of depreciation cannot be used for property, plant and equipment.
The amendments to IAS 38 Intangible Assets introduce a rebuttable presumption that the use of revenue-based amortisation methods for intangible assets is inappropriate. The presumption can be overcome only when revenue and the consumption of the economic benefits of the intangible asset are ‘highly correlated’, or when the intangible asset is expressed as a measure of revenue. The amendments apply prospectively for annual periods beginning on or after 1 January 2016.
The adoption of these changes did not have a significant impact on the financial statements of the Group.
Equity Method in Separate Financial Statements (Amendments to IAS 27)
The amendments allow the use of the equity method in separate financial statements, and apply to the accounting not only for associates and joint ventures but also for subsidiaries. The amendments apply retrospectively for annual periods beginning on or after 1 January 2016.
The adoption of these changes did not have a significant impact on the financial statements of the Group.
IFRS 14 Regulatory Deferral Accounts
IFRS 14 provides guidance on accounting for regulatory deferral account balances by first-time adopters of IFRS. To apply this standard, the entity has to be rate-regulated i.e. the establishment of prices that can be charged to its customers for goods and services is subject to oversight and/or approval by an authorised body.
The standard is effective for financial reporting years beginning on or after 1 January 2016. The adoption of these changes did not have a significant impact on the financial statements of the Group.
Investment Entities: Applying the Consolidation Exception (Amendments to IFRS 10, IFRS 12 and IAS 28) The amendment to IFRS 10 Consolidated Financial Statements clarifies which subsidiaries of an investment entity are consolidated instead of being measured at fair value through profit and loss. The amendment also modifies the condition in the general consolidation exemption that requires an entity’s parent or ultimate parent to prepare consolidated financial statements. The amendment clarifies that this condition is also met where the ultimate parent or any intermediary parent of a parent entity measures subsidiaries at fair value through profit or loss in accordance with IFRS 10 and not only where the ultimate parent or intermediate parent consolidates its subsidiaries.
The amendment to IFRS 12 Disclosure of Interests in Other Entities requires an entity that prepares financial statements in which all its subsidiaries are measured at fair value through profit or loss in accordance with IFRS 10 to make disclosures required by IFRS 12 relating to investment entities.
NOTES TO THE CONSOLIDATED FINANCIAL STATEMENTSFOR THE YEAR ENDED 31 DECEMBER 2016 (Continued)
3. SIGNIFICANT ACCOUNTING POLICIES (Continued)
(v) New standards amendments and interpretations (Continued)
Investment Entities: Applying the Consolidation Exception (Amendments to IFRS 10, IFRS 12 and IAS 28) (Continued)The amendment to IAS 28 Investments in Associates and Joint Ventures modifies the conditions where an entity need not apply the equity method to its investments in associates or joint ventures to align these to the amended IFRS 10 conditions for not presenting consolidated financial statements.
The amendments introduce relief when applying the equity method which permits a non-investment entity investor in an associate or joint venture that is an investment entity to retain the fair value through profit or loss measurement applied by the associate or joint venture to its subsidiaries.
The amendments apply retrospectively for annual periods beginning on or after 1 January 2016.
The adoption of these changes did not have a significant impact on the financial statements of the Group.
Disclosure Initiative (Amendments to IAS 1) The amendments provide additional guidance on the application of materiality and aggregation when preparing financial statements. The amendment applies for annual periods beginning on or after 1 January 2016 and early application is permitted.
The adoption of these changes did have a significant impact on the financial statements of the Group.
Annual improvements cycle (2012-2014) – various standards
Standard Amendments
IFRS 5 Non-current Assets Held for Sale and Discontinued Operations
Changes in methods of disposal.Adds specific guidance in IFRS 5 for cases in which an entity reclassifies an asset from held for sale to held for distribution or vice versa and cases in which held-for-distribution accounting is discontinued.
IFRS 7 Financial Instruments: Disclosures (with consequential amendments to IFRS 1)
Servicing contracts. Adds additional guidance to clarify whether a servicing contract is continuing involvement in a transferred asset for the purpose of determining the disclosures required.
Applicability of the amendments to IFRS 7 to condensed interim financial statements.Clarifies the applicability of the amendments to IFRS 7 on offsetting disclosures to condensed interim financial statements.
IAS 19 Employee Benefits Discount rate: regional market issue.Clarifies that the high quality corporate bonds used in estimating the discount rate for post-employment benefits should be denominated in the same currency as the benefits to be paid (thus, the depth of the market for high quality corporate bonds should be assessed at currency level).
IAS 34 Interim Financial Reporting Disclosure of information ‘elsewhere in the interim financial report’.Clarifies the meaning of ‘elsewhere in the interim report’ and requires a cross-reference
The adoption of these changes did not have a significant impact on the financial statements of the Group.

V i b r a n t C o l o r s o f G r o w t h V i b r a n t C o l o r s o f G r o w t h
I&M Holdings Limited Annual Report and Financial Statements | 2016 I&M Holdings Limited Annual Report and Financial Statements | 2016
64 65NOTES TO THE CONSOLIDATED FINANCIAL STATEMENTSFOR THE YEAR ENDED 31 DECEMBER 2016 (Continued)
3. SIGNIFICANT ACCOUNTING POLICIES (Continued)
(v) New standards amendments and interpretations (Continued)(ii) New and amended standards and interpretations in issue but not yet effective for the year ended 31 December 2016
A number of new standards, amendments to standards and interpretations are not yet effective for the year ended 31 December 2016, and have not been applied in preparing these financial statements.
The Group does not plan to adopt these standards early. These are summarised below:
New standard or amendments Effective for annual periods beginning on or after
Disclosure Initiative (Amendments to IAS 7) 1 January 2017
Recognition of Deferred Tax Assets for Unrealised losses (Amendments to IAS 12) 1 January 2017
IFRS 15 Revenue from Contracts with Customers 1 January 2018
IFRS 9 Financial Instruments (2014) 1 January 2018
Classification and Measurement of Share-based payment Transactions (Amendments to IFRS 2)
1 January 2018
Applying IFRS 9 Financial Instruments with IFRS 4 Insurance Contracts (Amendments to IFRS 4)
1 January 2018
IFRS 16 Leases 1 January 2019
IFRIC Interpretation 22 Foreign Currency Transactions and Advance Consideration 1 January 2018
Sale or Contribution of Assets between an Investor and its Associate or Joint Venture (Amendments to IFRS 10 and IAS 28).
To be determined
Disclosure Initiative (Amendments to IAS 7)
The amendments in Disclosure Initiative (Amendments to IAS 7) come with the objective that entities shall provide disclosures that enable users of financial statements to evaluate changes in liabilities arising from financing activities.
The International Accounting Standards Board (IASB) requires that the following changes in liabilities arising from financing activities are disclosed (to the extent necessary): (i) changes from financing cash flows; (ii) changes arising from obtaining or losing control of subsidiaries or other businesses; (iii) the effect of changes in foreign exchange rates; (iv) changes in fair values; and (v) other changes.
The IASB defines liabilities arising from financing activities as liabilities “for which cash flows were, or future cash flows will be, classified in the statement of cash flows as cash flows from financing activities”. It also stresses that the new disclosure requirements also relate to changes in financial assets if they meet the same definition.
The amendments state that one way to fulfil the new disclosure requirement is to provide reconciliation between the opening and closing balances in the statement of financial position for liabilities arising from financing activities. Finally, the amendments state that changes in liabilities arising from financing activities must be disclosed separately from changes in other assets and liabilities.
The amendments are effective for annual periods beginning on or after 1 January 2017, with early application permitted. Since the amendments are being issued less than one year before the effective date, entities need not provide comparative information when they first apply the amendments.
The potential impact on the financial statements of the Group is being assessed.
NOTES TO THE CONSOLIDATED FINANCIAL STATEMENTSFOR THE YEAR ENDED 31 DECEMBER 2016 (Continued)
3. SIGNIFICANT ACCOUNTING POLICIES (Continued)
(v) New standards amendments and interpretations (Continued)
(ii) New and amended standards and interpretations in issue but not yet effective for the year ended
31 December 2016 (Continued)
Recognition of Deferred Tax Assets for Unrealised Losses (Amendments to IAS 12)
The amendments in Recognition of Deferred Tax Assets for Unrealised Losses clarify the following aspects:
• Unrealised losses on debt instruments measured at fair value and measured at cost for tax purposes give rise to a deductible temporary difference regardless of whether the debt instrument’s holder expects to recover the carrying amount of the debt instrument by sale or by use.
• The carrying amount of an asset does not limit the estimation of probable future taxable profits.• Estimates for future taxable profits exclude tax deductions resulting from the reversal of deductible temporary
differences.• An entity assesses a deferred tax asset in combination with other deferred tax assets. Where tax law restricts the
utilisation of tax losses, an entity would assess a deferred tax asset in combination with other deferred tax assets of the same type.
The amendments are effective for annual periods beginning on or after 1 January 2017 with early application permitted. As transition relief, an entity may recognise the change in the opening equity of the earliest comparative period in opening retained earnings on initial application without allocating the change between opening retained earnings and other components of equity. The Board has not added additional transition relief for first-time adopters
The potential impact on the financial statements of the Group is being assessed.
IFRS 15 Revenue from Contracts with Customers
This standard replaces IAS 11 Construction Contracts, IAS 18 Revenue, IFRIC 13 Customer Loyalty Programmes, IFRIC 15 Agreements for the Construction of Real Estate, IFRIC 18 Transfer of Assets from Customers and SIC-31 Revenue – Barter of Transactions Involving Advertising Services.
The standard contains a single model that applies to contracts with customers and two approaches to recognising revenue: at a point in time or over time. The standard specifies how and when an IFRS reporter will recognise revenue as well as requiring such entities to provide users of financial statements with more informative, relevant disclosures.
The standard provides a single, principles based five-step model to be applied to all contracts with customers in recognising revenue being: Identify the contract(s) with a customer; identify the performance obligations in the contract; determine the transaction price; Allocate the transaction price to the performance obligations in the contract; and recognise revenue when (or as) the entity satisfies a performance obligation.
IFRS 15 is effective for annual reporting periods beginning on or after 1 January 2018, with early adoption permitted.
The Group is assessing the potential impact on its financial statements resulting from the application of IFRS 15.

V i b r a n t C o l o r s o f G r o w t h V i b r a n t C o l o r s o f G r o w t h
I&M Holdings Limited Annual Report and Financial Statements | 2016 I&M Holdings Limited Annual Report and Financial Statements | 2016
66 67NOTES TO THE CONSOLIDATED FINANCIAL STATEMENTSFOR THE YEAR ENDED 31 DECEMBER 2016 (Continued)
3. SIGNIFICANT ACCOUNTING POLICIES (Continued)
(ii) New standards, amendments and interpretations (Continued)
IFRS 9: Financial Instruments (2014)
On 24 July 2014 the IASB issued the final IFRS 9 Financial Instruments Standard, which replaces earlier versions of IFRS 9 and completes the IASB’s project to replace IAS 39 Financial Instruments: Recognition and Measurement.
This standard introduces changes in the measurement bases of the financial assets to amortised cost, fair value through other comprehensive income or fair value through profit or loss. Even though these measurement categories are similar to IAS 39, the criteria for classification into these categories are significantly different. In addition, the IFRS 9 impairment model has been changed from an “incurred loss” model from IAS 39 to an “expected credit loss” model.
The standard is effective for annual period beginning on or after 1 January 2018 with retrospective application, early adoption permitted.
The Group is assessing the potential impact on its financial statements resulting from the application of IFRS 9.
Classification and Measurement of Share-based Payment Transactions (Amendments to IFRS 2)
The following clarifications and amendments are contained in the pronouncement: - Accounting for cash-settled share-based payment transactions that include a performance condition
Up until this point, IFRS 2 contained no guidance on how vesting conditions affect the fair value of liabilities for cash-settled share-based payments. IASB has now added guidance that introduces accounting requirements for cash-settled share-based payments that follows the same approach as used for equity-settled share-based payments.
- Classification of share-based payment transactions with net settlement features
IASB has introduced an exception into IFRS 2 so that a share-based payment where the entity settles the share-based payment arrangement net is classified as equity-settled in its entirety provided the share-based payment would have been classified as equity-settled had it not included the net settlement feature.
- Accounting for modifications of share-based payment transactions from cash-settled to equity-settled Up until this point, IFRS 2 did not specifically address situations where a cash-settled share-based payment changes to an equity-settled share-based payment because of modifications of the terms and conditions. The IASB has introduced the following clarifications:
• On such modifications, the original liability recognised in respect of the cash-settled share-based payment is derecognised and the equity-settled share-based payment is recognised at the modification date fair value to the extent services have been rendered up to the modification date.
• Any difference between the carrying amount of the liability as at the modification date and the amount recognised in equity at the same date would be recognised in profit and loss immediately.
The amendments are effective for annual periods beginning on or after 1 January 2018. Earlier application is permitted. The amendments are to be applied prospectively. However, retrospective application if allowed if this is possible without the use of hindsight. If an entity applies the amendments retrospectively, it must do so for all of the amendments described above.
The adoption of these changes will not affect the amounts and disclosures of the Group’s financial statements.
NOTES TO THE CONSOLIDATED FINANCIAL STATEMENTSFOR THE YEAR ENDED 31 DECEMBER 2016 (Continued)
3. SIGNIFICANT ACCOUNTING POLICIES (Continued)
(v) New standards, amendments and interpretations (Continued)
(ii) New and amended standards and interpretations in issue but not yet effective for the year ended 31 December 2016 -Continued
Applying IFRS 9 Financial Instruments with IFRS 4 Insurance Contracts (Amendments to IFRS 4)
The amendments in Applying IFRS 9 ‘Financial Instruments’ with IFRS 4 ‘Insurance Contracts’ (Amendments to IFRS 4) provide two options for entities that issue insurance contracts within the scope of IFRS 4:
• an option that permits entities to reclassify, from profit or loss to other comprehensive income, some of the income or expenses arising from designated financial assets; this is the so-called overlay approach;
• an optional temporary exemption from applying IFRS 9 for entities whose predominant activity is issuing contracts within the scope of IFRS 4; this is the so-called deferral approach.
The application of both approaches is optional and an entity is permitted to stop applying them before the new insurance contracts standard is applied.
An entity applies the overlay approach retrospectively to qualifying financial assets when it first applies IFRS 9. Application of the overlay approach requires disclosure of sufficient information to enable users of financial statements to understand how the amount reclassified in the reporting period is calculated and the effect of that reclassification on the financial statements.
An entity applies the deferral approach for annual periods beginning on or after 1 January 2018. Predominance is assessed at the reporting entity level at the annual reporting date that immediately precedes 1 April 2016. Application of the deferral approach needs to be disclosed together with information that enables users of financial statements to understand how the insurer qualified for the temporary exemption and to compare insurers applying the temporary exemption with entities applying IFRS 9. The deferral can only be made use of for the three years following 1 January 2018. Predominance is only reassessed if there is a change in the entity’s activities.
The adoption of these changes will not affect the amounts and disclosures of the Group’s financial statements.
IFRS 16: Leases
On 13 January 2016 the IASB issued IFRS 16 Leases, completing the IASB’s project to improve the financial reporting of leases. IFRS 16 replaces the previous leases standard, IAS 17 Leases, and related interpretations.
IFRS 16 sets out the principles for the recognition, measurement, presentation and disclosure of leases for both parties to a contract, i.e. the customer (‘lessee’) and the supplier (‘lessor’). The standard defines a lease as a contract that conveys to the customer (‘lessee’) the right to use an asset for a period of time in exchange for consideration.
A company assesses whether a contract contains a lease on the basis of whether the customer has the right to control the use of an identified asset for a period of time.
The standard eliminates the classification of leases as either operating leases or finance leases for a lessee and introduces a single lessee accounting model. All leases are treated in a similar way to finance leases. Applying that model significantly affects the accounting and presentation of leases and consequently, the lessee is required to recognise:
a) Assets and liabilities for all leases with a term of more than 12 months, unless the underlying asset is of low value. A company recognises the present value of the unavoidable lease payments and shows them either as lease assets (right-of-use assets) or together with property, plant and equipment. If lease payments are made over time, a company also recognises a financial liability representing its obligation to make future lease payments.
b) depreciation of lease assets and interest on lease liabilities in profit or loss over the lease term; and

V i b r a n t C o l o r s o f G r o w t h V i b r a n t C o l o r s o f G r o w t h
I&M Holdings Limited Annual Report and Financial Statements | 2016 I&M Holdings Limited Annual Report and Financial Statements | 2016
68 69NOTES TO THE CONSOLIDATED FINANCIAL STATEMENTSFOR THE YEAR ENDED 31 DECEMBER 2016 (Continued)
3. SIGNIFICANT ACCOUNTING POLICIES (Continued)
(v) New standards, amendments and interpretations (Continued)
b) New standards, amendments and interpretations not yet adopted (Continued)
IFRS 16: Leases - Continued
c) separate the total amount of cash paid into a principal portion (presented within financing activities) and interest (typically presented within either operating or financing activities) in the statement of cash flows
IFRS 16 substantially carries forward the lessor accounting requirements in IAS 17. Accordingly, a lessor continues to classify its leases as operating leases or finance leases, and to account for those two types of leases differently. However, compared to IAS 17, IFRS 16 requires a lessor to disclose additional information about how it manages the risks related to its residual interest in assets subject to leases.
The standard does not require a company to recognise assets and liabilities for:
(a) short-term leases (i.e. leases of 12 months or less) and;(b) leases of low-value assets
The new Standard is effective for annual periods beginning on or after 1 January 2019. Early application is permitted in so far as the recently issued revenue Standard, IFRS 15 Revenue from Contracts with Customers is also applied. The Group is assessing the potential impact on its financial statements resulting from the application of IFRS 16.
IFRIC Interpretation 22 Foreign Currency Transactions and Advance Consideration
This Interpretation applies to a foreign currency transaction (or part of it) when an entity recognises a non-monetary asset or non-monetary liability arising from the payment or receipt of advance consideration before the entity recognises the related asset, expense or income (or part of it). This Interpretation stipulates that the date of the transaction for the purpose of determining the exchange rate to use on initial recognition of the related asset, expense or income (or part of it) is the date on which an entity initially recognises the non-monetary asset or non-monetary liability arising from the payment or receipt of advance consideration
This Interpretation does not apply to income taxes, insurance contracts and circumstances when an entity measures the related asset, expense or income on initial recognition:
(i) at fair value; or(ii) at the fair value of the consideration paid or received at a date other than the date of initial recognition of the non-monetary asset or non-monetary liability arising from advance consideration (for example, the measurement of goodwill applying IFRS 3 Business Combinations).
The amendments apply retrospectively for annual periods beginning on or after 1 January 2018, with early application permitted. The adoption of these changes will not have an impact on the amounts and disclosures of the Company’s financial statements.
Sale or Contribution of Assets between an Investor and its Associate or Joint Venture (Amendments to IFRS 10 and IAS 28)
The amendments require the full gain to be recognised when assets transferred between an investor and its associate or joint venture meet the definition of a ‘business’ under IFRS 3 Business Combinations. Where the assets transferred do not meet the definition of a business, a partial gain to the extent of unrelated investors’ interests in the associate or joint venture is recognised. The definition of a business is key to determining the extent of the gain to be recognised. The effective date for these changes has now been postponed until the completion of a broader review.
NOTES TO THE CONSOLIDATED FINANCIAL STATEMENTSFOR THE YEAR ENDED 31 DECEMBER 2016 (Continued)
4. RISK MANAGEMENT
This section provides details of the group’s exposure to risk and describes the methods used by management to control risk.
Financial riskThe more significant types of risk to which the group is exposed are liquidity risk, credit risk, market risk and operational risk. Market risk includes currency risk and interest rate risk.
(a) Credit riskCredit risk is the risk of financial loss to the Group if a customer or counterparty to a financial instrument fails to meet its contractual obligations, and arises principally from the Group’s loans and advances to customers and other banks and investment securities. For risk management reporting purposes, the Group considers and consolidates all elements of credit risk exposure.
The Board of Directors of the individual Group entities have delegated responsibility of the management of credit risk to their respective Board Credit Committees. Further, each entity has its own and separate Management Credit Risk Management Committee that reports to its Board Credit Committee. The Group’s credit exposure at the reporting date from financial instruments held or issued for trading purposes is represented by the fair value of instruments with a positive fair value at that date, as recorded on the statement of financial position.
The risk that the counter-parties to trading instruments might default on their obligation is monitored on an on-going basis. In monitoring credit risk exposure, consideration is given to trading instruments with a positive fair value and to the volatility of the fair value of trading instruments over their remaining life.
To manage the level of credit risk, the Group deals with counter parties of good credit standing wherever possible and when appropriate, obtains collateral.
An assessment of the extent to which fair values of collaterals cover existing credit risk exposure on loans and advances to customers is highlighted below.
The Group also monitors concentrations of credit risk that arise by industry and type of customer in relation to Group loans and advances to customers by carrying a balanced portfolio. The Group has no significant exposure to any individual customer or counter-party.
To determine impairment of loans and advances, the Group assesses whether it is probable that it will be unable to collect all principal and interest according to the contractual terms of the loans and advances.

V i b r a n t C o l o r s o f G r o w t h V i b r a n t C o l o r s o f G r o w t h
I&M Holdings Limited Annual Report and Financial Statements | 2016 I&M Holdings Limited Annual Report and Financial Statements | 2016
70 71NOTES TO THE CONSOLIDATED FINANCIAL STATEMENTSFOR THE YEAR ENDED 31 DECEMBER 2016 (Continued)
4. RISK MANAGEMENT (Continued)
Financial risk (Continued)
(a) Credit risk (Continued)
Exposure to credit risk
Loans and advances to customers2016
KShs’0002015
KShs’000
Individually impaired:Grade 3: Substandard 2,186,701 1,602,604Grade 4: Doubtful 5,802,451 2,948,013Grade 5: Loss 1,438,825 1,779,561
9,427,977 6,330,178
Specific allowances for impairment ( 5,536,457) ( 3,158,700 )
Carrying amounts 3,891,520 3,171,478
Collectively impaired:Grade 2: Watch 17,040,708 110,257,291Grade 1: Normal 114,253,701 14,881,459
131,294,409 125,138,750
Portfolio allowances for impairment ( 510,597 ) ( 486,450 )
Carrying amounts 130,783,812 124,652,300
Total carrying amounts 134,675,332 127,823,778
Impaired loans and securities
Impaired loans and securities are loans for which the Group determines that it is probable that it will be unable to collect all principal and interest due according to the contractual terms of the loan agreement(s). These loans are graded 3 (Substandard) to 5 (Loss) in the Group’s internal credit risk and grading system.
Neither past due nor impaired
The credit quality of the portfolio of loans and advances that were neither past due nor impaired can be assessed with reference to the group’s internal rating system. All such loans must be performing in accordance with the contractual terms and are expected to continue doing so. Loans in this category are fully protected by their current sound net worth and paying capacity of the borrower. These loans and advances are categorised as normal in line with CBK prudential guidelines.
Past due but not impaired loans
These are loans where contractual interest or principal payments are past due but the Group believes that impairment is not appropriate on the basis of the level of security/collateral available and/or the stage of collection of amounts owed to the Group. These loans are graded 2 (Watch) in the Group’s internal credit risk and grading system.
NOTES TO THE CONSOLIDATED FINANCIAL STATEMENTSFOR THE YEAR ENDED 31 DECEMBER 2016 (Continued)
4. RISK MANAGEMENT (Continued)
Financial risk (Continued)
(a) Credit risk (Continued)
Loans with renegotiated terms
Loans with renegotiated terms are loans that have been restructured due to the deterioration in the borrower’s financial position and where the Group has made concession that it would not otherwise consider. Once the loan is restructured it remains in this category independent of satisfactory performance after restructuring.
Allowances for impairment
The Group establishes an allowance for impairment losses that represents its estimate of incurred losses in its loan portfolio. The main components of this allowance are a specific loss component that relates to individually significant exposures, and a collective loan loss allowance established for homogeneous assets in respect of losses that have been incurred but have not been identified on loans subject to individual assessment for impairment.
Write off policy
The Group writes off a loan balance (and any related allowances for impairment losses) when Credit Committee determines that the loans are uncollectible. This determination is reached after considering information such as the occurrence of significant changes in the borrower/issuer’s financial position such that the borrower/issuer can no longer pay the obligation, or that proceeds from collateral will not be sufficient to pay back the entire exposure.
Set out below is an analysis of the gross and net (of allowances for impairment) amounts of individually impaired assets by risk grade.

V i b r a n t C o l o r s o f G r o w t h V i b r a n t C o l o r s o f G r o w t h
I&M Holdings Limited Annual Report and Financial Statements | 2016 I&M Holdings Limited Annual Report and Financial Statements | 2016
72 73NOTES TO THE CONSOLIDATED FINANCIAL STATEMENTSFOR THE YEAR ENDED 31 DECEMBER 2016 (Continued)
4. RISK MANAGEMENT (Continued)
Financial risk (Continued)
(a) Credit risk (Continued)
Loans and advances - GroupGross
KShs’000Net
KShs’000
Individually impaired:
31 December 2016
Grade 3: Substandard 2,186,701 1,480,214Grade 4: Doubtful 5,802,451 2,278,673Grade 5: Loss 1,438,825 132,633
9,427,977 3,891,520
31 December 2015
Grade 3: Substandard 1,602,604 1,091,456Grade 4: Doubtful 2,948,013 1,785,096Grade 5: Loss 1,779,561 294,926
6,330,178 3,171,478
Collectively impaired:31 December 2016
Grade 1: Normal 114,253,701 113,642,608Grade 2: Watch 17,040,708 17,141,204
131,294,409 130,783,812
31 December 2015
Grade 1: Normal 110,257,292 109,825,605Grade 2: Watch 14,881,458 14,826,695
125,138,750 124,652,300
The Group holds collaterals against loans and advances to customers in the form of mortgage interests over property, other registered securities over assets, and guarantees. Estimate of fair value are based on the value of collateral assessed at the time of borrowing, and generally are not updated except when a loan is individually assessed as impaired. Collateral generally is not held over loans and advances to banks, except when securities are held as part of reverse repurchase and securities borrowings activity. Collateral usually is not held against investment securities, and no such collateral was held at 31 December 2016 or 2015.
NOTES TO THE CONSOLIDATED FINANCIAL STATEMENTSFOR THE YEAR ENDED 31 DECEMBER 2016 (Continued)
4. RISK MANAGEMENT (Continued)
Financial risk (Continued)An estimate of the fair value of collateral and other security enhancements held against financial assets is shown below:
2016KShs’000
2015KShs’000
Group
Fair value of collateral held against impaired loans 4,232,458 3,627,384
(b) Liquidity riskLiquidity risk includes the risk of being unable to meet the Group’s financial obligations as they fall due because of inability to liquidate assets at a reasonable price and in an appropriate timeframe. The Group continually assesses liquidity risk by identifying and monitoring changes in funding required to meet business goals and targets set in terms of the overall Group strategy. In addition, the Group holds a portfolio of liquid assets as part of its liquidity risk management strategy.
The table below analyses financial liabilities into relevant maturity groupings based on the remaining period at 31 December 2016 to the contractual maturity date:
Kenya Tanzania Rwanda
2016 2015 2016 2015 2016 2015
At 31 December 37% 34% 31% 30% 55% 52%Average for the period 36% 32% 31% 33% 51% 52%Highest for the period 39% 35% 34% 40% 54% 55%Lowest for the period 32% 27% 25% 23% 49% 48%
Group
31 December 2016Within
1 monthKShs’000
Due within 1-3 months
KShs’000
Due between 3-12 months
KShs’000
Due between 1-5 yearsKShs’000
Due after 5 years
KShs’000Total
KShs’000LIABILITIESDeposits from banks 4,257,476 2,427,315 1,111,065 - - 7,795,856Items in the course of collection 7,517 - - - - 7,517Deposits from customers 49,738,935 78,022,358 17,680,464 1,072,649 - 146,514,406Other liabilities 749,200 2,319,058 203,929 - - 3,272,187Long term borrowings 78,617 114,740 1,778,463 6,653,810 133,886 8,759,516Subordinated debt 14,335 - 39,798 4,492,548 - 4,546,681
At 31 December 2016 54,846,080 82,883,471 20,813,719 12,219,007 133,886 170,896,163
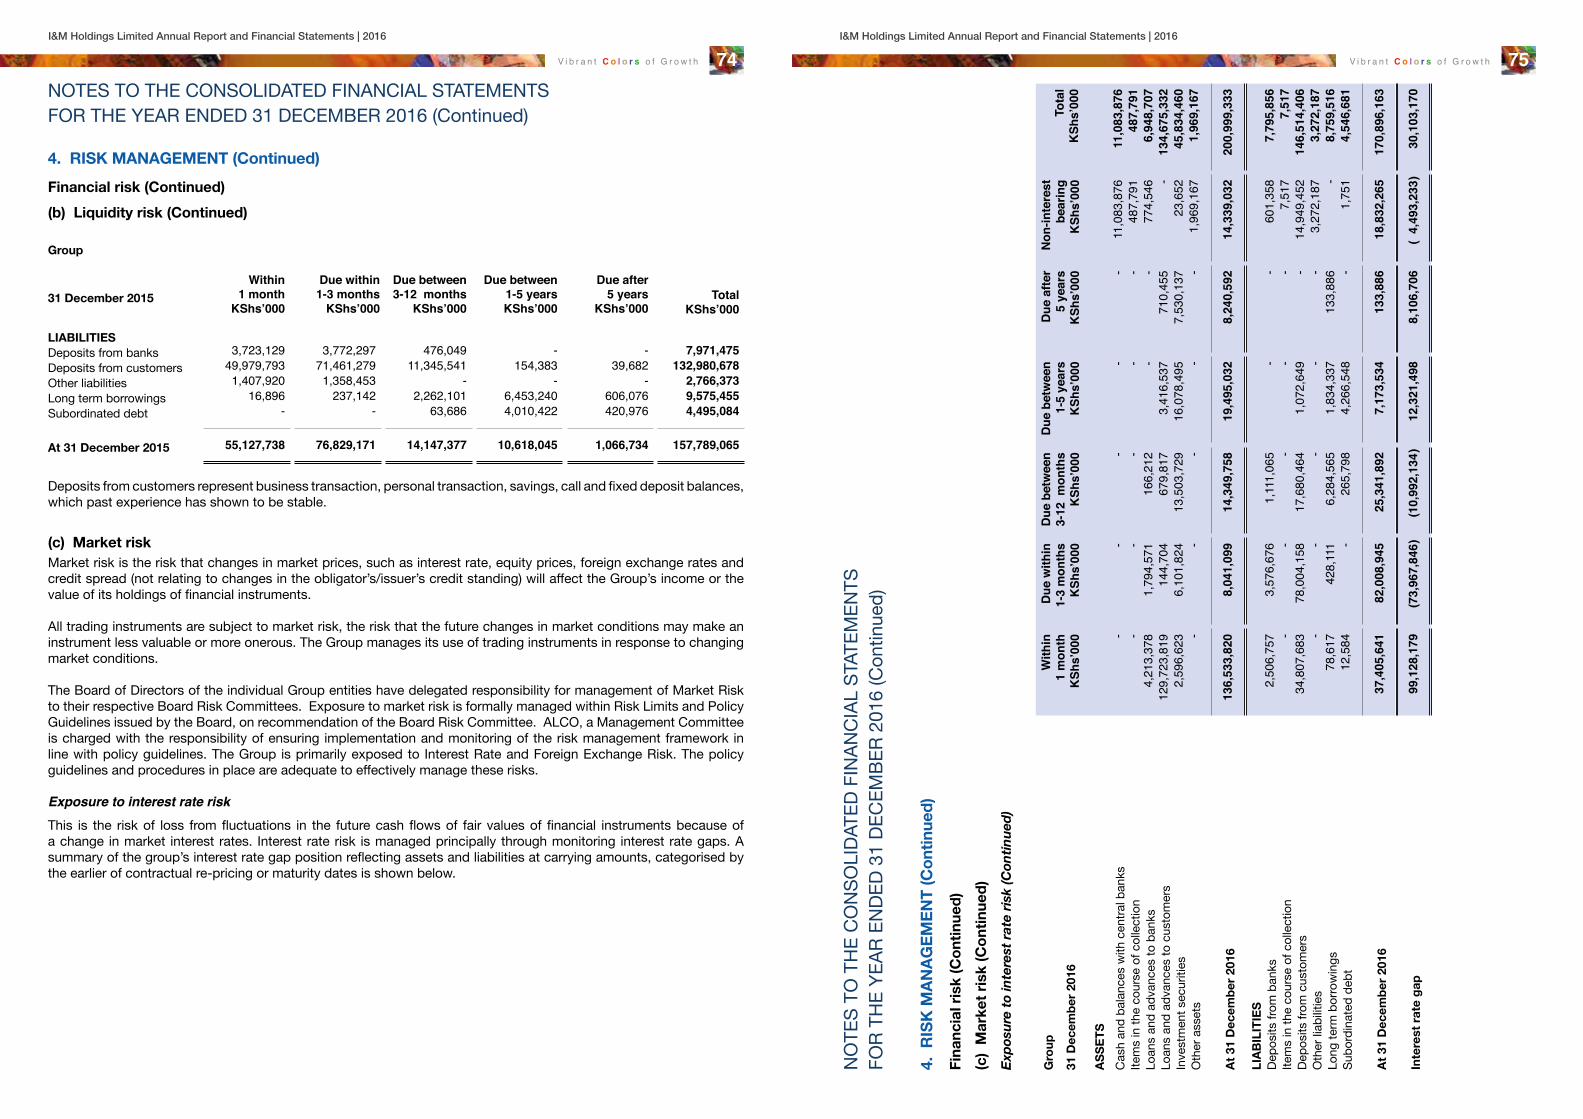
V i b r a n t C o l o r s o f G r o w t h V i b r a n t C o l o r s o f G r o w t h
I&M Holdings Limited Annual Report and Financial Statements | 2016 I&M Holdings Limited Annual Report and Financial Statements | 2016
74 75NOTES TO THE CONSOLIDATED FINANCIAL STATEMENTSFOR THE YEAR ENDED 31 DECEMBER 2016 (Continued)
4. RISK MANAGEMENT (Continued)
Financial risk (Continued)
(b) Liquidity risk (Continued)
Group
31 December 2015
Within 1 month
KShs’000
Due within 1-3 months
KShs’000
Due between 3-12 months
KShs’000
Due between1-5 yearsKShs’000
Due after 5 years
KShs’000Total
KShs’000
LIABILITIESDeposits from banks 3,723,129 3,772,297 476,049 - - 7,971,475Deposits from customers 49,979,793 71,461,279 11,345,541 154,383 39,682 132,980,678Other liabilities 1,407,920 1,358,453 - - - 2,766,373Long term borrowings 16,896 237,142 2,262,101 6,453,240 606,076 9,575,455Subordinated debt - - 63,686 4,010,422 420,976 4,495,084
At 31 December 2015 55,127,738 76,829,171 14,147,377 10,618,045 1,066,734 157,789,065
Deposits from customers represent business transaction, personal transaction, savings, call and fixed deposit balances, which past experience has shown to be stable.
(c) Market riskMarket risk is the risk that changes in market prices, such as interest rate, equity prices, foreign exchange rates and credit spread (not relating to changes in the obligator’s/issuer’s credit standing) will affect the Group’s income or the value of its holdings of financial instruments.
All trading instruments are subject to market risk, the risk that the future changes in market conditions may make an instrument less valuable or more onerous. The Group manages its use of trading instruments in response to changing market conditions.
The Board of Directors of the individual Group entities have delegated responsibility for management of Market Risk to their respective Board Risk Committees. Exposure to market risk is formally managed within Risk Limits and Policy Guidelines issued by the Board, on recommendation of the Board Risk Committee. ALCO, a Management Committee is charged with the responsibility of ensuring implementation and monitoring of the risk management framework in line with policy guidelines. The Group is primarily exposed to Interest Rate and Foreign Exchange Risk. The policy guidelines and procedures in place are adequate to effectively manage these risks.
Exposure to interest rate riskThis is the risk of loss from fluctuations in the future cash flows of fair values of financial instruments because of a change in market interest rates. Interest rate risk is managed principally through monitoring interest rate gaps. A summary of the group’s interest rate gap position reflecting assets and liabilities at carrying amounts, categorised by the earlier of contractual re-pricing or maturity dates is shown below.
NO
TES
TO T
HE
CO
NSO
LIDA
TED
FIN
ANC
IAL
STAT
EMEN
TSFO
R TH
E YE
AR E
NDE
D 31
DEC
EMBE
R 20
16 (C
ontin
ued)
4. R
ISK
MA
NA
GE
ME
NT
(Co
ntin
ued
)
Fina
ncia
l ris
k (C
ont
inue
d)
(c)
Mar
ket
risk
(Co
ntin
ued
)
Exp
osu
re t
o in
tere
st r
ate
risk
(Con
tin
ued
)
Gro
upW
ithin
1
mon
thK
Shs’
000
Due
with
in
1-3
mon
ths
KSh
s’00
0
Due
bet
wee
n 3-
12 m
onth
sK
Shs’
000
Due
bet
wee
n1-
5 ye
ars
KSh
s’00
0
Due
afte
r 5
year
sK
Shs’
000
Non
-inte
rest
be
arin
gK
Shs’
000
Tota
lK
Shs’
000
31 D
ecem
ber
201
6
AS
SE
TS
Cas
h an
d ba
lanc
es w
ith c
entra
l ban
ks-
--
--
11,0
83,8
7611
,083
,876
Item
s in
the
cour
se o
f col
lect
ion
--
--
-48
7,79
148
7,79
1Lo
ans
and
adva
nces
to b
anks
4,21
3,37
81,
794,
571
166,
212
--
774,
546
6,94
8,70
7Lo
ans
and
adva
nces
to c
usto
mer
s12
9,72
3,81
914
4,70
467
9,81
73,
416,
537
710,
455
-13
4,67
5,33
2In
vest
men
t sec
uriti
es2,
596,
623
6,10
1,82
413
,503
,729
16,0
78,4
957,
530,
137
23,6
5245
,834
,460
Oth
er a
sset
s-
--
--
1,96
9,16
71,
969,
167
At
31 D
ecem
ber
201
613
6,53
3,82
08,
041,
099
14,3
49,7
5819
,495
,032
8,24
0,59
214
,339
,032
200,
999,
333
LIA
BIL
ITIE
SDe
posi
ts fr
om b
anks
2,50
6,75
73,
576,
676
1,11
1,06
5-
-60
1,35
87,
795,
856
Item
s in
the
cour
se o
f col
lect
ion
--
--
-7,
517
7,51
7De
posi
ts fr
om c
usto
mer
s34
,807
,683
78,0
04,1
5817
,680
,464
1,07
2,64
9-
14,9
49,4
5214
6,51
4,40
6O
ther
liab
ilitie
s-
--
--
3,27
2,18
73,
272,
187
Long
term
bor
row
ings
78,6
1742
8,11
16,
284,
565
1,83
4,33
713
3,88
6-
8,75
9,51
6Su
bord
inat
ed d
ebt
12,5
84-
265,
798
4,26
6,54
8-
1,75
14,
546,
681
At
31 D
ecem
ber
201
637
,405
,641
82,0
08,9
4525
,341
,892
7,17
3,53
413
3,88
618
,832
,265
170,
896,
163
Inte
rest
rat
e g
ap99
,128
,179
(73,
967,
846 )
(10,
992,
134 )
12,3
21,4
988,
106,
706
( 4,
493,
233 )
30,1
03,1
70

V i b r a n t C o l o r s o f G r o w t h V i b r a n t C o l o r s o f G r o w t h
I&M Holdings Limited Annual Report and Financial Statements | 2016 I&M Holdings Limited Annual Report and Financial Statements | 2016
76 77N
OTE
S TO
TH
E C
ON
SOLI
DATE
D FI
NAN
CIA
L ST
ATEM
ENTS
FOR
THE
YEAR
EN
DED
31 D
ECEM
BER
2016
(Con
tinue
d)
4. R
ISK
MA
NA
GE
ME
NT
(Co
ntin
ued
)
Fina
ncia
l ris
k (C
ont
inue
d)
(c)
Mar
ket
risk
(Co
ntin
ued
)
Exp
osu
re t
o in
tere
st r
ate
risk
- (C
onti
nu
ed)
With
in
1 m
onth
KSh
s’00
0
Due
with
in
1-3
mon
ths
KSh
s’00
0
Due
bet
wee
n 3-
12 m
onth
sK
Shs’
000
Due
bet
wee
n1-
5 ye
ars
KSh
s’00
0
Due
afte
r 5
year
sK
Shs’
000
Non
-inte
rest
be
arin
gK
Shs’
000
Tota
lK
Shs’
000
31 D
ecem
ber
201
5
AS
SE
TS
Cas
h an
d ba
lanc
es w
ith c
entra
l ban
ks-
--
--
9,94
8,12
89,
948,
128
Item
s in
the
cour
se o
f col
lect
ion
--
--
-52
7,59
652
7,59
6Lo
ans
and
adva
nces
to b
anks
1,48
8,83
71,
138,
044
426,
518
--
1,92
8,37
84,
981,
777
Loan
s an
d ad
vanc
es to
cu
stom
ers
112,
709,
381
2,81
5,08
32,
124,
765
7,53
3,38
72,
641,
162
-12
7,82
3,77
8
Inve
stm
ent s
ecur
ities
685,
625
4,64
2,79
615
,619
,390
11,3
52,6
866,
835,
310
-39
,135
,807
Oth
er a
sset
s-
--
--
1,08
3,77
91,
083,
779
At
31 D
ecem
ber
201
511
4,88
3,84
38,
595,
923
18,1
70,6
7318
,886
,073
9,47
6,47
213
,487
,881
183,
500,
865
LIA
BIL
ITIE
SDe
posi
ts fr
om b
anks
2,93
0,66
73,
772,
297
476,
049
--
792,
462
7,97
1,47
5De
posi
ts fr
om c
usto
mer
s33
,487
,049
71,4
94,3
6811
,015
,237
154,
383
39,6
8216
,789
,959
132,
980,
678
Oth
er li
abilit
ies
--
--
-2,
766,
373
2,76
6,37
3Lo
ng te
rm b
orro
win
gs16
,896
1,21
5,16
67,
577,
529
740,
277
25,5
87-
9,57
5,45
5Su
bord
inat
ed d
ebt
--
3,71
8,68
635
5,42
242
0,97
6-
4,49
5,08
4
At
31 D
ecem
ber
201
536
,434
,612
76,4
81,8
3122
,787
,501
1,25
0,08
248
6,24
520
,348
,794
157,
789,
065
Inte
rest
rat
e g
ap78
,449
,231
(67,
885,
908 )
( 4,
616,
828 )
17,6
35,9
918,
990,
227
( 6,
860,
913 )
25,7
11,8
00
Cus
tom
er d
epos
its u
p to
thre
e m
onth
s re
pres
ent c
urre
nt, s
avin
gs a
nd c
all d
epos
it ac
coun
t bal
ance
s, w
hich
pas
t exp
erie
nce
has
show
n to
be
stab
le a
nd o
f a lo
ng te
rm
natu
re.
The
Gro
up’s
oper
atio
ns a
re s
ubje
ct to
the
risk
of in
tere
st ra
te fl
uctu
atio
ns to
the
exte
nt th
at th
e in
tere
st e
arni
ng a
sset
s (in
clud
ing
inve
stm
ents
) and
inte
rest
bea
ring
liabi
litie
s m
atur
e or
re-p
rice
at d
iffer
ent t
imes
or i
n di
fferin
g am
ount
s. R
isk
man
agem
ent a
ctiv
ities
are
aim
ed a
t opt
imis
ing
net i
nter
est i
ncom
e, g
iven
mar
ket i
nter
est
rate
leve
ls c
onsi
sten
t with
the
Gro
up’s
busi
ness
stra
tegi
es.
NOTES TO THE CONSOLIDATED FINANCIAL STATEMENTSFOR THE YEAR ENDED 31 DECEMBER 2016 (Continued)
4. RISK MANAGEMENT (Continued)
Financial risk (Continued)
(c) Market risk (Continued)
Exposure to interest rate risk - (Continued)
Sensitivity Analysis
A change of 200 basis points in interest rates at the reporting date would have increased/decreased equity and profit or loss by the amounts shown below. The analysis assumes that all other variables in particular foreign currency exchange rates remain constant.
Group
Profit or loss Equity net of taxIncrease/decrease
in basis points KShs (‘000)
Increase/decrease
in basis points KShs (‘000)
31 December 2016Assets 3,733,206 2,613,244Liabilities (3,041,278) (2,128,895)
Net position 691,928 484,349
31 December 2015Assets 3,400,260 2,380,182Liabilities (2,748,805) (1,924,164)
Net position 651,455 456,018

V i b r a n t C o l o r s o f G r o w t h V i b r a n t C o l o r s o f G r o w t h
I&M Holdings Limited Annual Report and Financial Statements | 2016 I&M Holdings Limited Annual Report and Financial Statements | 2016
78 79N
OTE
S TO
TH
E C
ON
SOLI
DATE
D FI
NAN
CIA
L ST
ATEM
ENTS
FOR
THE
YEAR
EN
DED
31 D
ECEM
BER
2016
(Con
tinue
d)
4. R
ISK
MA
NA
GE
ME
NT
(Co
ntin
ued
)
Fina
ncia
l ris
k (C
ont
inue
d)
(c)
Mar
ket
risk
(Co
ntin
ued
)
Cu
rren
cy r
isk
The
Gro
up is
exp
osed
to c
urre
ncy
risk
thro
ugh
trans
actio
ns in
fore
ign
curre
ncie
s. T
he G
roup
’s tra
nsac
tiona
l exp
osur
e gi
ves
rise
to fo
reig
n cu
rrenc
y ga
ins
and
loss
es th
at
are
reco
gnis
ed in
the
profi
t or l
oss.
In re
spec
t of m
onet
ary
asse
ts a
nd li
abilit
ies
in fo
reig
n cu
rrenc
ies,
the
Gro
up e
nsur
es th
at it
s ne
t exp
osur
e is
kep
t to
an a
ccep
tabl
e le
vel b
y bu
ying
and
sel
ling
fore
ign
curre
ncie
s at
spo
t rat
es w
hen
cons
ider
ed a
ppro
pria
te. T
he ta
ble
belo
w a
naly
ses
the
curre
ncie
s w
hich
the
Gro
up is
exp
osed
to a
s at
31
Dec
embe
r 201
6 an
d 31
Dec
embe
r 201
5.
USD
KSh
s’00
0G
BP
KSh
s’00
0Eu
roK
Shs’
000
Oth
erK
Shs’
000
Tota
lK
Shs’
000
AS
SE
TS
Cas
h an
d ba
lanc
es w
ith c
entra
l ban
ks1,
287,
506
161,
234
210,
494
1,45
51,
660,
689
Item
s in
the
cour
se o
f col
lect
ion
20,5
68-
66-
20,6
34Lo
ans
and
adva
nces
to b
anks
4,71
8,43
045
0,73
01,
073,
057
239,
764
6,48
1,98
1Lo
ans
and
adva
nces
to c
usto
mer
s51
,141
,774
1,26
9,76
41,
235,
084
253
,646
,624
Oth
er a
sset
s12
4,10
49,
366
-37
413
3,84
4
At
31 D
ecem
ber
201
657
,292
,382
1,89
1,09
42,
518,
701
241,
595
61,9
43,7
72
LIA
BIL
ITIE
S
Depo
sits
from
ban
ks5,
745,
740
41,1
7615
1,79
317
,171
5,95
5,88
0De
posi
ts fr
om c
usto
mer
s33
,503
,152
2,30
9,74
72,
251,
232
188,
967
38,2
53,0
98O
ther
liab
ilitie
s1,
954,
193
18,0
5644
,993
15,8
952,
033,
137
Long
-term
bor
row
ings
6,43
2,25
3-
1,45
2,58
4-
7,88
4,83
7
At
31 D
ecem
ber
201
647
,635
,338
2,36
8,97
93,
900,
602
222,
033
54,1
26,9
52
Net
on
stat
emen
t o
f fi
nanc
ial p
osi
tio
n9,
657,
044
( 4
77,8
85 )
(1,3
81,9
01)
19,5
627,
816,
820
Net
no
tio
nal o
ff b
alan
ce s
heet
po
siti
on
( 9,
875,
162 )
482,
581
1,09
1,10
1(
5,9
79 )
( 8,
307,
459 )
Ove
rall
net
po
siti
on
– 20
16(
21
8,11
8 )4,
696
( 2
90,8
00 )
13,5
83(
49
0,63
9 )
NO
TES
TO T
HE
CO
NSO
LIDA
TED
FIN
ANC
IAL
STAT
EMEN
TSFO
R TH
E YE
AR E
NDE
D 31
DEC
EMBE
R 20
16 (C
ontin
ued)
4. R
ISK
MA
NA
GE
ME
NT
(Co
ntin
ued
)
Fina
ncia
l ris
k (C
ont
inue
d)
(c)
Mar
ket
risk
(Co
ntin
ued
)
Cu
rren
cy r
ate
risk
– (C
onti
nu
ed)
U
SDK
Shs’
000
GB
PK
Shs’
000
Euro
KSh
s’00
0O
ther
KSh
s’00
0To
tal
KSh
s’00
0 A
SS
ET
S
Cas
h an
d ba
lanc
es w
ith c
entra
l ban
ks1,
536,
757
119,
405
132,
713
4,54
41,
793,
419
Item
s in
the
cour
se o
f col
lect
ion
11,0
46-
2,43
6-
13,4
82Lo
ans
and
adva
nces
to b
anks
2,71
8,50
824
4,80
396
3,63
110
9,36
04,
036,
302
Loan
s an
d ad
vanc
es to
cus
tom
ers
50,6
21,2
772,
097,
271
1,57
1,56
6-
54,2
90,1
14O
ther
ass
ets
302,
945
9,86
413
-31
2,82
2
At
31 D
ecem
ber
201
555
,190
,533
2,47
1,34
32,
670,
359
113,
904
60,4
46,1
39
LIA
BIL
ITIE
S
Depo
sits
from
ban
ks6,
199,
000
144,
857
80,0
4713
,972
6,43
7,87
6De
posi
ts fr
om c
usto
mer
s29
,637
,703
1,82
5,24
42,
101,
942
48,1
7633
,613
,065
Oth
er li
abilit
ies
221,
255
21,6
9547
,808
17,1
6430
7,92
2Lo
ng-te
rm b
orro
win
gs8,
239,
752
-1,
254,
450
-9,
494,
202
Subo
rdin
ated
deb
t81
9,41
8-
--
819,
418
At
31 D
ecem
ber
201
545
,117
,128
1,99
1,79
63,
484,
247
79,3
1250
,672
,483
Net
on
stat
emen
t o
f fi
nanc
ial p
osi
tio
n10
,073
,405
479,
547
( 8
13,8
88 )
34,5
929,
773,
656
Net
no
tio
nal o
ff b
alan
ce s
heet
po
siti
on
(10,
117,
893 )
( 4
62,9
21)
497,
058
( 12
,594
)(1
0,09
6,35
0 )
Ove
rall
net
po
siti
on
– 20
15(
4
4,48
8 )16
,626
( 3
16,8
30 )
21,9
98(
322
,694
)

V i b r a n t C o l o r s o f G r o w t h V i b r a n t C o l o r s o f G r o w t h
I&M Holdings Limited Annual Report and Financial Statements | 2016 I&M Holdings Limited Annual Report and Financial Statements | 2016
80 81NOTES TO THE CONSOLIDATED FINANCIAL STATEMENTSFOR THE YEAR ENDED 31 DECEMBER 2016 (Continued)
4. RISK MANAGEMENT (Continued)
Financial risk (Continued)
(c) Market risk (Continued)
Currency rate risk – (Continued)
Sensitivity AnalysisA reasonable possible strengthening or weakening of the USD, GBP, EUR against the Kenya shilling (KShs) would have affected the measurement of financial instruments denominated in foreign currency and effected equity and profit or loss by the amounts shown below. The analysis assumes that all other variables, in particular interest rates remain constant.
Profit or loss Strengthening/
weakening of currency
KShs’000
Equity net of tax Strengthening/
weakening of currency
KShs’000
31 December 2016USD (± 2.5% movement) (5,453 ) (3,817 )GBP (± 2.5% movement) 117 82EUR (± 2.5% movement) (7,270 ) (5,089 )
31 December 2015USD (± 2.5% movement) (1,112 ) ( 779)GBP (± 2.5% movement) 416 291EUR (± 2.5% movement) (7,921) (5,545)
(d) Operational riskThe overall responsibility of managing Operational Risks - the risk arising from failed or inadequate internal processes, people, systems and external events - is vested with the Board of Directors of the individual banking entities within the Group. These Boards, through their respective Board Risk Committees, issue policies that guide management on appropriate practices of operational risk mitigation. An independent Risk Manager at each of the individual Banking entity assures its respective Board Risk Committee of the implementation of the said policies.
The following are key measures that the group undertakes in managing operational risk:
• Documentation of procedures and controls, including regular review and updates to reflect changes in the dynamic business environment.• Appropriate segregation of duties, including the independent authorisation of transactions • Reconciliation and monitoring of transactions • Compliance with regulatory and other legal requirements• Reporting of operational losses and ensuring appropriate remedial action to avoid recurrence. • Development and implementation of Business Continuity and Disaster Recovery Plans • Training and professional development of employees to ensure they are well equipped to identify and mitigate
operational risks in a timely manner.• Establishment of ethical practices at business and individual employee’s level. • Implementation of risk mitigation parameters, including insurance where this is considered effective.
NOTES TO THE CONSOLIDATED FINANCIAL STATEMENTSFOR THE YEAR ENDED 31 DECEMBER 2016 (Continued)
4. RISK MANAGEMENT (Continued)
Financial risk (Continued)
(d) Operational risk (Continued)The entire operational risk management framework is subjected to periodic independent audits (internal) in order for the Group to obtain an independent opinion on the effectiveness and efficiency of the framework. Further, the findings of the Internal Audit department are reviewed by their respective Board Audit Committees and recommendations made implemented in line with the agreed timeframe.
(e) Capital management
Regulatory capital – Kenya The Central Bank of Kenya sets and monitors capital requirements for all banks.
The objective of the Central Bank of Kenya is to ensure that a bank maintains a level of capital which:
• Is adequate to protect its depositors and creditors; • Is commensurate with the risks associated with its activities and profile • Promotes public confidence in the bank.
In implementing current capital requirements, the Central Bank of Kenya requires banks to maintain a prescribed ratio of total capital to total risk-weighted assets. Banks are expected to assess the Credit risk, Market risk and the Operational risk of the risk weighted assets to derive the ratios. The Capital adequacy and use of regulatory capital are monitored regularly by management employing techniques based on the guidelines developed by the Basel Committee, as implemented by the Central Bank of Kenya for supervisory purposes.
The Central Bank of Kenya requires a bank to maintain at all times:
• The minimum level of regulatory capital of KShs 1 billion• A core capital of not less than 10.5% of total risk weighted assets, plus risk weighted off-balance sheet
items • A core capital of not less than 10.5% of its total deposit liabilities• A total capital of not less than 14.5% of its total risk weighted assets, plus risk weighted off-balance sheet items
The bank’s regulatory capital is analysed into two tiers:
• Tier 1 capital. This includes ordinary share capital, share premium, retained earnings and after deduction of investment in subsidiaries, goodwill, other intangible assets and other regulatory adjustments relating to items that are included in equity which are treated differently for capital adequacy purposes.
• Tier 2 capital. This includes 25% of revaluation reserves of property, subordinated debt not exceeding 50% of core
capital, collective impairment allowances and any other approved reserves.
The risk based approach to capital adequacy measurement is applied to both on and off balance sheet items. Risk weights are assigned based on an assessment of the following:
• Credit risk arising from the possibility of losses associated with reduction of credit quality of borrowers or counterparties;
• Market risk is the risk of losses arising from movements in market prices pertaining to interest rate related instruments and foreign exchange risk;
• Operational risk is the risk of loss resulting from inadequate or failed internal processes, people and systems or from external events.

V i b r a n t C o l o r s o f G r o w t h V i b r a n t C o l o r s o f G r o w t h
I&M Holdings Limited Annual Report and Financial Statements | 2016 I&M Holdings Limited Annual Report and Financial Statements | 2016
82 83NOTES TO THE CONSOLIDATED FINANCIAL STATEMENTSFOR THE YEAR ENDED 31 DECEMBER 2016 (Continued)
4. RISK MANAGEMENT (Continued)
Financial risk (Continued)
(e) Capital management (Continued)
Regulatory capital – Kenya (Continued)
The regulatory capital position for I&M Bank LIMITED being the Kenyan banking subsidiary was as follows:
2016 2015KShs’000 KShs’000
Core capital (Tier 1)
Share capital 2,880,245 2,880,245Share premium 3,773,237 3,773,237Retained earnings 20,366,110 19,413,194
27,019,592 26,066,676
Less: Goodwill ( 10,747 ) ( 10,747 ) Investment in subsidiary ( 2,324,025 ) ( 1,122,911 )
Total Core capital 24,684,820 24,933,018
Supplementary capital (Tier 2)
Term subordinated debt 1,619,048 2,359,762Statutory loan loss reserve 630,390 625,190
2,249,438 2,984,952
Total capital 26,934,258 27,917,970
Risk weighted assets
Credit risk weighted assets 120,665,480 116,332,346Market risk weighted assets 7,132,108 5,163,855Operational risk weighted assets 20,585,426 20,585,426
Total risk weighted assets 148,383,014 142,081,627
Deposits from customers 118,553,272 104,467,260
Capital ratios Minimum*
Core capital/Total deposit liabilities 8.0% 20.82% 23.87%
Core capital /Total risk weighted assets 10.50% 16.64% 17.55%
Total capital /Total risk weighted assets 14.50% 18.15% 19.65%
* As defined by the Central Bank of Kenya
NOTES TO THE CONSOLIDATED FINANCIAL STATEMENTSFOR THE YEAR ENDED 31 DECEMBER 2016 (Continued)
4. RISK MANAGEMENT (Continued)
Financial risk (Continued)
(e) Capital management (Continued)
Regulatory capital – Tanzania
The Bank of Tanzania sets and monitors capital requirements for the banking industry as a whole. The Bank of Tanzania has set among other measures, the rules and ratios to monitor adequacy of a bank’s capital. In implementing current capital requirements, The Bank of Tanzania requires banks to maintain a prescribed ratio of total capital to total risk-weighted assets. The Bank’s regulatory is analysed in two tiers:
• Tier 1 capital, which includes ordinary share capital, share premium, retained earnings, after deductions for prepaid expenses, goodwill, other intangible assets, and other regulatory adjustments relating to items that are included in equity but are treated differently for capital adequacy purposes.
• Tier 2 capital, which includes qualifying subordinated liabilities, collective impairment allowances and the element of fair value reserve relating to unrealized gains on equity instruments classified as available for sale.
Various limits are applied to elements of the capital base such as qualifying Tier 2 Capital cannot exceed Tier 1 Capital and qualifying subordinated debt may not exceed 50 percent of Tier 1 Capital. There are also restrictions on the amount of collective impairment allowances that may be included as part of Tier 2 Capital. Tier 1 Capital (Core capital) is also subjected to various limits such as Tier 1 Capital should not be less than 10 percent of the risk weighted assets and premises investments should not exceed 50 percent of the Core capital and movable assets should not exceed 20% of Core capital.
The Bank’s policy is to maintain a strong capital base so as to maintain investor, creditor and market confidence and to sustain future development of business. The impact of the level of capital of shareholders’ return is also recognized in addition to recognizing the need to maintain a balance between the higher returns that may be possible with greater gearing and the advantages and security afforded by sound capital position.
2016 2015TZS’000 TZS’000
Core capital (Tier 1)
Share capital 2,792,000 2,395,000Share premium 17,995,751 7,482,000Retained earnings 29,866,396 26,755,321
50,654,147 36,632,321
Less: Prepaid expenses ( 1,486,052) ( 1,605,975) Deferred tax asset ( 2,176,943) ( 1,668,842) Intangible assets ( 933,662) ( 1,170,338)
Total Core capital 46,057,490 32,187,166
Supplementary capital (Tier 2)
Term subordinated debt 15,696,000 16,093,583General provisions in equity 1,125,971 310,525Other general provision 1,577,979 2,092,995
18,399,950 18,497,103
Total capital 64,457,440 50,684,269
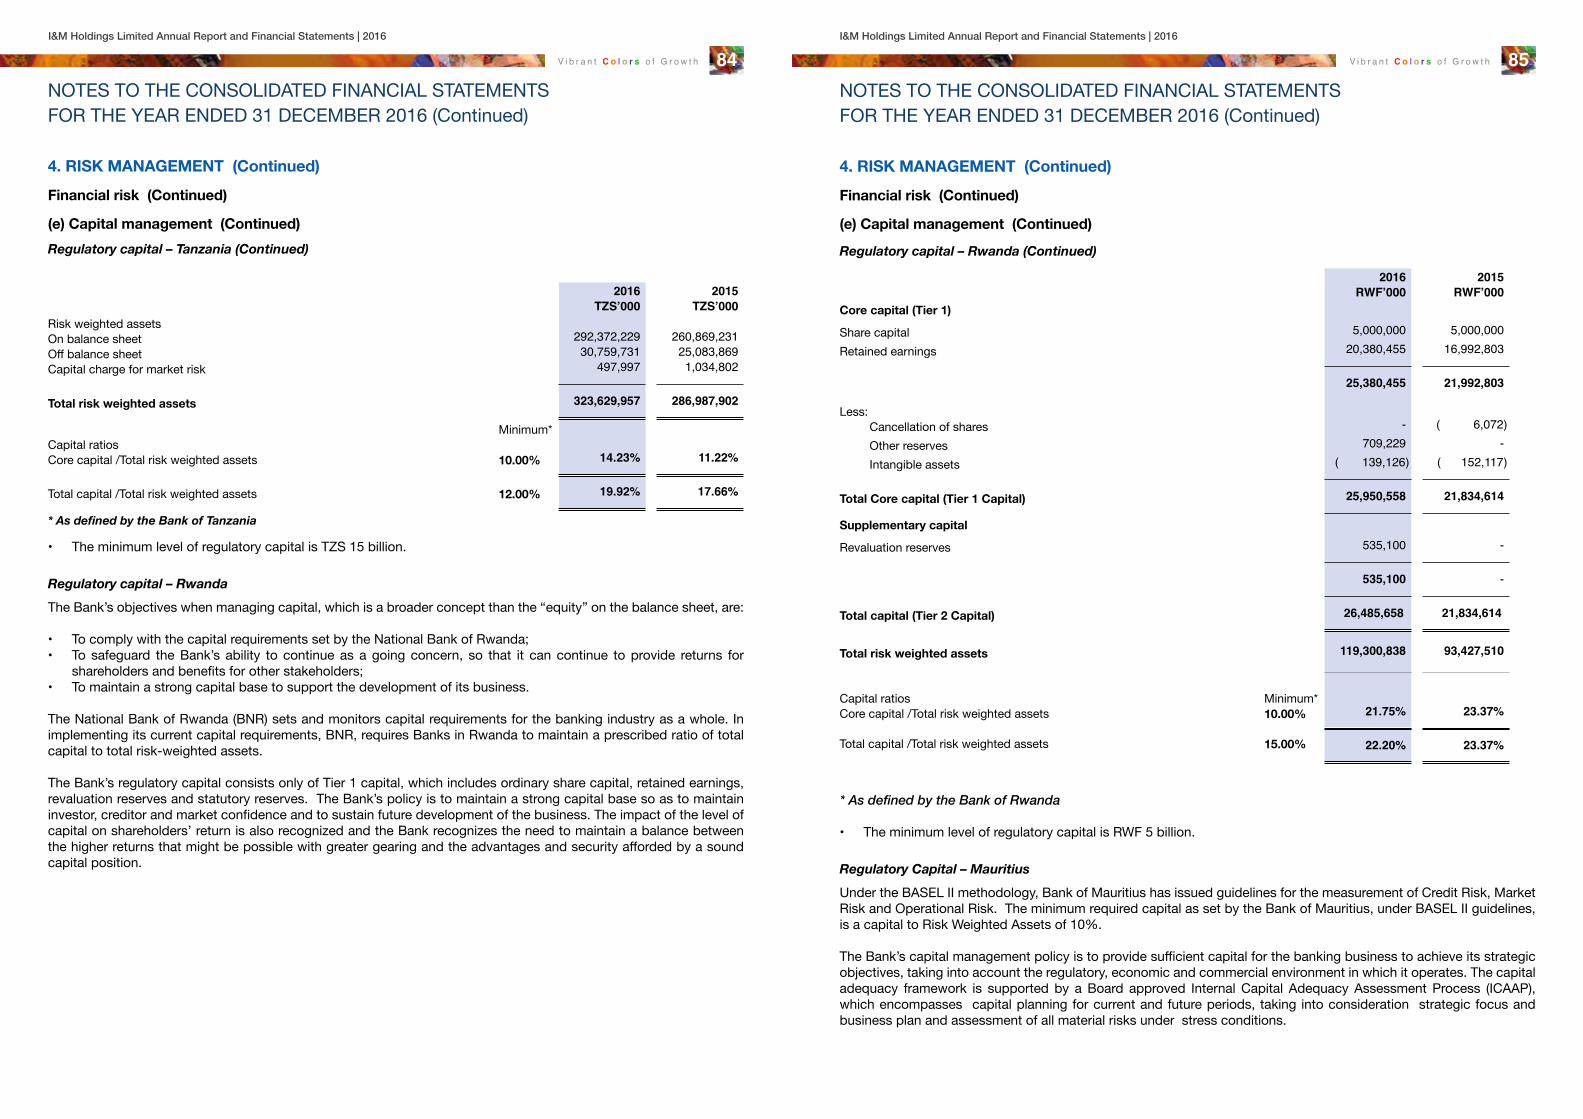
V i b r a n t C o l o r s o f G r o w t h V i b r a n t C o l o r s o f G r o w t h
I&M Holdings Limited Annual Report and Financial Statements | 2016 I&M Holdings Limited Annual Report and Financial Statements | 2016
84 85NOTES TO THE CONSOLIDATED FINANCIAL STATEMENTSFOR THE YEAR ENDED 31 DECEMBER 2016 (Continued)
4. RISK MANAGEMENT (Continued)
Financial risk (Continued)
(e) Capital management (Continued)
Regulatory capital – Tanzania (Continued)
2016 2015TZS’000 TZS’000
Risk weighted assetsOn balance sheet 292,372,229 260,869,231Off balance sheet 30,759,731 25,083,869Capital charge for market risk 497,997 1,034,802
Total risk weighted assets 323,629,957 286,987,902
Minimum*Capital ratiosCore capital /Total risk weighted assets 10.00% 14.23% 11.22%
Total capital /Total risk weighted assets 12.00% 19.92% 17.66%
* As defined by the Bank of Tanzania • The minimum level of regulatory capital is TZS 15 billion.
Regulatory capital – Rwanda
The Bank’s objectives when managing capital, which is a broader concept than the “equity” on the balance sheet, are:
• To comply with the capital requirements set by the National Bank of Rwanda; • To safeguard the Bank’s ability to continue as a going concern, so that it can continue to provide returns for
shareholders and benefits for other stakeholders; • To maintain a strong capital base to support the development of its business.
The National Bank of Rwanda (BNR) sets and monitors capital requirements for the banking industry as a whole. In implementing its current capital requirements, BNR, requires Banks in Rwanda to maintain a prescribed ratio of total capital to total risk-weighted assets.
The Bank’s regulatory capital consists only of Tier 1 capital, which includes ordinary share capital, retained earnings, revaluation reserves and statutory reserves. The Bank’s policy is to maintain a strong capital base so as to maintain investor, creditor and market confidence and to sustain future development of the business. The impact of the level of capital on shareholders’ return is also recognized and the Bank recognizes the need to maintain a balance between the higher returns that might be possible with greater gearing and the advantages and security afforded by a sound capital position.
NOTES TO THE CONSOLIDATED FINANCIAL STATEMENTSFOR THE YEAR ENDED 31 DECEMBER 2016 (Continued)
4. RISK MANAGEMENT (Continued)
Financial risk (Continued)
(e) Capital management (Continued)
Regulatory capital – Rwanda (Continued)
2016 2015RWF’000 RWF’000
Core capital (Tier 1)
Share capital 5,000,000 5,000,000Retained earnings 20,380,455 16,992,803
25,380,455 21,992,803
Less: Cancellation of shares - ( 6,072) Other reserves 709,229 - Intangible assets ( 139,126) ( 152,117)
Total Core capital (Tier 1 Capital) 25,950,558 21,834,614
Supplementary capital
Revaluation reserves 535,100 -
535,100 -
Total capital (Tier 2 Capital) 26,485,658 21,834,614
Total risk weighted assets 119,300,838 93,427,510
Capital ratios Minimum*Core capital /Total risk weighted assets 10.00% 21.75% 23.37%
Total capital /Total risk weighted assets 15.00% 22.20% 23.37%
* As defined by the Bank of Rwanda
• The minimum level of regulatory capital is RWF 5 billion.
Regulatory Capital – Mauritius
Under the BASEL II methodology, Bank of Mauritius has issued guidelines for the measurement of Credit Risk, Market Risk and Operational Risk. The minimum required capital as set by the Bank of Mauritius, under BASEL II guidelines, is a capital to Risk Weighted Assets of 10%.
The Bank’s capital management policy is to provide sufficient capital for the banking business to achieve its strategic objectives, taking into account the regulatory, economic and commercial environment in which it operates. The capital adequacy framework is supported by a Board approved Internal Capital Adequacy Assessment Process (ICAAP), which encompasses capital planning for current and future periods, taking into consideration strategic focus and business plan and assessment of all material risks under stress conditions.
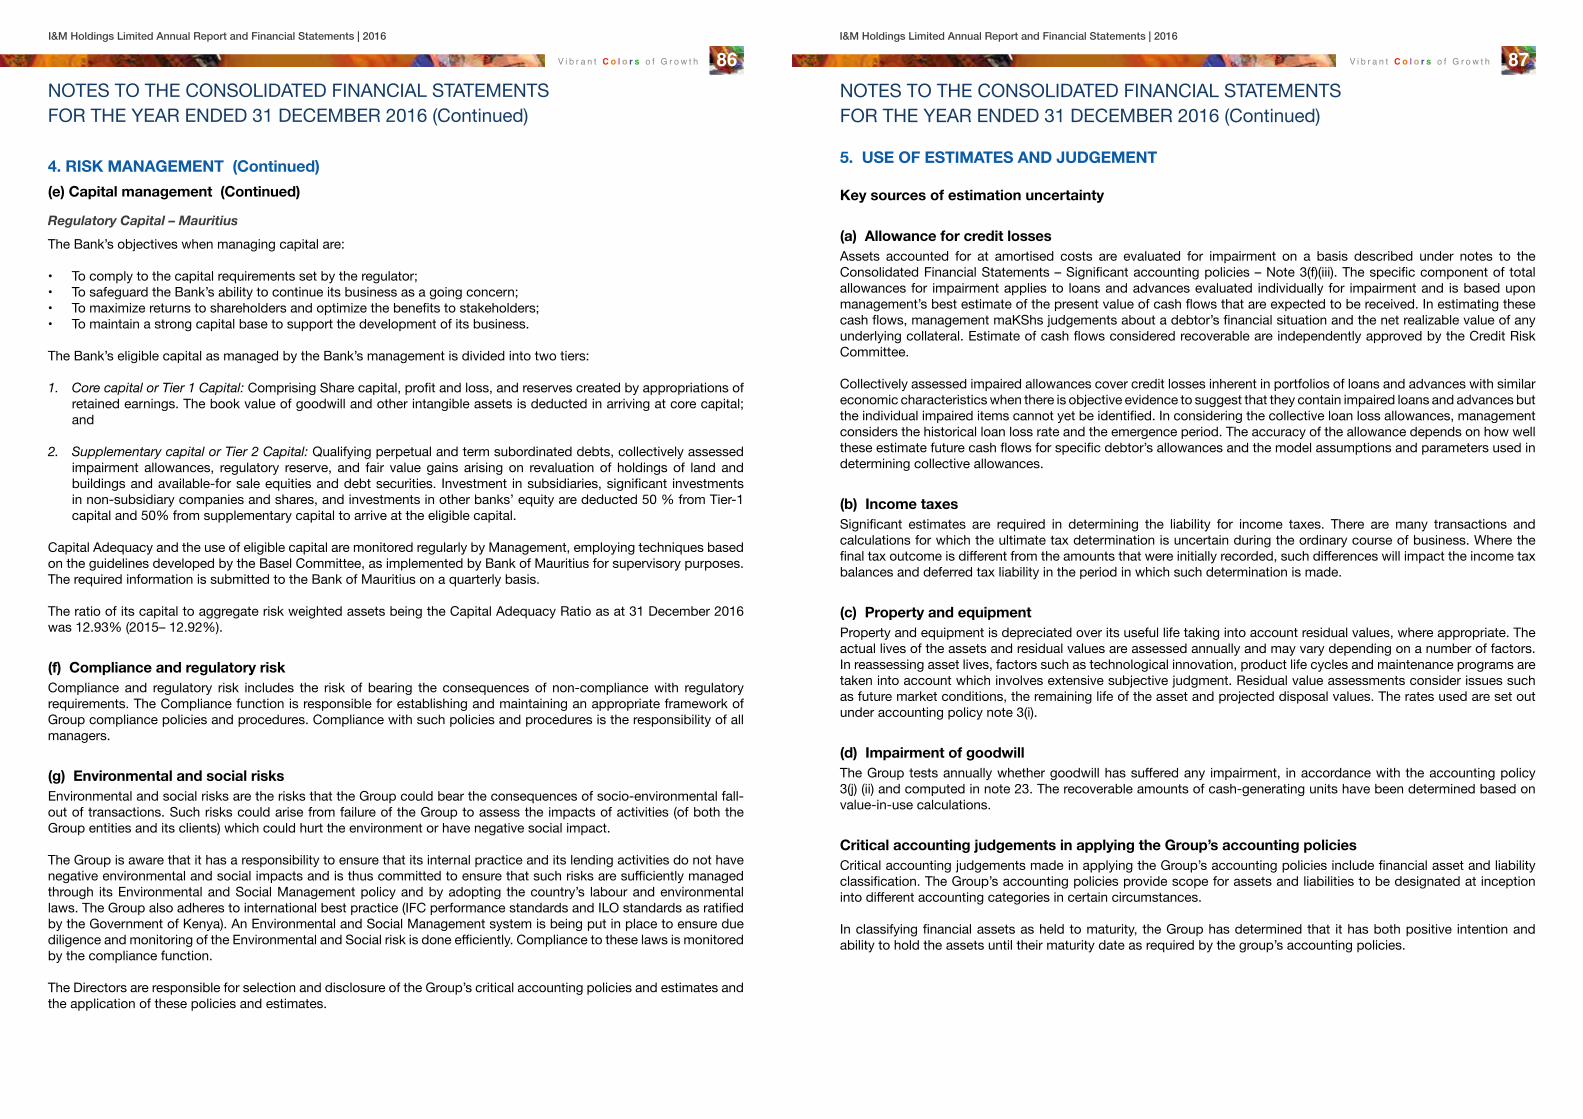
V i b r a n t C o l o r s o f G r o w t h V i b r a n t C o l o r s o f G r o w t h
I&M Holdings Limited Annual Report and Financial Statements | 2016 I&M Holdings Limited Annual Report and Financial Statements | 2016
86 87NOTES TO THE CONSOLIDATED FINANCIAL STATEMENTSFOR THE YEAR ENDED 31 DECEMBER 2016 (Continued)
4. RISK MANAGEMENT (Continued)
(e) Capital management (Continued)
Regulatory Capital – Mauritius
The Bank’s objectives when managing capital are:
• To comply to the capital requirements set by the regulator;• To safeguard the Bank’s ability to continue its business as a going concern;• To maximize returns to shareholders and optimize the benefits to stakeholders;• To maintain a strong capital base to support the development of its business.
The Bank’s eligible capital as managed by the Bank’s management is divided into two tiers:
1. Core capital or Tier 1 Capital: Comprising Share capital, profit and loss, and reserves created by appropriations of retained earnings. The book value of goodwill and other intangible assets is deducted in arriving at core capital; and
2. Supplementary capital or Tier 2 Capital: Qualifying perpetual and term subordinated debts, collectively assessed impairment allowances, regulatory reserve, and fair value gains arising on revaluation of holdings of land and buildings and available-for sale equities and debt securities. Investment in subsidiaries, significant investments in non-subsidiary companies and shares, and investments in other banks’ equity are deducted 50 % from Tier-1 capital and 50% from supplementary capital to arrive at the eligible capital.
Capital Adequacy and the use of eligible capital are monitored regularly by Management, employing techniques based on the guidelines developed by the Basel Committee, as implemented by Bank of Mauritius for supervisory purposes. The required information is submitted to the Bank of Mauritius on a quarterly basis.
The ratio of its capital to aggregate risk weighted assets being the Capital Adequacy Ratio as at 31 December 2016 was 12.93% (2015– 12.92%).
(f) Compliance and regulatory riskCompliance and regulatory risk includes the risk of bearing the consequences of non-compliance with regulatory requirements. The Compliance function is responsible for establishing and maintaining an appropriate framework of Group compliance policies and procedures. Compliance with such policies and procedures is the responsibility of all managers.
(g) Environmental and social risksEnvironmental and social risks are the risks that the Group could bear the consequences of socio-environmental fall-out of transactions. Such risks could arise from failure of the Group to assess the impacts of activities (of both the Group entities and its clients) which could hurt the environment or have negative social impact.
The Group is aware that it has a responsibility to ensure that its internal practice and its lending activities do not have negative environmental and social impacts and is thus committed to ensure that such risks are sufficiently managed through its Environmental and Social Management policy and by adopting the country’s labour and environmental laws. The Group also adheres to international best practice (IFC performance standards and ILO standards as ratified by the Government of Kenya). An Environmental and Social Management system is being put in place to ensure due diligence and monitoring of the Environmental and Social risk is done efficiently. Compliance to these laws is monitored by the compliance function.
The Directors are responsible for selection and disclosure of the Group’s critical accounting policies and estimates and the application of these policies and estimates.
NOTES TO THE CONSOLIDATED FINANCIAL STATEMENTSFOR THE YEAR ENDED 31 DECEMBER 2016 (Continued)
5. USE OF ESTIMATES AND JUDGEMENT
Key sources of estimation uncertainty
(a) Allowance for credit lossesAssets accounted for at amortised costs are evaluated for impairment on a basis described under notes to the Consolidated Financial Statements – Significant accounting policies – Note 3(f)(iii). The specific component of total allowances for impairment applies to loans and advances evaluated individually for impairment and is based upon management’s best estimate of the present value of cash flows that are expected to be received. In estimating these cash flows, management maKShs judgements about a debtor’s financial situation and the net realizable value of any underlying collateral. Estimate of cash flows considered recoverable are independently approved by the Credit Risk Committee.
Collectively assessed impaired allowances cover credit losses inherent in portfolios of loans and advances with similar economic characteristics when there is objective evidence to suggest that they contain impaired loans and advances but the individual impaired items cannot yet be identified. In considering the collective loan loss allowances, management considers the historical loan loss rate and the emergence period. The accuracy of the allowance depends on how well these estimate future cash flows for specific debtor’s allowances and the model assumptions and parameters used in determining collective allowances.
(b) Income taxesSignificant estimates are required in determining the liability for income taxes. There are many transactions and calculations for which the ultimate tax determination is uncertain during the ordinary course of business. Where the final tax outcome is different from the amounts that were initially recorded, such differences will impact the income tax balances and deferred tax liability in the period in which such determination is made.
(c) Property and equipmentProperty and equipment is depreciated over its useful life taking into account residual values, where appropriate. The actual lives of the assets and residual values are assessed annually and may vary depending on a number of factors. In reassessing asset lives, factors such as technological innovation, product life cycles and maintenance programs are taken into account which involves extensive subjective judgment. Residual value assessments consider issues such as future market conditions, the remaining life of the asset and projected disposal values. The rates used are set out under accounting policy note 3(i).
(d) Impairment of goodwillThe Group tests annually whether goodwill has suffered any impairment, in accordance with the accounting policy 3(j) (ii) and computed in note 23. The recoverable amounts of cash-generating units have been determined based on value-in-use calculations.
Critical accounting judgements in applying the Group’s accounting policiesCritical accounting judgements made in applying the Group’s accounting policies include financial asset and liability classification. The Group’s accounting policies provide scope for assets and liabilities to be designated at inception into different accounting categories in certain circumstances.
In classifying financial assets as held to maturity, the Group has determined that it has both positive intention and ability to hold the assets until their maturity date as required by the group’s accounting policies.

V i b r a n t C o l o r s o f G r o w t h V i b r a n t C o l o r s o f G r o w t h
I&M Holdings Limited Annual Report and Financial Statements | 2016 I&M Holdings Limited Annual Report and Financial Statements | 2016
88 89N
OTE
S TO
TH
E C
ON
SOLI
DATE
D FI
NAN
CIA
L ST
ATEM
ENTS
FO
R TH
E YE
AR E
NDE
D 31
DEC
EMBE
R 20
16 (C
ontin
ued)
6. F
AIR
VA
LUE
HE
IRA
RC
HY
FO
R A
SS
ET
S C
AR
RIE
D A
T F
AIR
VA
LUE
Acc
oun
ting
cla
ssifi
cati
ons
and
fai
r va
lues
The
tabl
es b
elow
sho
w th
e ca
rryin
g am
ount
s an
d fa
ir va
lues
of fi
nanc
ial a
sset
s an
d fin
anci
al lia
bilit
ies,
incl
udin
g th
eir l
evel
s in
the
fair
valu
e hi
erar
chy.
It do
es n
ot in
clud
e fa
ir va
lue
info
rmat
ion
for fi
nanc
ial a
sset
s an
d fin
anci
al li
abilit
ies
not m
easu
red
at fa
ir va
lue
if th
e ca
rryin
g am
ount
is a
reas
onab
le a
ppro
xim
atio
n of
fair
valu
e.
Acc
oun
ting
cla
ssifi
cati
ons
at
carr
ying
am
oun
ts a
nd f
air
valu
es
Gro
upC
arry
ing
amou
nts
Fair
valu
e31
Dec
emb
er 2
016
Hel
d to
mat
urity
KSh
s‘00
0
Loan
s an
dre
ceiv
able
sK
Shs‘
000
Avai
labl
efo
r sal
eK
Shs‘
000
Oth
er
amor
tized
cost
KSh
s‘00
0
Oth
er
finan
cial
liabi
litie
sK
Shs‘
000
Tota
lK
Shs‘
000
Leve
l 1K
Shs‘
000
Leve
l 3
KSh
s‘00
0
Fina
ncia
l ass
ets
Cas
h an
d ba
lanc
es w
ith c
entra
l ban
ks
-11
,083
,876
--
-11
,083
,876
--
Item
s in
the
cour
se o
f col
lect
ion
--
-48
7,79
1-
487,
791
--
Inve
stm
ent s
ecur
ities
23,7
75,5
42-
22,0
58,9
18-
-45
,834
,460
22,0
35,2
6623
,652
Loan
s an
d ad
vanc
es to
ban
ks-
6,94
8,70
7-
--
6,94
8,70
7-
-Lo
ans
and
adva
nces
to c
usto
mer
s-
134,
675,
332
--
-13
4,67
5,33
2-
-O
ther
ass
ets
--
-52
5,76
4-
525,
764
--
23,7
75,5
4215
2,70
7,91
522
,058
,918
1,01
3,55
5-
199,
555,
930
22,0
35,2
6623
,652
Fina
ncia
l lia
bili
ties
Depo
sits
from
ban
ks-
--
-7,
795,
856
7,79
5,85
6-
-Ite
ms
in th
e co
urse
of c
olle
ctio
n-
--
-7,
517
7,51
7-
-De
posi
ts fr
om c
usto
mer
s-
--
-14
6,51
4,40
614
6,51
4,40
6-
-Lo
ng te
rm b
orro
win
gs-
--
-8,
759,
516
8,75
9,51
6-
-Su
bord
inat
ed d
ebt
--
--
4,54
6,68
14,
546,
681
--
--
--
167,
623,
976
167,
623,
976
--
NO
TES
TO T
HE
CO
NSO
LIDA
TED
FIN
ANC
IAL
STAT
EMEN
TS
FOR
THE
YEAR
EN
DED
31 D
ECEM
BER
2016
(Con
tinue
d)
6. F
INA
NC
IAL
AS
SE
TS
AN
D L
IAB
ILIT
IES
(Co
ntin
ued
)
Acc
oun
ting
cla
ssifi
cati
ons
at
carr
ying
am
oun
ts a
nd f
air
valu
es –
Co
ntin
ued
Gro
up
31 D
ecem
ber
201
5C
arry
ing
amou
nts
Fair
valu
e
Hel
d to
mat
urity
KSh
s‘00
0
Loan
s an
dre
ceiv
able
sK
Shs‘
000
Avai
labl
efo
r sal
eK
Shs‘
000
Oth
er
amor
tized
cost
KSh
s‘00
0
Oth
er
finan
cial
liabi
litie
sK
Shs‘
000
Tota
lK
Shs‘
000
Leve
l 1K
Shs‘
000
Leve
l 3
KSh
s‘00
0
Fina
ncia
l ass
ets
Cas
h an
d ba
lanc
es w
ith c
entra
l ban
ks
-9,
948,
128
--
-9,
948,
128
--
Item
s in
the
cour
se o
f col
lect
ion
--
-52
7,59
6-
527,
596
--
Inve
stm
ent s
ecur
ities
22,0
66,6
67-
17,0
69,1
40-
-39
,135
,807
17,0
45,4
3023
,710
Loan
s an
d ad
vanc
es to
ban
ks-
4,98
1,77
7-
--
4,98
1,77
7-
-Lo
ans
and
adva
nces
to c
usto
mer
s-
127,
823,
778
--
-12
7,82
3,77
8-
-
22
,066
,667
142,
753,
683
17,0
69,1
4052
7,59
6-
182,
417,
086
17,0
45,4
3023
,710
Fina
ncia
l lia
bili
ties
Depo
sits
from
ban
ks-
--
-7,
971,
475
7,97
1,47
5-
-De
posi
ts fr
om c
usto
mer
s-
--
-13
2,98
0,67
813
2,98
0,67
8-
-Lo
ng te
rm b
orro
win
gs-
--
-9,
575,
455
9,57
5,45
5-
-Su
bord
inat
ed d
ebt
--
--
4,49
5,08
44,
495,
084
--
Oth
er li
abilit
ies
--
--
133,
241
133,
241
--
-
--
-15
5,15
5,93
315
5,15
5,93
3-
-
Mea
sure
men
t o
f fa
ir v
alue
s
(i) V
alua
tion
tech
niq
ues
and
sig
nific
ant
unob
serv
able
inp
uts
Fina
ncia
l ass
ets
mea
sure
d a
t fa
ir v
alue
- A
t 31
Dec
emb
er 2
016
and
31
Dec
emb
er 2
015
Typ
eVa
luat
ion
tech
niq
ueS
igni
fica
nt u
nob
serv
able
inp
uts
Inte
r-re
lati
ons
hip
bet
wee
n si
gni
fica
nt u
nob
serv
able
in
put
s an
d f
air
valu
e m
easu
rem
ent
Inve
stm
ent s
ecur
ities
– A
FSPr
ices
quo
ted
in a
n ac
tive
mar
ket
Non
eN
ot a
pplic
able

V i b r a n t C o l o r s o f G r o w t h V i b r a n t C o l o r s o f G r o w t h
I&M Holdings Limited Annual Report and Financial Statements | 2016 I&M Holdings Limited Annual Report and Financial Statements | 2016
90 91N
OTE
S TO
TH
E C
ON
SOLI
DATE
D FI
NAN
CIA
L ST
ATEM
ENTS
FO
R TH
E YE
AR E
NDE
D 31
DEC
EMBE
R 20
16 (C
ontin
ued)
7. O
PE
RAT
ING
SE
GM
EN
TS
The
Gro
up o
pera
tions
are
with
in fi
ve g
eogr
aphi
cal s
egm
ents
, Ken
ya, T
anza
nia,
Rw
anda
, Uga
nda
and
Mau
ritiu
s. T
he ta
ble
belo
w c
onta
ins
segm
enta
l inf
orm
atio
n fo
r th
e ye
ar e
nded
31
Dece
mbe
r 201
6.
2016
Ken
yaK
Shs’
000
Tanz
ania
KSh
s’00
0R
wan
daK
Shs’
000
Mau
ritiu
sK
Shs’
000
Uga
nda
KSh
s’00
0A
djus
tmen
tsK
Shs’
000
Tota
lK
Shs’
000
Net
inte
rest
inco
me
12,5
62,0
511,
019,
508
1,90
7,36
8-
-32
,749
15,5
21,6
76N
et fe
e co
mm
issi
on a
nd o
ther
inco
me
3,85
8,10
931
0,27
690
6,18
0-
2,87
3(
28
7,11
9)4,
790,
319
Shar
e of
join
t ven
ture
pro
fits
--
-44
3,96
8-
-44
3,96
8
Op
erat
ing
inco
me
16,4
20,1
601,
329,
784
2,81
3,54
844
3,96
82,
873
(
254,
370 )
20,7
55,9
63
Ope
ratin
g ex
pens
es(
4,5
29,6
31 )
(
778,
178 )
( 1,
537,
307 )
-(6
,885
)14
5,18
0(
6,
706,
821)
Depr
ecia
tion
and
amor
tisat
ion
(
329
,498
)(
6
2,68
7 )(
9
6,77
2 )-
(
18 )
-(
488,
975 )
Net
impa
irmen
t los
ses
on lo
ans
and
adva
nces
( 2
,778
,703
)(
10
5,37
8 )(
7
2,89
8 )-
--
(
2,95
6,97
9 )
Pro
fit
bef
ore
inco
me
tax
8,87
7,32
838
3,54
11,
106,
570
437,
675
(4,0
30 )
(
197,
496 )
10,6
03,1
88
Pro
fit
afte
r ta
x6,
501,
825
258,
172
763,
094
437,
675
(3,1
26 )
(
197,
478 )
7,76
0,16
2
Loan
s an
d a
dva
nces
to
cus
tom
ers
106,
585,
738
14,1
11,1
2513
,978
,469
--
-13
4,67
5,33
2
Dep
osi
ts f
rom
cus
tom
ers
116,
169,
431
13,4
66,6
3616
,881
,465
--
(
3
,126
)14
6,51
4,40
6
Tota
l ass
ets
188,
723,
305
19,9
11,9
8325
,979
,415
3,02
2,28
75,
808
(26,
534,
902 )
210,
542,
393
Tota
l lia
bili
ties
132,
119,
752
17,4
39,3
1322
,151
,030
7,43
01,
524
(
683,
073 )
171,
035,
976
Cap
ital
exp
end
itur
e70
0,93
322
,205
215,
954
--
-93
8,99
2
NO
TES
TO T
HE
CO
NSO
LIDA
TED
FIN
ANC
IAL
STAT
EMEN
TS
FOR
THE
YEAR
EN
DED
31 D
ECEM
BER
2016
(Con
tinue
d)
7. O
PE
RAT
ING
SE
GM
EN
TS
(Co
ntin
ued
)
2015
Ken
yaK
Shs’
000
Tanz
ania
KSh
s’00
0R
wan
daK
Shs’
000
Mau
ritiu
sK
Shs’
000
Adj
ustm
ents
KSh
s’00
0To
tal
KSh
s’00
0
Net
inte
rest
inco
me
10,0
87,8
7995
6,24
51,
603,
041
--
12,6
47,1
65N
et fe
e, c
omm
issi
on a
nd o
ther
inco
me
3,06
7,11
036
8,55
21,
156,
114
--
4,59
1,77
6Sh
are
of J
oint
Ven
ture
pro
fits
--
-32
3,46
3-
323,
463
Op
erat
ing
inco
me
13,1
54,9
891,
324,
797
2,75
9,15
532
3,46
3-
17,5
62,4
04
Ope
ratin
g ex
pens
es(
3,8
13,4
69 )
(
697,
960 )
( 1,
399,
800 )
--
( 5
,911
,229
)De
prec
iatio
n an
d am
ortis
atio
n(
3
36,5
59 )
(
58,
472 )
(
105,
988 )
--
(
501
,019
)Im
pairm
ent
on lo
ans
and
adva
nces
(
553
,130
)(
14
1,95
9 )(
28
7,40
6 )-
-(
9
82,4
95 )
Pro
fit
bef
ore
inco
me
tax
8,45
1,83
142
6,40
696
5,96
132
3,46
310
,167
,661
Pro
fit
afte
r ta
x5,
835,
459
320,
201
665,
288
323,
463
-7,
144,
411
Loan
s an
d a
dva
nces
to
cus
tom
ers
102,
188,
164
12,7
39,0
8412
,896
,530
--
127,
823,
778
Dep
osi
ts f
rom
cus
tom
ers
103,
487,
284
13,0
50,6
9116
,442
,703
--
132,
980,
678
Tota
l ass
ets
171,
911,
378
17,7
59,0
1122
,497
,187
-(2
0,51
0,73
9 )19
1,65
6,83
7
Tota
l lia
bili
ties
12
4,19
5,96
016
,499
,996
20,2
19,2
48-
( 2,
979,
666 )
157,
935,
538
Cap
ital
exp
end
itur
e44
3,95
011
8,07
992
,494
--
654,
523
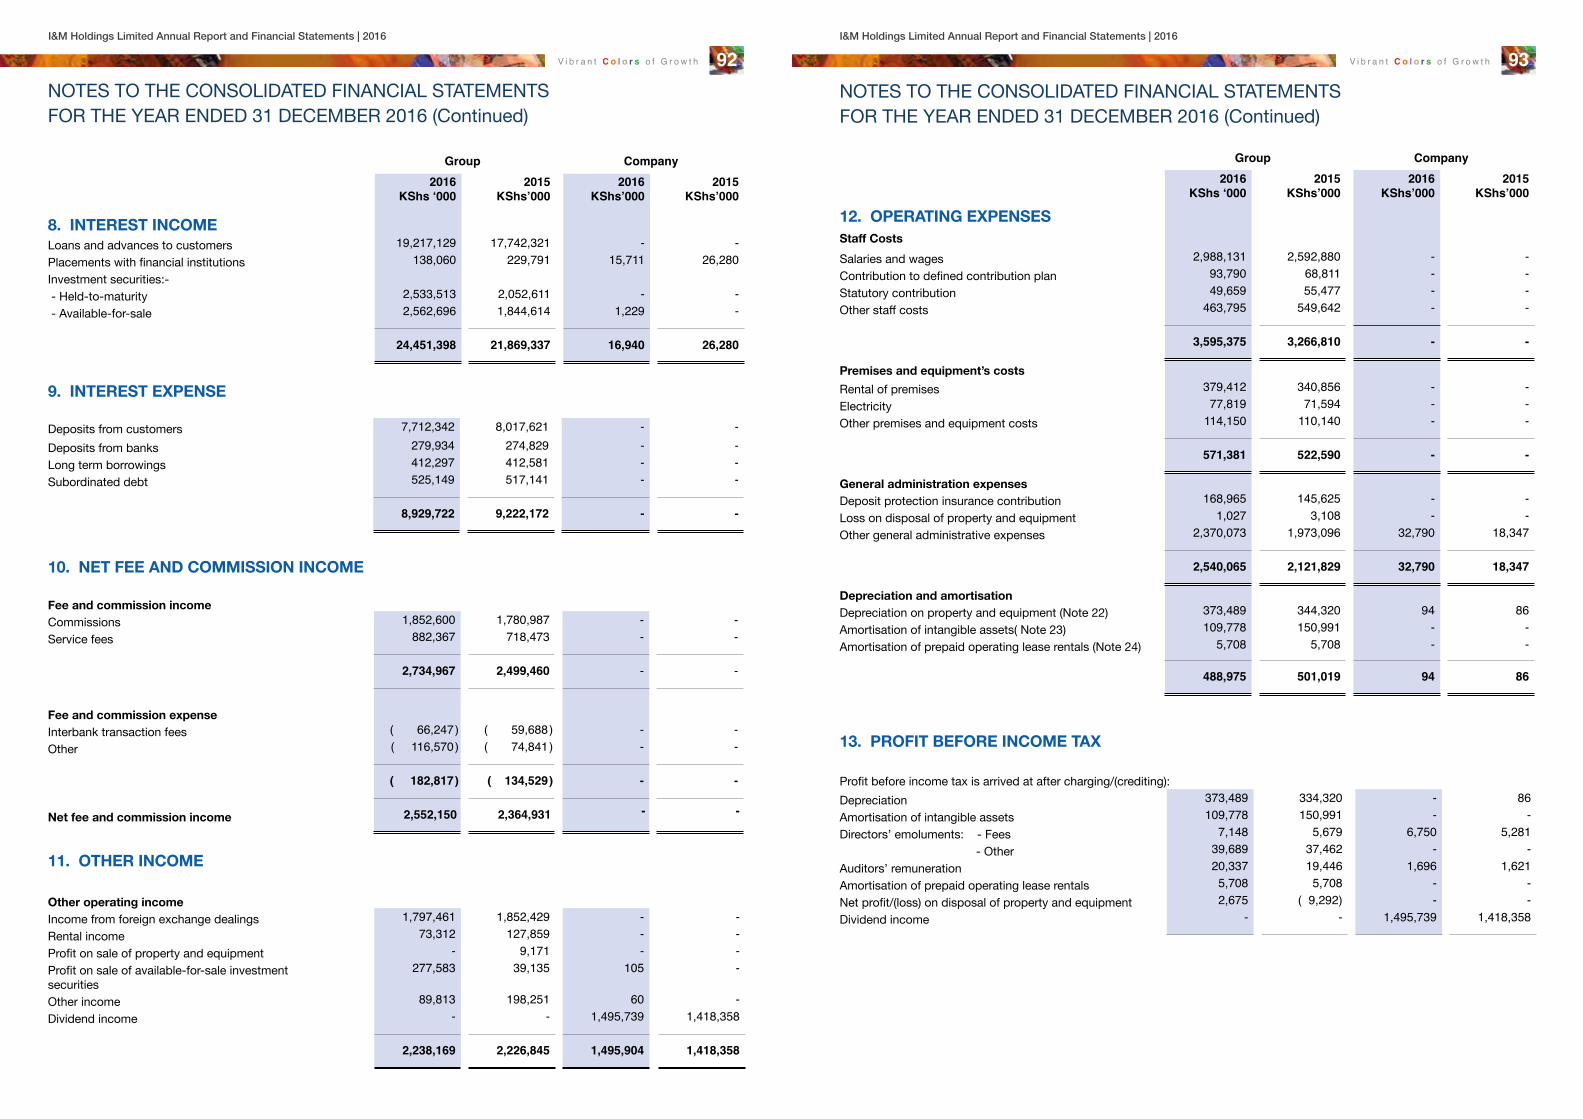
V i b r a n t C o l o r s o f G r o w t h V i b r a n t C o l o r s o f G r o w t h
I&M Holdings Limited Annual Report and Financial Statements | 2016 I&M Holdings Limited Annual Report and Financial Statements | 2016
92 93NOTES TO THE CONSOLIDATED FINANCIAL STATEMENTS FOR THE YEAR ENDED 31 DECEMBER 2016 (Continued)
Group Company2016
KShs ‘0002015
KShs’0002016
KShs’0002015
KShs’000
8. INTEREST INCOMELoans and advances to customers 19,217,129 17,742,321 - -Placements with financial institutions 138,060 229,791 15,711 26,280Investment securities:- - Held-to-maturity 2,533,513 2,052,611 - - - Available-for-sale 2,562,696 1,844,614 1,229 -
24,451,398 21,869,337 16,940 26,280
9. INTEREST EXPENSE Deposits from customers 7,712,342 8,017,621 - -Deposits from banks 279,934 274,829 - -Long term borrowings 412,297 412,581 - -Subordinated debt 525,149 517,141 - -
8,929,722 9,222,172 - -
10. NET FEE AND COMMISSION INCOME Fee and commission incomeCommissions 1,852,600 1,780,987 - -Service fees 882,367 718,473 - -
2,734,967 2,499,460 - -
Fee and commission expenseInterbank transaction fees ( 66,247 ) ( 59,688 ) - -Other ( 116,570 ) ( 74,841 ) - -
( 182,817 ) ( 134,529 ) - -
Net fee and commission income 2,552,150 2,364,931 - -
11. OTHER INCOME
Other operating incomeIncome from foreign exchange dealings 1,797,461 1,852,429 - -Rental income 73,312 127,859 - -Profit on sale of property and equipment - 9,171 - -Profit on sale of available-for-sale investment securities
277,583 39,135 105 -
Other income 89,813 198,251 60 -Dividend income - - 1,495,739 1,418,358
2,238,169 2,226,845 1,495,904 1,418,358
NOTES TO THE CONSOLIDATED FINANCIAL STATEMENTS FOR THE YEAR ENDED 31 DECEMBER 2016 (Continued)
Group Company2016
KShs ‘0002015
KShs’0002016
KShs’0002015
KShs’000
12. OPERATING EXPENSESStaff Costs
Salaries and wages 2,988,131 2,592,880 - -Contribution to defined contribution plan 93,790 68,811 - -Statutory contribution 49,659 55,477 - -Other staff costs 463,795 549,642 - -
3,595,375 3,266,810 - -
Premises and equipment’s costs
Rental of premises 379,412 340,856 - -Electricity 77,819 71,594 - -Other premises and equipment costs 114,150 110,140 - -
571,381 522,590 - -
General administration expensesDeposit protection insurance contribution 168,965 145,625 - -Loss on disposal of property and equipment 1,027 3,108 - -Other general administrative expenses 2,370,073 1,973,096 32,790 18,347
2,540,065 2,121,829 32,790 18,347
Depreciation and amortisationDepreciation on property and equipment (Note 22) 373,489 344,320 94 86Amortisation of intangible assets( Note 23) 109,778 150,991 - -Amortisation of prepaid operating lease rentals (Note 24) 5,708 5,708 - -
488,975 501,019 94 86
13. PROFIT BEFORE INCOME TAX
Profit before income tax is arrived at after charging/(crediting):Depreciation 373,489 334,320 - 86Amortisation of intangible assets 109,778 150,991 - -Directors’ emoluments: - Fees 7,148 5,679 6,750 5,281 - Other 39,689 37,462 - -Auditors’ remuneration 20,337 19,446 1,696 1,621Amortisation of prepaid operating lease rentals 5,708 5,708 - -Net profit/(loss) on disposal of property and equipment 2,675 ( 9,292) - -Dividend income - - 1,495,739 1,418,358

V i b r a n t C o l o r s o f G r o w t h V i b r a n t C o l o r s o f G r o w t h
I&M Holdings Limited Annual Report and Financial Statements | 2016 I&M Holdings Limited Annual Report and Financial Statements | 2016
94 95NOTES TO THE CONSOLIDATED FINANCIAL STATEMENTS FOR THE YEAR ENDED 31 DECEMBER 2016 (Continued)
Group Company
2016KShs ‘000
2015KShs’000
2016KShs ‘000
2015KShs’000
14. INCOME TAX EXPENSE AND TAX PAYABLE
(a) Income tax expense
Current year tax charge 3,098,082 2,918,714 5,047 7,831Over provision in prior year - Current tax ( 87,348 ) ( 9,592) ( 1,594) -
3,010,734 2,909,122 3,453 7,831
Deferred tax (credit) / charge (Note 25) ( 103,121) 189,424 - -Over provision in prior year - Deferred tax ( 64,587) ( 75,296) - -
Income tax expense 2,843,026 3,023,250 3,453 7,831
The tax on the accounting profit differs from the theoretical amount using the basic tax rate as follows:
Accounting profit before income tax 10,603,188 10,167,661 1,479,960 1,426,205
Computed tax using the applicable corporation tax rate (30%) 3,180,956 3,050,298 443,988 427,861Over provision in the prior year ( 87,348) ( 9,592) - -Effect on non-deductible costs / income ( 185,995) 73,059 ( 438,941) ( 420,030)Tax discount in accordance with Rwanda tax laws - ( 15,219) - -Over provision in prior year - Deferred tax ( 64,587) ( 75,296) ( 1,594) -
2,843,026 3,023,250 3,453 7,831
(b) Tax payable/ (recoverable)
At 1 January 140,978 210 772 51Income tax expense (Note 14 (a) (i)) 3,010,734 2,909,122 3,453 7,831Effect of tax in foreign jurisdiction ( 8,589) 1,491 - -Acqusition of I&M Burbidge Capital Limited ( 572) - - -Tax paid ( 3,015,279) ( 2,769,845) ( 8,179) ( 7,110)
At 31 December 127,272 140,978 3,954 772
Tax recoverable ( 12,541) ( 4,456) ( 3,954) -Tax payable 139,813 145,434 - 772
Net payable 127,272 140,978 ( 3,954) 772
15. EARNINGS PER SHARE
Profit for the year attributable to equity holders (KShs ‘000’) 7,283,625 6,717,452 1,476,506 1,418,374
Weighted average number of ordinary shares in issue during the year 392,362 392,362 392,362 392,362
Earnings per share (KShs) 18.56 17.12 3.76 3.61
NOTES TO THE CONSOLIDATED FINANCIAL STATEMENTS FOR THE YEAR ENDED 31 DECEMBER 2016 (Continued)
Group Company2016
KShs ‘0002015
KShs’0002016
KShs ‘0002015
KShs’00016. CASH AND BALANCES WITH CENTRAL BANKS
Cash on hand 2,089,675 1,913,814 - -Balances with central banks - Restricted balances (Cash reserve ratio) 6,508,025 6,944,737 - - - Unrestricted balances 2,486,176 1,089,577 - -
11,083,876 9,948,128 - -
17. ITEMS IN THE COURSE OF COLLECTION
Assets 487,791 527,596 - -Liabilities 7,517 - - -
Items in the course of collection represent net settlement balances through the inter-banking clearing process.
18. LOANS AND ADVANCES TO BANKSDue within 90 Days 6,832,215 4,631,109 - -Due after 90 days 116,492 350,668 - -
6,948,707 4,981,777 - -

V i b r a n t C o l o r s o f G r o w t h V i b r a n t C o l o r s o f G r o w t h
I&M Holdings Limited Annual Report and Financial Statements | 2016 I&M Holdings Limited Annual Report and Financial Statements | 2016
96 97NOTES TO THE CONSOLIDATED FINANCIAL STATEMENTS FOR THE YEAR ENDED 31 DECEMBER 2016 (Continued)
2016KShs’000
2015KShs’000
19. LOANS AND ADVANCES TO CUSTOMERS
(a) Classification
Overdrafts 46,490,096 41,237,807Loans 90,893,764 85,165,124Bills discounted 861,323 3,153,132Hire purchase - finance leases 2,477,203 1,912,865
Gross loans and advances 140,722,386 131,468,928
Less: Impairment losses on loans and advances ( 6,047,054) ( 3,645,150)
Net loans and advances 134,675,332 127,823,778
Repayable on demand 27,266,289 42,053,954Less than 3 months 12,596,026 7,775,4073 months to 1 year 29,157,710 10,176,3771 to 5 years 37,770,257 45,098,3025 to 10 years 27,000,351 21,393,007Over 10 years 6,931,753 4,971,881
Gross loans and advances 140,722,386 131,468,928
Specific impairment
allowance KShs’000
Portfolio Impairment
ProvisionKShs’000
TotalKShs’000
(b) Impairment losses reserve
At 1 January 2016 3,158,700 486,450 3,645,150Impairment made in the year 3,018,001 38,440 3,056,441Net recoveries ( 246,464 ) ( 10,038 ) ( 256,502 )write offs ( 359,991 ) - ( 359,991 )Translation differences ( 33,788 ) (4,256 ) ( 38,044 )
At 31 December 2016 5,536,458 510,596 6,047,054
At 1 January 2015 1,777,148 903,583 2,680,731Impairment made in the year 1,604,420 (412,128 ) 1,192,292net recoveries ( 185,185 ) - ( 185,185 )Write offs ( 40,681 ) - ( 40,681 )Translation differences 2,998 ( 5,005 ) ( 2,007 )
At 31 December 2015 3,158,700 486,450 3,645,150
NOTES TO THE CONSOLIDATED FINANCIAL STATEMENTS FOR THE YEAR ENDED 31 DECEMBER 2016 (Continued)
2016KShs’000
2015KShs’000
19. LOANS AND ADVANCES TO CUSTOMERS (Continued)
(c) Impairment losses on loans and advances
Impairment made in the year 3,056,441 1,192,292Impairment allowance no longer required ( 256,502) ( 185,185)Recoveries of loans and advances written - off in prior years 1,487 ( 30,331)Amounts written off during the year 155,553 5,719
2,956,979 982,495
(d) Loans and advances concentration by sector 2016 2015
KShs ‘000 (%) KShs ‘000 (%)
Manufacturing 30,714,879 22% 29,933,743 23%Wholesale and retail trade 28,615,284 20% 25,971,255 20%Building and construction 17,254,948 12% 15,106,186 11%Agriculture 8,281,806 6% 7,332,001 6%Real estate 23,716,621 17% 21,014,905 16%Transport and communication 8,149,642 6% 7,599,678 6%Business services 11,967,545 9% 12,921,449 10%Electricity and water 80,338 0% 125,134 0%Finance and insurance 2,219,247 2% 1,012,062 1%Mining and quarrying 2,256,458 2% 3,012,415 2%Others 7,465,618 4% 7,440,100 5%
140,722,386 100% 131,468,928 100%
20. INVESTMENT IN SECURITIES Group Company
2016KShs’000
2015KShs’000
2016KShs’000
2015KShs’000
Available-for-sale
Equity investment in TMRC 23,755 25,999 - -Corporate bonds (Non Liquid) 330,992 330,769 - -Treasury bonds (Non Liquid) 15,612,575 11,249,347 - -Treasury bills (Non Liquid) 6,091,596 5,463,025 111,896 -
22,058,918 17,069,140 111,896 -
Held-to-maturity
Treasury bonds (Liquid) 2,092,900 615,354 - -Treasury bonds (Non Liquid) 8,753,999 9,509,604 - -Treasury bills (non -Liquid) 12,053,722 10,784,387 - -Treasury bills (Liquid) 874,921 1,157,322 - -
23,775,542 22,066,667 - -
Total investment securities 45,834,460 39,135,807 111,896 -
*TMRC-Refers to Tanzania Mortgage Refinancing Company

V i b r a n t C o l o r s o f G r o w t h V i b r a n t C o l o r s o f G r o w t h
I&M Holdings Limited Annual Report and Financial Statements | 2016 I&M Holdings Limited Annual Report and Financial Statements | 2016
98 99NOTES TO THE CONSOLIDATED FINANCIAL STATEMENTS FOR THE YEAR ENDED 31 DECEMBER 2016 (Continued)
21. INVESTMENT IN SUBSIDIARIES AND JOINT VENTURE The Company holds investments in subsidiaries in I&M Bank (T) Limited and I&M Insurance Agency through I&M Bank Limited. All the three entities have been consolidated with the results of I&M Bank Limited. I&M Bank (Rwanda) Limited, I&M Capital Limited, I&M Realty Limited, I&M Burbidge Capital are subsidiaries of I&M Holdings Limited. I&M Holdings Limited owns 50% of a joint venture in Mauritius (Bank One Limited).
(a) Investment in joint ventureThe Company has 50% (2015 -50%) control over Bank One Limited with the other joint venture, CIEL Investments Limited. The joint venture was formerly owned through I&M Bank Limited until 22 August 2014 when it was transferred to I&M Holdings Limited.
Group 2016 KShs’000
2015 KShs’000
Balance at start of the year 3,062,350 2,573,560 Additional investment in the year - 181,156
Share of: - - Profit from continuing operations 443,968 323,463 Other comprehensive income 1,864 ( 15,829)
Balance at end of the year 3,508,182 3,062,350
Percentage ownership 50.00% 50.00%
Total assets (including cash and cash equivalents) 72,065,826 57,837,006Total liabilities (including cash and cash equivalents) (66,000,273) (52,663,118)
Net assets (100%) 6,065,553 5,173,888
Group’s share of net assets (50%) 3,032,776 2,586,944Goodwill 475,406 475,406
Carrying amount of interest in joint venture 3,508,182 3,062,350
Interest income 2,914,874 2,573,563Interest expense ( 922,001) ( 839,451)Other income 844,207 708,993Operating expenses ( 1,843,007) ( 1,841,193)Income tax expense ( 106,137) 45,014
Profit and total comprehensive income (100%) 887,936 646,926
Profit and loss (50%) 443,968 323,463
Groups share of profit and total comprehensive income 445,832 307,634
Dividends received by the Group - -
Company:
Bank One Limited 1,679,971 1,679,971
NOTES TO THE CONSOLIDATED FINANCIAL STATEMENTS FOR THE YEAR ENDED 31 DECEMBER 2016 (Continued)
21. INVESTMENT IN SUBSIDIARIES AND JOINT VENTURE (Continued)
(b) Investment in subsidiaries
2016KShs’000
2015KShs’000Company Activity Shareholding
I&M Bank LIMITED Banking 100.00% 17,968,778 17,968,778I&M Capital Limited Dormant 100.00% 6,611 6,611I&M Bank (Rwanda) Limited Banking 54.99% 1,629,277 1,629,277I&M Realty Limited Real estate 100.00% 5,169 -I&M Burbidge Capital Limited Investment 65.00% 66,037 -
19,675,872 19,604,666
The Group owns the following subsidiaries through I&M Bank Limited, its wholly owned subsidiary:
Activity Jurisdiction Shareholding
I&M Insurance Agency Limited Bancassurance Kenya 100.00%I&M Bank (T) Limited Banking Tanzania 70.38%
(c) Movement in investment in subsidiaries
2016KShs’000
2015KShs’000
At 1 January 19,604,666 19,599,661Rights issue - I&M Capital Limited - 5,005Acquisition of Burbidge Capital Limited 66,037 -Transfer of I&M Realty Limited from I&M Bank group 5,169 -
At 31 December 19,675,872 19,604,666

V i b r a n t C o l o r s o f G r o w t h V i b r a n t C o l o r s o f G r o w t h
I&M Holdings Limited Annual Report and Financial Statements | 2016 I&M Holdings Limited Annual Report and Financial Statements | 2016
100 101N
OTE
S TO
TH
E C
ON
SOLI
DATE
D FI
NAN
CIA
L ST
ATEM
ENTS
FO
R TH
E YE
AR E
NDE
D 31
DEC
EMBE
R 20
16 (C
ontin
ued)
21.
INV
ES
TM
EN
T IN
SU
BS
IDIA
RIE
S A
ND
JO
INT
VE
NT
UR
E (C
ont
inue
d)
I&M
Ban
k LI
MIT
EDI&
M B
ank
(T) L
imite
dI&
M B
ank
(Rw
anda
) Lim
ited
2016
KSh
’M20
15K
Sh’M
2016
KSh
’M20
15K
Sh’M
2016
KSh
’M20
15K
Sh’M
Sum
mar
ized
sta
tem
ent
of
fina
ncia
l po
siti
on
Tota
l ass
ets
164,
116
147,
846
19,9
1218
,273
25,9
7923
,567
Tota
l lia
bilit
ies
132,
811
121,
660
17,4
3916
,500
22,1
5120
,212
Net
ass
ets
31,3
0526
,186
2,47
31,
773
3,82
83,
355
Sum
mar
ized
sta
tem
ent
of
pro
fit
and
loss
and
oth
er c
om
pre
hens
ive
inco
me
Net
inte
rest
inco
me
12,5
4510
,061
1,02
095
61,
825
1,60
3
Profi
t bef
ore
inco
me
tax
8,65
18,
367
384
401
1,10
795
7In
com
e ta
x ex
pens
e(
2,3
08 )
( 2
,556
)(
125
)(
10
6 )(
34
3 )(
29
5 )
Pro
fit
for
the
year
6,34
35,
811
259
295
764
662
Sum
mar
ised
sta
tem
ent
of
cash
flo
ws
Net
cas
h ge
nera
ted
from
ope
ratin
g ac
tiviti
es3,
472
14,2
98(
186
)56
53,
942
( 2,
550 )
Net
cas
h us
ed in
inve
stin
g ac
tiviti
es(
1,2
86 )
(
313
)(
22
)(
11
2 )(
36
3 )(
4
9 )N
et c
ash
(use
d in
)/gen
erat
ed fr
om fi
nanc
ing
activ
ities
( 1
,374
)(
1,5
96 )
446
546
108
(
215 )
Net
incr
ease
/(d
ecre
ase)
in c
ash
and
cas
h eq
uiva
lent
s81
212
,389
238
999
3,68
7(
2,81
4 )
Cas
h an
d c
ash
equi
vale
nts
at b
egin
ning
of
year
2,82
9(
9,5
60 )
237
(
762 )
3,26
96,
083
Cas
h an
d c
ash
equi
vale
nts
at e
nd o
f ye
ar3,
641
2,82
947
523
76,
956
3,26
9
NO
TES
TO T
HE
CO
NSO
LIDA
TED
FIN
ANC
IAL
STAT
EMEN
TS
FOR
THE
YEAR
EN
DED
31 D
ECEM
BER
2016
(Con
tinue
d)
22.
PR
OP
ER
TY
AN
D E
QU
IPM
EN
T
Bui
ldin
gsK
Shs’
000
Leas
ehol
d im
prov
emen
tsK
Shs’
000
Furn
iture
, fit
tings
, fix
ture
s an
d of
fice
equi
pmen
tK
Shs’
000
Com
pute
rsK
Shs’
000
Mot
or
Vehi
cles
KSh
s’00
0
Cap
ital
wor
k in
pr
ogre
ssK
Shs’
000
Tota
lK
Shs’
000
Co
st/v
alua
tio
n
At 1
Jan
uary
201
61,
845,
250
957,
095
1,00
7,82
869
3,35
621
0,59
124
0,44
64,
954,
566
Acqu
isiti
on o
f Bur
bidg
e C
apita
l;-
-4,
970
2,12
9-
-7,
099
Addi
tions
16,3
1763
,163
96,5
1411
,554
10,2
1765
5,97
885
3,74
3W
rite-
offs
( 1
36,1
73 )
-(
72
,651
)(
27,
546 )
( 28
,853
)-
( 2
65,2
23 )
Item
s ex
pens
ed-
--
--
( 2
,737
)(
2
,737
)Re
clas
sific
atio
n/in
tern
al tr
ansf
ers
--
17,6
64-
-(
17,6
64 )
-Re
valu
atio
n re
serv
e48
4,77
7-
--
--
484,
777
Tran
sfer
to in
tang
ible
ass
ets
--
--
-(
5,6
55 )
(
5,6
55 )
Tran
sfer
s fro
m in
tang
ible
ass
ets
99,6
135,
525
18,1
93(
439 )
1,28
2(1
30,0
66 )
(
5,8
92 )
Tran
slat
ion
diffe
renc
e(
39
,993
)(
339
)(
24
,100
)(
13,
163 )
( 9
,376
)(
9,0
56 )
(
96,0
27 )
At
31 D
ecem
ber
201
62,
269,
791
1,02
5,44
41,
048,
418
665,
891
183,
861
731,
246
5,92
4,65
1
At 1
Jan
uary
201
622
7,27
855
3,46
759
5,52
949
6,12
814
6,93
1-
2,01
9,33
3Ac
quis
ition
of I
&M B
urbi
dge
Cap
ital
--
2,14
61,
510
--
3,65
6C
harg
e fo
r the
yea
r51
,984
99,2
9710
0,52
992
,571
29,1
08-
373,
489
Writ
e-off
s(
130
,814
)-
(
71,4
26 )
( 2
7,46
2 )(
28,0
67 )
-(
257
,769
)Re
vers
al o
n re
valu
atio
n(
76
,012
)-
--
--
(
76,0
12 )
Tran
slat
ion
diffe
renc
es(
10
,017
)(
116
)(
15
,915
)(
11,
196 )
( 7
,701
)-
(
44,9
45 )
At
31 D
ecem
ber
201
662
,419
652,
648
610,
863
551,
551
140,
271
-2,
017,
752
Net
bo
ok
valu
e at
31
Dec
emb
er 2
016
2,20
7,37
237
2,79
643
7,55
511
4,34
043
,590
731,
246
3,90
6,89
9
In 2
016,
the
build
ing
on L
R N
o: 2
09/7
265
was
reva
lued
afte
r 4 y
ears
by
an in
depe
nden
t val
uer,
Kira
gu &
Mw
angi
Lim
ited.
The
val
uatio
n is
leve
l 3 u
nder
the
Fair
valu
e hi
erar
chy.

V i b r a n t C o l o r s o f G r o w t h V i b r a n t C o l o r s o f G r o w t h
I&M Holdings Limited Annual Report and Financial Statements | 2016 I&M Holdings Limited Annual Report and Financial Statements | 2016
102 103N
OTE
S TO
TH
E C
ON
SOLI
DATE
D FI
NAN
CIA
L ST
ATEM
ENTS
FO
R TH
E YE
AR E
NDE
D 31
DEC
EMBE
R 20
16 (C
ontin
ued)
22.
PR
OP
ER
TY
AN
D E
QU
IPM
EN
T (C
ont
inue
d)
Bui
ldin
gsK
Shs’
000
Leas
ehol
d im
prov
emen
tsK
Shs’
000
Furn
iture
,fit
tings
, fix
ture
s an
d of
fice
equi
pmen
tK
Shs’
000
Com
pute
rsK
Shs’
000
Mot
or
Vehi
cles
KSh
s’00
0
Cap
ital
wor
k in
pr
ogre
ssK
Shs’
000
Tota
lK
Shs’
000
At
1 Ja
nuar
y 20
151,
832,
598
891,
344
921,
949
609,
862
235,
046
188,
158
4,67
8,95
7Ad
ditio
ns-
64,6
2010
9,77
883
,401
15,2
7324
6,91
351
9,98
5Di
spos
als
-(
12,4
40 )
(
52,9
00 )
( 5
,399
)(
42,6
68 )
-(
113,
407 )
Recl
assi
ficat
ion/
inte
rnal
tran
sfer
s(
7
,800
)(
2 )
(
7,8
74 )
(109
,709
)(
26,2
53 )
( 32
,116
)(
183,
754 )
Recl
assi
ficat
ion
from
cap
ital w
ork
in p
rogr
ess
-22
,795
29,2
0178
,771
24,6
86(1
55,4
53 )
-Tr
ansf
ers
from
Inta
ngib
le a
sset
s-
2,18
18,
801
33,3
62-
(
5
5 )44
,289
Writ
e off
s-
2,53
679
2(
6
76 )
-(
6,5
94 )
(
3,9
42 )
Tran
slat
ion
diffe
renc
e20
,452
( 13
,939
)(
1
,919
)3,
744
4,50
7(
4
07 )
12,4
38
At
31 D
ecem
ber
201
51,
845,
250
957,
095
1,00
7,82
869
3,35
621
0,59
124
0,44
64,
954,
566
Dep
reci
atio
nAt
1 J
anua
ry 2
015
176,
676
475,
667
602,
813
478,
687
181,
422
-1,
915,
265
Recl
assi
ficat
ion
(
7,8
02 )
(
1 )(
60
,992
)(
56,5
88 )
( 26
,254
)-
( 1
51,6
37 )
Cha
rge
for t
he y
ear
51,7
7792
,678
97,2
1671
,816
30,8
33-
344,
320
Writ
e-off
s-
823
998
3,16
4(
8
88 )
-4,
097
On
disp
osal
-(
12,2
08 )
(
48,4
21 )
( 5
,286
)(
42,1
94 )
-(
108,
109 )
Tran
slat
ion
diffe
renc
es6,
627
( 3
,492
)3,
915
4,33
54,
012
-15
,397
At
31 D
ecem
ber
201
522
7,27
855
3,46
759
5,52
949
6,12
814
6,93
1-
2,01
9,33
3
Net
bo
ok
valu
e at
31
Dec
emb
er 2
015
1,61
7,97
240
3,62
841
2,29
919
7,22
863
,660
240,
446
2,93
5,23
3 NOTES TO THE CONSOLIDATED FINANCIAL STATEMENTS FOR THE YEAR ENDED 31 DECEMBER 2016 (Continued)
23. INTANGIBLE ASSETS
2016 KShs’000
2015KShs’000
(a) Goodwill
I&M Bank LIMITED 1,195 1,195I&M Bank (T) Limited 608,953 608,953Biashara Bank of Kenya Limited 10,747 10,747I&M Bank (Rwanda) Limited 553,706 553,706I&M Burbidge Limited 32,447 -
1,207,048 1,174,601
The recoverable amounts for I&M Bank (T) Limited and I&M Bank (Rwanda) Limited have been calculated based on their value in use, determined by discounting the future cash flows expected to be generated from the continuing use of the Cash Generating Unit (CGU). The present value of the recoverable amounts on I&M Bank LIMITED’s share were KShs 2.07 billion (2015; KShs 2.78 billion) and KShs 3.03 billion (2015; KShs 3.09 billion) for I&M Bank (T) Limited and I&M Bank (Rwanda) Ltd respectively. No impairment losses were recognised during 2016 because the recoverable amounts of these CGUs were determined to be higher than their carrying amounts. The key assumptions used in the calculation of value in use were as follows: 2016 I&M (T) Ltd I&M Rwanda Ltd
5 year risk free rate 17.96% 12.25%Risk premium 12.50% 14.00%Terminal growth rate 3.00% 2.50%Exchange rate KShs 1 = Tzs 17.15 KShs 1 = Rwf 6.07
2015
5 year risk free rate 9.18% 11.95%Risk premium 12.50% 14.00%Terminal growth rate 3.00% 2.50%Exchange rate KShs 1 = Tzs 21.11 KShs 1 = Rwf 7.31
The discount rate utilised was the risk free rate on the rate of 5 year government bonds issued by the governments in the respective markets and in the same currency as the cash flows.
These cash flows have been projected for 5 years for the two subsidiaries, based on the approved Business plans of the respective units. For I&M Bank (T) Limited, and I&M Bank (Rwanda) Limited, the terminal growth rates estimated were 3.00% and 2.50% respectively.
In the opinion of the directors, there was no impairment of goodwill during the year.

V i b r a n t C o l o r s o f G r o w t h V i b r a n t C o l o r s o f G r o w t h
I&M Holdings Limited Annual Report and Financial Statements | 2016 I&M Holdings Limited Annual Report and Financial Statements | 2016
104 105NOTES TO THE CONSOLIDATED FINANCIAL STATEMENTS FOR THE YEAR ENDED 31 DECEMBER 2016 (Continued)
23. INTANGIBLE ASSETS (Continued)
(b) Software
SoftwareKShs’000
Capital work in progress
KShs’000Total
KShs’000Cost 2016
At 1 January 1,089,608 42,335 1,131,943Transfers to intangible assets - 5,892 5,892Transfers from intangible assets 5,655 - 5,655Additions 48,795 39,189 87,984Reclassification 48,217 ( 48,217 ) -Write offs - ( 12 ) ( 12 )Translation differences ( 18,886 ) - ( 18,886)
At 31 December 2016 1,173,389 39,187 1,212,576
Amortisation 2016At 1 January 886,509 - 886,509Armortization for the year 109,778 - 109,778Translation differences ( 17,116 ) - ( 17,116 )
At 31 December 2016 979,171 - 979,171
Carrying amount
31 December 2016 194,218 39,187 233,405
Cost 2015
At 1 January 856,781 202,481 1,059,262Reclassification from capital work in progress 53,333 ( 53,333 ) -Transfer to property and equipment - ( 65,683 ) ( 65,683 )Transfers to intangible assets 53,505 - 53,505Transfers from intangible assets - ( 32,112 ) ( 32,112 )Additions 127,528 7,010 134,538Reclassification 13,835 ( 16,028 ) ( 2,193 )Write offs ( 14,532 ) - ( 14,532 )Disposals ( 10 ) - ( 10 )Translation differences ( 832 ) - ( 832 )
At 31 December 2015 1,089,608 42,335 1,131,943
Amortisation 2015At 1 January 758,897 - 758,897Amortisation for the year 150,991 - 150,991Write offs ( 26,789 ) - ( 26,789 )On disposals ( 10 ) - ( 10 )Translational differences 3,420 - 3,420
At 31 December 2015 886,509 - 886,509
Carrying amount
At 31 December 2015 203,099 42,335 245,434
NOTES TO THE CONSOLIDATED FINANCIAL STATEMENTS FOR THE YEAR ENDED 31 DECEMBER 2016 (Continued)
24. PREPAID OPERATING LEASE RENTALS
2016
KShs’0002015
KShs’000
Cost
At 1 January 317,650 317,650Disposal ( 35,391) -
At 31 December 282,259 317,650
Amortisation
At 1 January 33,044 27,336Charge for the year 5,708 5,708Disposal ( 10,357) -
At 31 December 28,395 33,044
As at 31 December 253,864 284,606

V i b r a n t C o l o r s o f G r o w t h V i b r a n t C o l o r s o f G r o w t h
I&M Holdings Limited Annual Report and Financial Statements | 2016 I&M Holdings Limited Annual Report and Financial Statements | 2016
106 107N
OTE
S TO
TH
E C
ON
SOLI
DATE
D FI
NAN
CIA
L ST
ATEM
ENTS
FO
R TH
E YE
AR E
NDE
D 31
DEC
EMBE
R 20
16 (C
ontin
ued)
25.
DE
FER
RE
D T
AX
AS
SE
T/
LIA
BIL
ITY
(a)
Def
erre
d t
ax a
sset
2016
:
Bal
ance
at
1 Ja
nuar
yK
Shs
‘000
Acq
uisi
tion
of s
ubsi
diar
yK
Shs
‘000
Prio
r yea
r un
der/o
ver
prov
isio
nK
Shs
‘000
Rec
ogni
sed
in e
quity
KSh
s ‘0
00
Tran
slat
ion
diffe
renc
esK
Shs
‘000
Rec
ogni
sed
in p
rofit
or
loss
KSh
s ‘0
00
Bal
ance
at ‘
31
Dec
embe
rK
Shs
‘000
Prop
erty
and
equ
ipm
ent
(227
,690
)(
3
7 )
45,2
79(1
68,2
36 )
6,19
7(
21,0
32 )
( 365
,519
)G
ener
al p
rovi
sion
s30
0,51
8-
--
( 3,
261 )
( 36
,222
)26
1,03
5O
ther
pro
visi
ons
159,
958
34,4
6319
,308
-(
58
8 )16
0,00
437
3,14
5Av
aila
ble-
for-s
ale
rese
rves
216,
506
--
( 64
,046
)-
-15
2,46
0
449,
292
34,4
2664
,587
(232
,282
)2,
348
102,
750
421,
121
2015
:Pl
ant a
nd e
quip
men
t(1
89,0
70 )
-41
,553
-(
6,9
27 )
( 73
,246
)( 2
27,6
90 )
Gen
eral
pro
visi
ons
323,
037
-33
,743
-(
5,8
72 )
( 50
,390
)30
0,51
8O
ther
pro
visi
ons
225,
746
--
--
( 65
,788
)15
9,95
8Av
aila
ble-
for-s
ale
rese
rves
155,
485
--
61,0
21-
-21
6,50
6
515,
198
-75
,296
61,0
21(1
2,79
9 )(1
89,4
24)
449,
292
(b) D
efer
red
tax
liab
ility
2016
:O
ther
pro
visi
ons
13,1
59-
--
(12,
788 )
(
371
)-
Avai
labl
e-fo
r-sal
e re
serv
es(
12,1
20 )
--
(
599
)12
,719
--
1,03
9-
-(
5
99 )
(
69 )
(
371
)-
2015
:O
ther
pro
visi
ons
13,1
43-
--
16-
13,1
59Av
aila
ble-
for-s
ale
rese
rves
371
--
( 13
,057
)56
6-
( 1
2,12
0 )
13,5
14-
-(
13,0
57 )
582
-1,
039 NOTES TO THE CONSOLIDATED FINANCIAL STATEMENTS
FOR THE YEAR ENDED 31 DECEMBER 2016 (Continued)
Group Company
2016 KShs’000
2015 KShs’000
2016 KShs’000
2015 KShs’000
26. OTHER ASSETSRent receivable 54,229 41,243 - - Prepayments 303,418 391,225 23,825 - Other receivables 1,085,756 651,311 5,631 23,825 Derivative assets (Note 34(b)) 525,764 - - -
1,969,167 1,083,779 29,456 23,825
27. DEPOSITS FROM BANKS Due within 90 Days 2,987,392 5,556,698 - -Due after 90 days 4,808,464 2,414,777 - -
7,795,856 7,971,475 - -
28. DEPOSITS FROM CUSTOMERS
Government and parastatals 1,319,806 3,585,538 - -Private sector and individuals 145,194,600 129,395,140 - -
146,514,406 132,980,678 - -
29. OTHER LIABILITIES Bankers cheques payable 408,209 482,499 - -Accruals 1,568,075 1,340,428 4,750 - Other accounts payables 1,295,903 810,205 61,927 47,457 Derivative liabilities (Note 34(b)) - 133,241 - -
3,272,187 2,766,373 66,677 47,457
30. LONG TERM BORROWINGS - GROUP Less than one year 1,971,820 2,516,139 - -One to five years 6,653,810 6,453,240 - -Over five years 133,886 606,076 - -
8,759,516 9,575,455 - -
Group
At 1 January 9,575,455 10,697,172 - -Funds received 1,550,505 154,242 - -Payments on principal and interest ( 2,689,158) ( 2,704,690) - -Exchange differences 322,714 1,428,731 - -
At 31 December 8,759,516 9,575,455 - -

V i b r a n t C o l o r s o f G r o w t h V i b r a n t C o l o r s o f G r o w t h
I&M Holdings Limited Annual Report and Financial Statements | 2016 I&M Holdings Limited Annual Report and Financial Statements | 2016
108 109NOTES TO THE CONSOLIDATED FINANCIAL STATEMENTS FOR THE YEAR ENDED 31 DECEMBER 2016 (Continued)
30. LONG TERM BORROWINGS-GROUP (Continued)
Long term borrowings constituted the following:
(i) USD 25,000,000 facility granted on 24 November 2010 by FMO repayable over seven years after an initial one year two months grace period. The maturity is scheduled for November 2017.(ii) USD 15,000,000 facility granted on 5 January 2012 by DEG repayable quarterly over five (5) years after an initial six months grace period.(iii) USD 50,000,000 facility granted on 16 July 2013 by IFC repayable semi-annually over 7 years after an initial two years grace period.(iv) USD 26,000,000 facility granted on 21 March 2014 by PROPARCO repayable semi-annually over seven years four months after an initial one year grace period.(v) EUR 10,000,000 facility granted on 21 March 2014 by PROPARCO repayable semi-annually over seven years four months after an initial one year grace period.(vi) USD 5,000,000 facility granted on 3 July 2012 by PROPARCO repayable semi-annually over seven years four months.(vii) Rwf 1,000,000,000 corporate bond issued on 25 January 2008 repayable semi-annually over 10 years.(viii) A corporate bond at a nominal value of Rwanda Francs 1 billion through the Rwanda over the counter market in January 2008. The bond has a maturity period of 10 Years and is unsecured. (ix) A loan of Rwf 1,382,764,094 from the National Bank of Rwanda as a result of a swap transaction. The loan accrues interest at a fixed rate of 8% and will mature on 27 November 2017.(x) EUR 1,573,000 facility granted in October 2014 by European Investment Bank repayable over seven years
31. SUBORDINATED DEBT
Group
2016 KShs’000
2015 KShs’000
GroupLess than one year 3,679,380 63,685One to five years 827,799 4,010,422Over five years 39,502 420,977
4,546,681 4,495,084
Subordinated debt comprises:
KShs 3,655,000,000 medium term unsecured subordinated fixed and floating rate notes issued on 16 December 2013 for a tenor of 5 years with redemption on the maturity date.
USD 10 Million granted on January 2015 by DEG of which USD 8 Million was received in January 2015 and will mature on September 2021.
The subordinated debt would in the event of winding up of the respective companies be subordinated to the claims of depositors and all other creditors.
The Group has not had any defaults of principal or interest with respect to these debts.
NOTES TO THE CONSOLIDATED FINANCIAL STATEMENTS FOR THE YEAR ENDED 31 DECEMBER 2016 (Continued)
32. SHARE CAPITAL AND RESERVES (a) Share capital and share premium – Group and Company
2016 KShs’000
2015 KShs’000
Authorised:500,000,000 ordinary shares of KShs 1 each 500,000 500,000
Issued and fully paid:
392,362,039 ordinary shares of KShs 1 each 392,362 392,362
Movement of share capital and premium
2016Number of
shares
Share Capital
KShs’000
Share premium
KShs’000Total
KShs’000
31 December 2016 392,362,000 392,362 17,331,510 17,723,872
2015
31 December 2015 392,362,000 392,362 17,331,510 17,723,872
The ordinary shares rank equally with regard to the company residual assets and are entitled to receive dividends as declared from time to time and to one vote per share at meetings of the company.
(b) Share premiumShare premium is the amount which the company raises in excess of the par value/nominal value of the shares.
(c) Revaluation reserveThe revaluation reserve arises on revaluation of buildings. When revalued property is disposed, the portion of the revaluation reserve that relates to that asset is transferred to retained earnings.
(d) Available-for-sale reserveThe available-for-sale reserve includes the cumulative net change in the fair value of available-for-sale investments, excluding impairment losses, until the investment is derecognised.
(e) Translation reserveThe translation reserve comprises foreign exchange differences arising from the translation of the financial statements of foreign operations namely the joint venture in Bank One Limited, Mauritius, (ii) I&M Bank (T) Limited, Tanzania (iii) I&M Bank (Rwanda) Limited, Rwanda and I&M Burbidge Capital Uganda into the functional currency of the Parent company.
(f) Statutory credit risk statutory reserveWhere impairment losses required by legislation or regulations exceed those computed under International Financial Reporting Standards (IFRSs), the excess is recognised as a statutory reserve and accounted for as an appropriation of retained profits and the reverse for reductions. These reserves are not distributable.
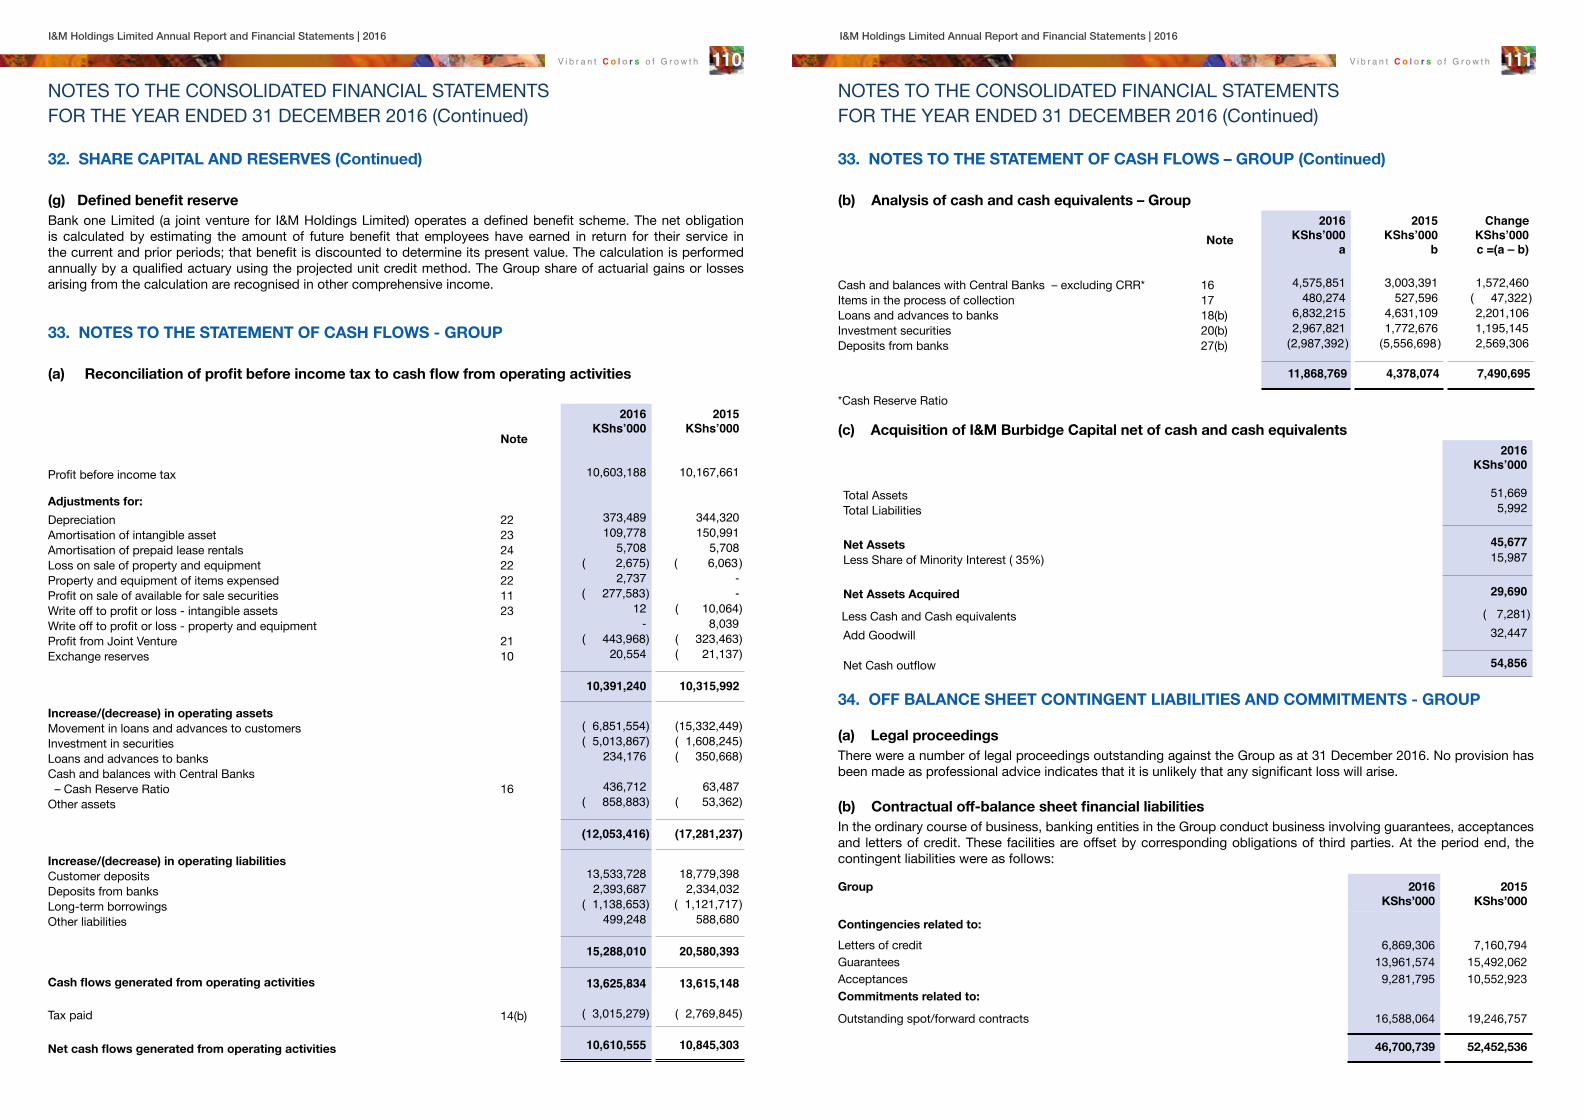
V i b r a n t C o l o r s o f G r o w t h V i b r a n t C o l o r s o f G r o w t h
I&M Holdings Limited Annual Report and Financial Statements | 2016 I&M Holdings Limited Annual Report and Financial Statements | 2016
110 111NOTES TO THE CONSOLIDATED FINANCIAL STATEMENTS FOR THE YEAR ENDED 31 DECEMBER 2016 (Continued)
32. SHARE CAPITAL AND RESERVES (Continued)
(g) Defined benefit reserveBank one Limited (a joint venture for I&M Holdings Limited) operates a defined benefit scheme. The net obligation is calculated by estimating the amount of future benefit that employees have earned in return for their service in the current and prior periods; that benefit is discounted to determine its present value. The calculation is performed annually by a qualified actuary using the projected unit credit method. The Group share of actuarial gains or losses arising from the calculation are recognised in other comprehensive income.
33. NOTES TO THE STATEMENT OF CASH FLOWS - GROUP
(a) Reconciliation of profit before income tax to cash flow from operating activities
2016KShs’000
2015KShs’000
Note
Profit before income tax 10,603,188 10,167,661
Adjustments for:
Depreciation 22 373,489 344,320Amortisation of intangible asset 23 109,778 150,991Amortisation of prepaid lease rentals 24 5,708 5,708Loss on sale of property and equipment 22 ( 2,675) ( 6,063 )Property and equipment of items expensed 22 2,737 -Profit on sale of available for sale securities 11 ( 277,583 ) -Write off to profit or loss - intangible assets 23 12 ( 10,064)Write off to profit or loss - property and equipment - 8,039Profit from Joint Venture 21 ( 443,968) ( 323,463)Exchange reserves 10 20,554 ( 21,137)
10,391,240 10,315,992
Increase/(decrease) in operating assetsMovement in loans and advances to customers ( 6,851,554) (15,332,449)Investment in securities ( 5,013,867) ( 1,608,245)Loans and advances to banks 234,176 ( 350,668)Cash and balances with Central Banks – Cash Reserve Ratio 16 436,712 63,487Other assets ( 858,883) ( 53,362)
(12,053,416) (17,281,237)
Increase/(decrease) in operating liabilitiesCustomer deposits 13,533,728 18,779,398Deposits from banks 2,393,687 2,334,032Long-term borrowings ( 1,138,653) ( 1,121,717 )Other liabilities 499,248 588,680
15,288,010 20,580,393
Cash flows generated from operating activities 13,625,834 13,615,148
Tax paid 14(b) ( 3,015,279) ( 2,769,845)
Net cash flows generated from operating activities 10,610,555 10,845,303
NOTES TO THE CONSOLIDATED FINANCIAL STATEMENTS FOR THE YEAR ENDED 31 DECEMBER 2016 (Continued)
33. NOTES TO THE STATEMENT OF CASH FLOWS – GROUP (Continued)
(b) Analysis of cash and cash equivalents – Group 2016
KShs’000a
2015KShs’000
b
ChangeKShs’000c =(a – b)
Note
Cash and balances with Central Banks – excluding CRR* 16 4,575,851 3,003,391 1,572,460Items in the process of collection 17 480,274 527,596 ( 47,322 )Loans and advances to banks 18(b) 6,832,215 4,631,109 2,201,106Investment securities 20(b) 2,967,821 1,772,676 1,195,145 Deposits from banks 27(b) (2,987,392 ) (5,556,698 ) 2,569,306
11,868,769 4,378,074 7,490,695
*Cash Reserve Ratio
(c) Acquisition of I&M Burbidge Capital net of cash and cash equivalents 2016
KShs’000
Total Assets 51,669Total Liabilities 5,992
Net Assets 45,677Less Share of Minority Interest ( 35%) 15,987
Net Assets Acquired 29,690
Less Cash and Cash equivalents ( 7,281)Add Goodwill 32,447
Net Cash outflow 54,856
34. OFF BALANCE SHEET CONTINGENT LIABILITIES AND COMMITMENTS - GROUP
(a) Legal proceedings There were a number of legal proceedings outstanding against the Group as at 31 December 2016. No provision has been made as professional advice indicates that it is unlikely that any significant loss will arise.
(b) Contractual off-balance sheet financial liabilitiesIn the ordinary course of business, banking entities in the Group conduct business involving guarantees, acceptances and letters of credit. These facilities are offset by corresponding obligations of third parties. At the period end, the contingent liabilities were as follows:
Group 2016 KShs’000
2015KShs’000
Contingencies related to:
Letters of credit 6,869,306 7,160,794Guarantees 13,961,574 15,492,062Acceptances 9,281,795 10,552,923Commitments related to:
Outstanding spot/forward contracts 16,588,064 19,246,757
46,700,739 52,452,536

V i b r a n t C o l o r s o f G r o w t h V i b r a n t C o l o r s o f G r o w t h
I&M Holdings Limited Annual Report and Financial Statements | 2016 I&M Holdings Limited Annual Report and Financial Statements | 2016
112 113NOTES TO THE CONSOLIDATED FINANCIAL STATEMENTS FOR THE YEAR ENDED 31 DECEMBER 2016 (Continued)
34. OFF BALANCE SHEET CONTINGENCIES AND COMMITMENTS – GROUP (Continued)
(b) Contractual off-balance sheet financial liabilities (Continued)
Nature of contingent liabilitiesGuarantees are generally written by a bank to support performance by a customer to third parties. The Group will only be required to meet these obligations in the event of the customer’s default.
Letters of credit commit a bank to make payment to third parties on production of documents which are subsequently reimbursed by customers.
An acceptance is an undertaking by a bank to pay a bill of exchange drawn on a customer. The Group expects most acceptances to be presented and reimbursement by the customer is almost immediate.
Forward contracts are arrangements to buy or sell a specified quantity of foreign currency, usually on a specified future date at an agreed rate.
The fair values of the respective currency forwards are carried on the face of the balance sheet.
(c) Other contingent liabilities On completion of the tax audit by Kenya Revenue Authority (KRA), covering the Years of Income 2011 to 2013, KRA raised an additional tax assessment on the Bank in June 2015. The Bank immediately settled KShs 6,563,885 which was rightly assessed and objected to all other items which were erroneously assessed. The Bank has since provided all the information and supporting schedules requested by KRA with respect to the objection. At the date of approval of these financial statements, this dispute has not yet been concluded. The Directors believe that the claim will be successfully defended. Consequently, no provisions have been made in these financial statements.
35. ASSETS PLEDGED AS SECURITY - GROUP
As at 31 December 2016, Treasury Bonds with a face value of KShs 1,276,000,000 (2015 – KShs 1,276,000,000) were held under lien in favour of the Central Bank of Kenya.
36. RELATED PARTY TRANSACTIONS
In the normal course of business, the Group enters into transactions with related parties. The related party transactions are at arm’s length. All the loans and advances and deposits are issued or received from the related parties are at market interest rates. There were no provisions held towards impairment of any of the advances to related parties.
2016 KShs’000
2015 KShs’000
(a) Transactions with directors/shareholders ( Group)
(i) Loans to Directors/Shareholders 46,665 137,997
Interest Income from Loans to directors/shareholders 7,970 9,812
(ii) Deposits from Directors/Shareholders 2,495,276 3,024,670
Interest expense on Deposits from directors/shareholders 197,407 244,479
NOTES TO THE CONSOLIDATED FINANCIAL STATEMENTS FOR THE YEAR ENDED 31 DECEMBER 2016 (Continued)
36. RELATED PARTY TRANSACTIONS (Continued)
2016 KShs’000
2015 KShs’000
(b) Transactions with related companies ( Group)
(i) Loans to Related companies 412,555 14,695
Interest Income from Loans to Related companies 50,059 1,280
(ii) Loans from Related Companies - 3,192,693
Interest expense on Loans from Related Companies - 54,435
(iii) Deposits from Related companies 975,598 617,870
Interest expense on Deposits from Related companies 48,361 21,088
(c) Transactions with related companies (Company)
(i) Due from group companies 71,375 142,660
(ii) Due to group companies 11,337 11,715
(d) Transactions with employees (Group)
Staff loans 1,107,356 1,182,651
Interest earned on these loans was KShs 78,279 46,394
(e) Management fees received from subsidiaries 58,168 38,463
37. CAPITAL COMMITMENTS
Group 3,800,742 909,768

V i b r a n t C o l o r s o f G r o w t h V i b r a n t C o l o r s o f G r o w t h
I&M Holdings Limited Annual Report and Financial Statements | 2016 I&M Holdings Limited Annual Report and Financial Statements | 2016
114 115NOTES TO THE CONSOLIDATED FINANCIAL STATEMENTS FOR THE YEAR ENDED 31 DECEMBER 2016 (Continued)
38. FUTURE RENTAL COMMITMENTS UNDER OPERATING LEASES
(a) LesseeThe Group leases bank premises under operating leases. The leases typically run for an initial period of six years with an option to renew the lease after that date. None of the leases include contingent rentals. Future minimum lease payments under these operating leases are as follows:
Group
2016KShs’000
2015KShs’000
Less than one year 313,630 328,424One to five years 1,658,337 1,223,689Over five years 165,686 408,122
2,137,653 1,960,235
(b) Lessor
Less than one year 175,122 83,824One to five years 455,814 408,558
630,936 492,382
39. EVENTS AFTER THE REPORTING DATE
On 13 February 2017, I&M Holdings Limited completed the acquisition of all the issued share capital of Giro Commercial Bank Limited [GCBL] having met all conditions precedent to completion of the transaction. As a result and in settlement of part of the purchase consideration, 21,043,330 (twenty one million forty three thousand three hundred and thirty) new ordinary shares of KShs 1.00 each in the capital of the Company were issued. Subsequently, the whole of the banking business of GCBL and all associated assets and the liabilities of GCBL was transferred into that of I&M Bank LIMITED. The results of Giro Commercial Bank have not been consolidated in these financial statements.
ANKARAThe Ankara comes with a variety of names, just like it’s designs for example: ‘African prints’, ‘African Wax prints’, ‘Holland Wax’ and ‘Dutch Wax.’ The Ankara has become popular throughout Africa and its main attribute is its 100% cotton tag and also it’s distinct tribal patterns and motifs. The Ankara is popular due to its versatility and is considered very fashionable.

V i b r a n t C o l o r s o f G r o w t h V i b r a n t C o l o r s o f G r o w t h
I&M Holdings Limited Annual Report and Financial Statements | 2016 I&M Holdings Limited Annual Report and Financial Statements | 2016
116 117
I&M CSR NEWS I&M KENYA CSR
I&M Bank Kenya in 2016 continued to champion its shared growth agenda among different members of the community through the bank’s Corporate Social Responsibility (CSR) arm. This was achieved through the following:
EDUCATIONEducation is a key driver of socio-economic development. The bank continues to appreciate the power of transformation through education, and is committed to supporting education for bright but needy students to obtain secondary and university education.
Over and above provision of education scholarships, the bank has supported forums where staff members through mentorship opportunities impart knowledge, wisdom and guidance to the scholarship beneficiaries.
Below are key initiatives that the bank championed under the education pillar:
Palmhouse Foundation Mentorship ProgrammeI&M Bank Kenya continued to sponsor secondary school education for 64 bright but financially constrained students at the Palmhouse Foundation.
In 2016, the bank donated slightly over KShs. 6 million towards this initiative which includes: mentorship sessions facilitated by partners of the Palmhouse Foundation, I&M Bank staff and management trainees.
Last year, I&M Bank staff also organized a successful full day mentorship session for the beneficiaries encouraging them to work hard and be impactful members of society.
I&M Bank, Kenya staff members conducting a mentorship session with some of the beneficiaries.
I&M Bank Kenya Provides Strathmore University ScholarshipsI&M Bank Kenya continued to provide scholarships for needy students pursuing various degree programmes at Strathmore University. The bank donated over KShs. 6 million towards this scholarship programme. Various students benefitting from this programme have also continued to work at I&M Bank on internship and Management Trainee programmes. The bank’s staff members have also been conducting mentorship sessions for the beneficiaries on an annual basis.
I&M Bank Finances Greenhouse Project at Kanaani Primary SchoolI&M Bank yet again partnered with the Amara Charitable Trust to support Kanaani Primary School in Machakos County. The bank contributed in the construction of a greenhouse project, drip lines and a kitchen for the school, a sustainable project for the school’s feeding programme. This project is so far benefiting approximately 750 children in the school. The Amara Charitable Trust has made further steps to organize and finance training programmes for the school’s teachers, gardeners and children on different agricultural practices.
The organization has made a positive impact in the Kenyan education sector, which is their key focus for their charitable organizations. Earlier in the 2016, I&M Bank also partnered with the organization to finance construction of 7 classrooms at the Ngalalya primary school in Machakos County.
Kanaani Primary School’s garden.
I&M CSR NEWS (Continued) I&M KENYA CSR (Continued)
I&M Bank Funds Construction of St. Ann’s Kairi Suresh Raja Shah Girls Secondary SchoolIn 2016, I&M Bank conducted a ground breaking ceremony to mark the beginning of the construction of St. Ann’s Kairi Suresh Raja Shah Girls secondary school. The construction costing over KShs. 40 million, will take two years and once completed, I&M Bank will further engage with the students through continued staff engagement on mentorship and advisory support.
The ongoing construction of the school.
I&M Bank Supports Students at Tangaza CollegeIn 2016, I&M Bank sponsored a 2nd tranche of 10 needy but academically gifted students in an early childhood development education programme, under the Kibera slums Teacher Upgrading Programme undertaken by Project Busara in Christ the Teacher Institute for Education (CTIE) at Tangaza College, for approximately 4 million.
Kibera slums have many schools with untrained teachers who are looking to upgrade their education and impact their students and society. Project Busara seeks scholarship support for students living and teaching in Kibera to join the Early Childhood Development Education.
I&M Bank Donates Towards Afya Elimu Health FundIn 2016, I&M Bank participated in the launch of the Afya Elimu health fund which is a public private partnership led by USAID, the Ministry of Health and the Kenya Healthcare Federation to support the training fees for needy students in medical training colleges in Kenya.
The bank has been one of the main sponsors of the Afya Elimu Fund since 2014 and is committed to supporting this project through 2019. The fund has benefitted a total of 9,278 students with 1,219 having graduated and 144 having joined the health workforce, therefore contributing to health service delivery.
Peter Tum, Director KMTC (first left), Charles Ringera CEO HELB (second left) and Prof Philip Kaloki Chairman KMTC ( third left) receive I&M Bank’s donation to the Afya Elimu Health Fund from Joy Namasaka, Chair, I&M Bank, CSR (right), during the launch event.

V i b r a n t C o l o r s o f G r o w t h V i b r a n t C o l o r s o f G r o w t h
I&M Holdings Limited Annual Report and Financial Statements | 2016 I&M Holdings Limited Annual Report and Financial Statements | 2016
118 119
I&M CSR NEWS (Continued) I&M KENYA CSR (Continued)
ENVIRONMENT
I&M Bank Funds Kibagare River RehabilitationIn 2016, the bank embarked on an initiative aimed at building sustainable environments that we believe will play a significant role in improving livelihoods of society.
I&M Bank Kenya through I&M Realty funded a strategy forum aimed at restoring and rehabilitating the Kibagare River and City Park in Nairobi. The research was conducted by Revive Consulting Solutions and was championed by Friends of City Park under the Nature Kenya initiative. Data results from the forum will inform a conceptual design for the most natural and financially sustainable solutions to restore the river. Shameer Patel (Centre) General Manager at I&M Bank and
Christine Aludo (Right) Marketing Manager at I&M Bank, present a representation of a report on findings of the survey aimed at restoring and rehabilitating the Kibagare River in City Park, to Patrick Analo (Left) of the Nairobi County Government.
HEALTHThrough the health pillar, the bank has been working with various health-related institutions to support quality healthcare systems. This aligns to UN’s Sustainable Development Goal Number 3 of good health and well-being. In 2016, the bank supported different health initiatives at a cost of over KShs. 12 million.
Below are some of these initiatives:
I&M Bank donates towards Beyond Zero CampaignIn 2016, I&M Bank donated a fully kitted mobile clinic for the Beyond Zero campaign to Her Excellency the First Lady of Kenya, Mrs. Margaret Kenyatta for the Trans-Nzoia County.
The Beyond Zero campaign has significantly contributed towards HIV control and promotion and child of maternal healthcare in Kenya since its inception.
The mobile clinic handover is reflective of I&M Bank’s commitment to deliver quality financial solutions that empower Kenyans to better improve their livelihoods, therefore enabling them to afford high quality health care, and in turn mitigating mortality rates.
Prior to this, I&M Bank sponsored the First Lady Half Marathon in March 2016 in its effort to also support the Beyond Zero Campaign.
The I&M Bank team pose for a photo with Her Excellency, the First Lady of Kenya, Mrs. Margaret Kenyatta after presenting the mobile clinic donated towards the Beyond Zero Campaign.
Her Excellency the First Lady of Kenya, Mrs. Margaret Kenyatta views the mobile clinic flanked by Kihara Maina, CEO, I&M Bank, Kenya and Directors - Eric Kimani and Sachit Raja Shah.
I&M CSR NEWS (Continued) I&M KENYA CSR (Continued)
HEALTH
I&M Bank offer two-day free medical services to the residents of Kibagare slumsOver 8,000 Kibagare slum residents benefitted from a two day medical camp organized by the bank’s CSR team. The event that cost approximately KShs. 2.4 million recorded the highest attendance of beneficiaries since the inaugural medical camp held in 2014. A team of 35 doctors were able to attend to various medical needs of the residents such as screening for ailments such as Hypertension, Diabetes, Ulcers, and Cancer among other conditions.
The bank, through the CSR health pillar has identified various social determinants of health that widen the gap between ill health and socio-economic growth; and has come up with activities aimed at mitigating these determinants; among them the annual medical camp. The bank has also been supporting needy children from the Kibagare slums and the neighboring areas, through a monthly feeding programme.
I&M Bank Head of Business Development, L A Sivaramakrishnan with a patient at the Medical Camp.
A medic attends to a patient during the Medical Camp.
I&M Bank Conducts Annual Blood Drive I&M Bank annual blood drive happened in June 2016 in various parts of the country. The event coincided with the World Health Organization (WHO) Blood Donation Day, which serves to raise awareness of the need for safe blood and blood products, and to thank blood donors for their voluntary, life-saving gifts of blood. The event themed on “Blood Connects us all was successful with over 500 pints collected. This included
COMMUNITY SERVICEI&M Bank Kenya staff members continued to donate their time towards supporting various Community Service initiatives that I&M Bank focuses on.
New Life Home TrustThe bank in 2016 continued to support the New Life Home Trust organization through a donation of approximately KShs. 400,000, to support the home in providing a safety net for abandoned or orphaned from HIV/AIDS.
St. Martin’s Kibagare School Feeding ProgrammeI&M Bank in 2016 continued to support the St. Martin’s Center in Kibagare by funding the monthly feeding programme that benefits children from the nearby slum. The bank spent over KShs. 700,000 towards this initiative. The home is run by the Assumption Sisters of Nairobi.
I&M Bank T-Shirt Donation DriveI&M Bank staff members supported the Operation Karibu campaign run by the Micro Clinic Initiative, a non-profit organization, whose mission is to make pregnancy and childbirth safe for every mother. Through research, the organization discovered that one of the reasons many women in rural Kenya were not delivering their babies in local clinics, was that they did not have clothes to dress their newborns after birth.
Through the Operation Karibu campaign, the Micro Clinic Initiative organization offers baby clothes, safe delivery, emergency transportation, and birth preparation and care training to thousands of mothers in rural Kenya. I&M Bank staff members therefore donated t-shirts to support these needs.

V i b r a n t C o l o r s o f G r o w t h V i b r a n t C o l o r s o f G r o w t h
I&M Holdings Limited Annual Report and Financial Statements | 2016 I&M Holdings Limited Annual Report and Financial Statements | 2016
120 121
I&M CSR NEWS (Continued) I&M TANZANIA CSR
HEALTH
Donation to Jakaya Kikwete Cardiac InstituteThe bank contributed TZS 33,000,000 towards surgeries for children suffering from heart ailments in coordination with BAPS Charities. It was identified that about 500 children suffering from heart conditions are in dire need of surgery at different levels and are unable to afford such expensive treatments. The bank managed to treat 15 children and inevitably changed their lives.
I&M Bank (T) Limited Staff members present dummy cheque to the Jakaya Kikwete Cardiac Institute.
COMMUNITY SERVICE
Donation to Kagera Earthquake VictimsThe bank contributed 390 blankets to victims of the Kagera earthquake that took place on 10th September 2016. Our Moshi Branch handed over the blankets to the Regional Commissioner Office, Kilimanjaro Region who then distributed the blankets to the Kagera victims.
I&M Bank (T) Limited Staff members presenting donations to the beneficiaries.
I&M CSR NEWS (Continued) I&M RWANDA CSR
COMMUNITY SERVICE
I&M Bank Rwanda Participates In Kwibuka 22Last year, I&M Bank Rwanda joined Rwandans around the globe in commemorating the 1994 genocide. The day’s events started with a trip to Musamira in Kamonyi, Muhanga province where a team of 40 members of staff led by the Managing Director Mr. Robin Bairstow, participated in renovating Virginie Mukarubega’s home, who is an 80 old widow and survivor of the genocide. Since 2014, I&M Bank Rwanda through its partnership with Aegis Trust Rwanda continues to fulfill its commitment to honor the memory of the victims of the 1994 Genocide against the Tutsi, help survivors rebuild their lives, as well as contribute to the prevention of future conflict through education and confronting the prejudices and beliefs that lead to genocide. The 22nd commemoration was also a time for the bank to pay tribute to its former staff members who were victims of the genocide.
I&M Bank Rwanda, Managing Director, Robin Bairstow, laying a wreath at the Kigali Genocide Memorial.
I&M Bank Rwanda Staff painting Viriginie Mukarubega’s house.
HEALTH AND WELFARE
I&M Bank Rwanda conducts Cancer Awareness InitiativesI&M Bank Rwanda covered medical insurance for 300 vulnerable individuals in Musanze districts. In addition to this, the bank’s staff members participated in the Ulinzi Breast Cancer Awareness Walk which is held annually.
The bank further participated in Umuganda, a nationwide community clean-up day held every last Saturday of each month, with Rwanda Children’s Cancer relief to advocate for cancer awareness.
Staff at Umuganda with the Rwanda Children’s Cancer Relief team.
I&M Bank Supports Gira Inka Government InitiativeIn 2016, I&M Bank Rwanda contributed to the Gira Inka government Initiative, which supports some of the poorest and vulnerable families in Rwanda to attain financial stability and reclaim their dignity.

V i b r a n t C o l o r s o f G r o w t h V i b r a n t C o l o r s o f G r o w t h
I&M Holdings Limited Annual Report and Financial Statements | 2016 I&M Holdings Limited Annual Report and Financial Statements | 2016
122 123
I&M CSR NEWS (Continued) BANK ONE CSR
Bank One continues to adhere to its commitment towards contributing to economic development, while improving the quality of life of the local community and the society at large through its CARE programme. In 2016, the bank reinforced its CSR engagements towards the Vacoas community and has now embarked in making a difference to the families under its partnership with Caritas of the Vacoas Region.
Through ongoing efforts, the bank not only complies with the legal framework, but also aims at making an economic, social and ecological contribution to building a sustainable society.
The various activities conducted under the CARE programme in 2016 included:
POVERTY ALLEVIATIONIn line with Bank One’s principal objective of poverty alleviation, the bank set a threshold of Rs 6,000 as monthly average income for a family to be eligible to benefit from the Bank One CARE programme.
The bank embarked on various community service initiatives to achieve this objective as follows:
COMMUNITY SERVICE AT VACOAS In partnership with the Caritas organization, Bank One conducted the following activities:
School feeding project for 100 childrenBank One funded a school feeding project that was initiated after Caritas identified increasing level of absenteeism due to lack of a nutritious meal scheme for the children in school. This project was in pilot phase in 2015 and turned out to be a big success. The number of children increased from 48 in 2015 to 100 in 2016 as the bank embarked to fund the programme fully. In addition, the bank donated school uniform and learning materials for the school children.
Life skills Management and Literacy Programmes Bank One continued to support the Life skills Management Programme in 2016. The programme aims at providing the necessary support and training to encourage the families to build their confidence and face the challenges of finding jobs and becoming self-reliant in the future.
Over 50 people have been trained under this programme. In addition to the life skills management programme, Bank One conducted a literacy programme for children who faced difficulties in fully adapting to the classroom learning process.
F. Ojiambo, MBS, S.C. | P. Hime | O. Fowler | S. Wainaina | N. Shaw | P. Gachuhi | R. Mbai | B. Shah | N. Malik | E. Kinyenje | C. Wetende M. Acharya | J. Muthui | A. Grewal-Thethy | P. Ikimire | K. Kamaitha | P. Njeru | S. Kiarie-Muia | N. Manga | R. Kirunga | C. Etyang | J. Ng’ang’ira
Member of LEX AFRICA
www.lexafrica.com
KNK/VNM/HO/139/1 21 April 2017
I&M Holdings Limited Notice of the Annual General Meeting
Notice is hereby given that the Sixty Fifth Annual General Meeting of the shareholders of I& M Holdings Limited will be held at The Sarova Panafric Hotel, Nairobi, on Thursday 25th May, 2017 at 10.00a.m for the following purposes.
A: ORDINARY BUSINESS 1. To receive the Group’s audited financial statements for the year ended 31st December, 2016 together with the Chairman’s, Directors’
and Auditors’ reports thereon.
2. To approve the Directors’ remuneration as provided in the accounts for the year ended 31st December, 2016.
3. To approve payment of a first and final dividend of KShs 3.50 per share amounting to KShs 1,446,918,792 for the year ended 31 December 2016. A dividend of Kshs 3.50 per share amounting to KShs 1,373,267,137 in respect of the year ended 31 December 2015 was paid on the 23 May 2016.
The dividend will be paid to the shareholders in the Company’s Register of Members at the close of business on 5th May 2017 and will be paid on or around 25th May 2017.
4. To re-elect Directors: (i) In accordance with Article No. 112 of the Company’s Articles of Association, Mr. Daniel Ndonye, retires by rotation and being
eligible offers himself for re-election. (ii) In accordance with Article No. 112 of the Company’s Articles of Association, Mr. Michael Turner, retires by rotation and being
eligible offers himself for re-election.
5. Pursuant to the provisions of Section 769 of the Companies Act 2015, Mr. Daniel Ndonye, Mr. Sarit S Raja Shah and Mr. Michael Turner, being members of the Board Audit and Risk Management Committee, be elected to continue to serve as Members of this Committee.
6. To note the resignation of Mr. Damien Braud as a director of the Company with effect from 30th September 2016.
7. To note that the auditors Messrs. KPMG Kenya Certified Public Accountants (K), having expressed their willingness, continue in
office in accordance with section 721 (2) of the Companies Act 2015 and to authorize the Directors to fix their remuneration for the ensuing financial year.
B: SPECIAL BUSINESS 8. To consider and, if though fit, to pass the following resolution as a Special Resolution;
Change of Company Name
THAT the name of the Company be and is hereby changed from “I&M Holdings Limited” to “I&M Holdings Plc” with effect from the date to be set out in the Certificate of Change of Name to be issued in that regard by the Registrar of Companies”. By Order of the Board
Virginia Ndunge Company Secretary P.O Box 40111 -00100 GPO Nairobi 21st April, 2017 Note: A member entitled to attend and vote is entitled to appoint a proxy to attend and vote on his/her behalf and such a proxy need not be a member of the Company. To be valid, proxy forms must be deposited at the Registered Office of the Company or send to the Company Secretary not less than 48 hours before the appointed time of the meeting.
Advocates Kaplan&Stratton Williamson House
4th Avenue Ngong P.O. Box 40111 - 00100 Nairobi, Kenya www.kaplanstratton.com Email: [email protected] VAT No. 0011219D | PIN. P000615541S
T: (0) 20 2841000 (0) 20 2733919 M: (0) 722 205782/3 (0) 733 699012/3 Intl. Code: +254 DZ: No. 19
YOUR REFERENCE: OUR REFERENCE: DATE:
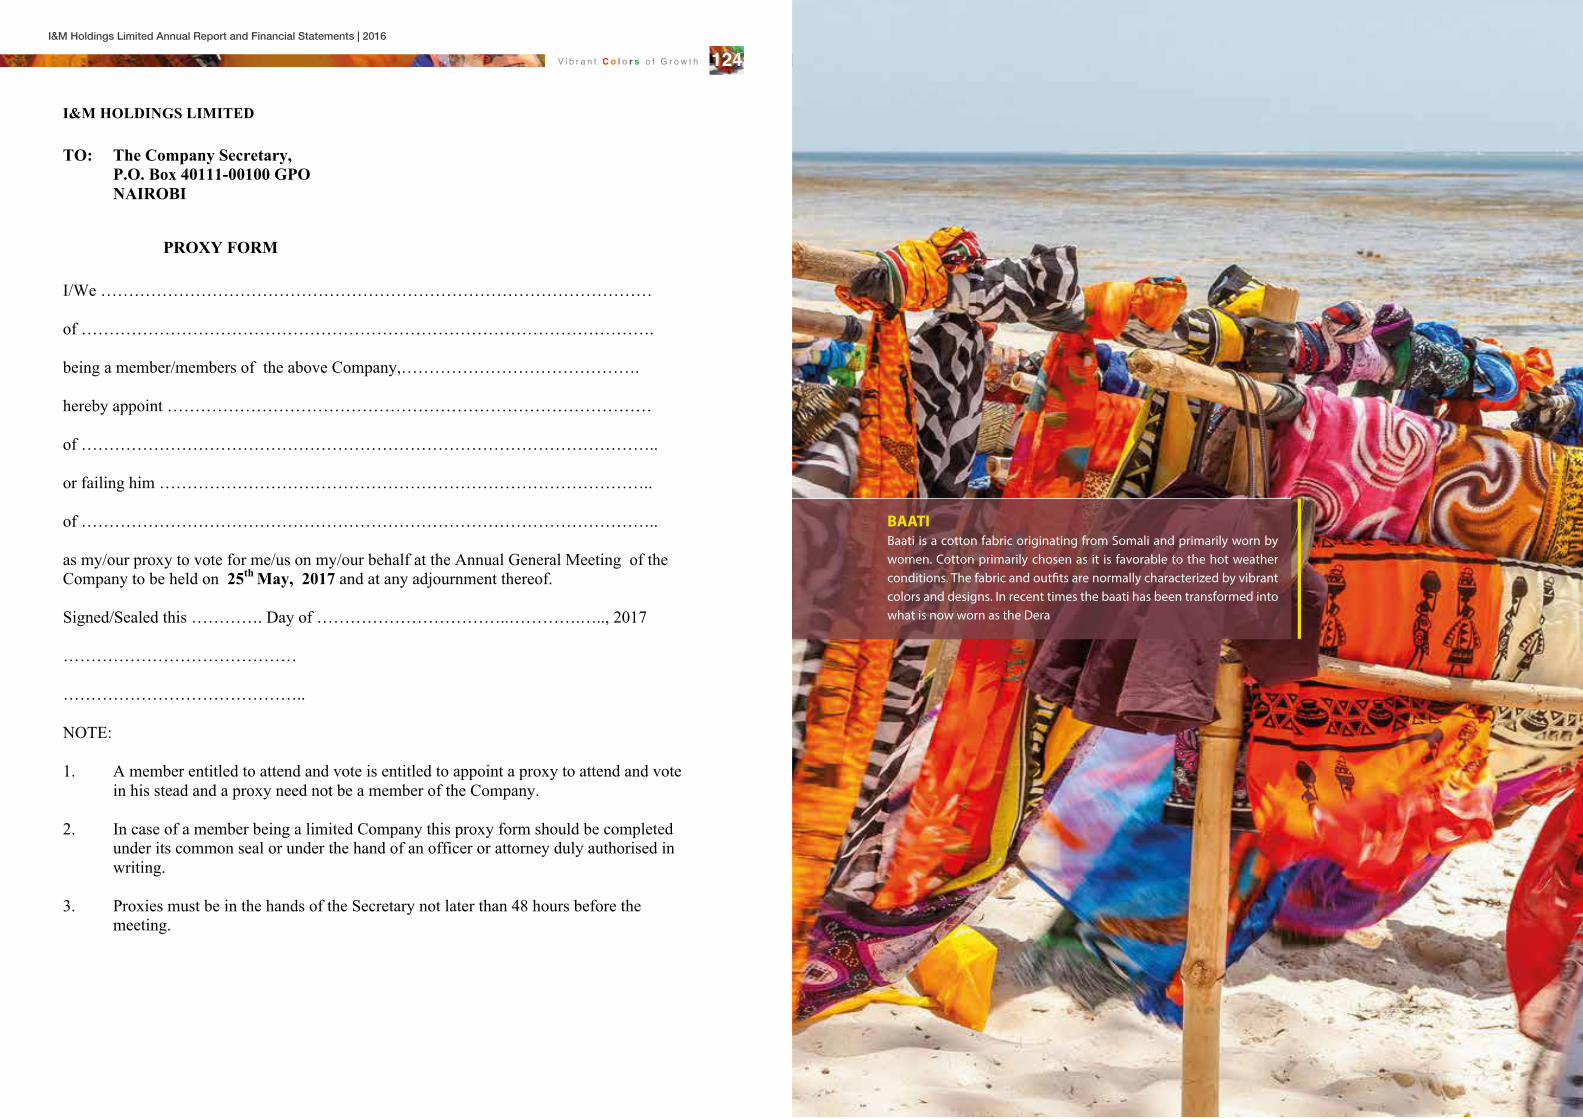
V i b r a n t C o l o r s o f G r o w t h V i b r a n t C o l o r s o f G r o w t h
I&M Holdings Limited Annual Report and Financial Statements | 2016 I&M Holdings Limited Annual Report and Financial Statements | 2016
124 125
I&M HOLDINGS LIMITED TO: The Company Secretary, P.O. Box 40111-00100 GPO
NAIROBI
PROXY FORM I/We ……………………………………………………………………………………… of …………………………………………………………………………………………. being a member/members of the above Company,……………………………………. hereby appoint …………………………………………………………………………… of ………………………………………………………………………………………….. or failing him …………………………………………………………………………….. of ………………………………………………………………………………………….. as my/our proxy to vote for me/us on my/our behalf at the Annual General Meeting of the Company to be held on 25th May, 2017 and at any adjournment thereof. Signed/Sealed this …………. Day of ……………………………..………….….., 2017 …………………………………… …………………………………….. NOTE: 1. A member entitled to attend and vote is entitled to appoint a proxy to attend and vote in his stead and a proxy need not be a member of the Company. 2. In case of a member being a limited Company this proxy form should be completed under its common seal or under the hand of an officer or attorney duly authorised in writing. 3. Proxies must be in the hands of the Secretary not later than 48 hours before the meeting.
BAATIBaati is a cotton fabric originating from Somali and primarily worn by women. Cotton primarily chosen as it is favorable to the hot weather
colors and designs. In recent times the baati has been transformed into what is now worn as the Dera

V i b r a n t C o l o r s o f G r o w t h
I&M Holdings Limited Annual Report and Financial Statements | 2016
126
www.imbank.com